
Abstract
There are widely differing experiences and practices in the development of indicators to monitor, report and communicate progress towards the implementation of the circular economy (CE). We present a framework for developing CE indicators which link to the core goals, principles and building blocks of a CE. To do this we utilise the Ellen MacArthur Foundation butterfly model as a coherent systems overview of key material stocks and flows, and representation of relationships between inputs, outputs, recovery processes, emissions, energy and value loops in physical and financial measures which constitute the CE supply chain. Based on nine multinational organisations and four cases of leading companies engaged with CE activity, we address the types of indicators being used and make recommendations for indicators to reflect key goals and principles of CE. Our research on the development and expansion of circular practices leads to the question of what new opportunities and challenges CE raises for such companies in terms of competitive business advantage and resultant requirements for supply chain redesign and indicator development, over and above pre-existing closed-loop production.
1. Introduction
This paper examines the indicators of circular economy (CE) in terms of how they are used by large multinational organisations in transitioning from sustainable or ‘eco-efficient’ conventional supply chain operations, towards a regenerative and circular system. Although indicators are discussed to a degree in the literature, the concept is not fully developed or applied in a consistent way, with several authors proposing further work is needed in this area (Ghisellini, Cialani, and Ulgiati Citation2016; Genovese et al. Citation2015). The metrics used in sustainability as part of the language of waste reduction are now inadequate for the systemic shift needed towards CE (Geng, Sarkis, and Ulgiati Citation2016), where there is a need for significant change in how firms measure their business activity.
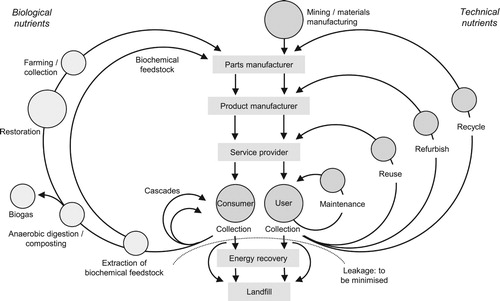
The term ‘CE’ has a long history, multiple definitions and distinctive developments in different global contexts (Webster Citation2013; Lieder and Rashid Citation2016). In Europe and increasingly other global regions the CE framework, originally devised and developed in the UK by the Ellen MacArthur Foundation (EMF Citation2012, Citation2013, Citation2014, Citation2016), has been a catalyst at European policy level (Stahel Citation2010; Webster Citation2014) and has become influential across business circles. A key reason for the popularity of this framework, sometimes referred to as the butterfly diagram (Figure ), is that it aligns a compelling business rationale with the need to decouple wealth creation from the consumption of finite resources. Proponents of this characterisation of a CE have argued that there is a business opportunity and advantage from circular business models when compared to traditional sales-ownership-disposal models (e.g. EMF Citation2012, Citation2016; Webster Citation2014). Closed-loop business models such as remanufacturing and asset reuse have long been of interest to academic researchers and practitioners and been reported previously including optimal pricing strategies, branding and segmentation, cannibalisation issues, feedstock challenges, consumer acceptance, reverse supply chain design and how often to remanufacture (Guide Citation2000; Savaskan, Bhattacharya, and Van Wassenhove Citation2004). The extent to which these closed-loop models capture the full extent of CE principles has recently been debated (Mishra, Hopkinson, and Tidridge Citation2018). A number of leading companies are now showing interest in the extension and expansion of circular practices, leading to the question of what new opportunities and challenges CE raises for such companies in terms of competitive and collaborative business advantage and resultant requirements for supply chain redesign and indicator development, over and above pre-existing closed-loop production practices.
Figure 1. A CE characterisation (adapted: EMF Citation2012).
This paper contributes to the literature by reviewing and analysing the engagement of a number of high profile global companies who form part of the global partnership base for the EMF. These companies do not promote themselves as leaders in CE practices, but form a significant group of companies to investigate current and future practices in the development of CE indicators. Our paper therefore addresses three critical questions:
What are the founding principles and concepts of CE, and what are the implications for developing indicators?
How far does the literature and real-world practice reflect or capture the ambition and goals of CE implementation?
What are the biggest challenges and key requirements for further development of CE indicators?
The paper is structured as follows: Section 2 presents the idea of a CE, the background to CE indicators, and their dimensions in the literature. Section 3 presents the methods in terms of an abductive approach to case research. Section 4 discusses the empirical data through analysis of company reports and case studies to develop a framework of CE indicators. Section 5 concludes with contributions, and recommendations for further research.
2. Literature review
We divide the literature review into three sections, starting with defining the idea of a CE. Then the background to performance measurement is introduced, including traditional sustainable metrics and the concept of indicators. Lastly, emerging dimensions of CE research and indicators used in recent studies are explored, which are developed further in our analysis of the empirical data.
To ground our investigation in the literature, a systematic review was conducted with the Web of Science online database using search terms including ‘CE’, ‘CE indicators’ and ‘CE performance indicators’. A total of 205 hits were initially returned which, when conference papers, reports and editorials were excluded, left 145 peer review articles for further analysis. These articles were examined for how CE indicators, measures or metrics were presented in terms of their specific research context. Our review reveals that the first papers on the subject emerge in 2009 (although examples of single closed-loop industrial applications do occur earlier, see for example Zeeman and Lettinga Citation1999), with the number rising steadily each year to 64 new papers in 2016, and 77 in 2017.
2.1. The idea of a CE
The exact origins of the term CE are debateable (e.g. Stahel Citation2010; Ghisellini, Cialani, and Ulgiati Citation2016), although its emergence as a widely used term in policy, business and academic circles is inarguable. As an emerging idea, CE has been described as an ‘umbrella concept’ (Blomsma and Brennan Citation2017) which, for some, has come to be associated with the development of waste and resource management, increased resource productivity and new business models. In this paper, we adopt an overarching systems perspective that a CE aims to upgrade the linear take-make-dispose economy to one that is ‘regenerative by design’ (EMF Citation2012). The potential implications of this perspective for production and operations are wide-reaching and potentially radical. The recent literature on CE has presented various ways of describing or classifying the value creation and capture from CE value chains (Bocken, Ritala, and Huotari Citation2017; Geissdoerfer et al. Citation2017). However, many papers and classification frameworks are often defined in isolation from the CE as a systems perspective and hence run the risk of generating ever more approaches and indicators that fail to demonstrate their contribution to the wider goals of a CE. In this paper, we revert to the butterfly diagram from the work of EMF (Citation2012), which has been a catalyst in much of the recent business, policy and academic debate, and also forms a key part of the new British Standard 8001 Framework for implementing the principles of CE in organisations. This original diagram has been through a number of iterations and continues to evolve, but remains a coherent framework for emergent and evolving production and business operational practices.
The economic and business case for a CE is based on some overarching goals, concepts and principles. These include the distinction between two material cycles, referred to as technical and biological. In the technical sphere (right-hand side, Figure ) materials are durable, and in order to decouple their throughput from economic growth and manage resource depletion, it is necessary to preserve and distribute the embedded labour, energy, material and capital costs in higher forms of product and component integrity rather than discard at the end of first use. First, an existing product is resold to or shared with a new user with little or no rework (inner loop), achieved via performance business models and maintenance which maintains product, component and material usage or via re-commerce i.e. reuse or redistribution. Second, refurbishment and remanufacturing of components can create new or extend the usage of existing products i.e. longer loops. Third, recycling involves resources which are extracted from their most basic and most interchangeable form, by milling and re-melting metals into new metal feedstock (outer loop). In all cases, value depends on the ability to spot opportunities and then extract higher value from recovery, reusing and cascading assets including products, components and their materials at the end of a use phase or find value added from recycling. As an ideal, the growth of stocks of technical materials within products in the economy would stabilise or more realistically be radically slowed.
In the biological sphere (left-hand side, Figure ), materials are consumed in that the biological material loses its original integrity and material qualities, but can be cascaded to other activities and uses to create further value. For example, textile garments can provide fibres or material for other commercial uses, paper can be cascaded a number of times before the fibres lengths become too short, but even then it can be composted, assuming free from contamination or hazardous properties, and returned safely the biosphere. As ideal stocks of natural capital are regenerated and maintained. A further key principle is that energy is powered via renewable sources, leading to significant reductions in fossil fuel consumption and attendant GHG emissions.
Beyond descriptive case studies, it is difficult to find real-world cases or detailed business case analysis into how specific supply chain practices are enacted or production activities instituted to create, capture and distribute value (De Angelis, Howard, and Miemczyk Citation2018; Mishra, Hopkinson, and Tidridge Citation2018). It is argued that successful CE practices require the simultaneous configuration and deployment of four key building blocks: circular design, circular business model innovation, reverse network management and various system enablers, including new forms of innovation and collaboration across the value chain (Hopkinson et al. Citation2018). Focussing on one building block in isolation ignores the whole system perspective which is central to the CE and reduces the potential to create and capture value. Thus designing products with potentially excellent cradle-to-cradle qualities and characteristics but without the required business model or reverse networks in place means products can easily end up being discarded to landfill. This demands new guidance on developing CE indicators and measurement systems to be able to track and monitor their contribution to key principles and concepts of the CE: namely the regeneration, circulation and cascading of technical and biological materials within the two nutrient flows and waste products shown in Figure .
These circulation flows can be via a closed loop or open loops. The term ‘closed loop’ has created some confusion in CE literature and criticised for being impossible due to the second law of thermodynamicsFootnote1 (Gregson et al. Citation2015; Murray, Skene, and Haynes Citation2017). Whilst the term ‘circular’ suggests a closed loop, and early influential research referred to ‘closing loops’ (e.g. Zhu, Sarkis, and Lai Citation2008; Guide and Van Wassenhove Citation2009), this usually means a product and its materials return to the original manufacturer or producer. Yet the CE in Figure is not defined or characterised as a closed system, and whilst CE seeks to circulate and cascade products and materials, it is not a prerequisite that this has to be performed by the original producer or manufacturer and can be circulated via open loops. It does mean, however, that if industrial production and operations are designed to be regenerative and restorative by intent, then this requires a systems perspective. Hence the implications for production and supply chain design and the validity of circular indicator constructs are complex and go beyond what is suggested for sustainable supply chain management (e.g. Ahi and Searcy Citation2015). The following section now addresses the current state of the literature on indicators for the CE.
2.2. Performance indicators, metrics and the CE
Across all business activity, indicators are used by organisations to support overall strategy and to show progress towards strategic objectives (Kaplan and Norton Citation1995). Many business level indicators are publicly available through annual financial reports to keep stakeholders appraised of business performance, but indicators also provide internal support for more operational objectives (Neely, Gregory, and Platts Citation1995). Indicators often support financial objectives such as return on investment or working capital while others may reflect operational goals such as stock turnover, lead-times, service levels or quality (Neely Citation2005). However, the recent development of strategies relating to sustainability has also led to the development of indicators that are non-economic in nature covering a company’s intentions with regard to social and environmental issues, driven by accountability and transparency imperatives (Keeble, Topiol, and Berkeley Citation2003). These types of indicators may reflect social or human resource needs such as health and safety goals of zero accidents or environmental targets like reduced greenhouse gas emissions (Searcy Citation2012). Indicators that are reported publicly for accountability reasons often follow the Global Reporting Initiative approach and thus have become relatively standardised and in some cases, companies have adapted sustainable development goals in line with United Nations imperatives on sustainable development (Searcy Citation2009).
Companies are viewed as no more competitive than their supply chains and as such can also view strategic objectives at the supply chain level, both upstream and downstream (Christopher Citation1996). This external scope of indicators can again be reflected in the financial and operational goals as above (Gunasekaran and Kobu Citation2007), but again increasingly include sustainability dimensions (Hassini, Surti, and Searcy Citation2012; Miemczyk, Johnsen, and Macquet Citation2012). On the social side, this might include targets on auditing suppliers and aims for high compliance levels on social policies (Hutchins and Sutherland Citation2008). The environmental dimension can range from product-related indicators such as recycled material content or lifecycle emissions, through to site-based metrics such as meeting compliance minimums (Ahi and Searcy Citation2015). The issue of classifying sustainable or green supply chain metrics was also taken up by Ahi and Searcy (Citation2015) using a classification of 13 dimensions of sustainable supply chain management which covered the following: Environmental, Social, Economic, Volunteer, Resilience, Long term, Stakeholder, Flow, Coordination, Relationship, Value, Efficiency and Performance. In addition, the metrics were classed as quantitative, qualitative, absolute, relative or context-based. The main conclusion was that there is a vast array of metrics used, but companies should cover the 13 dimensions and consider the whole supply chain. These types of indicators can be relevant here given the scope of the CE whereby a network of organisations aim to reduce overall environmental impacts, but are limited to the supply chain scope. Although lifecycle analysis does provide a wide scope from raw material use to final disposal, this is a design tool and is not used to provide operational indicators to support continuous operational performance improvement (Seuring Citation2004).
Although indicators and performance measurement are well developed in the sustainability literature, there is relatively little research into indicators that explicitly support CE objectives. This is because of the ambiguity surrounding terms such as ‘sustainable’ and ‘circular’ in current literature, compounded by basic misunderstandings around the association of closed-loop design as synonymous with CE, highlighted in the section above. Current research on CE indicators tends to focus on the national or regional level, and is often from a Chinese perspective (Ghisellini, Cialani, and Ulgiati Citation2016). Examples include reduction, reuse, resource utilisation, human habitat and social indices – at a national level (Zhijun and Nailing Citation2007), or resource output and input rates, resource utilisation rates and waste and pollutant emissions (Geng et al. Citation2012). We argue there is no empirical evidence from practice that these indicators represent CE as defined in this paper, and are essentially resource efficiency or pollution indicators which although relevant, do not deal with the fundamental issues of value or the full system perspective. Hence, there is a shortfall in our understanding, where further research is needed into identifying specific business level CE indicators.
2.3. Dimensions of CE indicator research
Despite the fragmented and disjointed nature of work to date on CE indicators, a number of initial patterns or dimensions do emerge from the literature. The first and most common dimension is the level of analysis (i.e. micro, meso, macro) used in CE-based research to focus on cases of specific materials such as paper, aluminium or glass (e.g. Haupt, Vadenbo, and Hellweg Citation2017), or industry sector such as mining, timber or automotive (Augustsson et al. Citation2017; Lèbre, Corder, and Golev Citation2017; Richa, Babbitt, and Gaustad Citation2017). Some studies are presented by geographic region, either focusing on one or more countries, or adopting an intercontinental scope by comparing the differences in CE practice and policy between China and Europe (McDowall et al. Citation2017). In common with many of the articles we examined, while the meaning and focus of CE clearly differ between these two regions, neither includes explicit indicators for the CE. For example, the EU 2015 action plan refers to resource efficiency and a raw materials scoreboard, with Chinese indicators including a broad range of sustainability-based targets, such as pollution emission and abatement indicators, and prominent coverage of water.
The second dimension is ‘input–output’ meaning the tendency for studies to adopt an efficiency-based paradigm to examine the flow of raw materials typically from the beginning and end of production. This is most noticeable in terms of the ‘inefficiencies’ detected by Zhou et al. (Citation2017) in the conversion to materials or energy, and levels of hazardous waste produced by industry such as waste water, toxins and emissions (Augustsson et al. Citation2017; Lèbre, Corder, and Golev Citation2017). Studies which use conventional environmental management methods such as product lifecycle or material flow analysis also seem prone to reflecting the more linear aspects of production in terms of waste management, rather than develop circular indicators which reconfigure the process from supply through production to consumption as a series of cascaded loops (EMF Citation2013). While some articles do recognise the significance of closed loops and elements such as reduce, reuse and recycle (e.g. Parajuly and Wenzel Citation2017; Dong et al. Citation2017), they often revert in their evaluations to using the terminology of waste and pollution reduction as the prime source of benefit and economic profit. Such approaches can easily miss the goal of CE as regenerative and self-sustaining through redesign of the core product, delivery network and distribution systems.
Resource utilisation intensity describes how public and private organisations and NGOs redesign the use of their product, process and facility to tackle issues of increasing resource scarcity (Gregson et al. Citation2015; Pan et al. Citation2015). The recognition that organisations must maximise the use of resources and equipment is an emerging aspect of CE, which heralds new working patterns between supplier, producer and consumer. Such resource utilisation implies sharing of spare capacity or assets for set periods of time on defined terms where the producer retains ownership (Zeeman and Lettinga Citation1999). Collaboration is needed not only in the co-development of CE enabling technology, but in understanding the shift in customer-buyer-supplier relationships, where the provision of feedstock (e.g. human or animal waste) becomes an increasingly valued commodity in the running of such facilities (e.g. anaerobic digester plants). One case of municipal solid waste being turned into urea – used in the production of chemicals – represents an example of local industry and regional government working together to use an abundant, bio-based feedstock to improve economics in the area by ‘moving towards a CE at a regional level’ (Antonetti et al. Citation2017, 912). Despite longstanding calls for more interdisciplinary cooperation in strategic implementation, Antonetti et al., call for a revised definition of CE around maximising ecosystem functioning. Hence, increasing asset utilisation or ‘resource use intensity’ (Geng et al. Citation2012) suggests links with the wider sharing economy as well as CE, and will likely be identified as a CE indicator.
Longevity and durability is illustrated in the literature through examples of product redesign resulting in longer product lifespans and extended periods of use, which prevents waste from occurring in the first place (Esbensen and Velis Citation2016; Elia, Gnoni, and Tornese Citation2017). This approach allows resources to be kept within the economy when products no longer serve their original function, meaning materials can also be used again: defined as the percentage of stressed resources incorporated in a product that is returned after its end-of-life (Di Maio et al. Citation2017). Despite activities such as reuse, repair and recycling becoming crucial to increase the life and durability of products in many sectors, deep research on CE assessment and indicators is still lacking (Elia, Gnoni, and Tornese Citation2017). Comparing the global effectiveness of some of the most widespread environmental assessment methodologies, Elia et al. present indicators based on the application of CE strategies, namely: reduced input of natural resources, emissions and material loss, an increased share of renewable resources, and durability of products.
Finally, the dimension of value is arguably of most significance, referring to longer and tighter loops from maintenance and servitisation activities which drive value creation in the CE (EMF Citation2012, Citation2013, Citation2014). Extending product life through value-adding services is commonly associated with CE, yet the assumption that products can be treated as stable platforms for the delivery of services is questioned by Spring and Araujo (Citation2017). They argue that products are chronically unstable, both physically and institutionally, requiring considerable effort to temporarily stabilise and qualify products for exchange or servitisation. Traditionally the term value is used in a business context to describe ‘value adding’ (i.e. from the perspective of the customer), or ‘co-creating value’ (i.e. between organisations). Adopting the term in the CE means potential revenue, profit and margin can be assigned to byproduct or emissions previously considered as production waste (Zhou et al. Citation2017; Cong, Zhao, and Sutherland Citation2017). Hence, the escape of emissions, energy or water from any process becomes ‘value loss’ (Zhou et al. Citation2017), and effort towards maximising the utility and lifecycle of materials becomes central to ‘increasing value’ within the system (Cong, Zhao, and Sutherland Citation2017; Elia, Gnoni, and Tornese Citation2017). One of the few examples of developing a value-related indicator is based on the value of non-sustainable or ‘stressed’ output, or value-add of the industry sector (Di Maio et al. Citation2017). These dimensions of CE indicator research in the literature are summarised in Table .
Table 1. Dimensions of CE indicator research in the literature.
3. Method
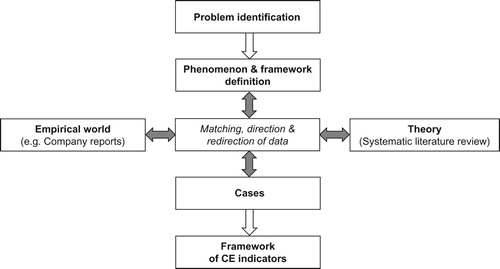
We adopt an abductive approach in our research i.e. neither inductive nor deductive, which starts with a problem or phenomenon based on an incomplete set of facts (Dubois and Gadde Citation2002; Kovács and Spens Citation2005). Abductive reasoning uses systematised creativity or intuition to develop ‘new’ knowledge and to break out of the limitations of induction and deduction (Pettigrew Citation1997) which both delimit the phenomenon under investigation (CE indicators), towards already established constructs such as sustainable supply chain management. The abductive research builds on a concept or idea using multiple sources of empirical and theoretical data as part of a data matching or ‘systematic combining’ process (Dubois and Gadde Citation2002). Figure illustrates our process of matching, directing and redirecting the multiple sources of data between the empirical world (company data), theory (literature review), phenomena (CE indicators) and cases. Abductive reasoning is most commonly used in conjunction with case study development, enabling the examination of plausible conclusions and whether the phenomenon may be related or not to generalisable rules or types of situations, thus providing new insights into the particularities of specific situations, experiences and settings (Dubois and Gadde Citation2002; Kovács and Spens Citation2005).
Figure 2. Abductive approach to case research (adapted: Dubois and Gadde Citation2002).
The investigation starts with an initial framework of CE dimensions defined by the literature as the basis on which to explore CE indicators in a real-world industrial context. As an emerging topic and little-known phenomenon (Yin Citation1994), we use examples of large multinational organisations, all of whom are beginning to explore CE and the significance of CE indicators in terms of their role both in internal operations and externally in terms of supplier development and stakeholder engagement. Hence we adopt a multiple case study approach (Eisenhardt Citation1989; Voss, Tsikriktsis, and Frohlich Citation2002; Eisenhardt and Graebner Citation2007), using abductive reasoning to develop our understanding of CE indicators. Our aim is to develop a framework of CE indicators which can be used in future research for quantitative modelling purposes.
The selection process for the companies involved in our study was conducted in two parts. First, we selected nine multinational organisations involved as EMF global partners whose data are publically available for analysis in the form of annual reports, as well as other information from the web. These organisations were chosen not just because they are in the ‘EMF CE100’ knowledge sharing group (some more CE active than others), but that they are at the forefront of the challenges of CE because of their scale. They are either in the process of developing, or actually using, circular indicators. The reports and websites include sustainability indicators as well CE-related indicators, and helped us begin our classification of CE indicators. Second, to enable us to refine our analysis and explore the indicators in a practitioner context, we selected four companies which represent different industry sectors (healthcare and customer lifestyle, automotive, food & drink, and DIY), materials (biological and technical) and products (durable, consumable) and relationship to customers (B2C and B2B). The interpretation of these cases and the conclusions drawn are made by the authors based on discussions with the companies at a variety of levels over the previous three years. We have avoided any commercially sensitive information but have retained the anonymity of the company.
Our results enabled us to compare each organisation with an overview of CE100 company reports, showing current key performance indicators (KPI) linked to CE (or sustainability in general, where CE is inferred but not named specifically), to show the degree to which CE indicators are publicly reported. This is based on classifying indices based on the key CE principles e.g. design, reduction, reuse, recycle, etc. from Ghisellini, Cialani, and Ulgiati (Citation2016) and others. Our unit of analysis therefore is the impact of CE indicators on the operation and supply chain.
4. Discussion and analysis
This section discusses the findings from the data collected from companies engaged in CE activities, before presenting a new framework. First, publicly available indicators are discussed from company reports, followed by four anonymous case descriptions of CE actions. A framework of CE indicators is then presented, based on an aggregation of empirical observation and current conceptualisations of CE literature.
4.1. Publicly reported indicators and the CE
Table provides a summary of the indicators that are publicly reported by the selected companies. An initial classification was made based on common indicators and additional rows were added for indicators that appear to relate to CE, but did not fit the common themes. An analysis of the latest company reports and public sources from the EMF global partners shows that while the majority of companies use traditional indicators for inputs such as energy and water, and outputs such as greenhouse gas emission, water and waste, there are a number of companies who are starting to use indicators that link to CE objectives in a clearer way linked to the building blocks in Table .
Table 2. Indicators from public company reports and company web-based sources.
The first observation from the company reports is the extensive use of lifecycle assessment to provide guidance on product design choices ranging from Nike, Renault, Unilever and Phillips, with their ‘Design for X’ criteria. Nike in particular has an innovative sustainability index for material, footwear and apparel products. Developed by Brown and Wilmanns consultants, the Nike Material Sustainability Index is partially based on lifecycle assessment, but only considers the ‘cradle to gate’ part of the cycle. The index covers chemistry, energy, greenhouse gas intensity, water and land use intensity and physical waste. It has also been the basis for the Sustainable Apparel Coalitions actions of the Higgs Material Sustainability Index, which is used by many apparel producers today. The extent to which lifecycle assessment captures and reflects the ‘regenerative by design’ goals of CE has been debated previously (Bjørn and Hauschild Citation2013) Moreover, some companies have found lifecycle assessment too expensive and detailed to deploy across their product portfolio, and have designed their own bespoke methods to support new value propositions and CE product design (Mishra, Hopkinson, and Tidridge Citation2018).
Second, the companies report on the amount of waste or percentage of waste recycled. Yet, there are some notable examples of operational CE indicators including H&M who report on the total number of garments collected and % of stores with recycling facilities. Nike also report on the % of water recycled, or reused in a closed-loop system as well as the % recycled polyester. Another operational indicator is presented by Kingfisher in reporting the number of their stock-keeping units with closed-loop credentials and products containing verified recycled wood or paper. Kingfisher go as far as stating the value and percentage sales of home products that are ‘best in class’ sustainability-wise (although no details on the benchmarks). These examples could reflect improvements in the reverse flow or logistics and even the business model, when the value of products is accounted for as in Kingfisher.
The third is the scope of these indicators that range from site-based, through to encompassing raw material to consumer usage inclusive and complete product lifecycle assessments. Examples include energy per tonne of product (Danone), to energy use across the value chain (Phillips) or even resource use per employee (Intesa). Interestingly, Unilever provide an indicator for water and waste ‘impact’ per customer normalised according to the type of product and typical usage such as washing hands or a load of laundry. This was developed from a 2012 study of water used in agricultural raw materials in countries with water scarcity. This was supplemented to water added to products in production and the eventual use of the product by consumers in water-scarce countries. The clear limitation of this is the source of data based on a 2012 study and does not consider the treatment of waste water. This highlights the need to ensure indicators and metrics are measuring across the complete multiple lifecycle, circulation loops and cascades of products, components and materials to reflect the goals of CE. This would include aspects of the use phase (i.e. Unilever’s approach) which might reflect the business model used such as shared assets or leasing.
However, many indicators such as the material sustainability indices in Table are based on assumptions of production processes across supply chains and are normalised to ‘average’ figures and are not always up-to-date. In reality, variability in production and supply chain processes can create variability in the operational indicators despite sensitivity analyses. It appears that there is a trade-off between the scope of indicators, and the ability to collect real-time operational data and report on it. Furthermore, indicators that explicitly target the impact of CE strategies such as leasing models or increased longevity are not published, at least in these publicly available sources.
4.2. Business perspectives on current actions of developing CE indicators
This section provides a current company perspective on the establishment of CE indicators relating to their wider CE goals. Supplementary interviews were undertaken with a variety of managerial sources from four companies, from which we briefly discuss how each company is enacting CE based on their key value drivers, and the role of indicators related to their CE operation and supply chain activities.
4.2.1. Company A
Company A is an international fast-moving consumer goods retailer and although it does not manufacture, given its size, has the ability to directly influence product design and supply chain decisions. The case company retails circa 400,000 products (SKUs). The group sources from 2167 critical suppliers, including 1028 factories and 1139 suppliers of own and exclusive brand products. The company strategy and commitment to CE are based on closed-loop innovation and selling products where nothing is wasted, from the initial design phase through the entire manufacturing process. The company has an ambition to create 1000 closed-loop products and 10 closed-loop supply chains by 2020. Internal project teams are empowered to identify and implement CE closed-loop product and supply chain innovation. To date, two supply chains and approximately 200 products have been redesigned.
The company regards CE as a new source of value creation which drives the innovation process to review its products, supply chains and production and operations. It seeks to improve the value proposition and commercially viable product/service combinations for their customers. The innovation process is driven by a bespoke assessment method described below and involves careful attention to the design of the product/service, the business model, reverse network management and various system enablers. Examples of successful products and supply chain redesign include designing and maintaining core assets, such as pallets, within the supply chain to maximise their longevity and utilisation, replacing non-renewable feedstocks with materials from a renewable source and creating new products form internal waste streams of from waste streams from new collaborating partners.
The process of developing a set of indicators focused on CE and closing loops involved reviewing and evaluating other methods such as Lifecycle assessment, Cradle2cradle and circularity indicators. Each was found to have merits and drawbacks. Some methods were found to be too complex, too expensive, not commercially focused, too black box or insufficiently agile to support innovation and adaptation across the number of products and suppliers as required.
The company has developed indicators to assess full product lifecycle impacts across both the technical or biological spheres of the butterfly diagram, including labour conditions and material health of all source materials, ethics, product design and business model consideration for recovery, cascade and reuse of materials, and an assessment of scope for further innovations and ability to close the loops either directly or with third-party collaborators. These indicators and the company commitment has resulted in major implications for production and operations including examples of replacing packaging materials from technical to biological, from virgin to recycled materials, sourcing materials from new countries of origin, creating new production processes, new product design. In addition, new forms of collaboration with tier 1 and 2 suppliers, exacting demands on supplier audit to ensure the integrity of assessment, new collaboration and challenges with downstream providers of collection and recovery infrastructure and an appreciation of continuing challenges with closing loops effectively and future implications of regulatory changes notably REACh regulations. The indicators continue to be developed as an internal team’s feedback learning from the process of applying the method in practice, and as supply chain redesign and product categorisation reveal new challenges. The company admits that the development of CE closed-loop supply chains and products is not straightforward, but is fully committed to developing methods which support a commercially driven, CE inspired business.
4.2.2. Company B
Company B is a diversified technology company, focused on innovation in the areas of healthcare, consumer lifestyle and lighting with over 100,000 employees and a turnover approximately €20 Billion, 111 manufacturing facilities, 59 R&D facilities across 26 countries, and sales & service operations in around 100 countries. Core products include consumer electronics and electrical products, healthcare products (e.g. scanning and monitoring equipment). The company has a long-standing medical device refurbishment programme, with revenues of €1.3 Billion, with 50% of market share in the USA and an historical growth rate of 6–8%, following an internal review of this and other circular opportunities which lead to the launch of a circular programme and becoming a global partner of EMF. The programme focuses on connecting with external stakeholders, internal employee engagement, creating proof points and metrics, and embedding circularity into its processes. The majority of the company’s core products and material flows operate within the technical cycle of the CE, notably plastics and electronic components.
The company is running a number of CE initiatives including reviewing its design rules to include new designs, ease of reparability, upgradeability and modularity, experimenting with performance-based business models and continuing to grow its refurbished systems business in healthcare, working on implementing similar models for remanufacturing, and parts harvesting in other businesses. It has historically utilised a wide set of operational indicators and targets from its sustainability programme including carbon neutral operations, 100% renewable energy, recycling operational waste and zero waste to landfill. Material and product indicators across the rest of the portfolio are strongly focussed on plastics, a key material by weight, value and lifecycle impact. All new products have a bill of materials with a known weight of plastic and type of recycled plastic.
In the past, Company B experimented with KPI on ‘green revenues’ defined primarily on sales from products with defined energy performance and standards. This experience laid the platform for the recent development introduction of a circular KPI, based on circular revenues. The company is committing to achieving 15% circular revenues by 2020 from a baseline set at 7% in 2015. Circular revenues refer to sales to customers in the following value loops: performance and access-based business models; refurbished, reconditioned and remanufactured products, systems and components; upgrades of hardware/software and products with over 25% recycled plastic content by total weight of plastic. Each of these product value loops has its own internal set of operational indicators, but the company recognised that to focus teams, strategy and communications and scaling up the CE business required setting targets, incentives and KPI linked to sales and revenues. The 15% figure is externally validated and now forms the next stage of development within the company.
4.2.3. Company C
Company C is a multinational automobile manufacturer producing a range of cars and vans, and has become the leader of electric vehicles sales in Europe. It manufactures across 36 production sites and over 10,000 and in 2016 had revenues of €51.2 billion and 125,000 employees. The company’s core products and operations operate within the technical cycle of the CE, but also include products derived from virgin and post-consumer biological fibres. The company recognises that the automobile industry lends itself to the CE, offering significant opportunities for reuse, remanufacturing and recycling throughout multiple use cycles.
The company’s stated CE strategy is committed to convening value chain partners to develop, pilot and validate circular value propositions and the development of metrics and industry-specific methodologies for capturing circular value. This requires that the company has oversight of all the impacts of its vehicles throughout their lives, from design and production to use and reverse network management. The shift to electric vehicles at scale and new business models, such as battery leasing, are essential parts of the shift in the focus of the business and has major implications for production and operations.
The company has a long history of recovery and remanufacture of parts which has been steadily growing and diversifying over the past 25 years. A dedicated facility now operates remanufacturing on demand, ensuring the engineering and production of six types of mechanisms exclusively for the repairing of vehicles currently in-use with a turnover of €100M employing 350 staff. The capabilities required for production and operations now extend to require a detailed, auditable bill of materials for each model of vehicle, with data on recycled material content to evaluate overall recycled material and product ratios. The company uses ‘IDIS2’, the International Dismantling Information System, which supplies pre-treatment and dismantling information relating to almost all of the world’s vehicles, developed in the 1990s to fulfil regulatory requirements concerning end-of-life vehicles. As an illustration, the company has established a joint venture for end-of-life vehicle treatment programme, which is comprised of a network of 320 vehicle dismantlers. In this scheme, every vehicle sent for disassembly is checked for parts marking, weight, assembly techniques and other factors which influence future eco-design before parts are either sold on or recycled.
Indicators are focused on key materials such as plastics and levels of recycled material inputs and outputs disaggregated by region, which has allowed the company to create local/regional objectives where the operations and production environment is entirely different and allows purchasing and engineering decisions to maximise performance effectiveness. Recycled plastics require new supply chain requirements, an ability to source, grade and track quality of materials. Objectives and indicators on operational scrap rates in the manufacturing plants now have a value assigned to them, creating new valued-added practices and processes. The company has now reached a point of operational and supply chain oversight to develop a new indicator to aggregate all activities in CE combining technical and economic value, to be released in 2018. This indicator is designed to capture all circular loops from new vehicles to component lifecycles, including lithium-ion batteries.
4.2.4. Company D
Company D is a global food-products corporation with sales of €21.9 billion in 2016, more than half in emerging countries. In 2015, fresh dairy products represented 50% of the group’s total sales, early life nutrition 22%, water 21% and medical nutrition 7%. The company operates across both the biological and technical cycles and impacts of production and operations on the protection and regeneration soil and water systems are a particular area of concern and focus. It is the world’s largest producer of yoghurt, has 120,000 dairy farmers supplying its milk, and supplies the market through five plants. Annually it creates 1 million tonnes of packaging: 65% plastics, of which 27% is from recycled materials and 8% from biomaterials. The company has a long track record in promoting and practising social progress, and has embraced CE as a means to step up their environmental and social goals. A new position has been created in the executive committee to supervise the internal units for three key Strategic Resources Cycles (milk, water, and plastics) to encourage cross-divisional and cross-functional working.
The company’s CE activities include increasing the design and choice of materials for packaging (increasing levels of recycled and compostable materials) and working with dairy farmers to create new approaches to soil nutrition to prevent risk to water purity, resulting in a substantial reduction in fertiliser expenses and improved plant uptake. The company also has a track record in combining indicators, goals and incentives to drive production and operational improvement and reduce environmental impact. For example, linking managerial bonuses to carbon dioxide reduction generating a 42% reduction over five years (against a target of 30%), and leading to a new target of net zero carbon on the full scope of responsibility by 2050. The company is now beginning to review what new indicators will be required to demonstrate its commitment to CE. Current work includes indicators to assess and report impacts on soil health, based on recognised global assessment methods and reduction in unaccounted or ‘first life’ plastic in the packaging chain. The development of additional, specific CE indicators is at a developmental stage although examples such as the dairy farmer-water protection scheme illustrate new forms of collaboration and operational investments to protect core biological resources whilst generating higher value for farmers.
In summary, the above demonstrates four global companies committed to CE in different industries. These real-world examples highlight the emergent practices of companies seeking to make linkages between the systemic goals of the CE, their core business activities, and the development of indicators. The strategic orientation of each company varies which leads to different opportunities and implications for creating circular value from the redesign of supply chains, production and operations. The four cases also reveal ways in which each company positions itself in relation to the goals and principles of a CE.
4.3. A framework of CE indicators
The previous sections highlight the widely differing experiences and practices in the development of indicators to monitor, report and communicate progress towards the CE. The categories of indicators used previously have been largely driven by resource efficiency and sustainability perspectives, focused on reducing environmental impact and cost saving, and including reducing inputs of materials, harmful chemicals and emissions, material substitution and material recovery via recycling at various stages in the product lifecycle. Examples of indicators extending beyond resource efficiency include sourcing ‘sustainable’ materials, value-added or product recovered across the product lifecycle, though these are less frequent. Some of these indicators could be reworked and continue to play an important part in an organisation’s emergent circularity practice. However, the level of connection between the range of indicators reviewed and their positive contribution to the goals and principles of a CE is rather loosely defined, hence requires further guidance and clarification based on emerging CE practices.
We propose a framework for the development of CE indicators which link to the core goals, principles and concepts of a CE. The butterfly model is a useful visual representation and characterisation of the materials, resource and energy flows in a CE, but it was not intended as a detailed operational tool. Figure therefore rotates the butterfly diagram in Figure through 90° and maintains the key relationships between material stocks and flows, between inputs, outputs, recovery processes, emissions, energy, and highlights the value of loops in terms of physical and financial measures across the system. The new framework in Figure emphasises the importance of both closed- and open-loop circulation and cascade processes for technical and biological materials. In addition to the framework we also present Table , which brings together the overarching goals and principles of CE (columns 1 and 2, Table ), implications for indicator development (column 3), and potential indicator categories which link to the requirements from emerging practices of progressive CE businesses (column 4).
Figure 3. Framework of CE indicators.
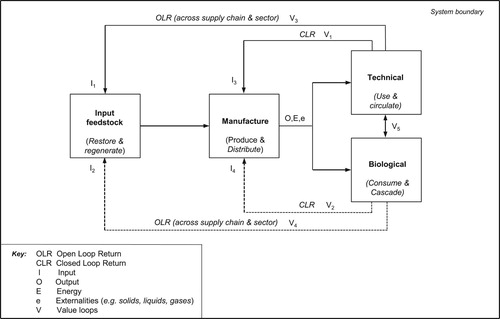
Table 3. Summary of goals, principles and CE indicators.
Overall, the new framework and table of goals, principles and indicators provide a logic and practical means of CE indicator development. Figure and Table therefore, when used together, provide the basis for developing indicators for measuring and monitoring whole organisation, supply chain, production and operations activities. The translation of these principles into quantitative indicators can be derived in different ways, but logically reflect the following core requirements of a CE (column 3, Table ), as follows:
Maintenance and rebuilding of stocks of natural capital and biological materials;
Total use and depletion of stocks of technical materials, notably critical and ‘at risk’ resources and materials;
Quantities of recirculated or cascaded technical and biological products and materials;
Quality of recirculated or cascaded technical and biological products and materials;
Longevity of technical materials in circulation;
Value of recirculated or cascaded technical and biological products and materials;
Renewable energy use.
The contribution to these indicators through production, operations and supply chain redesign will vary by industry and between different organisations, but invariably will require deploying, configuring and integrating the key CE building blocks of design, business models, reverse network management and system enablement. These building blocks will require new capabilities in the following areas:
Design: Improvements in product design are needed to facilitate progress on new indicators. Requires material selection to reduce the cost of moving products into higher value reverse circles, without compromising structural integrity or function by material selection, modularisation (e.g. to allow replacement of certain modules), standardisation (to reduce complexity), Design for easier disassembly and remanufacture, design to last and classic production process efficiencies to minimise waste. Material considerations will include shifting to renewables, sourcing biological materials that are grown using regenerative practices, designing out reliance on critical or scarce resources, and designing out hazardous or toxic materials.
Business models: Improved products and services with longer circulation cycles need to be designed into business model value propositions to compete successfully against highly efficient, low-cost, linearly produced products. These may be open- or closed-loop business models, but to be effective invariably involve a shift from ownership models to the consumer as user, performance-based models (e.g. leasing, hiring), and increasing the service elements of products in product–service systems, as well as recapturing value post-consumer/user.
Reverse network management: To complete the cycles in Figure it is imperative that capabilities and infrastructure for cost-efficient, high-quality collection and treatment systems with effective segmentation of end-of-life products to enable economically attractive circular flows. This requires that they address ease and convenience of use, privacy issues (e.g. data), be located close to end-of-life specialists, and most importantly be capable of maintaining the quality of the materials reclaimed. Hence sharing and tracking new indicators across these networks will be necessary.
System enablement: Effective cross-chain and cross-sector collaboration are imperative for the large-scale establishment of a circular system driven by operational indicators. New policies, international standards and guidance and economic incentives will all play a role in creating more positive conditions for circulatory practices. Individual organisations however can also take a lead by developing and reinforcing cross-value chain collaboration, e.g. joint product development and infrastructure management, requiring cross-value chain business models, visibility of material flow, industry standards and match-maker mechanisms.
Lastly, the explicit specification of key principles and their requirements creates a coherent framework for the development of indicators in support of the goals of CE. This proposes the following high-level indicators (column 4, Table ):
1. Maintenance, regeneration and rebuilding of stocks of natural capital and biological material flows
The aim of indicators under this heading is to measure: (1) proportion of total biological materials from restorative and regenerative practices, defined as growing systems which are aligned to improve the quality, quantity and health of natural capital such as soils, groundwater, air or forestry, (2) total non-renewable biological materials, such as peat, used in product, and (3) the quantity and quality of bio-nutrients inputs returned safely back into the biosphere. As an example, Company D has begun to assess soil health-based for all their agricultural-related activities,Footnote2 and has recently achieved lower costs of borrowing due to its performance in globally recognised environment, society and governance rating systems; highlighting the financial links to CE goals. The most successful closed-loop product by Company A removed 99% of peat from the product and created a packaging system that was designed to compost directly into the soil.
2. Total use and depletion of stocks of technical materials, notably critical and ‘at risk’ resources and materials
The aim of this indicator is to account for: (1) the total quantities of technical material flows, relative to global stocks, through the supply chain; (2) specific attention on critical and at-risk materials measured against current supply risk and supply restriction assessment methods.Footnote3
3. Quantities of recirculated or cascaded technical and biological products and materials
A key aim of CE is the circulation of products and materials, hence the aim of this indicator is to measure the total products or quantity of materials used within products and services that are recirculated or cascaded relative to the total stocks of products and flows of materials. Company C will soon publish an indicator to measure and assess the total material reuse and value across the full product lifecycle, including total recycled content.
4. Quality of recirculated or cascaded technical and biological products and materials
The value of products and materials circulated or cascaded is dependent on both quantity and quality, hence the aim of this indicator is to monitor the recovery and circulation of material quality at all stages, including knowledge about possible toxic, hazardous or other contaminants. Company A has devised indicators and methods of assessment to identify, screen and trace material health of its closed-loop products and seek to design out non-compliant chemicals hazardous to human and ecosystem health. Company D has developed indicators and programmes to safeguard the health and quality of groundwater supplies and continued use at rates based on rates of restoration and regeneration.
5. Longevity of technical materials in circulation
Many technical materials have a potential durability that spans decades and centuries, but are often used in short-lived products, and the subsequent materials are either progressively lost or down-cycled. For example, a 75% recovery rate of aluminium in beverage cans assuming a six-month repeat use of the aluminium would reduce the starting stock by 83% after six cycles over a three-year period. The aim of this indicator therefore is to focus attention on the designed versus the total potential useful life of technical materials and avoiding rapid depletion rates.
6. Value of recirculated or cascaded technical and biological products and materials
The circulation of products and materials at their highest value is based on the twin notion of reduced costs of inputs, but also the opportunity for new sales and added-value from products that have been remanufactured or refurbished or product–service systems. An indicator based on total sales revenue from certified CE products and designs, as recently implemented by Company B, provides a simple but clear measure of overall revenue value to the company.
7. Renewable energy use
The proportion of renewable energy to non-renewable energy across the supply chain is a straightforward measure of contribution to the CE goal, powered by renewables.
Our framework of CE indicators is derived from the overarching goals and principles of a CE and proposes a set of indicators to address the wider system requirement of regeneration, restoration, rebuilding, circulation and value loops. These indicators complement many of the input–output and resource intensity indicators previously described, which are largely focused on measuring emissions, externalities, wastes and energy demand, hence these are not repeated here. The extent to which each or any indicator applies to a specific industry or supply chain will vary, but there is emerging evidence of organisations committed to CE taking a full, end-to-end supply chain focus and developing methods of assessment, indicators and tools that extend far beyond those traditionally associated with resource efficiency and ‘greening’.
5. Conclusion
We find that the literature is currently fragmented and misaligned to some of the key principles of CE, which makes it confusing for business to make sense of what is different or is required in terms of implementation. Using a combination of literature, empirical data and real-world case examples, we now address our original research questions:
5.1. What are the founding principles and concepts of CE, and what are the implications for developing indicators?
Accelerating the transition to a CE is an immense undertaking and requires deep changes to patterns of linear production and consumption and redesign of systems that have grown and become entrained over many decades. Indicators are a key way in which companies report on their performance both internally and externally. Indicators also represent a key system enabler- driving practice, innovation and opportunity identification for value creation.
Indicators for CE found in the literature fit into a number of categories ranging from input–output, resource use intensity, longevity and value-based measures (Genovese et al. Citation2015; Elia, Gnoni, and Tornese Citation2017; Pauliuk Citation2018). An improved performance against these indicators can be achieved along one or more of the four building blocks of CE namely design, business models (to create value), collaboration (working with suppliers and others) and the reverse channel (both technical and biological cycles). However, such a step-change in practice is likely to require a comprehensive CE approach and require actions across all of these indicators and building blocks. Furthermore, the interaction between a company’s activities and wider system impact requires that indicators are anchored in a system level framework. The measurement of those impacts, positive or negative, and the potential for companies to collaborate to generate new value propositions and create greater value, possible through their own actions, remains a great prize and a key goal in the CE. How this works in practice, and the types of indicators and algorithms required to manage the complexity of these interactions requires further research. Companies such as the Yorth Group are beginning to show how this might be achieved (see https://yorthgroup.com)
This research has examined companies with a clear CE strategy and shows that indicators often have a production focus on inputs and outputs or intensity of resource use, such as intensity of energy or resource use in production. Many companies also take a supply chain view on inputs, for example using quantity of recycled plastic content in supplied materials or ‘sustainably’ sourced inputs. The scope of CE indicators must go beyond the ‘walls of the factory’ and even the supply chain, yet indicators on systemic contributions of company actions within and across sectors for example is currently missing.
5.2. How far does the literature and emergent real-world practice reflect or capture the ambition and goals of CE implementation?
The research focusing on company level indicators shows that most studies adopt traditional measures of resource inputs and waste outputs, although often with a lifecycle perspective. In the context of the CE, most previous research has focused on regional, national or sector-specific indicators for CE (Ghisellini, Cialani, and Ulgiati Citation2016). There are some similarities between CE indicators and sustainable development or SSCM indicators, especially in the area of input–output indicators (Ahi and Searcy Citation2015). However, there are also indicators which specifically fit a CE framing and are used both externally and internally. Simply applying sustainable supply chain indicators is unlikely to be sufficient, at least internally. Although there are a number of interesting cases of CE emerging, to date there is a paucity of research on the current business practice of developing CE indicators.
This paper is among the first to study company-based CE indicators in an initial exploration of how companies are turning their CE strategic aspirations in actionable performance outcomes. Leading companies do use indicators across the four categories we identified, both internally and externally. Internal versus external reported indicators show that companies are using CE indicators to show to external stakeholders that they are active in the field. These externally reported indicators are mainly input–output or resource intensity and in some cases value of CE-related products, leaving durability and longevity for internal reporting. To an extent companies also report on indicators related to the four building blocks, notably publishing lifecycle assessment reports for products or material sustainability indices to show design changes and showing evidence of reverse channels through quantities of products collected for recycling. However, supporting indicators for collaboration and business models are less clear, externally and internally. A final point is the scope of indicators which are still predominantly production-based. Emerging practice is to show inputs and outputs at a lifecycle level, although the scope here is also restricted in some cases (i.e. cradle to gate). No indicators were found that represent systemic CE implications, which leads to some of the key challenges for company-based CE strategies.
5.3. What are the biggest challenges and key requirements for further development of CE indicators?
Product, component and material flows in the company’s production, operations and supply chains involve multiple loops including closed loops, open loops and multiple cascades. Open loops and multiple cascades cross into different supply chains and sectors, so defining the right scope is challenging. Indicator focus is likely to be sector specific, for example with companies relying on agriculture focusing on the biological sphere and automotive companies on technical. Therefore using indicators to demonstrate cross-sector initiatives through open loops is also a challenge.
Using indicators to show the restorative or regenerative nature of CE is scarcely reflected in the literature and rarely in practice to show how companies can move from ‘no harm’ to net benefit. Hence indicators linking to the health of ecosystems represent an opportunity to show how companies can use CE to increase their stock in natural capital and safeguard their production systems against resource scarcity and protect the productive capacity of natural/biological systems. Value-based indicators could be developed to account for both financial and natural capital at a system level.
In terms of future research, this paper opens up several new research avenues and questions. For instance, how can companies better show their contribution to the CE overall? How can indicators link to shared CE assets and resources to ensure that value and impacts are properly accounted for across supply chains and sectors? And, how can companies that restore natural resources report on and drive behaviour through indices? Finally, production research in CE needs to consider indicators that go beyond the factory and even beyond the supply chain in terms of demonstrating beneficial impact on all tiers in the chain.
Acknowledgements
We wish to acknowledge the advice of the associate editor and two anonymous reviewers in the preparation of this manuscript. The research data supporting this publication are provided within this paper.
Disclosure statement
No potential conflict of interest was reported by the authors.
Additional information
Funding
Notes
1 The Second Law of Thermodynamics states that in all energy exchanges, if no energy enters or leaves the system, the potential energy of the state will always be less than that of the initial state, also commonly referred to as entropy.
Related Research Data
References
- Ahi, P., and C. Searcy. 2015. “An Analysis of Metrics Used to Measure Performance in Green and Sustainable Supply Chains.” Journal of Cleaner Production 86: 360–377. doi: 10.1016/j.jclepro.2014.08.005
- Antonetti, E., G. Iaquaniello, A. Salladini, L. Spadaccini, S. Perathoner, and G. Centi. 2017. “Waste-to-Chemicals for a Circular Economy: The Case of Urea Production (Waste-to-Urea).” ChemSusChem 10 (5): 912–920. doi: 10.1002/cssc.201601555
- Augustsson, A., L. Sörme, A. Karlsson, and J. Amneklev. 2017. “Persistent Hazardous Waste and the Quest Toward a Circular Economy: The Example of Arsenic in Chromated Copper Arsenate–Treated Wood.” Journal of Industrial Ecology 21 (3): 689–699. doi: 10.1111/jiec.12516
- Bjørn, A., and M. Z. Hauschild. 2013. “Absolute Versus Relative Environmental Sustainability.” Journal of Industrial Ecology 17 (2): 321–332. doi: 10.1111/j.1530-9290.2012.00520.x
- Blomsma, F., and G. Brennan. 2017. “The Emergence of Circular Economy: A new Framing Around Prolonging Resource Productivity.” Journal of Industrial Ecology 21 (3): 603–614. doi: 10.1111/jiec.12603
- Bocken, N. M., P. Ritala, and P. Huotari. 2017. “The Circular Economy: Exploring the Introduction of the Concept Among S&P 500 Firms.” Journal of Industrial Ecology.
- Christopher, M. 1996. Logistics and supply chain management. London: Prentice-Hall.
- Cong, L., F. Zhao, and J. W. Sutherland. 2017. “Integration of Dismantling Operations Into a Value Recovery Plan for Circular Economy.” Journal of Cleaner Production 149: 378–386. doi: 10.1016/j.jclepro.2017.02.115
- De Angelis, R., M. Howard, and J. Miemczyk. 2018. “Supply Chain Management and the Circular Economy: Towards the Circular Supply Chain.” Production Planning & Control 29 (6): 425–437. doi: 10.1080/09537287.2018.1449244
- Di Maio, F., P. C. Rem, K. Baldé, and M. Polder. 2017. “Measuring Resource Efficiency and Circular Economy: A Market Value Approach.” Resources, Conservation and Recycling 122: 163–171. doi: 10.1016/j.resconrec.2017.02.009
- Dong, S., Z. Wang, Y. Li, F. Li, Z. Li, F. Chen, and H. Cheng. 2017. “Assessment of Comprehensive Effects and Optimization of a Circular Economy System of Coal Power and Cement in Kongtong District, Pingliang City, Gansu Province, China.” Sustainability 9 (5): 787. doi: 10.3390/su9050787
- Dubois, A., and L. E. Gadde. 2002. “Systematic Combining: an Abductive Approach to Case Research.” Journal of Business Research 55 (7): 553–560. doi: 10.1016/S0148-2963(00)00195-8
- Eisenhardt, K. M. 1989. “Building Theory From Case Study Research.” Academy of Management Review 14 (4): 532–550. doi: 10.5465/amr.1989.4308385
- Eisenhardt, K. M., and M. E. Graebner. 2007. “Theory Building From Cases: Opportunities and Challenges.” Academy of Management Journal 50 (1): 25–32. doi: 10.5465/amj.2007.24160888
- Elia, V., M. G. Gnoni, and F. Tornese. 2017. “Measuring Circular Economy Strategies Through Index Methods: A Critical Analysis.” Journal of Cleaner Production 142: 2741–2751. doi: 10.1016/j.jclepro.2016.10.196
- EMF (Ellen MacArthur Foundation). 2012. Towards the Circular Economy Volume 1: An Economic and Business Rationale for an Accelerated Transition. Cowes, UK: Ellen MacArthur Foundation.
- EMF (Ellen MacArthur Foundation). 2013. Towards the Circular Economy Volume 2: Opportunities for the Consumer Goods Sector. UK: Ellen MacArthur Foundation: Cowes.
- EMF (Ellen MacArthur Foundation). 2014. Towards the Circular Economy Volume 3: Accelerating the Scale up Across Global Supply Chains. Cowes, UK: Ellen MacArthur Foundation.
- EMF (Ellen MacArthur Foundation). 2016. Growth Within: A circular economy vision for a competitive Europe. http://www.ellenmacarthurfoundation.org/assets/downloads/publications/EllenMacArthurFoundation_Growth-Within_July15.pdf. Accessed: 17 July 2016.
- Esbensen, K. H., and C. Velis. 2016. “Transition to Circular Economy Requires Reliable Statistical Quantification and Control of Uncertainty and Variability in Waste.” Waste Management and Research: 1197–1200. doi: 10.1177/0734242X16680911
- Franklin-Johnson, E., F. Figge, and L. Canning. 2016. “Resource Duration as a Managerial Indicator for Circular Economy Performance.” Journal of Cleaner Production 133: 589–598. doi: 10.1016/j.jclepro.2016.05.023
- Geissdoerfer, M., P. Savaget, N. M. Bocken, and E. J. Hultink. 2017. “The Circular Economy–A new Sustainability Paradigm?” Journal of Cleaner Production 143: 757–768. doi: 10.1016/j.jclepro.2016.12.048
- Geng, Y., J. Fu, J. Sarkis, and B. Xue. 2012. “Towards a National Circular Economy Indicator System in China: an Evaluation and Critical Analysis.” Journal of Cleaner Production 23 (1): 216–224. doi: 10.1016/j.jclepro.2011.07.005
- Geng, Y., J. Sarkis, and S. Ulgiati. 2016. “Sustainability, Well-Being, and the Circular Economy in China and Worldwide.” Science 6278 (Suppl.): 73–76.
- Genovese, A., A. Acquaye, A. Figueroa, and L. Koh. 2015. “Sustainable Supply Chain Management and the Transition Towards a Circular Economy: Evidence and Some Applications.” Omega 66: 344–357. doi: 10.1016/j.omega.2015.05.015
- Ghisellini, P., C. Cialani, and S. Ulgiati. 2016. “A Review on Circular Economy: The Expected Transition to a Balanced Interplay of Environmental and Economic Systems.” Journal of Cleaner Production 114: 11–32. doi: 10.1016/j.jclepro.2015.09.007
- Gregson, N., M. Crang, S. Fuller, and H. Holmes. 2015. “Interrogating the Circular Economy: the Moral Economy of Resource Recovery in the EU.” Economy and Society 44 (2): 218–243. doi: 10.1080/03085147.2015.1013353
- Guide, V. D. R. 2000. “Production Planning and Control for Remanufacturing: Industry Practice and Research Needs.” Journal of Operations Management 18 (4): 467–483. doi: 10.1016/S0272-6963(00)00034-6
- Guide, V. D. R., and L. N. Van Wassenhove. 2009. “OR FORUM - The Evolution of Closed-Loop Supply Chain Research.” Operations Research 57 (1): 10–18. doi: 10.1287/opre.1080.0628
- Gunasekaran, A., and B. Kobu. 2007. “Performance Measures and Metrics in Logistics and Supply Chain Management: a Review of Recent Literature (1995–2004) for Research and Applications.” International Journal of Production Research 45 (12): 2819–2840. doi: 10.1080/00207540600806513
- Hassini, E., C. Surti, and C. Searcy. 2012. “A Literature Review and a Case Study of Sustainable Supply Chains with a Focus on Metrics.” International Journal of Production Economics 140 (1): 69–82. doi: 10.1016/j.ijpe.2012.01.042
- Haupt, M., C. Vadenbo, and S. Hellweg. 2017. “Do We Have the Right Performance Indicators for the Circular Economy?: Insight Into the Swiss Waste Management System.” Journal of Industrial Ecology 21 (3): 615–627. doi: 10.1111/jiec.12506
- Hopkinson, P., M. Zils, P. Hawkin, and S. Roper. 2018. “Managing a Complex Global Circular Economy Business Model.” California Management Review 60 (3): 71–94. doi: 10.1177/0008125618764692
- Hutchins, M. J., and J. W. Sutherland. 2008. “An Exploration of Measures of Social Sustainability and Their Application to Supply Chain Decisions.” Journal of Cleaner Production 16 (15): 1688–1698. doi: 10.1016/j.jclepro.2008.06.001
- Kaplan, R. S., and D. P. Norton. 1995. “Putting the Balanced Scorecard to Work.” Performance Measurement, Management, and Appraisal Sourcebook 66 (17511), Harvard Business School.
- Keeble, J. J., S. Topiol, and S. Berkeley. 2003. “Using Indicators to Measure Sustainability Performance at a Corporate and Project Level.” Journal of Business Ethics 44 (2): 149–158. doi: 10.1023/A:1023343614973
- Kovács, G., and K. M. Spens. 2005. “Abductive Reasoning in Logistics Research.” International Journal of Physical Distribution & Logistics Management 35 (2): 132–144. doi: 10.1108/09600030510590318
- Lèbre, É, G. Corder, and A. Golev. 2017. “The Role of the Mining Industry in a Circular Economy: A Framework for Resource Management at the Mine Site Level.” Journal of Industrial Ecology 21 (3): 662–672. doi: 10.1111/jiec.12596
- Lieder, M., and A. Rashid. 2016. “Towards Circular Economy Implementation: A Comprehensive Review in Context of Manufacturing Industry.” Journal of Cleaner Production 115: 36–51. doi: 10.1016/j.jclepro.2015.12.042
- McDowall, W., Y. Geng, B. Huang, E. Barteková, R. Bleischwitz, S. Türkeli, and T. Doménech. 2017. “Circular Economy Policies in China and Europe.” Journal of Industrial Ecology 21 (3): 651–661. doi: 10.1111/jiec.12597
- Miemczyk, J., T. E. Johnsen, and M. Macquet. 2012. “Sustainable Purchasing and Supply Management: a Structured Literature Review of Definitions and Measures at the Dyad, Chain and Network Levels.” Supply Chain Management: An International Journal 17 (5): 478–496. doi: 10.1108/13598541211258564
- Mishra, J. l., P. G. Hopkinson, and G. Tidridge. 2018. “Value Creation From Circular Economy led Closed Loop Supply Chains: A Case Study of Fast Moving Consumer Goods.” Production Planning and Control 29 (6): 509–521. doi: 10.1080/09537287.2018.1449245
- Murray, A., K. Skene, and K. Haynes. 2017. “The Circular Economy: An Interdisciplinary Exploration of the Concept and Application in a Global Context.” Journal of Business Ethics 140 (3): 369–380. doi: 10.1007/s10551-015-2693-2
- Neely, A. 2005. “The Evolution of Performance Measurement Research: Developments in the Last Decade and a Research Agenda for the Next.” International Journal of Operations & Production Management 25 (12): 1264–1277. doi: 10.1108/01443570510633648
- Neely, A., M. Gregory, and K. Platts. 1995. “Performance Measurement System Design: A Literature Review and Research Agenda.” International Journal of Operations & Production Management 15 (4): 80–116. doi: 10.1108/01443579510083622
- Pan, S. Y., M. A. Du, I. T. Huang, I. H. Liu, E. E. Chang, and P. C. Chiang. 2015. “Strategies on Implementation of Waste-to-Energy (WTE) Supply Chain for Circular Economy System: a Review.” Journal of Cleaner Production 108: 409–421. doi: 10.1016/j.jclepro.2015.06.124
- Parajuly, K., and H. Wenzel. 2017. “Product Family Approach in E-Waste Management: A Conceptual Framework for Circular Economy.” Sustainability 9 (5): 768. doi: 10.3390/su9050768
- Pauliuk, S. 2018. “Critical Appraisal of the Circular Economy Standard BS 8001: 2017 and a Dashboard of Quantitative System Indicators for its Implementation in Organizations.” Resources, Conservation and Recycling 129: 81–92. doi: 10.1016/j.resconrec.2017.10.019
- Pettigrew, A. M. 1997. “What is a Processual Analysis?” Scandinavian Journal of Management 13 (4): 337–348. doi: 10.1016/S0956-5221(97)00020-1
- Richa, K., C. W. Babbitt, and G. Gaustad. 2017. “Eco-Efficiency Analysis of a Lithium-Ion Battery Waste Hierarchy Inspired by Circular Economy.” Journal of Industrial Ecology 21 (3): 715–730. doi: 10.1111/jiec.12607
- Savaskan, R. C., S. Bhattacharya, and L. N. Van Wassenhove. 2004. “Closed-loop Supply Chain Models with Product Remanufacturing.” Management Science 50 (2): 239–252. doi: 10.1287/mnsc.1030.0186
- Searcy, C. 2009. The Role of Sustainable Development Indicators in Corporate Decision-Making. Winnipeg, MB: International Institute for Sustainable Development.
- Searcy, C. 2012. “Corporate Sustainability Performance Measurement Systems: A Review and Research Agenda.” Journal of Business Ethics 107 (3): 239–253. doi: 10.1007/s10551-011-1038-z
- Seuring, S. 2004. “Industrial Ecology, Life Cycles, Supply Chains: Differences and Interrelations.” Business Strategy and the Environment 13 (5): 306–319. doi: 10.1002/bse.418
- Spring, M., and L. Araujo. 2017. “Product Biographies in Servitization and the Circular Economy.” Industrial Marketing Management 60: 126–137. doi: 10.1016/j.indmarman.2016.07.001
- Stahel, W. R. 2010. The Performance Economy. 2nd ed. Palgrave Macmillan.
- Voss, C., N. Tsikriktsis, and M. Frohlich. 2002. “Case Research in Operations Management.” International Journal of Operations & Production Management 22 (2): 195–219. doi: 10.1108/01443570210414329
- Webster, K. 2013. “The Decline of the Linear Economy and the Rise of the Circular. A Story About Frameworks and Systems. Chapter 1.” In A New Dynamic: Effective Business in a Circular Economy, edited by K. Webster, J. Blériot, and C. Johnson. Cowes, UK: Ellen MacArthur Foundation.
- Webster, K. 2014. The Circular Economy: A Wealth of Flows. Cowes, UK: Ellen MacArthur Foundation.
- Yin, R. K. 1994. Case Study Research – Design and Methods. 2nd ed. Sage Publications.
- Zeeman, G., and G. Lettinga. 1999. “The Role of Anaerobic Digestion of Domestic Sewage in Closing the Water and Nutrient Cycle at Community Level.” Water Science and Technology 39 (5): 187–194. doi: 10.2166/wst.1999.0238
- Zhijun, F., and Y. Nailing. 2007. “Putting a Circular Economy Into Practice in China.” Sustainability Science 2 (1): 95–101. doi: 10.1007/s11625-006-0018-1
- Zhou, Z., W. Zhao, X. Chen, and H. Zeng. 2017. “MFCA Extension From a Circular Economy Perspective: Model Modifications and Case Study.” Journal of Cleaner Production 149: 110–125. doi: 10.1016/j.jclepro.2017.02.049
- Zhu, Q., J. Sarkis, and K. H. Lai. 2008. “Green Supply Chain Management Implications for “Closing the Loop”.” Transportation Research Part E: Logistics and Transportation Review 44 (1): 1–18. doi: 10.1016/j.tre.2006.06.003