
 ?Mathematical formulae have been encoded as MathML and are displayed in this HTML version using MathJax in order to improve their display. Uncheck the box to turn MathJax off. This feature requires Javascript. Click on a formula to zoom.
Abstract
The technological advancements of recent years have increased the complexity of manufacturing systems, and the ongoing transformation to Industry 4.0 will further aggravate the situation. This is leading to a point where existing systems on the factory floor get outdated, increasing the gap between existing technologies and state-of-the-art systems, making them incompatible. This paper presents an event-based data pipeline architecture, that can be applied to legacy systems as well as new state-of-the-art systems, to collect data from the factory floor. In the presented architecture, actions executed by the resources are converted to event streams, which are then transformed into an abstraction called operations. These operations correspond to the tasks performed in the manufacturing station. A sequence of these operations recount the task performed by the station. We demonstrate the usability of the collected data by using conformance analysis to detect when the manufacturing system has deviated from its defined model. The described architecture is developed in Sequence Planner – a tool for modelling and analysing production systems – and is currently implemented at an automotive company as a pilot project.
1. Introduction
Manufacturing companies are welcoming the ongoing digital revolution and looking towards incorporating Industry 4.0 (Yin, Stecke, and Li Citation2018) technologies. Industry 4.0, also called the fourth industrial revolution, can be seen as a collection of various technologies – Internet of Everything (IoE), Cyber-physical Systems (CPS), Digital Twin, and Smart Factories – to create the next generation of industrial systems (Liao et al. Citation2017). This revolution aims to transform the factories into, so-called, smart factories. These smart factories (Kusiak Citation2018) will be modular, decentralised, and interconnected, to achieve higher-level automation and flexibility.
In general, these systems – more specifically, highly automated manufacturing stations – consist of a physical system and a control system. The physical system typically consists of one or more industrial robots supported by conveyors, fixtures, and automated guided vehicles. The physical system is controlled by one or more Programmable Logic Controllers (PLC) that constitute the control system. The different components in the station are designed to communicate with each other through the control system, thereby making them fully automated with minimal manual handling. Since the components come from different vendors and can be of different versions, there is no fixed manner in which they communicate, making the manufacturing system complex.
Additionally, the physical system and control system evolve as they are continuously updated. These updates can be physical, where new modern ones replace old devices; or, the performance or correctness of the system is updated by providing software improvements. In this process of updating, the factory floor becomes a mix of old devices, new devices, components from different vendors, and also of different versions. Furthermore, integrating devices that support Industry 4.0 adds to the complexity. Maintenance of such a sophisticated factory floor is a herculean task.
One main reason for the difficulty of maintenance relates to ensuring compatibility of the process. A small change in one resource can affect the resulting order in which the system executes. Hence, any change to the factory floor needs a guarantee that the update is safe, and does not lead to unwanted execution. However, it is not always possible to guarantee if the changes made were safe. One possible way to do so automatically would be to analyse what happens in the station in real time. Then, by comparing this to a known expected behaviour, conclusions can be made regarding the station's adherence to its intended behaviour (Tao et al. Citation2018a). To perform such an analysis of the manufacturing station, access to accurate data from the factory floor is of crucial importance.
Current advances in data processing algorithms, coupled with lower computing costs, allow companies to analyse and improve their systems using automated means. The primary requirement to be able to use these algorithms effectively is access to large quantities of accurate data. However, it is not always the case that such data is readily available, and methods to automatically collect data are rather scarce.
In a recent study, Kuo and Kusiak (Citation2018) observe how data-driven methodologies are prominent and gaining attention in production research. However, access to data and methods to collect data from the factory floor are typically limited. One of the reasons for the lack of data collection methods, from the factory floor, owes to the complexity and diversity of the resources present in the factory floor.
The benefits and the difficulty of collecting data, from such a diverse factory floor, is also captured by Kuo and Kusiak (Citation2018). In their discussions they write:
Data from different sources will make the processes and systems more coordinated, thereby resulting in higher productivity, efficiency and profitability. An integrated platform capturing data from parties in a supply chain and external information (customers' behaviour, social media, and economic conditions) can respond to changes more proactively and disseminate immediate recommendations to relevant parties, for example, manufacturers to design a new product, logistics service providers to anticipate the shipping requests, and warehouses to reserve storage for the new product, in a more coordinated manner. However, such a platform requires large data storage and powerful computing infrastructure. Parties in the supply chain may have different expectations for data sharing, and therefore a trusted data platform becomes essential. Even if these parties can provide their own data, data aggregation remains difficult. (Emphasis added)
These observations are very similar to our experiences. Creating a common platform where data from different resources can be collected is key to performing any kind of analysis and reasoning regarding the factory floor.
To summarise, the growing complexity of manufacturing stations poses a challenge to manufacturers. This complexity is due to the physical as well as the control system in the manufacturing stations. In order to understand and manage this complexity, existing techniques such as machine learning, Big Data analysis, and Process Mining, can be employed. And, to do so, these techniques require large amounts of data. However, there do not exist, to the best of our knowledge, effective ways to capture such data from the existing manufacturing systems.
Hence, there is a need for a solution that provides a general way of collecting data from manufacturing systems. Such a data collection system should ideally satisfy the following requirements:
The type of data required can change from time to time. The software architecture should allow to easily add new processing modules that transform the data from one abstraction level to another. This will allow operators and engineers to write their own algorithms that can help transform and analyse the data based on different requirements.
The resources in a manufacturing system typically come from different vendors. Hence, the implemented architecture must not be created for any specific set of vendors, but must be able to accommodate resources from different vendors.
The data collection system must be able to collect data as a passive listener, there should be no requirement for any changes on the existing factory floor such as having to add additional hardware or software to the manufacturing system. This is especially important to be inclusive to both old and new technologies.
The data collection should be easy to configure and setup, and once it is installed, it must be easy to add or remove resources without effecting the system at large.
The generated data must be reliable and usable for the intended purposes. The type of analysis keeps changing based on the demands of various stakeholders. Hence, it should be possible, by using additional analysis, to re-use the data collected to meet the new demands.
There must be a provision to enforce security in terms of accessibility, storage and retrieval, of the data.
The goal of this work is to provide one or more tools that will enable the collection and analysis of data from existing manufacturing stations. These tools will not only help manufacturers understand and improve the existing systems but also support them in the transition towards Industry 4.0 technologies. This paper extends upon a previous conference article (Farooqui et al. Citation2018b), which presented a data pipeline that starts with a generic and non-intrusive approach to capturing low-level data from an existing robot station. This data was then visualised in real-time using live Gantt charts. Here, in the current paper, we expand on the data pipeline used to generate the data. We provide further details on how the data is structured in the different components of the pipeline in order to transform the data into sequences of operations. Additionally, we demonstrate the practicality of the obtained data when applied to deviation detection using process mining techniques. Here, a known model defining the behaviour of the station is compared to the obtained sequences of operations to determine if the sequences are allowed by the model. If there exists a sequence that is not allowed by the model a deviating sequence has been found and can be provided to the operator for further analysis. Detection of deviations is done by conformance analysis (Rozinat and van der Aalst Citation2006) using the process mining toolbox ProM (Process Mining Workbench Citation2017).
This article is structured as follows: Section 2 presents a general picture of smart factories and specifically the life-cycle of data in manufacturing to help position this paper in the broad scope of data collection and aggregation. Section 3 highlights the general architecture that has been developed to collect data in a distributed and non-intrusive manner. Furthermore, the flow of data within the proposed system is explained using illustrations and example. Section 4 explains how the aggregated sequences of operations are used, in conjunction with a model of the station, to find deviations in the process. Finally, Section 5 concludes with future steps resulting from this work.
2. Background
The relevance of the contribution is understood from the standpoint of current academic and industrial developments. One such development is that of Smart Factories. Here, manufacturing companies aim to make the manufacturing plants more reactive by leveraging on artificial intelligence and machine learning technologies. Therefore, one main component required by these factories is the generation, collection, and storage of large quantities of data. This section provides a brief background describing Smart Factories and also highlights existing methods of handling data. The contribution of this paper, is then, a toolset to bridge these ideas and allow the industry to make the transition to Smart Factories by enabling them to collect data from the factory floor.
Furthermore, later in this paper, the applicability of data generated using the proposed architecture is shown by applying Process Mining techniques, specifically conformance checking to detect deviations on the manufacturing floor. Hence, we introduce the field of Process Mining – that deals with building logical models from large sets of labelled data – to help provide the reader with sufficient background.
2.1. Smart factories
Smart factories refer to a data-driven paradigm where the different aspects of the factory create a manufacturing intelligence by sharing, in real-time, information with each other (Davis et al. Citation2012; O'Donovan et al. Citation2015). The generation of this information comes from a variety of tools and processes. During the early phase of planning and commissioning the manufacturing system, virtual commissioning is employed to create a system that adheres to specifications (Lee and Park Citation2014; Park, Park, and Wang Citation2009). In the next state when production has begun, the manufacturing process is monitored and visualised in a virtual replica of the actual system using the concept of digital twin (Tao et al. Citation2018b). Furthermore, smart factories, when implemented, will borrow ideas from cyber-physical systems, internet of things, cloud computing, artificial intelligence, and data science.
Burke et al. (Citation2017) list the main characteristics of smart factories as connected, optimised, transparent, proactive and agile; all of which lead to an adaptive and responsive system. The most important of these characteristics is its connected nature. In a truly smart factory, the resources are connected with smart sensors to gather low-level data continuously to keep track of the state or condition of the system. By knowing the state, higher-level business intelligence can be combined to make optimised data-driven decision. The connected nature and access to data make it possible to predict the system performance and take proactive decisions. This data also makes it possible to visualise metrics and provide tools for quick support keeping the system transparent. The system can easily be adapted for scheduling changeovers, updating of factory layout with minimal intervention making it agile.
2.2. Data in manufacturing
Data is a key enabler for smart manufacturing. However, data in its raw form is not so useful to provide intelligence. This data needs to be ‘transformed’ into something more useful, and this is usually done in several stages. The different stages of data collection, storage, analysis, and visualisation can be referred to as the ‘data life-cycle’ (Siddiqa et al. Citation2016). In the following section, we highlight how this, manufacturing data, is exploited at different stages of its life-cycle.
2.2.1. Data sources
Almost every component in the manufacturing process, as well as the product's life-cycle, is a potential source of data (Kusiak Citation2018). Within the production environment, information systems, such as the manufacturing execution system, enterprise resource planning, customer relationship management, all possess data related to the product, its production, and other supply chain related information. Equipment Data is collected from the sensors in the factory to monitor performance, operating conditions, and track production itself (Zhong, Chao Chen, and Huang Citation2017). Many products are always connected to the internet even after they have reached the consumer. Data obtained from these products allow manufacturers to collect usage logs from the product.
2.2.2. Data collection
Data is collected in a variety of ways. Most of the new products and factories are enabled with the Internet of Things technologies and use Radio Frequency Identifications (RFID), imaging devices, and other sensing devices to collect data in real time (Ben-Daya, Hassini, and Bahroun Citation2017; Hwang et al. Citation2017). For instance, certain sensors make it possible to continuously measure, monitor, and report ongoing operational status of the equipment and the products such as pressure, and temperature. RFID based sensors enable automatic tracking and management of materials necessary for production. Apart from this, most of the resources present on the factory floor have an interface from which data can be accessed. However, this interface is usually regulated by the vendor of the product and can have limitations on the data, the platform, and the communication itself (Kuo and Kusiak Citation2018).
2.2.3. Data storage
The volume of data produced in recent times is significant. This data needs to be easily accessible while also stored securely (Kuo and Kusiak Citation2018). Data collected can be divided into three categories, structured (digits, symbols, etc.), semi-structured (graphs, XML documents, etc.) and unstructured (logs, sensors readings, images, etc.) (Gandomi and Haider Citation2015). Databases are commonly used to store this data such that it can be accessed easily, making these databases complex to populate and maintain. However, advances in cloud and big data storage technologies are shown to be cost and energy-efficient solutions and can potentially be used to reduce the complexity by storing the data in its raw form as unstructured data.
2.2.4. Data visualisation
The data collected is not useful in itself. This data needs to be processed into meaningful information, and this information needs to be communicated to the responsible personnel. Visualisation of the collected data is usually used to communicate the information gathered from the data. The visualisation used needs to convey the complete meaning, and hence the type of visualisation adopted can vary. As an example, Theorin et al. (Citation2017) continuously monitor and visualise different KPIs as pie charts (to show product position) and bar graphs (to show product leadtime). Real-time data can also be used by operators on the factory floor to monitor the process using, for example, Gantt charts as in Farooqui et al. (Citation2018b).
2.3. Process mining
Process mining is a field of study that deals with process discovery, conformance checking and enhancement using logged data from the system (van der Aalst Citation2011). By looking at sufficiently large logs of labelled data, spanning over several cycles, it is possible to discover an accurate representation of the process – this is called process discovery. The obtained model can then be checked against other event logs from the same process to find deviations – this is called conformance checking. Furthermore, obtained models can also be updated or extended using new event logs, and this process is called enhancement. The output model can be in the form of a Petri net, a transition graph, or a Business Process Model and Notation graph. Process mining has shown significant benefit in understanding underlying task flows, bottlenecks, resource utilisation and many other factors within large corporations (Van Der Aalst et al. Citation2007; van der Aalst Citation2013), and also proved beneficial in healthcare (Mans et al. Citation2008; Partington et al. Citation2015; Rojas et al. Citation2016) to learn and improve the underlying process.
Within the manufacturing domain, there have been only a handful of studies on applying process mining to manufacturing systems. Yang et al. (Citation2014) and Viale, Frydman, and Pinaton (Citation2011) present a method to apply process mining on manufacturing data. While the former uses structured and unstructured data generated from manufacturing systems along with operators or workers to provide domain-level knowledge, the latter works with definitions of the systems provided by domain experts to find inconsistencies between model and process. Yahya (Citation2014) shares insights into using process mining to understand manufacturing systems using artificially created logs. Theis, Mokhtarian, and Darabi (Citation2019) develop a method to learn a Petri net model from input–output logs and upon this use neural networks to predict future executions.
The goal of this section was to present a high-level view of the research direction within data-driven manufacturing, specifically, smart factories. Data, which is a key enabler, in smart factories is to be collected from different resources in the manufacturing system. We, the authors of this paper, are not aware of data collection architectures that take a holistic view of the factory floor and enable the collection and processing of data from legacy and state-of-the-art manufacturing systems, in a real-time manner. Nor are we aware of any methods to extract operation level data from existing manufacturing stations. This paper bridges the gap by providing a non-intrusive architecture to collect data from manufacturing stations.
3. Data collection architecture
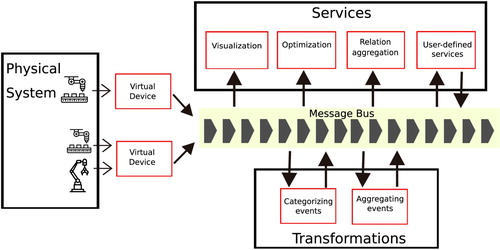
Theorin et al. (Citation2017) provide a broader discussion on various system architectures available and introduce the Line Information System Architecture (LISA) that uses an Event-driven Service Architecture (EDA). We use the ideas from LISA to build a streaming data pipeline, which is basically a series of steps that transform real-time data between different formats and abstraction levels. In Figure , an overview of this data pipeline architecture is shown along with the different components. The physical system that contains resources is interfaced to the message bus using Virtual Device Endpoints. This interface can be used for a single device or a group of devices. The messages on the bus are abstracted using Transformations. Furthermore, the abstracted messages and the raw messages are consumed by the user-defined services.
Figure 1. A pictorial representation of the different components in the data pipeline architecture. The arrows indicate the direction of flow of data. Endpoints are represented in boxes with red borders.
3.1. Pipeline components
A data pipeline broadly consists of two types of components, namely a message bus, responsible for communication and endpoints, data processing modules connected to the message bus that process the streaming data.
3.1.1. Endpoints
The endpoints enable creation and transformation of data into usable information in a loosely coupled way. Three types of endpoints are essential for our application and are defined here.
Virtual Device Endpoints: VD endpoints provide an entry point to generate event streams from the physical hardware such as robots, PLCs, scanners, etc., onto the message bus. Implementing communication details inside each low-level system with the message bus is a hard task, and not always feasible. Instead, the VD is a wrapper that provides a message-based interface; it thereby simplifies the architecture and satisfies the requirement of allowing the system to support plug and play design for hardware components, providing seamless integration for new devices. Additionally, the VD endpoints provide an interface between the hardware and the data pipeline, such that the data pipeline does not need to know the finer interfacing details about the vendor-specific resource. Such a system can rely on open standards such as OPC (Mahnke, Leitner, and Damm Citation2009) to interface with the resource, making the pipeline to be vendor-agnostic and non-intrusive.
The output from a VD endpoint is a stream of simple, low-level messages that can be interpreted and used by all other endpoints. This could, for example, be timestamped sensor values when they change.
Transformation Endpoints: Low-level systems communicate with simple messages that are sent by the VD onto the bus. Transformation endpoints convert such low-level data, and generally data on a low abstraction level, into higher abstractions, thereby making the data more usable for other endpoints in the pipeline. An output from the transformation endpoint, for a message received with the senor updates, could be to convert the sensor readings into product-arrived messages.
Service Endpoints: Service Endpoints provide a service – one specific function – with the incoming data as input and may or may not send processed data on the bus. That is to say, services read data from one or more transformations; then use this data to compute a result. Since services are based on user needs, the pipeline allows the integration of new services without hampering the existing process. For example, services may include aggregation services, prediction services, calculation of KPIs, or visualisation services. Taking the example of messages that were generated from sensor updates and transformed into product-arrived messages, the service endpoint would aggregate the information to calculate the rate of product arrival, for example.
3.1.2. Message bus
The message bus forms the communication layer allowing interaction between all endpoints. There exist, in the literature and in practice, a number of possible configurations to create a message bus. While configuring a bus, the primary objective is to aim for low complexity and high scalability. Ideally, it must be possible to change or upgrade the message bus without significant changes to the code.
Services are triggered to execute when a message arrives. To make this possible, messages on the bus are structured into topics, and each service subscribes to one or more topics. When a message arrives on a specific topic subscribed by the service, that particular service is executed once. The aim of using the message bus in this particular manner allows us to build the system as modular components. If a particular module goes missing it results in loss of functionality, but will still keep the system operational. This ties in closely with the previously stated requirements to make the system extendable and usable.
3.1.3. Message format
The message format, built-up of key-value pairs, is designed to be simple and flexible. It consists of a header and a body. The header is made up of key-value pairs containing a timestamp and an id. The rest of the message is built-up of attribute-value pairs, where keys are attribute names and their corresponding values can be of primitive data types, and can also include lists and maps. A message on the message bus would be a three tuple as , where, id is a unique identifier; timestamp is the timestamp the message was generated, and AV are the attribute-value pairs containing the body of the message.
These messages are immutable; once sent on the message bus, they cannot be changed. Services that refine messages will need to create and send new messages. The new messages can have the same id and timestamp while arbitrarily modifying the body. This allows the system to be extendable with new services that can choose to use raw unprocessed messages or the processed messages.
Keeping the message structure flexible and making all messages immutable coupled with the modular nature of the transformation endpoints ensures the data is usable for newer analytics that were not planned for when building the system, thereby adding to the usability of data. Since the data is immutable, the messages cannot be changed, new messages with the same id and timestamp are created and sent on the bus. Hence, no information on the message bus is ever lost; it can only be increased based on the transformations present. When new requirements turn up, stored messages can be replayed over the message bus in the same manner with additional transformations to perform the required analysis. Most modern message bus implementations, such as Apache Active MQ (Citation2017), Akka (Citation2017), and Kafka (Citation2017), come inbuilt with immutability and storage features.
The data pipeline architecture defined is implemented using (Sequence planner Citation2019) (SP), a tool developed at Chalmers University of Technology for modelling and analysing automation systems. SP is developed as a micro-service architecture, where live data can be connected to a distributed event pipeline, using a VD endpoint, and transformed into usable information that can be visualised as well as used by various algorithms.
3.2. Applying the architecture to a robot station
So far a general data pipeline architecture that will enable us to capture and analyse data from manufacturing stations is highlighted. In the following section, the defined architecture is further described by exemplifying it on a robot station at a manufacturing firm. The station performs spot welding on a variety of different car models produced by the company. Once a car body enters the station and is in position, the robots choose the predefined program appropriate for the specific car model and then move in the workspace between pre-programmed spatial positions where they perform operations such as welding. During these movements, they might need to wait for each other when entering common shared zones. Apart from this, tip dressing operations – the process of cleaning the welding tip – are also performed regularly by the robots to maintain weld quality.
The station is programmed using a high-level programming language that supports modular programming. That is, these programs are divided into, smaller, self-contained, modules that contain sets of instructions corresponding to some physical division of the system. Each module is further divided into routines that correspond to a unit task performed by the robot. Each line in the program corresponds to an action by the robot, which is performed sequentially, The line being executed is referred to by the program pointer. Apart from robot movements, the program also interfaces with the signals that provide input/output (IO) functionality. This code structure will prove beneficial when transforming the generated data into operations as explained later in this section.
3.3. Robot endpoint
The robot endpoint translates robot actions to event streams used by the architecture programmed in SP. For this, it depends on an interface to access robot data. To feed live data from a robot into SP, a VD was developed to interface with the robots. Since the station consisted of ABB robots, the Robot Software Development Kit (SDK) (ABB Citation2017) provided by the robot manufacturer was used. This SDK provides a mechanism to subscribe to both the program pointer and the IO signals present in the robot controller. Note that though this specific SDK was used in the example station, this by no means rules out robots from other vendors; as long as the robot vendor provides an interface to access – at least read – the program pointer, an endpoint for a robot from this vendor can be created.
The VD endpoint uses the SDK to receive notifications on the event of a change in the program pointer or the signals, which is followed by sending a message – after appending a header – on the message bus with the appropriate contents. An example robot message for a program pointer position, transmitted when the program pointer advances in an execution step is shown in Listing 1.
The message consists of a program pointer position, an address, and a header. The programPointerPosition block contains information regarding the position of the program pointer. It contains the names of the module and routine currently executed by the robot. Additional information pointing to the exact line number is available under range. The value of time contained here is the timestamp when this event was created. The address block contains the path, internal to the robot, that generated the event.
The header block (the bottom three lines) contains information that helps identify the source of each message. It consists of a robotId that identifies the robot responsible for generating the event; a timestamp time for when the endpoint received the pointer change information; and a workCellId, a unique number to represent the manufacturing station where the message was generated.
3.4. Transformation endpoints
As mentioned earlier, transformation endpoints convert data from one abstraction to another. The incoming raw data from a robot as seen in Listing 1 needs to be refined into something more understandable. One sufficiently good abstraction to use is that of an operation (Bengtsson, Lennartson, and Yuan Citation2009). The previously defined robot program structure is suitable to transform the raw data into operations. We create two types of operations from the raw data, named routines and wait. Routines in the robot program represent the tasks performed by the robot; these constitute ‘move from x to y’, ‘grip’, ‘ tipdress’ or ‘weld’. Wait operations are related to when the robot is waiting to get access to a shared resource, which is accomplished using the keyword ‘WaitSignal’ in the robot programs. Using this information, the following subsections provide a step by step approach to transforming the raw data into operations.
3.4.1. An introduction to transformations
Before showing how the raw data, from the robots, is transformed into operations, we will first present the different transformations used in this paper, namely: ,
, and
.
Definition 3.1
The transformation transforms a message
by appending a set of attribute-value pairs, that is
, where
The transformation appends additional information to the existing body of the message. The appended information depends directly on the current message and nothing else. That is to say, the
transformation is static in nature, the appended information is always the same for a given message.
Definition 3.2
The transformation transforms a message
by appending a set of new attribute-value pairs based on the current state q, that is,
.
In some cases, the information aggregated from the messages seen in the past has to be added to a message; for this, the transformation called is used. To this end, the transformer keeps updating its internal belief – state – of the system, the updated message is then a function of this state. The body of the new message can look very different from the input. In both the above transformations,
and
, the new messages sent out on the message bus has the same id and timestamp while only the body is updated.
Definition 3.3
The transformation merges a finite sequence of messages into a single new message, that is,
, where s is a sequence of messages.
Unlike the other two transformations, creates a completely new message that does not refer to any previous message and can be used to bundle the information of several messages into one single message. This can, as will be shown later in this article, be used to create abstractions of the data.
3.4.2. Naming and categorizing events
The first stage in the transformation of the raw data into operations is to categorise and name the different events. This is done by naming the incoming events according to the routine they were generated from. This first stage of transformation is done using the transformer. For every robot message, using the program pointer the currently executing instruction is extracted from the source code. The source code is always available, if not it is extracted from the robot using the Robot Endpoint. If the extracted instruction reads ‘WaitSignal’ then the event is categorised as a ‘wait’ event, else it is a ‘routine’. A new message is then sent out appending the original message with tags ‘instruction’, containing the instruction extracted from the program, and ‘isWaiting’ with a value true if the event is categorised as a ‘wait’, else a value of false. The resulting message from this step is seen in Listing 2.
3.4.3. Aggregating events to operations
The named and categorised events need to be further processed into an operation by a two-step transformation. The first step involves identifying when the named events start and finish. This is done by a transformer that listens to named and categorised events. This transformation endpoint keeps track of all available resources (identified here with attribute names robotId and workCellId) and the routines being currently executed by each of them. Then, each input that arrives is transformed into an operation event.
An operation event – apart from the header which is similar to the input event – has a name, a timestamp, a resource where it is executed, a unique activityId, and a flag that defines if this event defines the start or stop of the operation. Listing 3 shows four different events running on two different robots. The operation start and operation stop events are also shown with their respective timestamps. Both the start and the stop events have the same activityId that helps identify and merge the two. The difference in timestamps gives the total time the operation took to execute. Furthermore, operation start and operation stop events can be merged into a single event to represent a complete operation as seen in Listing 4, this can be achieved using the transformation. Here the two events corresponding to WaitSignal ReleaseStation2 of Listing 3 are merged into a single operation event. The new event – with a new id and timestamp – contains both the start and stop time of the operation, keeping the remaining information intact. Each robot can perform one operation at a time. Over a given period of time the set of operations performed are called a sequence of operations.
A long sequence can be broken down into sub-sequences. For example, a sequence collected over a day will contain repeated sequences corresponding to the products produced. A collection of several sequences are referred to as sequences of operations. The data collected and transformed as operations presents an abstraction of the ongoing process on the factory floor. This data can then be further processed and used to analyse the manufacturing system.
3.5. Services
Having real-time data from factory floors abstracted into operations, one can run various algorithms – in the form of services – to understand and visualise the tasks on the factory floor. Online calculation and visualisation of various KPI's using the abstraction of operations are discussed in Theorin et al. (Citation2017). Apart from KPI's, operators at the factory floor are interested in an overview of ongoing operations, this can be visualised using real-time Gantt charts, by simply plotting the different operations over time.
3.5.1. Real-time visualization of operations
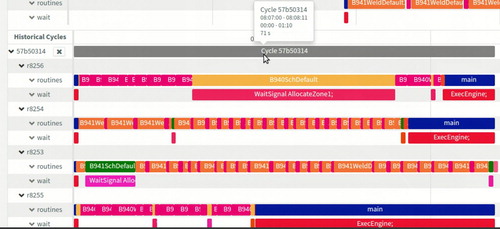
Information such as, execution time for each cycle, execution time for each operation, total waiting time, operations where robots wait for each other, etc., are important to maintain and develop the station. The messages that define an operation can be visualised in different formats, such as Gantt charts, to help the operators maintaining the factory floor to keep track of ongoing processes in the stations. Figure shows a snapshot of a real-time Gantt chart of ongoing operations in all resources, appended with additional information such as execution time for each operation. Similarly, it is also possible to visualise historical cycles, as shown in Figure . In both figures, each robot is identified by its name and has two rows corresponding to it. The first row traces ‘routines’ while the second traces ‘wait’ operations. By presenting both, the ‘routine’ and ‘wait’ operations in parallel, provides the operators with the insight into what operations have the longest idle times contributing to delays in the system. Additionally, the sequences captured can be used to visualise different views, predict different parameters or for optimisation, as discussed in Farooqui et al. (Citation2018a).
Figure 2. A real-time Gantt view of operations running in the station.
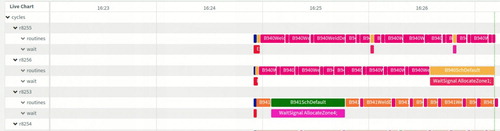
Figure 3. Historical cycles with additional details.
3.6. A summary
To sum up the current section, we highlight some of the properties of the data pipeline architecture as listed in the introduction. The most important requirement for the architecture is to provide usable data; data that can be used to understand, analyse, and evaluate the manufacturing station. To fulfil this, the architecture is designed to support new resources in a plug-n-play manner; that is, resources can be added or removed with minimal effort and without the need to modify and restart the system. Once connected, the system passively listens and publishes the changes of the program pointer; this ensures the system is non-intrusive. Additionally, new algorithms can be dynamically attached and detached to transform the data into various abstraction levels. This allows for extendability. Furthermore, by using virtual device endpoints that provide a common interface to collect data from diverse factory floors, the system is designed to be vendor-agnostic. Here, each vendor-specific device has an endpoint that converts the vendor-specific data into the format understandable by the overall architecture.
One property that was mentioned as a requirement but not expanded upon in the text is that of security. Integrating security for data access and transmission is identified as further work and would require a deeper analysis into the threat models required by the industries.
The software package described in the above section can be found online (Sequence planner Citation2019).
4. Detection of deviations in operation sequences
Thus far, a method to generate and collect data from an existing factory floor and processing this data into a useful abstraction called operations is outlined. It is now important to demonstrate the usability of the generated data. We do so by presenting a technique for anomaly detection. Thus, in this section, we look at how process mining (van der Aalst Citation2011) can be used to detect deviations in the activities performed by the manufacturing station, when compared to a nominal model describing the intended behaviour of the station.
4.1. Creating models
Using the collected data, a general model that defines the nominal operation of the station can be built by Process Mining (van der Aalst Citation2011), which is a set of techniques and algorithms able to automatically discover process models from event logs. To create a model using the gathered data, the process mining algorithms are given as input a stream of operations. By analysing operation streams that span over several manufacturing cycles generic models describing the different operation sequences performed by each robot and of the complete station can be calculated. These models can then be visualised as Petri nets or Transition Graphs. Further details on creating models using data obtained from robots can be found in Farooqui et al. (Citation2018a), van der Aalst (Citation2011). These models are then used to analyse, improve, and optimise the robot station.
In the following, the discussion focuses on how these models can be used to trace the behaviour of robots and to detect deviations. Assuming that a model describing the process is already available, the question then becomes: can we find out whether the data collected from the factory floor conforms to the behaviour described by the model? If not, can we see how the data differs from the expected model? Depending upon the cause of the deviation, the results of this analysis can be used to either improve the process or correct the model.
4.2. Finding deviations
Given a sequence of operations and a known model to which these should conform, there exist two types of deviations. The newly obtained sequence can contain one or more operations that the model has no knowledge of. Or, the sequence can have the operations ordered differently, or altogether missing, from what the model defines.
A trivial example to illustrate these deviations is as follows. Let a,b,c,d,e represent valid operations. Consider then a model that only accepts the list of operation ⟨a,b,c,d⟩. If the data then contains a sequence ⟨a,b,c,d,e⟩, we can then infer that e is the deviation. This would relate to the first type of deviation described, and detecting it is rather trivial; it could be done by comparing the list of existing operations (in the model), with that of the newly observed sequence. On the other hand, if the obtained sequence is ⟨a,c,b,d⟩ – where the order of b and c is interchanged or, ⟨a,c,d⟩ – where the operation b is missing altogether – then, detecting a deviation automatically is not so trivial. One possible solution is to use the concept of conformance checking (Rozinat and van der Aalst Citation2006) available in process mining.
4.3. Conformance checking
Conformance checking is the process of investigating if a given log of a process is allowed by a model defining the same process. Broadly speaking, there are two approaches towards performing conformance checking. Footprint Comparison and Token Replay (van der Aalst Citation2011). In the Footprint Comparison method, the given model and the collected sequences of operations are converted to footprint tables that describe the relationship between the events. These tables are then compared to find discrepancies. However, in this paper, we use the Token Replay method and hence will not give further details about Footprint Comparison.
When using Token Replay, the process log is replayed onto the model to check if the log is in accordance with the model. The simplest way to do this would be to check if the log can be parsed by the model. The fitness – a value determining how accurate the log is to the real model – of the process is then the ratio of the number of logged successfully parsed cycles to the total number of logged cycles. However, calculating the fitness in this manner does not give any insight into where the deviation occurred. A smarter method to calculate the fitness is to replay the log on a Petri net model and keep track of the tokens used. At each stage of the process the program keeps track of four counters, these are: p (produced tokens), c (consumed tokens), m (missing tokens), and r (remaining tokens). At the start all the counters are initialised to zero. Then, when a log is replayed and for each event fired the respective counters are updated.The fitness can then be calculated using the equation: . The first part calculates the fraction of missing tokens to the consumed tokens, and the second part gives the fraction of remaining tokens to produced tokens. If a log fully conforms to the model then there will be no missing or remaining tokens making the fitness 1. On the other hand, if the missing tokens equal the consumed tokens then
, and the tokens remaining are equal to the produced tokens then
. Hence, the fitness of the log is defined in the range
.
Now, a finer information of the place where the deviations occurred can be provided by using the information about the missing and remaining tokens in the model.
4.4. Applying conformance checking to the collected data
Here we will demonstrate how the collected sequences of operations can be used to find deviations when compared to a nominal model of the station. To this end, we use two examples, the first model describes the flow of a product through a manufacturing station. The second looks at the tipdress activity performed by robots responsible for welding.
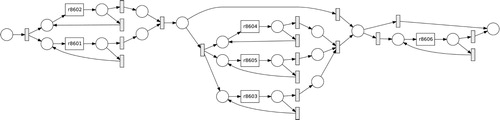
Figure shows a Petri net model describing the flow of a product through a manufacturing station with six robots. The circles denote places that keep track of the product, and the boxes denote transitions. Some boxes have the name of the robot performing the operation, while others are not named and denote silent events. These silent events allow to model loops in the system. According to this model, when a product enters the station the robots r8601 and r8602 perform a set of operations on this product. Once these two robots complete their tasks, the product is moved forward to be serviced by robots r8603, r8604, and r8605, followed by robot r8606. According to the model, it is possible that, once the first two robots have completed their tasks, either the last robot r8606 performs its operations skipping the middle three robots, or the middle three robots perform their operations skipping the last robot. It is also possible that none of the robots after the first two performs any operation on the product. However, it should never be the case that the first two robots are skipped.
Figure 4. Model of a station with six robots describing the flow of a product; when it enters, it is first serviced by the first two robots; only after that can any of the other robots perform their operations.
Data collected from this station was replayed using ProM (Process Mining Workbench Citation2017) to check if it conforms to the model. A part of the results, which show non-conformance, is shown in Figure . The figure is a magnified output from the process mining tool focusing only on the first part of the model where the product enters and needs to be serviced by the two robots. The boxes highlighted in red indicate the transitions on which the collected data and the model do not conform. The numbers in the boxes show the total number of operations executed by each of the robots and the number of non-conformant operations. In this particular case, robot r8601 and r8602, respectively, ran a total of 578 and 458 operations, of which 47 and 48 were non-conformant.
Figure 5. A log from the robot station is replayed to check conformance. It is noticed that the first two robots did not perform as expected by the model.
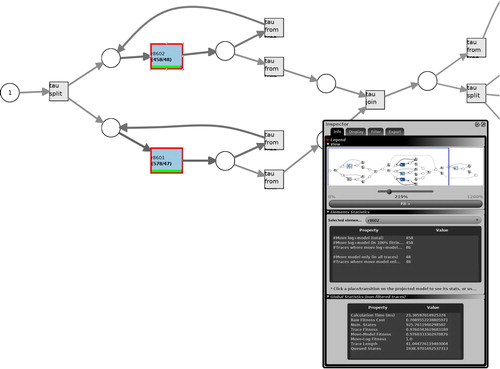
This example demonstrates how deviations can be detected from a resource perspective. Using this insight, the station operator needs to analyse the system further to deduce the reasons that cause the deviation. For example, in this case, it could be that the first two robots broke down and did not perform their tasks in 47 sequences, but worked the rest of the time correctly. Alternatively, these 47 operations were not recorded or represented in the model correctly. However, given only the information about deviation, it is not possible to conclude what might be wrong. It would require manual intervention where the personnel managing the system need to find the cause of the deviation. In the above case, it was the model that did not take into account operations that are not dependent on the presence of the product. In the next example, we take a simple tipdress model and demonstrate the use of this method when applied from an operation perspective.
Figure represents the model of the tipdress operation. The robots responsible for welding monitor the tip of the weld gun. After a number of welds, the tip needs to be cleaned and cut to ensure good weld quality. To do so, according to the model, the robot first moves to the tipdresser using the operation MoveToolGun311. Then, the robot can choose between SmallDress, BigDress, Gun311MeasCycle, and Gun311DressSch. There is also a choice to run the TipDress operation before performing Gun311DressSch.
Figure 6. A simplified model showing the tipdress operation that occurs during welding.
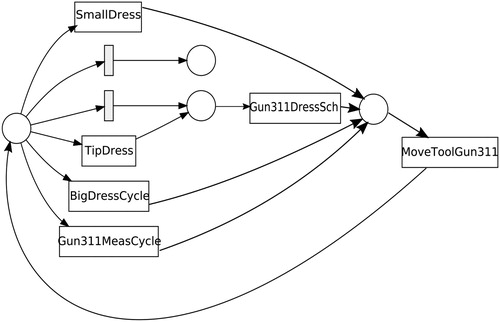
Figure shows the result of running conformance analysis by replaying the collected sequences over the model. The location marked red indicates that a deviation has been encountered at that location. Details of the deviation are found in the small window seen alongside. Here, we see three different operations that occurred in the log. According to the log, which contains several sequences of this behaviour, operations TipDress, MoveToolGun311, and Gun311DressSch occurred at this point. However, the model only allows MoveToolGun311. The other two, TipDress and Gun311DressSch, occurred when the model did not expect them. Another observation from Figure is that no TipDress operation was encountered that was in agreement with the model, this is seen by reading the number below it which reads 0/0. At this point, it is the responsibility of the operator to investigate and determine the cause of this deviation.
Figure 7. The operation log of a robot is replayed over the tipdress model to check log-model conformance. The position coloured red indicates the deviation from the nominal model.
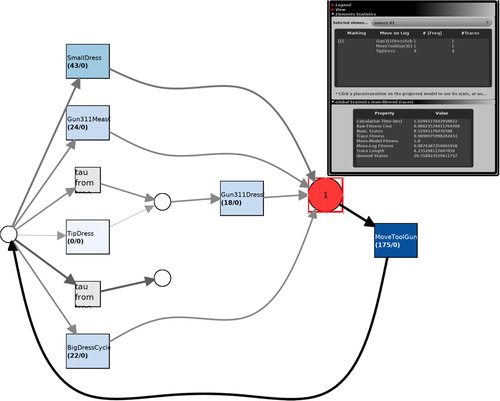
In general, in both examples, three explanations are possible. Maybe the model is inaccurate and needs to be improved, or there is indeed an error in the activities performed in the station that needs to be fixed, or maybe the collected data is inaccurate. The operator will have to find out what the actual problem is and provide an appropriate fix.
5. Conclusion
In conclusion, the main motivation for the work presented in this paper comes from the need to have the possibility to use new state-of-the-art data analysis technologies developed under the umbrella of Industry 4.0 on older manufacturing systems. The problem identified here was a lack of data capturing techniques, in theory and practice, from diverse factory floors built-up of legacy and new systems from a variety of vendors. To bridge this gap, a distributed software architecture is presented that is designed to capture and process data from manufacturing stations. Access to such data is made possible using a vendor-agnostic software solution that listens to the actions performed by the resources in the manufacturing station, and converts this into a stream of event messages. These event messages are streamed through a data processing pipeline which then transforms the raw data into a useful abstraction called operations. These operations can then be visualised using Gantt charts or processed into transition models.
Furthermore, the paper presents an approach to detect deviations in the operation sequences. Here, the collected operation sequences are replayed onto a known model of the station. This process, known as conformance checking, is performed using the process mining tool ProM. Two examples demonstrate how the obtained operation sequences can be used along with a known model to find deviations in the behaviour of the system.
The extendible nature of the architecture makes it possible to integrate it with other methods to analyse and improve the system. For example, existing performance measurement (Kamble and Gunasekaran Citation2019) and online optimisation (Zhang et al. Citation2019) tools can be added as services to incorporate data-driven approaches to evaluate and control the system. Furthermore, AI-based prediction (Fang et al. Citation2019) methods can be employed to find patterns in the manufacturing processes.
There are several challenges to be able to use the obtained data. Firstly, well-defined models of the station are usually not available. Automatically building such models is an active area of research. Steffen, Howar, and Merten (Citation2011), Farooqui and Fabian (Citation2019), Farooqui et al. (Citation2018a), Smeenk et al. (Citation2015), and Van Der Aalst et al. (Citation2007) are a few existing ways to automatically obtain a model of a system.
Secondly, the procedure defined in this paper requires an operator to interact, analyse, and interpret the results. Very soon, it becomes difficult to analyse large complex models manually. The natural next step is to automate this process so there is minimal interaction with the operator.
Finally, the architecture presented here focuses heavily on manufacturing stations with robots. However, there are other resources present on the factory floor that are potential sources of data. A significant area for future work lies in integrating these resources, for example, the Programmable Logic Controllers (PLC), into the data collection architecture described in this paper. The challenge here is to convert PLC actions into an abstraction similar to that of operations in this paper.
Disclosure statement
No potential conflict of interest was reported by the authors.
Additional information
Funding
References
- ABB. 2017. “ABB Robot SDK.” http://developercenter.robotstudio.com.
- Akka. 2017. “Akka Streams.” https://doc.akka.io/docs/akka/current/java/stream/.
- Apache Active MQ. 2017. “Apache Active MQ.” http://activemq.apache.org.
- Ben-Daya, Mohamed, Elkafi Hassini, and Zied Bahroun. 2017. “Internet of Things and Supply Chain Management: A Literature Review.” International Journal of Production Research 57: 1–24.
- Bengtsson, Kristofer, Bengt Lennartson, and Chengyin Yuan. 2009. “The Origin of Operations: Interactions Between the Product and the Manufacturing Automation Control System.” IFAC Proceedings Volumes 42: 40–45. doi: 10.3182/20090603-3-RU-2001.0148
- Burke, Rick, Adam Mussomeli, Stephen Laaper, Martin Hartigan, and Brenna Sniderman. 2017. “The Smart Factory.” https://www2.deloitte.com/insights/us/en/focus/industry-4-0/smart-factory-connected-manufacturing.html.
- Davis, Jim, Thomas Edgar, James Porter, John Bernaden, and Michael Sarli. 2012. “Smart Manufacturing, Manufacturing Intelligence and Demand-dynamic Performance.” Computers & Chemical Engineering 47: 145–156. doi: 10.1016/j.compchemeng.2012.06.037
- Fang, Weiguang, Yu Guo, Wenhe Liao, Karthik Ramani, and Shaohua Huang. 2019. “Big Data Driven Jobs Remaining Time Prediction in Discrete Manufacturing System: A Deep Learning-based Approach.” International Journal of Production Research 13 (1): 1–16. doi:10.1080/00207543.2019.1602744.
- Farooqui, Ashfaq, Kristofer Bengtsson, Petter Falkman, and Martin Fabian. 2018a. “From Factory Floor to Process Models: A Data Gathering Approach to Generate, Transform, and Visualize Manufacturing Processes.” CIRP Journal of Manufacturing Science and Technology 24: 6–16.
- Farooqui, Ashfaq, Kristofer Bengtsson, Petter Falkman, and Martin Fabian. 2018b. “Real-time Visualization of Robot Operation Sequences.” 2018 IFAC Symposium on Information Control Problems in Manufacturing (INCOM 2018).
- Farooqui, A., and M. Fabian. 2019. “Synthesis of Supervisors for Unknown Plant Models Using Active Learning.” In 2019 IEEE 15th International Conference on Automation Science and Engineering (CASE), August, 502–508.
- Gandomi, Amir, and Murtaza Haider. 2015. “Beyond the Hype: Big Data Concepts, Methods, and Analytics.” International Journal of Information Management 35 (2): 137–144. http://www.sciencedirect.com/science/article/pii/S0268401214001066. doi: 10.1016/j.ijinfomgt.2014.10.007
- Hwang, Gyusun, Jeongcheol Lee, Jinwoo Park, and Tai-Woo Chang. 2017. “Developing Performance Measurement System for Internet of Things and Smart Factory Environment.” International Journal of Production Research 55 (9): 2590–2602. doi: 10.1080/00207543.2016.1245883
- Kafka. 2017. “Apache Kafka.” https://kafka.apache.org/.
- Kamble, Sachin S., and Angappa Gunasekaran. 2019. “Big Data-driven Supply Chain Performance Measurement System: a Review and Framework for Implementation.” International Journal of Production Research: 1–22. doi:10.1080/00207543.2019.1630770.
- Kuo, Yong-Hong, and Andrew Kusiak. 2018. “From Data to Big Data in Production Research: The Past and Future Trends.” International Journal of Production Research 57: 1–26.
- Kusiak, Andrew. 2018. “Smart Manufacturing.” International Journal of Production Research 56 (1–2): 508–517. doi: 10.1080/00207543.2017.1351644
- Lee, Chi G., and Sang C. Park. 2014. “Survey on the Virtual Commissioning of Manufacturing Systems.” Journal of Computational Design and Engineering 1: 213–222. doi: 10.7315/JCDE.2014.021
- Liao, Yongxin, Fernando Deschamps, Eduardo de Freitas Rocha Loures, and Luiz Felipe Pierin Ramos. 2017. “Past, Present and Future of Industry 4.0 – A Systematic Literature Review and Research Agenda Proposal.” International Journal of Production Research 55 (12): 3609–3629. doi: 10.1080/00207543.2017.1308576
- Mahnke, Wolfgang, Stefan-Helmut Leitner, and Matthias Damm. 2009. OPC Unified Architecture. 1st ed. Springer. Berlin Heidelberg.
- Mans, R. S., M. H. Schonenberg, M. Song, W. M. P. van der Aalst, and P. J. M. Bakker. 2008. “Application of Process Mining in Healthcare – A Case Study in a Dutch Hospital.” In Biomedical Engineering Systems and Technologies, 425–438. New York, NY: Springer Nature.
- O'Donovan, P., K. Leahy, K. Bruton, and D. T. J. O'Sullivan. 2015. “An Industrial Big Data Pipeline for Data-driven Analytics Maintenance Applications in Large-scale Smart Manufacturing Facilities.” Journal of Big Data 2 (1): 25. doi: 10.1186/s40537-015-0034-z
- Park, Chang Mok, Sangchul Park, and Gi-Nam Wang. 2009. “Control Logic Verification for an Automotive Body Assembly Line Using Simulation.” International Journal of Production Research 47 (24): 6835–6853. doi: 10.1080/00207540802350716
- Partington, Andrew, Moe Wynn, Suriadi Suriadi, Chun Ouyang, and Jonathan Karnon. 2015. “Process Mining for Clinical Processes.” ACM Transactions on Management Information Systems 5 (4): 1–18. doi: 10.1145/2629446
- Process Mining Workbench. 2017. Last accessed April 3, 2017. http://www.promtools.org/doku.php.
- Rojas, Eric, Jorge Munoz-Gama, Marcos Sepúlveda, and Daniel Capurro. 2016. “Process Mining in Healthcare: A Literature Review.” Journal of Biomedical Informatics 61: 224–236. doi: 10.1016/j.jbi.2016.04.007
- Rozinat, A., and W. M. P. van der Aalst. 2006. “Conformance Testing: Measuring the Fit and Appropriateness of Event Logs and Process Models.” In Proceedings of the Third International Conference on Business Process Management, BPM'05, 163–176. Berlin: Springer. doi:10.1007/11678564_15.
- Sequence planner. 2019. “Sequence Planner.” https://github.com/kristoferB/SP.
- Siddiqa, Aisha, Ibrahim Abaker Targio Hashem, Ibrar Yaqoob, Mohsen Marjani, Shahabuddin Shamshirband, Abdullah Gani, and Fariza Nasaruddin. 2016. “A Survey of Big Data Management: Taxonomy and State-of-the-art.” Journal of Network and Computer Applications 71: 151–166. http://www.sciencedirect.com/science/article/pii/S1084804516300583. doi: 10.1016/j.jnca.2016.04.008
- Smeenk, Wouter, Joshua Moerman, Frits Vaandrager, and David N. Jansen. 2015. “Applying Automata Learning to Embedded Control Software.” In Formal Methods and Software Engineering, edited by M. Butler, S. Conchon, and F. Zaïdi, 67–83. Cham: Springer.
- Steffen, Bernhard, Falk Howar, and Maik Merten. 2011. “Introduction to Active Automata Learning from a Practical Perspective.” In International School on Formal Methods for the Design of Computer, Communication and Software Systems, edited by M. Bernardo, and V. Issarny, 256–296. Berlin: Springer.
- Tao, Fei, Jiangfeng Cheng, Qinglin Qi Meng Zhang, He Zhang, and Fangyuan Sui. 2018a. “Digital Twin-driven Product Design, Manufacturing and Service with Big Data.” The International Journal of Advanced Manufacturing Technology 94 (9): 3563–3576. doi: 10.1007/s00170-017-0233-1
- Tao, Fei, Fangyuan Sui, Ang Liu, Qinglin Qi Meng Zhang, Boyang Song, Zirong Guo, Stephen C.-Y. Lu, and A. Y. C. Nee. 2018b. “Digital Twin-driven Product Design Framework.” International Journal of Production Research 57: 3935–3953. doi:10.1080/00207543.2018.1443229.
- Theis, Julian, Ilia Mokhtarian, and Houshang Darabi. 2019. “Process Mining of Programmable Logic Controllers: Input/Output Event Logs.” CoRR. abs/1903.09513. http://arxiv.org/abs/1903.09513.
- Theorin, Alfred, Kristofer Bengtsson, Julien Provost, Michael Lieder, Charlotta Johnsson, Thomas Lundholm, and Bengt Lennartson. 2017. “An Event-driven Manufacturing Information System Architecture for Industry 4.0.” International Journal of Production Research 55 (5): 1297–1311. doi: 10.1080/00207543.2016.1201604
- van der Aalst, Wil. 2011. Process Mining: Discovery, Conformance and Enhancement of Business Processes. Vol. 2. Berlin: Springer Nature.
- van der Aalst, Wil M. P. 2013. “Business Process Management: A Comprehensive Survey.” ISRN Software Engineering 2013: 1–37. doi: 10.1155/2013/507984
- Van Der Aalst, W. M., H. A. Reijers, A. J. Weijters, B. F. van Dongen, A. A. De Medeiros, M. Song, and H. M. W. Verbeek. 2007. “Business Process Mining: An Industrial Application.” Information Systems 32 (5): 713–732. doi: 10.1016/j.is.2006.05.003
- Viale, Pamela, Claudia Frydman, and Jacques Pinaton. 2011. “New Methodology for Modeling Large Scale Manufacturing Process: Using Process Mining Methods and Experts' Knowledge.” In 2011 9th IEEE/ACS International Conference on Computer Systems and Applications (AICCSA), 12.
- Yahya, Bernardo Nugroho. 2014. “The Development of Manufacturing Process Analysis: Lesson Learned From Process Mining.” Jurnal Teknik Industri 16 (2): 97–108. doi: 10.9744/jti.16.2.95-106
- Yang, Hanna, Minjeong Park, Minsu Cho, Minseok Song, and Seongjoo Kim. 2014. “A System Architecture for Manufacturing Process Analysis Based on Big Data and Process Mining Techniques.” In 2014 IEEE International Conference on Big Data (Big Data), 10.
- Yin, Yong, Kathryn E. Stecke, and Dongni Li. 2018. “The Evolution of Production Systems from Industry 2.0 Through Industry 4.0.” International Journal of Production Research 56 (1–2): 848–861. doi: 10.1080/00207543.2017.1403664
- Zhang, Lei, Xuening Chu, Hansi Chen, and Bo Yan. 2019. “A Data-driven Approach for the Optimisation of Product Specifications.” International Journal of Production Research 57 (3): 703–721. doi:10.1080/00207543.2018.1480843.
- Zhong, Ray Y., Chen Xu Chao Chen, and George Q. Huang. 2017. “Big Data Analytics for Physical Internet-based Intelligent Manufacturing Shop Floors.” International Journal of Production Research55 (9): 2610–2621. doi: 10.1080/00207543.2015.1086037