
 ?Mathematical formulae have been encoded as MathML and are displayed in this HTML version using MathJax in order to improve their display. Uncheck the box to turn MathJax off. This feature requires Javascript. Click on a formula to zoom.
Abstract
While many supply chain decisions could take advantage of big data, firms struggle with investments into supply chain analytics since they are not able to assess the application areas and benefits of these initiatives. In this paper, we provide a multi-level perspective to assess the value of supply chain data. We develop a framework that highlights the connections between data characteristics and supply chain decisions with different time horizons (i.e. short- or long-term) as well as different supply chain levels (i.e. individual-firm level or supply-chain level). As data gets more complex in one or more of the 4 V dimensions (i.e. volume, variety, velocity, veracity), firms must assess how to best take advantage of the opportunities offered. We use the Dutch floriculture sector as a case study for our framework in which we highlight four data analytics applications to improve logistics processes. In the applications, we demonstrate how the data is used to support the decisions at different time horizons and supply-chain levels. We find that each of the big data’s Vs is required differently according to the decisions’ characteristics. Based on the findings, applications in other industries and promising directions for future research are discussed.
1. Introduction
For many decades, various types of data have been used for supply chain decision-making. Kuo and Kusiak (Citation2019) conducted an extensive review on how the usage and role of data have evolved from 1961 to 2013. The authors indicate that between 1961 and 1999, data were mainly used to estimate parameters of analytical models, whereas from 2000, the role has shifted toward the discovery of meaningful patterns to support data-driven decision-making. Especially during the last decade, the maturing field of social media, the developments in e-commerce, and advances in data collection technologies such as tracking and sensing devices have significantly changed the shape and role of data in supply chain practice and research (Arunachalam, Kumar, and Kawalek Citation2018; Gawankar, Gunasekaran, and Kamble Citation2020). Data used in supply chains has increased sharply not only in Volume, i.e. amounts of data being collected and processed, but also in Velocity, i.e. the speed of data generation and streaming, and Variety, i.e. data types and sources (Wamba et al. Citation2020; Chehbi-Gamoura et al. Citation2020). This phenomenon has resulted in the widely discussed term big data. Veracity (referring to accuracy) and Value (referring to realising the benefits) are the other two Vs mentioned in the literature that link big data to decision-making in supply chains (Zhong et al. Citation2016).
Scholars and practitioners seem to agree on the vast opportunities offered by big data for improvements in supply chain processes (Gupta, Modgil, and Gunasekaran Citation2020; Hoberg Citation2020). The eagerness around big data has encouraged firms to move forward with big data strategies or risk lagging behind in the competition with rival firms (Richey et al. Citation2016; Frizzo-Barker et al. Citation2016). However, these initiatives often involve substantial investments into infrastructure that captures, stores, and streams big data and in human resource (analytics) capacity to manage and make use of big data (Schoenherr and Speier-Pero Citation2015). As a result, it is not uncommon to see firms of all sizes struggle with these investment decisions because examining the expected benefits, i.e. the value of big data, is complicated (Kamble and Gunasekaran Citation2020). In fact, many big data projects generated disappointing returns on investment according to a survey by Gartner in 2016 (Grover et al. Citation2018). Therefore, structured methods to identify and assess the expected value of big data are essential to help firms understand and rethink their big-data investment decisions.
The extant literature provides different perspectives to assess the value of big data in supply chain decision-making. Brinch (Citation2018) conducts a content-analysis-based literature review and proposes a conceptual big data supply chain management framework with three dimensions of value discovery, value creation, and value capture. The author suggests that the value creation of big data depends on the ability to utilise the information generated from the big data for strategic or operational decision-making. Kamble and Gunasekaran (Citation2020) present an extensive review on performance measurement systems for the big data-driven supply chain. The authors stress the importance to combine performance measures from different dimensions such as cost vs non-cost and quantitative vs qualitative. Grover et al. (Citation2018) reason that the value of big data is created through the combination of insight generation and its actual use in specific business decisions. The authors introduce a framework of strategic value creation by big data analytics that links big data analytics to six value creation mechanisms, i.e. transparency and access, discovery and experimentation, prediction and optimisation, customisation and targeting, learning and crowdsourcing, and continuous monitoring and proactive adaptation. Also by connecting big data and decision making, Zhan and Tan (Citation2020) propose a five-stage analytic infrastructure for harvesting big data to enhance supply chain performance. The authors particularly emphasise the last stage in which multiple pieces of information generated from different data sources are put together to drive various options for decision-making.
From a supply chain decision-making perspective, our study aligns with the above-mentioned frameworks. To complement these frameworks, we focus on the primary elements: the connections from data via information to supply chain decisions. The objective of our paper is to highlight how data and big data can be linked to different supply chain decisions and to show how the approach to utilise big data in supply chain decision-making should be adapted from that of (small) traditional data. For these purposes, we present a multi-level framework based on a data-information-decision perspective. The framework stresses the underlying connections within data characteristics, information characteristics, and multi-level decision characteristics. Accordingly, firms in the transition from data to big data can identify essential elements so that they can avoid missing business opportunities and unnecessary investments in inessential elements.
Next, we apply the framework using an extensive case study in the Dutch floriculture sector. This case study focuses on the data-driven multi-level supply chain decision making to overcome logistics challenges in the sector. We present four applications to demonstrate how data are used in very different supply chain decisions. The applications have been chosen in line with the framework to highlight the different time horizons of supply chain decisions (i.e. short- or long-term) as well as different supply chain levels (i.e. individual-firm level or supply-chain level). Understanding the multi-level value of data reinforces the commitment of bottom-up timely and accurate data contributions from firms in the supply chains.
The rest of the paper is organised as follows. Section 2 introduces the multi-level framework. Section 3 describes the case study and highlights how the framework is applied to connect the data to the supply chain decisions. Section 4 presents in detail the analytics applications. Section 5 discusses how the framework can be applied in different industry contexts. Section 6 concludes our study and discusses future research directions.
2. The multi-level framework from the data-information-decision perspective
The framework is constructed from three elements: data/big data, information, and supply chain decisions. Data are patterns without meaning and data becomes information after being interpreted for a decision-making purpose (Lumsden and Mirzabeiki Citation2008). When data increases to big data, Fosso Wamba et al. (Citation2019) reports that while evaluating the business value of big data, it is essential to analyse how big data can be translated into better information and enhanced information characteristics such as information completeness, timeliness, and accuracy. Through decision-making, actionable information is turned into decisions to improve supply chain processes (Grover et al. Citation2018; Zhan and Tan Citation2020). Different types of information with different characteristics can become relevant and useful to different supply chain decisions (Janssen, van der Voort, and Wahyudi Citation2017; Viet, Behdani, and Bloemhof Citation2018a). Consequently, assessing the value of data/big data requires the understanding of the connections within data/big data, the information derived from the data/big data, and supply chain decisions.
In the framework shown by Figure , we argue that the connections within data/big data, information, and supply chain decisions are determined by the associations among data characteristics, information characteristics, and decision characteristics. Decision-makers need to look for data, information and decisions that match in characteristics because a decision with specific decision characteristics requires data and information with specific characteristics (Jonsson and Myrelid Citation2016; Viet, Behdani, and Bloemhof Citation2018a). The following paragraphs elaborate the data characteristics, information characteristics, and decision characteristics.
Figure 1. The multi-level framework based on the data-information-decision perspective.
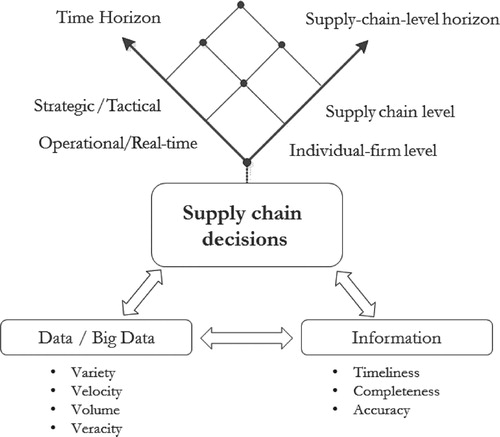
Data. Data is the foundation of all decision-making and is often characterises by the different Vs, i.e. volume, variety, velocity, and veracity (Govindan et al. Citation2018). As descriptive, predictive, and prescriptive models for supply chain decision-making take advantage of more and more aspects of the 4Vs, we refer to this as a transformation from data to big data. Decisions are possible made using data with larger datasets from heterogeneous sources in a real-time manner (Choi, Wallace, and Wang Citation2018). Big data’s 4Vs enhance information characteristics, which make the information relevant and useful to broader supply chain decisions that are not considered before.
Information. As information is the output of data processing, information characteristics are linked to data characteristics. Following Hazen et al. (Citation2014), the essential characteristics in decision-making are referred to as timeliness, completeness, and accuracy.
Timeliness indicates how well the information meets its user’s demands in a particular time and space. Regarding information timeliness, big data are captured from various supply chain processes in real-time in many cases (Kim, Kim, and Park Citation2017; Kaur and Singh Citation2017; Singh et al. Citation2018). This enables the generation of information for smaller intervals and at a higher frequency. Recently, the ‘digital supply chain twin’ concept based on real-time supply chain data/information has increasingly attracted research attention (Ivanov and Dolgui Citation2020).
Completeness refers to the breadth and depth levels of information granularity. With regard to information completeness, big data can improve the depth (i.e. more granular) and broaden the breadth of the information (i.e. from intra-organisational to inter-organisational) (Winkelhaus and Grosse Citation2020). For instance, tracking and tracing systems can be implemented at a smaller unit level (e.g. truck level to batch level) and for a wider scope covering more participating supply chain firms (Dai, Ge, and Zhou Citation2015). The same trend applies to inventory and resources tracking on a manufacturing shop floor and warehouses and significantly improves the level of information detail (Zhong et al. Citation2017; Fang et al. Citation2020).
Accuracy defines how the information reflects the underlying reality. Concerning information accuracy, data capture by tracking and sensing devices can offer a higher level of data and information accuracy. Many types of data that were previously inaccessible or inaccurate due to economic or technical reasons become available and reliable. Examples include massive data on traffic conditions from sensors (Li et al. Citation2015), massive data on speed in urban areas (Ehmke, Campbell, and Thomas Citation2016), and networked sensor data (Li and Wang Citation2017; Coronado Mondragon, Coronado Mondragon, and Coronado Citation2020). Readers are referred to Viet, Behdani, and Bloemhof (Citation2018a) for an extensive review on the impact of information characteristics on the value of information in supply chain decision-making.
Supply chain decisions. We distinguish supply chain decision making into two dimensions: the time horizon and the supply chain level.
The supply chain literature commonly defines decisions on the strategic, tactical, and operational time horizon. Concerning the time horizon, for simplicity, two groups are specified for long-term (i.e. strategic and tactical) and short-term (i.e. operational and real-time) following Wang et al. (Citation2016). While long-term decisions (e.g. supply chain network design) typically have stronger financial implications, short-term decisions (e.g. weekly/daily production planning) are typically done much more frequently. With regard to decision characteristics, the current literature reports many big-data enabled decisions that address short-term process improvements with the aim of long-term values in the future (Richey et al. Citation2016; Kuo and Kusiak Citation2019).
The supply-chain-level horizon includes the individual-firm level and the supply-chain level. Decisions at the supply-chain level involve multiple firms and concern the coordination and collaboration in supply chain processes (Hazen et al. Citation2016; Kiil et al. Citation2019). With regard to the supply-chain-level horizon, the current literature has focused on exploiting the value of big data to improve processes only within individual chain firms (Barbosa et al. Citation2018). However, with improved information characteristics, especially information completeness, decision-makers are able to consider decisions that involve multiple firms in either vertical or horizontal relationships. Based on well-established theories, such as actor network theory and resource dependence theory, Hazen et al. (Citation2016) suggest that big data can upgrade interconnected supply chain processes toward higher efficiency, effectiveness, and sustainability. Consequently, the value of big data at both individual-firm level and supply-chain level should be investigated.
In the following, we aim to apply the framework in the Dutch floriculture sector. In particular, we would like to highlight four decisions with different time horizons (i.e. short- or long-term) as well as different supply chain levels (i.e. individual-firm level or supply-chain level).
3. Exploring the value of data in the Dutch floriculture sector
This section first describes the logistics processes and challenges and the increasing data in the Dutch floriculture sector. Subsequently, the multi-level framework is applied to assess the potential value of the data.
3.1. Case description
The Dutch floriculture sector is a vibrant sector with a long tradition. It consists of approximately 6000 (inter)national small, medium, and large suppliers (i.e. growers), 2500 customers (i.e. wholesalers, exporter, retailers), 70 logistics service providers (LSPs), and five auction and distribution sites (RoyalFloraHolland Citation2019). Among these actors, Royal FloraHolland (RFH) plays a key role in the auction and logistics processes.
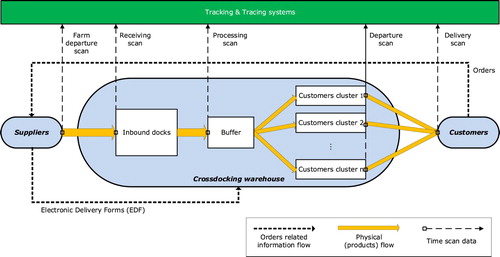
There are two major types of physical flows in the network. Auction flows are for products sold via auction clocks. Direct flows refer to products sold via direct transactions between suppliers and customers. The volume of direct flows has increased substantially in the last 5 years to approximately 57% of sales volume in 2017 (RoyalFloraHolland Citation2019). The case study in this paper is about the logistics processes of direct flows. RFH has five cross-docking facilities located in different supplier regions and offers cross-docking distribution for direct flows. Figure depicts the logistics processes.
Figure 2. Physical and information flows in the logistics processes of direct flows.
3.1.1. Data flows
3.1.1.1. Orders and electronic delivery forms
Customers send orders to suppliers via an online trading platform. Suppliers send ordered products in trolleys to RFH cross-docking. To facilitate the cross-docking service, information flows must move ahead of physical flows (Buijs, Danhof, and Wortmann Citation2016). Suppliers are required to send an electronic delivery form (EDF) for each order, in advance to trolley arrivals, stating supplier information, product quantity, and delivery destination.
3.1.1.2. Tracking and tracing systems
As a step toward supply chain virtualizstion (Verdouw, Beulens, and van der Vorst Citation2013), radiofrequency identification (RFID)-enabled tracking and tracing systems have been implemented since 2016. Suppliers and customers have access to the systems to trace product location at the trolley level. Trolley scans are made at the following points: departing from suppliers (farm departure scan), arriving at inbound docks (receiving scan), processing at the buffer (processing scan), departing from customer clusters (departure scan), arriving at customer boxes (delivery scan). The farm departure scan began in November 2017 as a pilot project, and data from that are currently limited.
3.1.1.3. Data to big data
The data in this case study concern the data of direct flows including (i) historic and real-time EDF data of direct flows and (ii) the scan data captured at all stages in the supply chain network. The direct-flows data increases rapidly with regard to volume, variety, and velocity dimensions due to the increasing number of daily transactions among a huge number of suppliers and customers, and also due to the broader implementation of tracking and tracing across the sector. Section 3.3 assesses the potential value of this big data.
3.1.2. Physical flows
Suppliers send ordered products by trucks to RFH. The transport is executed by LSPs or by the suppliers themselves as first-/second-party logistics (1PL/2PL). Around 30% of Dutch suppliers are 1PLs. RFH is responsible for distributing the trolleys to customers within 1 h from the receiving point at inbound docks. Trolleys arriving at RFH at the weekend or outside 04.00–16.00 h on weekdays are not bound to the time constraint. The case study concerns only the trolleys with a 1-hour limitation. Different from traditional cross-docking where products are brought from inbound to outbound trucks, in this case unloaded trolleys are moved to a processing buffer. From the buffer, trolleys are moved to different customer clusters. From the clusters, tractor drivers transport the trolleys to the customer boxes (5–10 min driving).
3.2. Logistics challenges
The following sections describe the major logistics challenges for suppliers and RFH where the potential decisions enabled by the big data can be made to create business value.
3.2.1. Suppliers
Customers in general agri-food supply chains increasingly order small quantities of diverse products and even with small required lead times (Viet, Behdani, and Bloemhof Citation2018b). In the Dutch sector, less-than-full trolley orders and 4-hour order lead times have become a new normal. To meet the short delivery time, the Dutch 1PL/2PL suppliers have to load and dispatch their trucks as soon as the products are ready. Therefore, they do not have enough time to effectively consolidate multiple less-than-truckload orders. Similarly, time-related difficulties also arise for the LSPs in scheduling trucks to pick up multiple less-than-truckload loads. This leads to low truck utilisation and a high number of truck movements in the areas around the Dutch floricultural greenhouses (de Keizer et al. Citation2015). In-time delivery and higher truck utilisation (thus lower transportation cost) are the challenges for suppliers.
3.2.2. Cross-docking operators
To assure 1-hour delivery, cross-docking operators must schedule an appropriate number of workers at each distribution stage per time period. Ladier and Alpan (Citation2016) show that workforce scheduling is actually the most significant problem for cross-docking managers. Uncertainty about the volume and timing of inbound arrivals and a broad range of operating hours complicate workforce scheduling. Cross-docking terminals often require suppliers to provide information on estimated product arrival time to proactively schedule the necessary workforce (van der Spoel, Amrit, and van Hillegersberg Citation2017). However, Van Belle, Valckenaers, and Cattrysse (Citation2012) indicate that in real-life situations, there are serious deviations between the estimated and actual information. Thus, predictive models play a crucial role in cross-docking workforce scheduling. In the Dutch sector, the estimated arrival time of trucks is not even available in the EDFs. This causes high uncertainty about the inbound flows and makes workforce scheduling a big challenge.
3.3. The potential value of big data to overcome logistics challenges
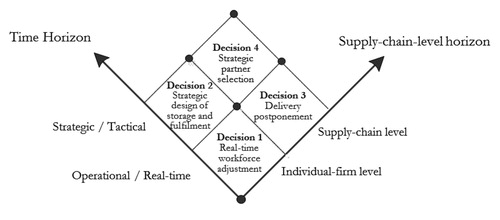
Using the framework, the big data are mapped to potential decisions that can help Dutch firms to overcome their logistics challenges. The focus is on how these decisions become possible with the increasing data. The decisions are organised following the two-dimensional decision structure in Figure . Subsection 3.3.1 and 3.3.2 discuss the decisions at the individual-firm level and supply-chain level correspondingly. Both short-term and long-term decisions are addressed for each level.
Figure 3. Case study's four decisions following the multi-level framework.
3.3.1. Individual-firm level
The increase in data at individual suppliers is limited compared with the amount of aggregate data at cross-docking. This subsection focuses on the RFH cross-docking.
Decision 1: Real-time workforce adjustment (short-term). The current challenge for cross-docking is workforce scheduling. The literature provides workforce scheduling models that address strategic/tactical scheduling (Bard Citation2004; Defraeye and Van Nieuwenhuyse Citation2016) and daily scheduling with fluctuations in demand volume and arrival time (Lusa, Corominas, and Muñoz Citation2008; Steinker, Hoberg, and Thonemann Citation2017). For these levels of demand aggregate, the added values of big data are not clear because traditional approaches are still applicable. The major contribution of big data, as discussed by See-To and Ngai (Citation2018), is the capability to enable ‘nowcast’ with acceptable accuracy to support real-time workforce adjustment decisions. According to two recent literature review articles on cross-docking logistics, i.e. Ladier and Alpan (Citation2016); Van Belle, Valckenaers, and Cattrysse (Citation2012), real-time big data predictive applications for cross-docking decisions are limited but highly necessary to support regular real-time decision-making. Section 4.1 presents a big-data predictive model using historical time scan data, and historical/real-time EDF data to forecast the inbound volume at a smaller time horizon, i.e. hourly, to support real-time workforce adjustment decisions. In the application, the big data’s variety, velocity, and veracity (i.e. reliable historical time scan data, real-time and historical EDF data from all suppliers) help to improve the timeliness and accuracy of forecast information.
Decision 2: Strategic design of storage and fulfilment (Long-term). Big data improve the insights into business activities in the sector. Accumulated EDF data allow RFH to rethink their role in the sector and provide new services. A new service concerning the temporary storage and fulfilment by cross-docking is introduced as follows.
Short order lead times and frequent small orders lead to low truck utilisation, limited delivery time windows, and high daily truck movements. In addition, buyers often order the same products every day or even at two different periods in the same day. A potential strategy for suppliers is to pre-ship their products to temporary storage facilities at RFH cross-docking, from where near-future orders can be fulfilled directly. The pre-ship strategy is also known as anticipatory shipping in the literature (Viet, Behdani, and Bloemhof Citation2020).
RFH needs to decide on storage and process redesigns to facilitate the pre-ship strategy. The historical data can support this strategic decision. Having detailed EDF data at the product level from thousands of suppliers, RFH can use the data to estimate the storage and fulfilment demands for each supplier and the aggregate demand for the whole supply chain network. In this decision, the volume and variety of the data improve the completeness of the information on potential suppliers for the new service. Section 4.2 presents the analytics to support this strategic decision.
3.3.2. Supply-chain level
At the supply-chain level, the value of the big data are linked to decisions that facilitates the coordination and collaboration among the Dutch firms.
Decision 3: Delivery postponement (short term). At the operational/real-time decision-making level, the value of the data are created through better supply chain visibility, which enables effective and efficient process coordination. Two specific coordination issues are identified.
First is the coordination between suppliers and the cross-docking with regard to inbound scheduling (i.e. truck scheduling/sequencing and truck-to-door assignment). When the farm departure scan is implemented network-wide, dynamic inbound scheduling becomes more efficient with real-time updated truck departure times and real-time estimated truck arrival times. The important big data characteristics in this coordination are velocity, i.e. real-time time scan data. The data velocity can enhance the timeliness of information on the inbound flows. This type of operational decision has been studied in the literature, see for examples studies by Larbi et al. (Citation2011), Maknoon, Soumis, and Baptiste (Citation2017), and Ladier and Alpan (Citation2018).
Second is the coordination between cross-docking and customers. Cross-docking aims to distribute all inbound trolleys within 1 h. However, in many circumstances, customers do not have enough capacity (e.g. conditioned storage, workers) to hold and process a high volume of products arriving in a short time, which results in long trolley queue in front of the boxes and then quality decay occurs. Cross-docking can postpone the delivery when the customer boxes are fully occupied. This not only helps to avoid quality decay of the product but also provides more time to distribute other trolleys, which can improve the service level of the distribution processes. This type of coordination can be facilitated by timely communication between numerous customers and cross-docking operators, and real-time trolley scan data at inbound docks. The key characteristics here are data velocity, information timeliness, and information completeness. Section 4.3 describes a coordination system based on tracking and tracing and a simulation to demonstrate the benefit resulting from coordination.
Decision 4: Strategic partner selection (long-term). At the strategic decision-making level, the data can support the horizontal collaboration in transportation among the Dutch suppliers.
Horizontal collaboration in transportation is a promising method to improve truck utilisation, reduce transportation costs, and increase service level (Cruijssen, Cools, and Dullaert Citation2007). At the network level, collaboration reduces the workload at the consecutive supply chain stage (i.e. truck docking at cross-docking), reduces truck movements and road congestion, and improves the sustainability of the sector. Many unsuccessful attempts by the Dutch 1PL/2PL suppliers were made to collaborate horizontally on sharing truck capacities, i.e. on the way to RFH, supplier A picks up the products of supplier B if the truck is not full. In 2017, RFH conducted interviews with the suppliers to gain insights into the factors that hindered the collaboration. Time limitations and limited information on potential parties to collaborate were identified as the two determinant factors.
The missing information on potential parties with strategic fit for collaboration and the time limitation can be tempered using historical tracking data. To answer the question ‘with whom to collaborate’, several dimensions can be used to measure the fitness, including company characteristics, companies’ internal processes, external parameters, geographic and cultural similarities (Naesens, Gelders, and Pintelon Citation2009). In this case study, the time dimension is crucial. Due to the short delivery time window, suppliers need to know who the specific suppliers are whose products frequently share the same delivery time windows as their products to establish an effective and efficient collaborating protocol. Section 4.4 introduces descriptive analytics using historical tracking data to discover sets of strategic-fit suppliers who can potentially collaborate with each other. It is important to have data on numerous suppliers in the analytics. In this application, the volume and variety of the big data help to improve the information completeness.
3.3.3. Summary of the decisions
Table summarises the four decisions across all different dimensions. In all the decisions investigated, the variety (i.e. data sources, data types) is required to improve the information characteristics. In the decisions involving multiple supply chain actors, information completeness, i.e. the coverage of the information, becomes critical. Another observation is that not all big data’s 4Vs are necessarily required in every decision. Specific decisions appreciate specific big data characteristics. The next section presents the analytics models that support the four decisions.
Table 1. Characteristics of the decisions and their connections with big data characteristics and information characteristics.
4. Four analytics applications to support logistics decisions in the Dutch floriculture sector
This section includes four parts that describe the analytics models to support the four decisions summarised in Table . All the analytics work was implemented in Python using CORE i5 computer. Through each part, readers can see how the data are transformed and used in the descriptive, predictive, and prescriptive models, and especially how and which data and information characteristics are linked to the decision characteristics.
4.1. Real-time workforce adjustment at cross-docking
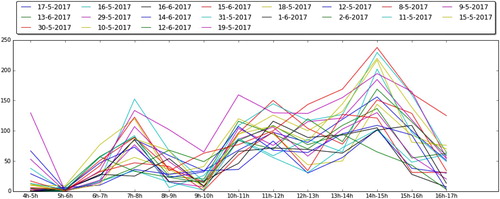
The major challenge in daily workforce planning is to schedule the right number of employees at the peak hours. The historical data in Figure (units: trolleys) reveals four frequent peaks at 07.00, 10.00, 11.00, and 14.00 h. However, the inbound volumes at these peaks vary widely, which causes difficulty in determining the required workforce. Taking the peak at 14.00 h for example, it is usually the highest and the most fluctuating with a mean of 158 trolleys and standard deviation of 55 trolleys. This deviation can result in the difference of workers. The operator needs a timely forecast with acceptable errors, i.e. information timeliness and accuracy, on how many trolleys will arrive between 14.00 and 15.00 h. For demonstration purpose, the modelling aim is formulated specifically for the peak at 14.00–15.00 h as ‘to forecast the arrival volume between 14.00 and 15.00 h given the forecasting moment at 13.00 h, assumed that 1 h is enough to request additional employees (e.g. from the auction department)’.
Figure 4. Inbound volume per hour in high season.
4.1.1. kNN-based forecasting model
The k nearest neighbours (kNN) algorithm is selected because it is intuitive and easy to communicate model parameters and output. The algorithm searches in historical databases for k dates that share the highest similarity with the target date and use those dates as references for calculating the forecast (Wu et al. Citation2008). The following explains the most important features of the kNN model.
4.1.1.1. Similarity function
The historical time scan data help to trace backward the EDF registration time of trolleys arriving between 14.00 and 15.00 h. It is observed that most of the 14.00-15.00 trolleys have been registered in the EDF database within 7 h before their arrivals. As the decision-making moment is at 13.00 h, the total registered volume per hour in the EDF database from 06.00 to 13.00 h are selected to model the similarity function, denoted as . A non-weighted Euclidian-distance-based similarity function
between two dates
and
is defined as
. The smaller
is, the more similar two dates
and
are. The model selects the
most similar dates to the target date
, denoted as
.
4.1.1.2. Model training
The value of impacts the forecast accuracy. Moreover, similarly to overfitting issue in regression models, using a fixed
is not effective due to the seasonality and trends in floriculture supply chains. Therefore, for each specific target date
, a specific value of
is used. The process of looking for the best parameter
is called ‘model training’. A training set is required for this purpose. The arrival volume per hour (Figure ) depends on the week day, especially Monday and Friday. As a result, the selection of
days for the training set follows the approach below:
If
is a Monday or a Friday,
Otherwise,
Given a training set, possible values of are tested. The value that generates the highest forecast accuracy, i.e. the lowest mean of absolute errors (MAE), is selected.
4.1.1.3. Target dimension calculation
The target dimension of the target date is estimated as a ratio
of the total volume registered via EDF from 06.00 to 13.00 h as
. The ratio
is estimated as the average of the
ratios of the
selected dates
, as
. Detailed steps of the forecast model is described in Algorithm 1.
Table
4.1.2. Results and discussion
The model is tested for two months of May and June. This period includes weeks of both high, shoulder, and low season. Regarding computational time, less than 2 s was required to generate the forecasts for the whole period with different sizes of training sets. Table presents the MAE measured in number of trolleys, ranging from 16.1 to 20.1 trolleys. Because the employee productivity is around 25–30 trolleys per hour, the MAEs are translated to the exact number or only different from the actual required workers. These small forecast errors helps to reduce the labour costs and maintain the service level.
Table 2. Forecasting results by MAE (number of trolleys).
The best model (in italic) uses . This set includes both small and high values of
, which improves the flexibility of the model in choosing the parameter for capturing trends and seasonality. Additionally, it is observed that the most immediate dates, i.e.
, represent better the target date. Other heuristic approaches can also be used to calculate the similarity function and target dimension. Data mining algorithms such as support vector machines or neural networks may improve forecast accuracy. However, these algorithms are constrained by interpretability of the model output. Given the intuitiveness, the forecast accuracy, and the fast computation, the kNN model is able to support the real-time workforce adjustment decision.
As seen in the modelling process, the timeliness and accuracy of the forecast information rely on the real-time and historic EDF data from all the suppliers, i.e. data velocity and variety, and the reliable historic time scan data, i.e. data veracity. These data requirements are usually satisfied in most of today’s cross-docking warehouses.
4.2. Strategic design of storage and fulfilment services at cross-docking
Using the historical EDF data, RFH can identify potential suppliers for the pre-ship strategy and accordingly estimate the aggregate demand for storage and fulfilment services. In detail, RFH needs to perform a descriptive analysis for each supplier. The aim is to identify a list of products that are frequently ordered (i.e. every day) by customers located from the same cross-docking destination. This can be done using the time-base association rule analysis.
4.2.1. Time-based association rule analysis
The EDF does not include the detailed timing but the product, customer, and date of the order. A EDF data point can then represent a customer order. The association rule among the orders is defined as ‘if an order of product X to a cross-docking Y is received on date , the consecutive order of X to Y is received by date
’. By using
, the rule imposes a limitation on the inter-arrival time of orders, which is required to reduce the potential spoilage in perishable supply chains. Depending on the quality decay characteristics of products, different values of
can be used, e.g. 1 or 2 days.
The aim of the analysis is to locate the product X that satisfies the rule with a predetermined threshold of confidence. Details of the analysis for a supplier is shown in Algorithm 2.
A relevant question for the pre-ship strategy is ‘what to do if the pre-shipped products are not ordered after, for example, one day?’. In the setting of the Dutch sector, pre-shipped products can be registered for auction channel after a predefined time period. Nevertheless, selecting a high confidence level helps to temper this undesirable outcome. Especially for potted ornamental plants with slow quality decay rate, can be extended to 2 or 3 days instead of 1 day and the corresponding confidence levels can be set higher.
Table
4.2.2. Numerical example
For demonstration to RFH, the analysis of the historical EDF data are performed for a large-size supplier A. The same analysis is applicable to other suppliers. Supplier A supplies 194 different types of products to two RFH cross-docking centres, CD1 and CD2, from January to June 2017. The time limitation was set at 1 day. The confidence level for all six 1-month periods was set at 80%. Instead of one 6-month period, six 1-month periods are adopted to provide further insights into the robust suitability over time of products for pre-shipping strategy and also the seasonal effects.
Table shows the results. 12 product types meet the rule and confidence conditions for CD1 and their volume accounts for 39% of the total ordered volume (received by supplier A) for CD1. 12 product types do so for CD2 and their volume accounts for 49% of the total ordered volume. Moreover, 9 types satisfy the rule and the predetermined confidence for both cross-docking destinations. The high volumes of these products indicate a high potential for these products to be included in the pre-shipping strategy. These numerical results suggest that supplier A is a promising client for the new storage and fulfilment service by RFH.
Table 3. Confidences in percentage for selected products supplied to CD1 and CD2.
4.2.3. Discussion
The information obtained from the association rule analysis can serve as hard proof in communication with suppliers about the strategic new service of storage and fulfilment. This information allows the suppliers to realise if the pre-shipping strategy is suitable to their products. Because RFH needs to perform the analysis to extract the information for each supplier, i.e. information completeness, RFH is required to use the historical EDF data of all the suppliers for a long time period, i.e. data volume and variety.
4.3. Delivery postponement in real-time processes coordination
An effective coordination requires effective real-time data and information sharing between the involved actors (Thomas et al. Citation2015). In this case study, a coordination system for data streaming and information sharing between customers and cross-docking is presented and the coordination’s benefit is assessed using a discrete-event simulation model.
4.3.1. A coordination system based on tracking and tracing
A real-time coordination system based on tracking and tracing systems is used to coordinate the delivery processes from cross-docking to the customer boxes.
The tracking and tracing systems, based on real-time receiving and processing scan data, provide customers with real-time information on the arrival timing and quantity of trolleys in their orders. Using this timely information, customers can estimate the time and volume of trolleys arriving at their boxes. In case of expected insufficient capacity, customers can directly send signals to postpone the delivery to the cross-docking operator. Accordingly, the corresponding trolleys can be marked as postponed delivery at the corresponding customer clusters (Figure. ) and (if necessary) moved to the postponed delivery buffer. As soon as signals to resume delivery are received from customers, cross-docking workers can resume the delivery of these trolleys.
4.3.2. A discrete-event simulation to assess the benefit of coordination
Using the coordination system, customers can actively smooth out the trolley arrival process at their boxes. Consequently, it is easy to see that product quality can be maintained and congestion at boxes can be avoided. Moreover, coordination can potentially improve the internal distribution processes within cross-docking. Postponing a delivery means more time is available to expedite another delivery. A discrete-event simulation model was built using Enterprise Dynamics 9 (EnterpriseDynamics Citation2019) to examine the potential improvement. The model is described in the following.
4.3.2.1. Conceptual model
The entire distribution system is modelled at the aggregate level. The inbound volume is divided into two streams. The first stream goes to Customer Cluster 1, whose box has sufficient capacity. The second stream goes to Customer Cluster 2, whose box has limited capacity. Customer Cluster 2 is the actor involved in the coordination system. The delivery to Customer Cluster 2 is postponed when the box’s status is marked full, and the delivery is resumed when the box becomes less than full. Thus, trolleys do not have to queue outside the box of Customer Cluster 2.
4.3.2.2. Key performance indicator
Because the simulation aims to examine the effect of the coordination system on the internal distribution process, the key performance indicate (KPI) is defined as the percentage of inbound trolleys for Customer Cluster 1 that are delivered within 1 h.
4.3.2.3. Input data and experimental design
The actual trolley arrival times of a selected day in the peak season May-June 2017 was used as input data. On this day, the KPI is only 86%. Among 216 customer boxes observed in 2017 with capacity of 120 trolleys on average and ranging from 10 to 2000 trolleys, 59% of the boxes were often over full. Therefore, to model the current situation, the volume for Customer Cluster 2 of the total inbound volume was set at 59% and the average box size was set at 120. In the experimental design, the volume of Customer Cluster 2 and the average capacity of customer boxes were varied. For each parametric setting, 200 separate runs were executed to achieve narrow intervals of the lower and upper bounds of the 95% confidence level.
4.3.3. Results and discussion
The simulation results are displayed in Figure . With the current situation (the solid line at a box size of 120), the improvement in the KPI is 4% (from 86% to 90%). This improvement is positively correlated with the volume for Customer Cluster 2 and negatively correlated with the average box size. These are intuitive because either increasing the volume or decreasing the average box size of Customer Cluster 2 causes more frequent postponement signals, which saves more time for processing the trolleys of Customer Cluster 1.
Figure 5. The improvement in KPI resulting from real-time coordination.
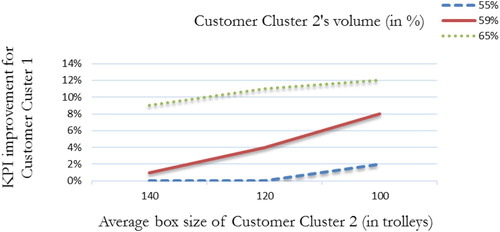
As the volume for Customer Cluster 2 falls under 55%, the improvement in the KPI is no longer significant. Therefore, timely postponement signals from a large number of customers to the cross-docking operator, i.e. information timeliness and completeness, is crucial to gain more benefit from the coordination. Moreover, improvement in the KPI enabled by the real-time coordination system can lead to a reduction in the workforce. It is then promising to integrate the real-time coordination system with the real-time predictive model for workforce adjustment to leverage the use of the big data. This is possible by combining real-time big data analytics and tracking and tracing systems.
4.4. Strategic partner selection in horizontal collaboration
The historical time scan data provide details on arrival times at cross-docking for products from all the suppliers, i.e. data volume and variety. Using the data, the following descriptive model aims to answer the question ‘who should collaborate with whom’ by revealing sets of suppliers whose products frequently arrived at RFH in the same time window. The aim is translated to frequent patterns mining. Frequent patterns are patterns (e.g. set of items in an order, set of sequences in logistics trajectories) that appear frequently in a dataset (Han et al. Citation2004). Apriori is a well-established and well-developed patterns mining algorithm. Details of the algorithm are referred to Wu et al. (Citation2008). The following presents important concepts of the Apriori algorithm.
4.4.1. Pattern and frequency
A pattern in this case is a set of suppliers whose product arrives at RFH inbound docks in the same time window. The patterns are created from a historical time scan database by dissecting the data into 24 time windows of 60 min, i.e. 00.00–01.00, 01.00–02.00, … , 23.00–24.00.
The minimum support (i.e. the minimum frequency of a pattern appearing in the dataset to be considered as frequent) affects the computational time. A smaller minimum support results in a larger set of frequent patterns, thus a longer computational time. In this case, the minimum support is set at 100 times (approximately 38% of 260 working days in 2017), which resulted in about 20 min (implemented in Python, core i5 CPU) given the dataset of around 1,200,000 data points.
4.4.2. Results of frequent patterns mining
The model is run for the 2017 data from two RFH cross-docking warehouses. RFH cross-docking 1 has greater inbound volumes than RFH cross-docking 2. The results are shown in Table . In general, the high numbers of sets indicate a huge potential for reducing truck movements and increasing truck utilisation in the sector.
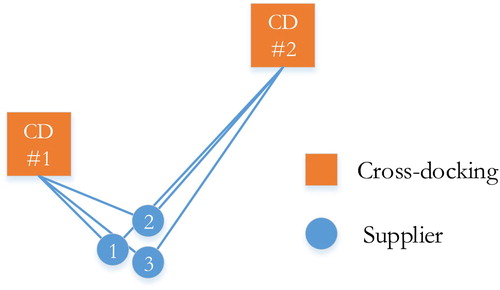
Table 4. Number of frequent supplier sets.
Many suppliers belong to multiple two or three different supplier sets. These suppliers can have more options to collaborate with one or more suppliers. An example is displayed in Figure . Three suppliers 1, 2, and 3 are located less than a 3-minute drive from each other. Their production sizes are quite similar. From the geographic dimension, supplier 1 can possibly collaborate with either supplier 2 or 3. However, according to the model output, supplier 1 shares significantly more frequent product arrival time windows with supplier 2 (i.e. 371 times to CD1 and 415 times to CD2) than with the supplier 3 (i.e. 164 times to CD1 and 115 times to CD2). This indicates that it is more beneficial for supplier 1 to collaborate with supplier 2.
Figure 6. Example on selecting potential partners.
4.4.3. Discussion
The descriptive model output provides the essential information to initiate communication regarding the collaboration in transportation among the Dutch suppliers. The 1PL/2PL suppliers that belong to the same frequent sets can immediately discuss how the collaboration could be arranged. For example, a static optimal routing among the suppliers locations is needed. Moreover, information-sharing aspects, such as which information (e.g. truck capacity requests or offers) and when to share information, are important issues that need to be addressed (Yuan, Viet, and Behdani Citation2019). For suppliers who use LSPs, a collective arrangement (i.e. pooling the transportation orders from the suppliers) with LSPs is promising (Yilmaz and Savasaneril Citation2012).
5. Applying the framework in other industries
While we have presented four applications for the proposed multi-level framework in the floriculture sector, the framework is generic and can be applied to other industrial contexts for studying the value of data at the different levels of a supply chain. In Table , we provide examples of the potential decisions in the food and pharmaceutical industries.
Table 5. Examples for decisions in food and pharmaceutical industries.
The food industry is a straightforward application area given the similar challenges. Advanced Internet-of-Things (IoT) technologies enable the collection of product location and condition data along the entire supply chain. A well-developed technology for cool/fresh supply chains is intelligent containers (Jedermann et al. Citation2014). An intelligent container equipped with sensors and control units allows to monitor and adjust the atmospheric conditions such as cargo’s temperature or humidity (Lütjen, Dittmer, and Veigt Citation2013). On an operational level, this real-time data makes it possible for shippers to obtain information on product quality and remaining shelf-life in a timely manner. Using this information and considering the different requirements on product quality, the shippers can allocate stocks to appropriate supply chain partners. This information also further allows supply chain partners to collaboratively optimise their short-term transportation/storage/issuing decisions to reduce food spoilage and food waste throughout the supply chain. On a tactical/strategic level, shippers can use the data to identify recurring issues along with the supply chain processes, e.g. locations where food frequently remained in non-chilled areas for too long. This information can be used by the shippers to leverage supply chain partners with higher process compliance. At the supply-chain level, the information is used to initiate necessary supply chain process redesigns toward quality-controlled logistics or quality-driven distribution, which is about integrating the quality of fresh products in managing inventories as well as distribution planning for perishable products (van der Vorst, van Kooten, and Luning Citation2011).
In the pharmaceutical industry, it is critical to match supply and demand for potentially live-savings drugs on a day-to-day basis. While hospitals and pharmacies require a huge portfolio of drugs, inventory holding cost and spoilage must be minimised. A new opportunity to obtain data in this context is being introduced by serialisation in the pharmaceutical industry (Cordon et al. Citation2016). In this approach, each individual drug package is assigned with a unique serial number that can be traced through the supply chain. A huge amount of data on inventories, transportation and sales is gathered as billions of individual drug packages are scanned at the different points of the supply chain in a short time. While originally designed to increase compliance, serialisation enables and supports many supply chain decisions in the two dimensions of our framework. On an operational level, real-time data about sales and inventories enable companies to improve customer demand sensing (demand information). This timely information allows individual manufacturing companies to improve their decision making with minimal latency, e.g. to enable manufacturers to ship out goods to the right markets or to schedule the packaging of drugs for different counties. Serialisation data can also help different supply chain actors to improve short-term on-shelf availability (OSA) in hospitals and pharmacies. Given the mutual interest of all parties to avoid stock-outs, better processes to steer OSA can be introduced and the true available inventory (e.g. reserved or quarantined inventories) can be better located. On a tactical/strategic level, real-time information about sales and consumption will enable pharmaceutical manufacturers to improve their demand forecasting and sensing capabilities, which result in better forecasts for decisions on new demand shaping programmes. Until now point-of-sale (POS) and point-of-consumption (POC) information have rarely been available to the manufacturers. With serialisation, rather than information about shipments to the POS/POC, information about drugs dispensed to patients become available. This information enables firms with new strategic decisions for driving or slowing down demand, e.g. for new products or products at the end of the life cycle. On a supply-chain level, strategic decisions about product designs can be made that relate to pack-sizes and multi-country packaging. Currently, a large portion of drugs are handled in a grey market for export and reliable information about the final usage of products is not available. With more data available from the different parties, the entire design of the distribution can be improved.
6. Conclusion
This paper discusses a multi-level framework to show how data (and big data) can be linked to multi-level supply chain decisions for process improvement. While discussing the framework, we explicitly address the underlying connections within data (i.e. data characteristics), information (i.e. information characteristics), and supply chain decisions (i.e. decision characteristics). The framework is demonstrated by an extensive case study in which four logistics decisions at different levels are investigated. For each decision, we address the required information and information characteristics and identify which characteristics of data (or big data's Vs) can enhance the information characteristics and accordingly, improve the decision making process. Through the framework and the case study, the main message is that the value of data (or big data) lies in how the data characteristics can enhance the characteristics of the information generated from the data. In the transition from data to big data, firms are suggested to identify their desired information characteristics and examine how the big data’s 4Vs contribute to improving these characteristics because they determine the relevance and usefulness of the information to different supply chain decisions.
The case study explores the potential value of the increasing data to support multi-level decisions on the logistics processes in the Dutch floriculture sector. Following a two-dimensional matrix of decision characteristics, the values of the data are connected to four different logistics decisions. At the individual-firm level, the data are used in a kNN forecasting for real-time workforce adjustment and a time-based association rule mining for the strategic design of a new storage and fulfilment service. At the supply-chain level, the data enable real-time coordination in the distribution process from cross-docking to customers and an Apriori application to support the suppliers in selecting their strategic partners in horizontal collaboration. The analytics work reveals that decisions with different characteristics benefit from different big data’s Vs and information characteristics. Due to the limited data provided for this research, only parts of the available EDF and time scan data were used for demonstration in the applications for long-term decisions, i.e. association rule mining and Apriori. However, the proposed approaches are applicable to larger datasets as the computational time remains polynomial.
From the data analytics of the four applications in the case study, we find that data variety is required by all the four decisions, yet not the same for the other Vs. Not every decision necessarily requires all the 4Vs. Also, we observed that investing in data/information flows requires accompanying investments in other logistics resources at firms and at supply chains. Taking the real-time workforce adjustment decisions as an example, real-time and accurate forecast information enables the decision, yet the implementation of the decision depends largely on the flexibility of the workforce to meet the real-time adjustment. Likewise, a relevant question is how to assure the scans are made by workers in a timely and accurate manner (information timeliness and accuracy), and if it is necessary to further expand the tracking systems from trolley level to item level (information completeness).
The following directions are suggested for future studies. First, recent literature reviews on big data analytics by Wang et al. (Citation2016) and Nguyen et al. (Citation2018) indicate that the value of big data has been linked mainly to predictive power (e.g. forecasting). The descriptive models in the case study have shown that big data descriptive analytics can help firms to uncover hidden patterns, correlations, and insights that allow them to incrementally or radically change their processes. The value of big data from big data descriptive analytics should receive further research attention. Second, the big data in the case study supports the co-creation of values among firms through supply chain coordination and collaboration. This points to the necessity of investigating big data applications from the perspective of the supply network and sector. Potentially with greater scope, big data applications for cross-industry supply chain processes in the circular economy are worth exploring (Tseng et al. Citation2018). Third, the role of human dealing with big data in supply chains need to be better understood (Hoberg, Thornton, and Wieland Citation2020). While many decisions have the potential for automation, humans will continue to perform many tasks in interaction with the systems and will be ultimately responsible for the decision-making process.
The presented framework does not address organisational aspects such as data-driven culture in upstream and downstream supply chain firms and data governance (Arunachalam, Kumar, and Kawalek Citation2018; Kamble and Gunasekaran Citation2020; Bansal, Gualandris, and Kim Citation2020). Dynamic behaviours in the multi-actor setting of supply chains can result in a highly dynamic environment for data capture and sharing, which directly affect the data characteristics and thus the value of the data. Readers are recommended to combine the multi-level framework with the aforementioned frameworks in the literature for a multi-aspect understanding.
Disclosure statement
No potential conflict of interest was reported by the author(s).
Additional information
Notes on contributors

Nguyen Quoc Viet
Nguyen Quoc Viet is a postdoctoral researcher at Operations Research and Logistics Group, Wageningen University & Research. His current research topics include sustainability in logistics sector, consumer behaviour and retailing, supply chain optimiation and simulation.

Behzad Behdani
Behzad Behdani is Assistant Professor in Operations Research and Logistics at Wageningen University and Research (WUR). His research focuses on, among others, the value of information in agro-food supply chains, cold chain design, intermodal transport, and reefer logistics. Behzad’s research also deals with the question of how the Sustainable Development Goals can be embedded in the design and operations of food supply chains.

Jacqueline Bloemhof
Jacqueline Bloemhof was Emeritus Professor of Sustainable Logistics Management at the Operations Research and Logistics Group, Wageningen University & Research. She passed away in June 2020 at the age of 51. She was an active member of the Closed-Loop Supply Chain network and a founding member and coordinator of the EURO Working Group on Sustainable Supply Chains.

Kai Hoberg
Kai Hoberg is Head of Operations and Technology Department and Professor of Supply Chain and Operations Strategy at Kühne Logistics University. His current research topics include supply chain analytics, role of technology in supply chains, inventory modelling, and the link between operations and finance. In particular, he explores the fundamental drivers of supply chain performance and strategies applying real-world data. His research findings have been published in academic journals like Journal of Operations Management, Production and Operations Management, and European Journal of Operational Research.
References
- Arunachalam, D., N. Kumar, and J. P. Kawalek. 2018. “Understanding Big Data Analytics Capabilities in Supply Chain Management: Unravelling the Issues, Challenges and Implications for Practice.” Transportation Research Part E: Logistics and Transportation Review 114: 416–436. doi:10.1016/j.tre.2017.04.001.
- Bansal, P., J. Gualandris, and N. Kim. 2020. “Theorizing Supply Chains with Qualitative Big Data and Topic Modeling.” Journal of Supply Chain Management. doi:10.1111/jscm.12224.
- Barbosa, M. W., A. D. L. C. Vicente, M. B. Ladeira, and M. P. V. D. Oliveira. 2018. “Managing Supply Chain Resources with Big Data Analytics: A Systematic Review.” International Journal of Logistics Research and Applications 21 (3): 177–200. doi:10.1080/13675567.2017.1369501.
- Bard, Jonathan F. 2004. “Selecting the Appropriate Input Data Set When Configuring a Permanent Workforce.” Computers & Industrial Engineering 47 (4): 371–389. doi:10.1016/j.cie.2004.09.004.
- Brinch, Morten. 2018. “Understanding the Value of Big Data in Supply Chain Management and its Business Processes: Towards a Conceptual Framework.” International Journal of Operations & Production Management 38 (7): 1589–1614. doi:10.1108/IJOPM-05-2017-0268.
- Buijs, P., H. W. Danhof, and J. H. C. Wortmann. 2016. “Just-in-Time Retail Distribution: A Systems Perspective on Cross-Docking.” Journal of Business Logistics 37 (3): 213–230. doi:10.1111/jbl.12135.
- Chehbi-Gamoura, S., R. Derrouiche, D. Damand, and M. Barth. 2020. “Insights from Big Data Analytics in Supply Chain Management: An All-Inclusive Literature Review Using the SCOR Model.” Production Planning and Control 31 (5): 355–382. doi:10.1080/09537287.2019.1639839.
- Choi, Tsan-Ming, Stein W. Wallace, and Yulan Wang. 2018. “Big Data Analytics in Operations Management.” Production and Operations Management 27 (10): 1868–1883. doi:10.1111/poms.12838.
- Cordon, Carlos, Pau Garcia-Milà, Teresa Ferreiro Vilarino, and Pablo Caballero. 2016. “Serialization in the Pharmaceutical Industry.” In Strategy is Digital: How Companies Can Use Big Data in the Value Chain, 47–64. Cham: Springer International Publishing.
- Coronado Mondragon, A. E., C. E. Coronado Mondragon, and E. S. Coronado. 2020. “Managing the Food Supply Chain in the Age of Digitalisation: A Conceptual Approach in the Fisheries Sector.” Production Planning and Control. doi:10.1080/09537287.2020.1733123.
- Cruijssen, Frans, Martine Cools, and Wout Dullaert. 2007. “Horizontal Cooperation in Logistics: Opportunities and Impediments.” Transportation Research Part E: Logistics and Transportation Review 43 (2): 129–142. doi:10.1016/j.tre.2005.09.007.
- Dai, H., L. Ge, and W. Zhou. 2015. “A Design Method for Supply Chain Traceability Systems with Aligned Interests.” International Journal of Production Economics 170: 14–24. doi:10.1016/j.ijpe.2015.08.010.
- Defraeye, Mieke, and Inneke Van Nieuwenhuyse. 2016. “Staffing and Scheduling Under Nonstationary Demand for Service: A Literature Review.” Omega 58 (Supplement C): 4–25. doi:10.1016/j.omega.2015.04.002.
- de Keizer, M., J. G. A. J. Van Der Vorst, J. M. Bloemhof, and R. Haijema. 2015. “Floricultural Supply Chain Network Design and Control: Industry Needs and Modelling Challenges.” Journal on Chain and Network Science 15 (1): 61–81. doi:10.3920/jcns2014.0001.
- Ehmke, J. F., A. M. Campbell, and B. W. Thomas. 2016. “Data-Driven Approaches for Emissions-Minimized Paths in Urban Areas.” Computers and Operations Research 67: 34–47. doi:10.1016/j.cor.2015.08.013.
- EnterpriseDynamics. 2019. “Enterprise Dynamics 9.” Accessed 16 September. http://www.incontrolsim.com/product/enterprise-dynamics/.
- Fang, Weiguang, Yu Guo, Wenhe Liao, Karthik Ramani, and Shaohua Huang. 2020. “Big Data Driven Jobs Remaining Time Prediction in Discrete Manufacturing System: A Deep Learning-Based Approach.” International Journal of Production Research 58 (9): 2751–2766. doi:10.1080/00207543.2019.1602744.
- Fosso Wamba, S., S. Akter, L. Trinchera, and M. De Bourmont. 2019. “Turning Information Quality Into Firm Performance in the big Data Economy.” Management Decision 57 (8): 1756–1783. doi:10.1108/md-04-2018-0394.
- Frizzo-Barker, Julie, Peter A. Chow-White, Maryam Mozafari, and Dung Ha. 2016. “An Empirical Study of the Rise of Big Data in Business Scholarship.” International Journal of Information Management 36 (3): 403–413. doi:10.1016/j.ijinfomgt.2016.01.006.
- Gawankar, S. A., A. Gunasekaran, and S. Kamble. 2020. “A Study on Investments in the big Data-Driven Supply Chain, Performance Measures and Organisational Performance in Indian Retail 4.0 Context.” International Journal of Production Research 58 (5): 1574–1593. doi:10.1080/00207543.2019.1668070.
- Govindan, Kannan, T. C. E. Cheng, Nishikant Mishra, and Nagesh Shukla. 2018. “Big Data Analytics and Application for Logistics and Supply Chain Management.” Transportation Research Part E: Logistics and Transportation Review 114: 343–349. doi:10.1016/j.tre.2018.03.011.
- Grover, V., R. H. L. Chiang, T. P. Liang, and D. Zhang. 2018. “Creating Strategic Business Value from Big Data Analytics: A Research Framework.” Journal of Management Information Systems 35 (2): 388–423. doi:10.1080/07421222.2018.1451951.
- Gupta, Shivam, Sachin Modgil, and Angappa Gunasekaran. 2020. “Big Data in Lean Six Sigma: A Review and Further Research Directions.” International Journal of Production Research 58 (3): 947–969. doi:10.1080/00207543.2019.1598599.
- Han, J., J. Pei, Y. Yin, and R. Mao. 2004. “Mining Frequent Patterns Without Candidate Generation: A Frequent-Pattern Tree Approach.” Data Mining and Knowledge Discovery 8 (1): 53–87. doi:10.1023/b:dami.0000005258.31418.83.
- Hazen, Benjamin T., Christopher A. Boone, Jeremy D. Ezell, and L. Allison Jones-Farmer. 2014. “Data Quality for Data Science, Predictive Analytics, and Big Data in Supply Chain Management: An Introduction to the Problem and Suggestions for Research and Applications.” International Journal of Production Economics 154: 72–80. doi:10.1016/j.ijpe.2014.04.018.
- Hazen, B. T., J. B. Skipper, J. D. Ezell, and C. A. Boone. 2016. “Big Data and Predictive Analytics for Supply Chain Sustainability: A Theory-Driven Research Agenda.” Computers and Industrial Engineering 101: 592–598. doi:10.1016/j.cie.2016.06.030.
- Hoberg, K. 2020. “Supply Chain and Big Data.” In Encyclopedia of Big Data, edited by L. Schintler, and C. McNeely. Cham: Springer. doi:10.1007/978-3-319-32001-4_242-1.
- Hoberg, K., L. Thornton, and A. Wieland. 2020. “Editorial: How to Deal with the Human Factor in Supply Chain Management?” International Journal of Physical Distribution & Logistics Management 50 (2): 151–158. doi:10.1108/IJPDLM-10-2019-0311.
- Ivanov, D., and A. Dolgui. 2020. “A Digital Supply Chain Twin for Managing the Disruption Risks and Resilience in the Era of Industry 4.0.” Production Planning and Control. doi:10.1080/09537287.2020.1768450.
- Janssen, Marijn, Haiko van der Voort, and Agung Wahyudi. 2017. “Factors Influencing Big Data Decision-Making Quality.” Journal of Business Research 70: 338–345. doi:10.1016/j.jbusres.2016.08.007.
- Jedermann, Reiner, Mike Nicometo, Ismail Uysal, and Walter Lang. 2014. “Reducing Food Losses by Intelligent Food Logistics.” Philosophical Transactions of the Royal Society A: Mathematical, Physical and Engineering Sciences 372 (2017): 20130302. doi:10.1098/rsta.2013.0302.
- Jonsson, Patrik, and Paulina Myrelid. 2016. “Supply Chain Information Utilisation: Conceptualisation and Antecedents.” International Journal of Operations & Production Management 36 (12): 1769–1799. doi:10.1108/IJOPM-11-2014-0554.
- Kamble, Sachin S., and Angappa Gunasekaran. 2020. “Big Data-Driven Supply Chain Performance Measurement System: A Review and Framework for Implementation.” International Journal of Production Research 58 (1): 65–86. doi:10.1080/00207543.2019.1630770.
- Kaur, H., and S. P. Singh. 2017. “Heuristic Modeling for Sustainable Procurement and Logistics in a Supply Chain Using Big Data.” Computers and Operations Research 98: 301–321. doi:10.1016/j.cor.2017.05.008.
- Kiil, K., H. H. Hvolby, J. Trienekens, B. Behdani, and J. O. Strandhagen. 2019. “From Information Sharing to Information Utilization in Food Supply Chains.” International Journal of Information Systems and Supply Chain Management 12 (3): 85–109. doi:10.4018/IJISSCM.2019070105.
- Kim, S., H. Kim, and Y. Park. 2017. “Early Detection of Vessel Delays Using Combined Historical and Real-Time Information.” Journal of the Operational Research Society 68 (2): 182–191. doi:10.1057/s41274-016-0104-4.
- Kuo, Yong-Hong, and Andrew Kusiak. 2019. “From Data to Big Data in Production Research: The Past and Future Trends.” International Journal of Production Research 57 (15): 4828–4853. doi:10.1080/00207543.2018.1443230.
- Ladier, A. L., and G. Alpan. 2016. “Cross-Docking Operations: Current Research Versus Industry Practice.” Omega (United Kingdom) 62: 145–162. doi:10.1016/j.omega.2015.09.006.
- Ladier, Anne-Laure, and Gülgün Alpan. 2018. “Crossdock Truck Scheduling with Time Windows: Earliness, Tardiness and Storage Policies.” Journal of Intelligent Manufacturing 29 (3): 569–583. doi:10.1007/s10845-014-1014-4.
- Larbi, R., G. Alpan, P. Baptiste, and B. Penz. 2011. “Scheduling Cross Docking Operations Under Full, Partial and No Information on Inbound Arrivals.” Computers and Operations Research 38 (6): 889–900. doi:10.1016/j.cor.2010.10.003.
- Li, Li, Xiaonan Su, Yanwei Wang, Yuetong Lin, Zhiheng Li, and Yuebiao Li. 2015. “Robust Causal Dependence Mining in Big Data Network and its Application to Traffic Flow Predictions.” Transportation Research Part C: Emerging Technologies 58: 292–307. doi:10.1016/j.trc.2015.03.003.
- Li, Dong, and Xiaojun Wang. 2017. “Dynamic Supply Chain Decisions Based on Networked Sensor Data: An Application in the Chilled Food Retail Chain.” International Journal of Production Research 55 (17): 5127–5141. doi:10.1080/00207543.2015.1047976.
- Lumsden, K., and V. Mirzabeiki. 2008. “Determining the Value of Information for Different Partners in the Supply Chain.” International Journal of Physical Distribution & Logistics Management 38 (9): 659–673. doi:10.1108/09600030810925953.
- Lusa, Amaia, Albert Corominas, and Norberto Muñoz. 2008. “A Multistage Scenario Optimisation Procedure to Plan Annualised Working Hours Under Demand Uncertainty.” International Journal of Production Economics 113 (2): 957–968. doi:10.1016/j.ijpe.2007.11.009.
- Lütjen, Michael, Patrick Dittmer, and Marius Veigt. 2013. “Quality Driven Distribution of Intelligent Containers in Cold Chain Logistics Networks.” Production Engineering 7 (2): 291–297. doi:10.1007/s11740-012-0433-3.
- Maknoon, M. Y., F. Soumis, and P. Baptiste. 2017. “An Integer Programming Approach to Scheduling the Transshipment of Products at Cross-Docks in Less-Than-Truckload Industries.” Computers and Operations Research 82: 167–179. doi:10.1016/j.cor.2017.01.018.
- Naesens, K., L. Gelders, and L. Pintelon. 2009. “A Swift Response Framework for Measuring the Strategic Fit for a Horizontal Collaborative Initiative.” International Journal of Production Economics 121 (2): 550–561. doi:10.1016/j.ijpe.2007.04.004.
- Nguyen, T., L. Zhou, V. Spiegler, P. Ieromonachou, and Y. Lin. 2018. “Big Data Analytics in Supply Chain Management: A State-of-the-Art Literature Review.” Computers and Operations Research 98: 254–264. doi:10.1016/j.cor.2017.07.00 4.
- Richey, R. G., Jr., T. R. Morgan, K. Lindsey-Hall, and F. G. Adams. 2016. “A Global Exploration of Big Data in the Supply Chain: Global Exploration of Big Data.” International Journal of Physical Distribution and Logistics Management 46 (8): 710–739. doi:10.1108/ijpdlm-05-2016-0134.
- RoyalFloraHolland. 2019. “Royal Flora Holland facts and figures.” Accessed 31 January. https://www.royalfloraholland.com/en/about-floraholland/who-we-are-what-we-do/facts-and-figures.
- Schoenherr, Tobias, and Cheri Speier-Pero. 2015. “Data Science, Predictive Analytics, and Big Data in Supply Chain Management: Current State and Future Potential.” Journal of Business Logistics 36 (1): 120–132. doi:10.1111/jbl.12082.
- See-To, E. W. K., and E. W. T. Ngai. 2018. “Customer Reviews for Demand Distribution and Sales Nowcasting: A Big Data Approach.” Annals of Operations Research 270: 415–431. doi:10.1007/s10479-016-2296-z.
- Singh, A. K., N. Subramanian, K. S. Pawar, and R. Bai. 2018. “Cold Chain Configuration Design: Location-Allocation Decision-Making Using Coordination, Value Deterioration, and big Data Approximation.” Annals of Operations Research 270: 433–457. doi:10.1007/s10479-016-2332-z.
- Steinker, S., K. Hoberg, and U. W. Thonemann. 2017. “The Value of Weather Information for E-Commerce Operations.” Production and Operations Management 26 (10): 1854–1874. doi:10.1111/poms.12721.
- Thomas, A., M. Krishnamoorthy, G. Singh, and J. Venkateswaran. 2015. “Coordination in a Multiple Producers-Distributor Supply Chain and the Value of Information.” International Journal of Production Economics 167: 63–73. doi:10.1016/j.ijpe.2015.05.020.
- Tseng, Ming-Lang, Raymond R. Tan, Anthony S. F. Chiu, Chen-Fu Chien, and Tsai Chi Kuo. 2018. “Circular Economy Meets Industry 4.0: Can Big Data Drive Industrial Symbiosis?” Resources, Conservation and Recycling 131: 146–147. doi:10.1016/j.resconrec.2017.12.028.
- Van Belle, J., P. Valckenaers, and D. Cattrysse. 2012. “Cross-Docking: State of the Art.” Omega 40 (6): 827–846. doi:10.1016/j.omega.2012.01.005.
- van der Spoel, S., C. Amrit, and J. van Hillegersberg. 2017. “Predictive Analytics for Truck Arrival Time Estimation: A Field Study at a European Distribution Centre.” International Journal of Production Research 55 (17): 5062–5078. doi:10.1080/00207543.2015.1064183.
- van der Vorst, Jack GAJ, Olaf van Kooten, and Pieternel A Luning. 2011. “Towards a Diagnostic Instrument to Identify Improvement Opportunities for Quality Controlled Logistics in Agrifood Supply Chain Networks.” International Journal on Food System Dynamics 2 (1): 94–105. doi:10.18461/ijfsd.v2i1.217.
- Verdouw, C. N., A. J. M. Beulens, and J. G. A. J. van der Vorst. 2013. “Virtualisation of Floricultural Supply Chains: A Review from an Internet of Things Perspective.” Computers and Electronics in Agriculture 99: 160–175. doi:10.1016/j.compag.2013.09.006.
- Viet, Nguyen Quoc, Behzad Behdani, and Jacqueline Bloemhof. 2018a. “The Value of Information in Supply Chain Decisions: A Review of the Literature and Research Agenda.” Computers & Industrial Engineering 120: 68–82. doi:10.1016/j.cie.2018.04.034.
- Viet, Nguyen Quoc, Behzad Behdani, and Jacqueline Bloemhof. 2018b. “Value of Information to Improve Daily Operations in High-Density Logistics.” International Journal on Food System Dynamics 9 (1): 1–20. doi:10.18461/ijfsd.v9i1.911.
- Viet, Nguyen Quoc, Behzad Behdani, and Jacqueline Bloemhof. 2020. “Data-Driven Process Redesign: Anticipatory Shipping in Agro-Food Supply Chains.” International Journal of Production Research 58 (5): 1302–1318. doi:10.1080/00207543.2019.1629673.
- Wamba, S. F., R. Dubey, A. Gunasekaran, and S. Akter. 2020. “The Performance Effects of Big Data Analytics and Supply Chain Ambidexterity: The Moderating Effect of Environmental Dynamism.” International Journal of Production Economics 222: 107498. doi:10.1016/j.ijpe.2019.09.019.
- Wang, Gang, A. Gunasekaran, E. W. T. Ngai, and T. Papadopoulos. 2016. “Big Data Analytics in Logistics and Supply Chain Management: Certain Investigations for Research and Applications.” International Journal of Production Economics 176: 98–110. doi:10.1016/j.ijpe.2016.03.014.
- Winkelhaus, Sven, and Eric H. Grosse. 2020. “Logistics 4.0: A Systematic Review Towards a New Logistics System.” International Journal of Production Research 58 (1): 18–43. doi:10.1080/00207543.2019.1612964.
- Wu, Xindong, Vipin Kumar, J. Ross Quinlan, Joydeep Ghosh, Qiang Yang, Hiroshi Motoda, Geoffrey J. McLachlan, et al. 2008. “Top 10 Algorithms in Data Mining.” Knowledge and Information Systems 14 (1): 1–37. doi:10.1007/s10115-007-0114-2.
- Yilmaz, O., and S. Savasaneril. 2012. “Collaboration among Small Shippers in a Transportation Market.” European Journal of Operational Research 218 (2): 408–415. doi:10.1016/j.ejor.2011.11.018.
- Yuan, Yaxing, Nguyen Viet, and Behzad Behdani. 2019. “The Impact of Information Sharing on the Performance of Horizontal Logistics Collaboration: A Simulation Study in an Agri-Food Supply Chain.” IFAC-PapersOnLine 52 (13): 2722–2727. doi:10.1016/j.ifacol.2019.11.619.
- Zhan, Y., and K. H. Tan. 2020. “An Analytic Infrastructure for Harvesting Big Data to Enhance Supply Chain Performance.” European Journal of Operational Research 281 (3): 559–574. doi:10.1016/j.ejor.2018.09.018.
- Zhong, Ray Y., Stephen T. Newman, George Q. Huang, and Shulin Lan. 2016. “Big Data for Supply Chain Management in the Service and Manufacturing Sectors: Challenges, Opportunities, and Future Perspectives.” Computers & Industrial Engineering 101: 572–591. doi:10.1016/j.cie.2016.07.013.
- Zhong, R. Y., C. Xu, C. Chen, and G. Q. Huang. 2017. “Big Data Analytics for Physical Internet-Based Intelligent Manufacturing Shop Floors.” International Journal of Production Research 55 (9): 2610–2621. doi:10.1080/00207543.2015.1086037.