
 ?Mathematical formulae have been encoded as MathML and are displayed in this HTML version using MathJax in order to improve their display. Uncheck the box to turn MathJax off. This feature requires Javascript. Click on a formula to zoom.
Abstract
Resilience is one of the key characteristics that manufacturing systems should have as it offers the ability to withstand difficult situations and be able to accommodate disruptions without the incurrence of significant additional costs. The main contribution of this study is the presentation of a method for quantifying resilience in manufacturing systems based on calculating the penalty of possible changes. The method is applied to an industrially-relevant scenario to estimate the resilience of two production systems when COVID-19 disrupts their production. The first system uses additive manufacturing (3D printing), and the second uses injection moulding. Several scenarios, related to the systems’ operational environment, are presented on the basis of pandemic-related possible events. The validation of the proposed resilience measure demonstrates the method’s suitability and reliability to be considered in industrial practice, in support of decision-making. The resilience measure can be used by managers to assess, compare and improve their production systems, and decide on strategic investment costs to improve systems’ resilience. It can be applied for several disruption scenarios or variations of the same disruption scenario with different disruption characteristics, such as duration, recovery time and impact on the production system.
1. Introduction
The global COVID-19 pandemic, developed in 2020, led to increased requests for manufacturing firms to temporarily modify part of their production processes in order to adapt their production capacity and cover the demand for vital supplies and disinfection equipment. The World Health Organization (WHO Citation2020) has published a list of COVID-19 critical items facing a global shortage. For example, in the U.S.A., the General Motors company planned to produce ventilators to support the rocketing demand (Garsten Citation2020). Hence, companies were required to manufacture products that meet the demands of a diversified customer base (Alexopoulos et al. Citation2011), investing in manufacturing resilience, which is considered an uncertainty management method.
Resilience can be perceived as a system’s ability to adjust to a change and recover from an undesired state to a desired one (Bhamra, Dani, and Burnard Citation2011; Hosseini, Barker, and Ramirez-Marquez Citation2016a; Caputo, Pelagagge, and Salini Citation2019; Rajesh Citation2019). Alternatively, resilience can be thought as the ability to cope with disturbances, aiming at preventing the shifting to an undesirable state (Thomas et al. Citation2015). To achieve resilience, a list of resilience-related attributes might include energy, materials, components, physical assets and processes, transport, supply chain, communications, logistics, efficiency, productivity, capacity, dependability, quality, compatibility, sustainability, workforce, and societal values (Kusiak Citation2019). Underestimation or inability to foresee the occurrence and consequences of an event can lead to disruptions with a high impact on supply chain operations, regardless of the supply chain dimension or the direct field of business (Han and Shin Citation2016).
Traditionally applied tools, methodologies and business standards, used by organisations to cope with risks and crises, seem to be insufficient (Rongier et al. Citation2013; Arsovski et al. Citation2017). The re-skilling of operators, the modern automation and flexible production technologies can be considered examples of this direction. The operators’ re-skilling for new and repurposed production lines can benefit from new Industry 4.0 technologies, such as the Augmented Reality (Mattson and Fast-Berglund Citation2016; Mourtzis, Zogopoulos, and Xanthi Citation2019), the modern digital learning platforms and the knowledge transfer tools. Modern automation solutions, less dependent on the human workforce, such as the collaborative robots (Michalos et al. Citation2018) and flexible production technologies, such as 3D printing, enable shifting to new product demands, such as high-demand medical equipment with remote operation. To achieve the required levels of resilience, internal operations should be considered along with an effective and robust Supply Chain Management (SCM) approach (Ribeiro and Barbosa-Povoa Citation2018).
Quantitative measurement of resilience can provide various benefits, such as better understanding and the ability to compare different systems and configurations under different environmental, organisational, social, and economic conditions. In addition, it can identify vulnerable parts that need improvement for increasing resilience and enhancing transparency in the underlying infrastructure. However, resilience cannot be properly considered in the manufacturing systems’ design or operation unless it can be assessed in quantifiable terms. Resilience can be assessed through its adaptation cost. Namely, the more resilient a system, the more capable it is of adjusting to a potential change, the less the cost of adapting to the difference.
This work aims to provide a measure for resilience quantification in manufacturing systems, and its validation in an industrially-relevant scenario. Two individual systems are selected to demonstrate the approach: (1) a 3D printing farm; and (2) an injection moulding plant. The first system uses Additive Manufacturing technology to build products, whereas the second one uses Injection Moulding techniques. Since production technologies can produce identical products, their selection enables comparison between them on various occasions, favouring the one or the other system, making it feasible to validate and assess the sensitivity of the proposed measure.
A two-stage stochastic model is adopted, incorporating exogenous to the production line uncertainty, such as the occurrence of the COVID-19 event, and endogenous, calculated in the second stage as recovery strategies under certain probabilities, into a single formula to facilitate resilience assessment of the existing production systems. Based on the two case studies, this paper supports that the proposed formula is a suitable measurement of resiliency, fast and easy to calculate, for existing manufacturing systems.
The rest of the paper is organised as follows: Section 2 presents the related work on resilience quantification in manufacturing value chains. Section 3 describes the proposed approach for assessing the resilience of manufacturing systems in quantitative terms. In Section 4, a hypothetical scenario is constructed, having considered sequential events, occurring during the COVID-19 pandemic, while the proposed resilience measure is demonstrated in two industrially relevant manufacturing systems that employ two different types of technologies. Finally, Section 5 presents an outlook on how resilience and its proposed measurement method could be successfully included in the practice of future factories.
2. Literature review
Although resilience has been gaining increasing relevance in the manufacturing value chain, research on resilience quantification concentrated on manufacturing plants has been much scarcer and characterised by the inability to practically support investment decisions for establishing resilient systems. For example, in Hosseini et al. (Citation2016a, Citation2020), Bayesian Network (BN) approaches are implemented to quantify the resilience of the Supply Chain (SC). However, these works do not correlate resilience with additional investment costs, but focus on risk mitigation and recovery capabilities. In Caputo, Pelagagge, and Salini (Citation2019), a method for measuring the resilience of a single manufacturing plant is proposed, based on the direct assessment of the initial capacity loss, following a disruptive event, along with the time-dependent capacity recovery path and the connected economic loss. The method is presented only in the context of determination and not in a probabilistic setting, which would be more useful in assisting investment decision-making. Other attempts to quantify resilience were released by Carvalho et al. (Citation2012) and Sazvar et al. (Citation2021). In these works, the Lead Time Ratio (LTR) assesses SC resilience under uncertainty and in terms of time, which is the ratio of the actual lead time and the promised lead time in no change. Although LTR is considered a tool to design a resilient SC, it does not quantify resilience in terms of cost. Another measure of the SC system resilience is proposed in Raj et al. (Citation2015), based on the Cox-PH semiparametric model. The model receives a failure event as input and returns the recovery time. However, a significant limitation of this approach is that disruption sources are considered independent of each other, while, some sources might be mutually correlated in real life. Said, Bouloiz, and Gallab (Citation2020) attempted to provide a more generic method for resilience assessment, via fuzzy logic and by establishing criticality levels for the Maximum Tolerable Period of Disruption. According to the authors, the method can be applied to any system and define key indicators related to resistance, recovery and anticipation, but it is not directly linked with additional costs. Another fuzzy-logic approach was published by Rajesh (Citation2019), who proposed a Resilient Fuzzy Index alongside a Performance Fuzzy Index for measuring the level of resilience in manufacturing supply chains. The Euclidian distance metric is used to identify where the resilience level matches with an assumed linguistic expression level of resilience. However, the approach does not consider changes in strategies and attributes for different periods.
Although resilience quantification has been a critical issue over the last few years and it has emerged in the light of the COVID-19 pandemic, there is still limited work regarding resilience quantification in manufacturing systems or plants, mostly focused on supply chains (Cardoso et al. Citation2015; Munoz and Dunbar Citation2015). Nevertheless, these approaches do not consider important production-related parameters, namely, additional net production cost or setting downtime, required for applying changes. However, Gu et al. (Citation2015) analysed production loss, throughput settling time, and total underproduction time using a Bernoulli reliability model to measure the resilience of a manufacturing system, having considered redundancy and flexibility for the mitigation of the effect of disruptions. The literature review and the main drawbacks of the related works are summarised in Table .
Table 1. Literature review related to resilience quantification.
Designing a system proactively for resilience would require a significant investment for suitable automation and machines, something expected to end-up on equipment over scale. This can also be dealt with reactively by larger companies, but not by smaller ones. Those companies could benefit from a simple formula to quickly assess their capabilities in terms of resilience. Furthermore, previous measures exhibit drawbacks, such as: (1) inconsistent and theoretically deficient approaches to defining resilience; (2) inadaptability to different types of manufacturing systems; (3) dependency on parameter estimation assumptions; (4) substantial and intensive computational efforts, when applying to real complex systems; and (5) information insufficiency to guide decision-making. Thus, there is a need to reinvent ways of managing and mitigating risk to ensure business continuity, protect employees and improve the resilience of production and distribution systems (Hosseini, Khaled, and Sarder Citation2016b).
The Penalty of Change (POC) measure (Chryssolouris and Lee Citation1992; Chryssolouris Citation2006) is used in this study. POC is a generic measure that can be applied in different set-ups and manufacturing domains. It combines both technological and economical terms and does not require large and complex amounts of data for calculations. It is easy to apply to realistic manufacturing situations by practitioners and be interpreted by the persons in charge. The calculation of the POC measure is dependent on the probabilities estimation, which is prone to errors. Thus, its accuracy can be high and low. Nevertheless, it may be used in realistic manufacturing-wise scenarios to provide a quick and non-complex metric for resiliency evaluation and comparison between different set-ups.
The main contribution of this study can be summarised into four main points:
A new method for the quantification of resilience in manufacturing systems is presented based on calculating the penalty of possible changes.
The resilience measure can be used by managers to assess, compare, and improve the level of resilience of their production systems and decide on strategic investment costs to improve systems’ resilience.
The work demonstrates how resilience can be assessed in the case of pandemic-related disruption, such as the COVID-19 case, using the proposed method.
The resilience analysis and estimation can be applied for several disruption scenarios or variations of the same disruption scenario with different disruption characteristics, such as duration, recovery time and impact on the production system.
3. Resilience quantification measure for manufacturing systems
The major attributes of a resilient system include (1) withstanding capability – withstanding system disruptions and maintaining normal functionality under the disruptions; (2) absorptive capability – immediately absorbing the disruptions and minimising system damage; (3) restorative capability – quickly recovering and reaching the normal or acceptable state; and (4) adaptive capability – adapting to changing conditions and uncertain disruptions (Hosseini, Khaled, and Sarder Citation2016b; Shin et al. Citation2018; Hosseini, Ivanov, and Dolgui Citation2019). To achieve these attributes, industrial companies need to invest in technology and management methods, enabling them to outstand in the following six main principles: (1) Flexibility; (2) Controllability; (3) Early Detection; (4) Failure Minimisation; (5) Effect Limitation; and (6) Administrative Procedures and Change Management (Dinh et al. Citation2012). These principles must be applied to internal and external operations. From an internal perspective, industrial companies ought to be able to quickly adapt their operations and intra-logistics flows to introduce new products, change the production mix, or even adapt their production capacity to the new demand, keeping a competitive and sustainable level of cost and time-to-market. The ‘Penalty of Change’ (POC) (Chryssolouris and Lee Citation1992) is proposed in this paper as an appropriate measurement method for the quantification and assessment of resilience in manufacturing systems.
3.1 The ‘Penalty of Change’ measurement method
In Chryssolouris and Lee (Citation1992) and Chryssolouris (Citation2006), the POC method expresses the expected cost of accommodating potential changes in the operating environment. Provided that resilience is in inverse proportion to the sensitivity to changes, the so-called ‘Penalty of Change’ could be employed for measuring the resilience in quantitative terms. Considering a flexible manufacturing system, one can perfectly and with no cost adapt to changes to its procedures, then the system is totally resilient and POC = 0. Therefore, the lower the POC, the higher the resilience. If the probability of a change is low, the POC will be also low, even if the cost of change is relatively high. This reflects that a system should not be considered non-resilient when it has a high penalty for changes that have little probability to occur. By the same token, a system should not be considered much more resilient than another if it has a minimal penalty for changes, and those changes have little probability to occur.
The calculation of the POC is based on two variables: (1) the cost of the potential change; and (2) the probability of change, where a ‘change’ is meant to be a transition from a current ‘state’ of a manufacturing system to another one. Cost and probability of change can be considered as a function of the discrete variable X, which represents the potential changes. The i-th value of X is designated as Xi. Then, the POC can be calculated by the below formula (Chryssolouris and Lee Citation1992; Chryssolouris Citation2006):
(1)
(1) where
D is the number of potential changes,
Xi is the i-th potential change,
Pn(Xi) is the penalty (cost) of the i-th potential change and,
Pr(Xi) is the probability of the i-th potential change to occur.
The abovementioned formula for the calculation of the penalty of change can be interpreted as the expected value of cost if a change occurs. The change is usually the system’s response to some external excitation (e.g. modifications in the demanded volume of product(s)) or internal excitation (e.g. machine breakdown). When the state of the market changes (e.g. the demand volume increases), then the system may also change as a response to the market change. Typical system changes are the expansion or contraction of production capacity, by adding or removing resources and increasing the production range (e.g. using new tools, adopting new production processes etc.). Changing the system usually encompasses a potential penalty cost Pn(Xi). The penalty cost may include relevant costs, such as the equipment investment cost (machines, tooling, etc.), labour training, reprogramming, opportunity costs and others.
A manufacturing system can be considered a continuous system. In such a case, there is an infinite number of potential transitions and the variable X, representing the change scenarios, is then continuous. The cost of a potential change is represented by a continuous distribution Pn(X), while at the same time, the probability of change is also designated by a continuous probability distribution Pr(X). The product Pn(X)Pr(X) is a distribution of the ‘normalised’ distribution cost, with its integral being the expected value of cost, which provides a measure of the system’s resilience. Then, the POC calculation formula is transformed as follows (Chryssolouris and Lee Citation1992; Chryssolouris Citation2006):
(2)
(2) where
X1 is the lowest value of the potential change X,
X2 is the highest value of the potential change X,
Pn(X) is the cost distribution and
Pr(X) yields the probability distribution of the potential change.
The POC calculation may be thought of as a single attribute decision-making under uncertainty, including potential change scenarios, the probabilities and a typical penalty cost of each individual scenario. POC is proposed as a generic measure, since it combines technological and economic terms. It does not require large and complex amounts of data for calculations. In contrast with the majority of literature approaches, it is relatively easy to be applied to realistic manufacturing situations and to be interpreted by the management. Specifically, the measure may use market scenarios for the resilience evaluation of the possible purchases to enhance mid- to long-term perspective of investment decision concerning technology selection or production line’s design, furthermore assisting business planning. The main question that the POC tries to address is: How resilient should be a manufacturing system that is acquired now to accommodate changes in the future? The main advantage of the method is that different production-related aspects, such as varying types of products, operational status and varying demand, can be described and utilised in a common context. Additionally, the POC can be easily extended to assess resilience in temporal terms, if time is considered as the penalty (cost). However, its dependency on the probabilities and the corresponding costs of the potential changes is a critical disadvantage. In many cases, these values are subjectively estimated by relevant stakeholders, and thus the final resilience assessment figures are sensitive to those initial and, sometimes, subjective estimates. One important strategic question that manufacturers have to address is: in which manufacturing systems’ technology should I proactively invest in order to be resilient in the future? The selection and investment upon specific types of technology (e.g. 3D printing versus injection moulding) has an impact the response of the system to future events. POC can evaluate alternative investment decisions by calculating the POC for each option and then comparing the outcomes. In this manner, decision-makers may acquire an estimation on the resilience performance of the alternative options, that is, they will know which option performs the best in terms of resilience. Strategic investment costs that proactively occur can also be considered in the decision-making process, by including them in the POC formula.
4. Method implementation in industrial case studies
For the proposed method for resilience assessment to be applied and evaluated, a COVID-19 related pilot case has been formulated and applied to two hypothetical manufacturing systems that produce plastic products for the automotive industry supply chain. The objective of the pilot case is to compare the resilience of two different types of manufacturing systems under the COVID-19 pandemic. The first system is based on 3D printing (Additive Manufacturing) technology, while the second one is on injection moulding. The industrially relevant pilot case considers several COVID-19 pandemic-related events and is applied to both production systems. Before the pandemic, both hypothetical systems were producing two similar products: Product A for the 3D-printing based system and Product B for the injection moulding system. When the pandemic hit the world, both systems saw a drop in demand for their products, and consequently, there was a drop in their production volume. However, they saw an opportunity for entering the medical equipment supply chain as the demand for medical products increased. It is assumed that the two production systems do not belong to the same company. The rationale behind this assumption is to simplify the analysis, as it is not needed to include any possible inter-company interactions in the resilience assessment model, which would add more complexity without adding any significant insight to the application and the verification of the proposed resilience assessment method. Additive Manufacturing (AM) technology is already applied in the medical field. In fact, AM has been used in a wide range of healthcare use cases, including, but not limited to, the production of hearing aids, dental implant guides, medical models, bones and medical devices (Aimar, Palermo, and Innocenti Citation2019), and medical masks. On the other side, injection moulding is a traditional process involved in medical engineering, almost for producing every type of plastic medical device (Amellal et al. Citation1994).
4.1 Pilot case description
In this paper, an industrially relevant series of events is presented, illustrating the behaviour of two different production systems, those of a 3D-printing farm and an injection moulding plant, during the COVID-19 pandemic. The pilot case considered consists of three primary disruptive events, as follows:
Event 1: This is considered the zero hour of the scenario (to) – it can be considered the day at which the COVID-19 disease is officially declared a pandemic. Till that time, both manufacturing systems produced two different but similar products, product A (assigned to the 3D printing farm case) and product B (assigned to injection moulding plant), which are parts of the automotive supply chain. When the pandemic starts spreading throughout the globe, the demand for medical (e.g. respirator) parts starts increasing. In contrast, the demand for products A and B starts decreasing due to decreased demand and disruptions in the supply chain. Considering that the automotive sector has suffered a decrease of −28.8% on demand during the first wave of the pandemic (de Vet et al. Citation2021), we consider a reduction at a scale of −30% on the initial demands for both products A and B. Both manufacturing systems decide to respond to the new demand for respirator parts and start making changes in their plants to produce these parts and join the medical equipment market.
Event 2: With the spreading of the COVID-19 pandemic worldwide, additional manufacturers have also started producing components for medical devices, such as respirators. At some point (t3), the gap between the demand for respirators and the global production has been balanced and the market is then saturated. Although the initial demand is being covered by 3D-printing manufacturers, since 3D printers are more flexible systems in terms of adjusting their production to new products, when additional injection moulding manufacturers join the market, the latter can cover the demand more efficiently, as their productivity rates are multiple times those of 3D printers. In addition, injection moulded products are typically cheaper than 3D-printed ones, and as a result, customers prefer them instead. However, the time at which the market will be saturated is characterised by a significant degree of uncertainty since it depends on several factors, namely the number of competitors that will also join the market and the magnitude of the pandemic. The more manufacturers enter the market, the faster the market saturation. Likewise, the higher the impact of the pandemic, the longer the delay of saturation. For the present work and to examine the sensitivity and the robustness of the proposed measurement method as an adequate and suitable metric for resilience assessment, different possible options (occurrence timestamps and assigned probabilities) have been considered for this event.
Event 3: Event 3 depicts the gradual fade-out of the pandemic. The time at which the pandemic will start to weaken (t5) depends on several stochastic parameters, such as the vaccination programme, the efficiency of the vaccines, their acceptance by society and more. As a recovery plan, the acceleration of the vaccination programme is assumed to lead to an easing of COVID19-related restrictions and will slow down the economic turmoil by increasing consumer confidence (Khalfaoui et al. Citation2021; Lea Citation2021), and in due time restore normality to the market. Similarly, the higher the vaccination rate worldwide, the sharper the return to pre-COVID19 production. Nevertheless, the success of the recovery strategy might be negatively affected by notable parameters, such as a potential social hesitancy against the vaccines or the emergence of new, more infectious variants, against which the initial vaccines might not offer protection. These vaccination hindering factors introduce considerable uncertainty in how the vaccination programme will overcome the pandemic. This uncertainty is encapsulated in the probability of the time at which event 3 will occur. However, this work does not draw any quantified relationships between the vaccination rate uncertainty and the Event 3 timing and probabilities, although the proposed POC formula would introduce such a relationship. It is assumed that by the time that 70% of the population has received the vaccine, the pandemic will start fading out, and this is expected to allow the supply and demand sides to return to pre-pandemic patterns. The demands for the nominally similar products A and B start increasing up to their pre-pandemic status. In contrast, the demand for respirator parts declines to pre-pandemic status. At that time, both production systems may decide to leave the respirator parts’ market and sustain the production of their original products A and B.
To assign the probabilities for the calculation of the measurement quantity and estimate a probability distribution for Event 3, data from 15 countries concerning their vaccination programmes’ progress, reported until May 11, 2021 (Our World in Data Citationn.d.) have been considered. In the present pilot case, these countries could be considered markets that serve both production systems. To make things happen, we estimated the vaccination rate (% of vaccinated population per day) for each one of the selected countries, and we made a rough forecast for the time that each country’s vaccination percentage will have reached 70%, in parallel including plus 15 days for the acquisition of immunity against the virus. Used data and immunity forecasts are shown in Table .
Table 2. Rough immunity forecast analysis for selected countries (data valid until May 11, 2021).
Immunity forecasts reported in Table , have been estimated under the assumption that vaccination rates of the above mentioned countries remain constant until the end of their vaccination programmes and the vaccines will continue to be effective against all possible virus mutations and variants that may incur. Using Maximum Likelihood Estimation (MLE) (Myung Citation2003), forecasts and, subsequently, Event 3, seem to follow a log-normal distribution with the indicated parameters in Equation (3):
(3)
(3) In other words, the log-normal distribution in Equation (3) is the best one that describes the occurrence probability of the pandemic fading out across time, according to Table ’s data. This distribution might be used to calculate the resilience metric, according to its definition, provided in Equation (2). For the POC, based on Equation (1), to be demonstrated, the occurrence times of the events are considered discrete variables. More specifically, immunity forecasts are clustered into 3 groups and each one is represented by its median value. The probability of each one class is assumed according to the Classic (Laplace’s) Definition of Probability. The assumed probabilities are reported in Figure . Figure illustrates the histogram and the probability distribution of the third event’s occurrence, or equivalently, the histogram and distribution of the immunity forecasts, according to Table ’s data.
Figure 1. COVID-19 Pandemic fade-out histogram and probability distribution based on immunity prognosis (using vaccinations data valid until May 11, 2021).
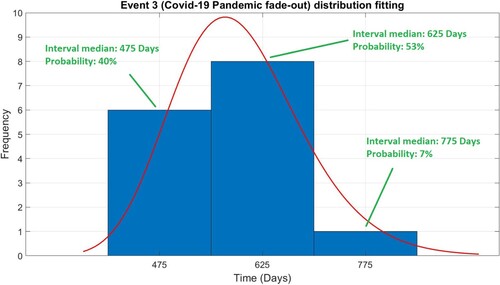
In Figure , the horizontal axis represents the time (in days) at which global immunity against the virus will be achieved, while the vertical axis depicts the observed frequencies for each histogram’s class in our dataset (Table ).
The following sub-sections, namely 4.1.1 and 4.1.2, describe the responses of the 3D printing farm and injection moulding systems, respectively including in the industrial scenario constructed. The disruptive events within the pandemic’s timeline are illustrated in Figures and that follow
Figure 2. Response of the 3D printing production system during the scenario’s execution.
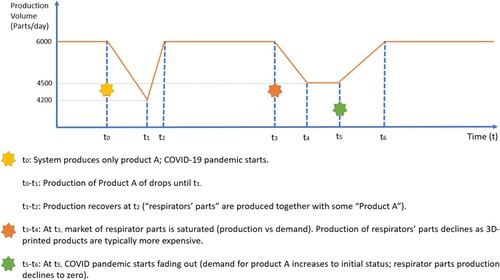
Figure 3. Response of the injection moulding system during the scenario’s execution.
4.1.1 Printing farm
The initial use case for the proposed measurement method to be applied is a 3D-printing farm, consisting of six 3D printers, each one being able to produce up to 1000 parts per day, which is a typical number for industrial 3D printers (Stavropoulos et al. Citation2020). The process works by laying down thin layers of liquid plastic and then fusing the layers. During the pandemic, the 3D-printing farm system modifies its production volume and its produced output to reflect the emerging changes on the demand. This response is illustrated in Figure . The horizontal axis presents the timeline of the occurring events (as described in the previous section), and the vertical axis the changes in the system’s daily production volume during the pandemic. The behaviour, shown in Figure , is explained in more detail in the following text.
Event 1 – Pandemic outbreak: As shown in Figure , up to to, the 3D-printing farm had been producing 6000 type-A products per day until the COVID-19 pandemic strikes. At that time, demand for the Product A starts to decrease gradually. The AM plant reflects demand upon the market and reduces its productivity accordingly, but the owners decide to design and produce respirator components, aiming to make up for the lost production volume. After two months, at time t1, the system gets certification for the newly designed part and starts recovering. By then, the demand for the initial Product A has reduced by 30%. However, by the time the system has started the production of the new medical parts, the system moves to a new ramp-up phase (t1 − t2), where process parameters for the new products are gradually optimised. After 3 weeks, the system has fully recovered its maximum production rate by time t2, when respirator parts are being produced with Product A.
Event 2 – Market saturation: After a period, the medical equipment market is saturated (t3) and global production is balanced with market demand, as additional competitors using injection moluding technology have joined the market. Since the 3D-printed products are typically more expensive than the injection-moulded ones, the demand for 3D-printed respirator parts begins to decrease, as illustrated in Figure . As a response to the new market situation, the system reduces the production of respiratory parts, resulting in a decrease of its overall production volume by 25% within the next 2 months, reaching a production volume of 4500 parts per day at a time t4.
Event 3 – Pandemic fade-out: At the end, when the pandemic begins to fade out (t5), the system declines the production of its medical parts to zero, while the demand for the initial product increases again to its initial status over the next 3 months. The production system returns to its initial status (product type and productivity) by time t6. The durations of all temporal constants used in the above implementation and mainly concern technological processes, given in Figure , are summarised in Table .
Table 3. Scenario temporal constants used for the 3D-printing farm use case.
4.1.2 Injection moulding
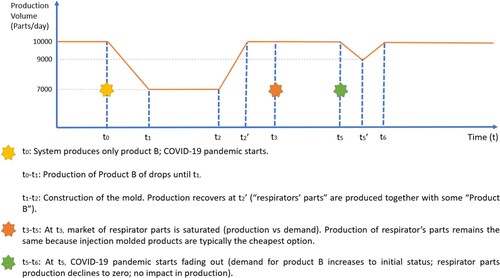
Injection moulding works by injecting molten material (in this case plastic) into a mould, where it cools and hardens, finally matching the shape of the mould. The system’s maximum daily production capacity is up to 10000 parts, an average number for this type of forming system (Stavropoulos et al. Citation2020). The behaviour of the injection moulding system during the pandemic’s (or scenario’s) timeline is shown in Figure and described in detail in the remaining of the section, in the function of the disruptive events.
Event 1 – Pandemic outbreak: At the start of the pandemic (to), the injection moulding system produced Product B. Within the next 2 months, the engineering managers started realising that the pandemic was going to affect the demand for the initial product and thus, decided to design respirator parts to adapt to the new situation. By the time the new product received certification (t1), demand for the initial product had already decreased by 30%, as illustrated in Figure . The system started the construction of the new mould for respirator parts. The manufacturing of the mould finished 8 weeks later (t2) and it was then that the system began the production of the new parts, alongside Product B. The injection moulding process will ramp up to the initial productivity at time t2’, as shown in Figure . As the ramp-up rate for the forming processes is slightly lower than that of the AM processes (Stavropoulos et al. Citation2020), it has been considered that the injection moulding’s ramp-up rate is approximately 80% of 3D printing’s rate. Thus, the injection moulding system will reach its initial production volume at approximately 44 days after starting the respirator parts’ production.
Event 2 – Market saturation: A key difference of the injection moulding system is that it can be safely assumed that it is not affected by Event 2 (t3). While the healthcare market gets saturated from the pandemic-related medical parts, however, the system does not suffer any decrease in the demand for its new product, as depicted in Figure , since the customers will continue to prefer it, because injection moulded products are typically the most economic ones.
Event 3 – Pandemic fade-out: Finally, when the COVID-19 pandemic starts fading out (t5), the demand for respirator components is inversely decreased with the demand for the initial product. The manufacturing process is then being transformed to restore the pro-pandemic production volume of product B. However, due to the undergoing transformation, the system encounters some production loss, which from one point onwards (t5’) is gradually eliminated, as shown in Figure , and the initial production status is recovered. Temporal constants for the assumed periods in the above implementation are summarised in Table .
Table 4. Scenario temporal constants used for the injection moulding use case.
4.2 Application of the resilience measurement method
4.2.1 Estimation of resilience
The penalty function Pn(X) represents the occurring cost, due to the decision for the production’s change and transformation. In this study, the ‘penalty’ refers to the percentage of the lost production volume during the disruption events. The production capacity is assumed to remain unchanged in both systems. Although this is not necessarily correct, because of the imposed personnel restrictions during the COVID-19 era, it is considered that the capacity is retained, as both 3D-printing and injection moulding production methods are characterised by a high degree of automation.
Production loss during the different events is mainly due to (1) process changes; and (2) demand variations. Process modification results in a cost, the production loss in our case, which is required to adapt to an event. Typical examples of process changes in manufacturing industries include the acquisition of a new machine, new tooling, parameters fine-tuning, breakdown delays or defects due to procedure ramp up. On the other side, market variations, and specifically lost sales, force the system to decrease its daily production volume for some time. Therefore, the Penalty Function for scenario X, which is the percentage production loss, is considered as described in the following Equation (4):
(4)
(4)
where the ‘Expected Production Volume in No Change’ is the equivalent number of products that would have been produced by the end of the scenario if no disruption had occurred. In industrial practice, one could use the net production loss for estimating the penalty function Pn(X) instead of the percentage loss. However, expressing the penalty in a dimensionless way offers a more robust measurement for resilience, meanwhile enabling the comparison among production systems with different production capacities.
4.2.2 Method demonstration in industrial pilot case
For the demonstration of the proposed method, five different executions of the proposed pilot case, concerning varying occurrence times and probabilities for market saturation (Event 2), have been examined.
Execution 1: To begin with, it is assumed that the occurrence of Event 2 is normally distributed across time. Under normal circumstances, market saturation is expected to occur approximately in 25, 27, or 29 weeks after the declaration of the pandemic. The structure and the assigned probabilities for the execution of this scenario are depicted in Figure . As illustrated in Figure , the assumed series of events can be carried out in 9 different ways (Xi, i = 1, 2, 3, … , 9), which are considered as the occurring scenarios. Table provides the calculations of the proposed resilience metric for the 3D printing and the injection moulding systems accordingly.
Figure 4. Scenario structure and assigned event probabilities for Execution 1.
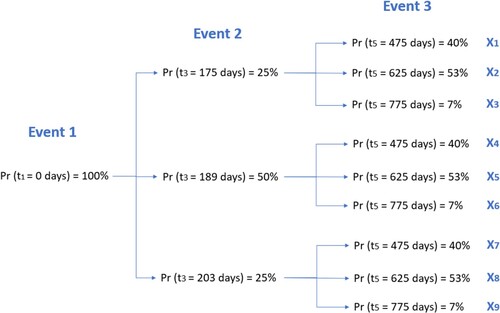
Table 5. Application of the resilience assessment method in the industrial pilot cases for Execution 1.
Table indicates that, under normal circumstances, the injection moulding production system is much more resilient (lower POC) than the 3D-printing farm. The outcoming result was expected since the forming processes, and subsequently, the injection moulding, are preferable against AM when dealing with mass production (Chryssolouris Citation2006). However, it is useful to further investigate what happens in more extreme situations.
Execution 2: The scenario structure of Figure is modified for market saturation to happen either in 105 days with a probability of 25%, in 126 days with a probability of 50%, or in 147 days again with a probability equal to 25%. POC calculation for both manufacturing systems is presented in Table .
Table 6. Application of the resilience assessment method in the industrial pilot cases for Execution 2.
Table shows that the POC of the 3D-printing farm has increased (by 0.0241). The POC for the injection moulding remains unaffected, since market saturation has no impact on its sales.
Execution 3: From the previous scenario executions, it is obvious that the POC for the injection moulding system remains the same since the system is not affected by whether the market will get saturated or not. However, in Event 2 change, it is expected that the POC of the injection moulding system would remain the same, but the POC of the 3D printing would probably change. To validate our hypothesis, it has been considered that market saturation has the same probability to occur – either in the early days (105 days), in the middle (245 days), or towards the end (385 days) of the pandemic with a probability of 33.3%. The scenario’s structure parameters, shown in Figure , have been modified accordingly and the results arising from the application of the POC are presented in Table .
Table 7. Application of the resilience assessment method in the industrial pilot cases for Execution 3.
Following the calculation, the POC of the 3D-printing farm is significantly reduced, but it remains much higher than that of the injection moulding system. On the other hand, the POC of the injection moulding remains practically unchanged.
Execution 4: A favourable outcome for the 3D-printing farm is that market saturation is delayed as much as possible and happens shortly before the end of the pandemic. In such a case, the system will suffer a lower production loss. It will therefore have a lower POC value than those of the previous executions of the scenario, since sales will be at the desired level for most of the pandemic period. For the evaluation of the POC, the possible occurrence times for Event 2 are thought to be in 378 days with 25% probability, 392 days with 50% probability, or 406 days with 25% probability. The results from the application of the POC are presented in Table for the 3D-printing farm and the injection moulding production systems, respectively.
Table 8. Application of the resilience assessment method in the industrial pilot cases for Execution 4.
The 3D-printing farm is approaching very closely the resilience level of the injection moulding system, which is expected, as there is less loss of sales and production volume. Nevertheless, market saturation will have to be delayed even further for the 3D-printing farm to reach or outperform the resilience level of the injection moulding process.
Execution 5: Finally, the 3D-printing farm’s engineers would ideally prefer the market for respirators not to show any signs of saturation whatsoever. For that to happen, either very few stakeholders should join the market, or the pandemic should have such a huge impact on it, that it would prevent demand from being easily covered. In this case, the farm’s sales would remain constant. If Event 2 does not take place or it does at the same time as Event 3, the 3D printing system will behave a little bit different, as shown in Figure . The system will drop to 75% of its capacity as soon as the pandemic begins to fade out and will wait for its gradual recovery. In such a case, the 3D printing system appears to be more resilient. The scenario overview for this occasion is depicted in Figure , and the calculations of the POC for the two production systems are reported in Table .
Figure 5. Response of the 3D printing farm system for Execution 5 compared to previous behaviour (in dashed orange lines).
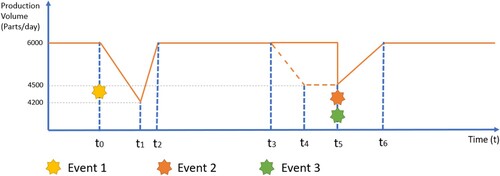
Figure 6. Scenario structure and assigned event probabilities for Execution 5.
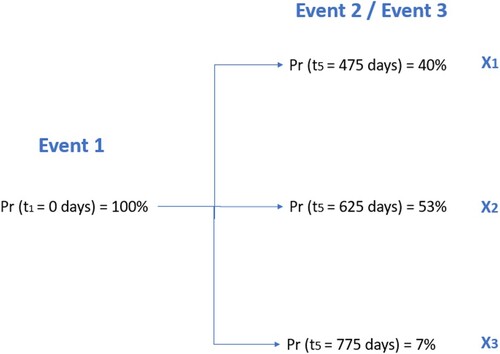
Table 9. Application of the resilience assessment method in the industrial use cases for Execution 5.
Based on the results, the initial hypothesis that the 3D-printing production system, in such a case, seems to be more resilient than the injection moulding one has been confirmed. However, it is obvious that the aforementioned scenario is almost unlikely to happen in such a global crisis, but it is very useful for demonstrating the POC measurement method.
4.2.3 Discussion on the pilot case
Overall, the five possible scenarios/executions have been described so that they have allowed for the validation of the proposed method. In Execution 2, the assumptions are obviously against the 3D-printing system, and the application of the POC method verifies the initial hypothesis. Executions 3 and 4 have defined in a manner that the performance of the 3D-printing system should be improved, compared to Execution 2, and this assumption has been verified by the POC calculation. Then, Execution 5 describes a rather extreme scenario that would have favoured the 3D-printing system, and this has been again verified by POC. Consequently, the scenario executions have shown that the POC measurement can properly quantify resilience as the initial hypotheses have been verified in all executions. Moreover, in this pilot case, the injection moulding system seems to outperform the 3D-printing system, as it has better results in all cases apart from one.
The demonstration of the POC method in the present pilot case justifies the approach's applicability in industrial practice. Manufacturing companies may use the proposed measure to acquire a better understanding of the resilience levels of their systems and processes and identify vulnerable parts. Moreover, resilience can be a vital attribute considered in technology selection, resulting in more educated and efficient investments and serving as a baseline for comparison among various alternative assets or configurations of a manufacturing system.
5. Conclusions and outlook
Most of the scientific literature in resilience measurement focuses on the supply chain level. This work contributes to this topic by investigating resilience at the manufacturing plant level. Previous work (Hosseini, Barker, and Ramirez-Marquez Citation2019) considers deterministic models for describing future scenarios, while the present work proposes a probabilistic model that weights the impact of possible events, which makes the assumptions more realistic. Moreover, this work extends previous work on resilience by investigating how resilience could be assessed concerning some pandemic scenarios such as COVID-19. In response to the lack of quantitative measures for assessing the resilience level of manufacturing systems, the ‘Penalty of Change’ measurement method is proposed and evaluated in an industrially relevant scenario linked to COVID-19. The scenario considers two different production systems capable of producing similar products: (1) a 3D-printing farm; and (2) an injection moulding plant. The design of the evaluation scenario consisted of a series of events, linked with the variance of the demand for medical material during the pandemic and with the transition of a manufacturing system towards producing a new type of product. The scenario was adjusted to and carried out in different ways, during the application of the resilience measurement method, to enable the method’s evaluation under different circumstances. Varying event probabilities and occurrence periods were used to assess the sensitivity and the robustness of the proposed measure. The implementation and validation of the proposed method have highlighted its strengths and limitations. As far as strengths are concerned, the method is relatively straightforward in its application, as it is based on the identification of possible events, an assessment of the impact of the events upon the manufacturing system and an estimate of the probability of each event to occur. Moreover, the method is rather generic as it can be used to assess resilience for different production systems such as the 3D printing and injection moulding systems. One of the weaknesses of the method is that its reliability is on subjective assumptions on the possible events and estimations on the probabilities of these events to occur. However, in some cases, the subjective estimation could be based on previous data or have multiple subjective estimations, from different experts or groups of experts, and utilise the average value.
The demonstration of the proposed approach has shown that the ‘Penalty of Change’ may be considered as a suitable and reliable methodology for the assessment of the resilience level in manufacturing systems with large production volumes. Therefore, production engineers might have to consider an aspect when applying the measure to their own cases, which is the modelling of the potential events or disruptions, and in particular, time discretisation. Although time is continuous, in many cases, it is difficult to estimate the parameters of a probability density function that can describe an event that may occur in the future; thus, proper discretisation and probability assignments are useful in such circumstances. In any case, the successful implementation of the proposed method in future factories’ practice requires the installation of appropriate IT systems and software tools within a company, such as forecasting models and/or data analytics algorithms, to enable the identification and assessment of potential future disruptions and market trends.
Following the present scientific publication, future scientific work will mainly include: (1) the demonstration of the proposed resilience measure in a pilot case, considering continuously distributed occurrence times for disruptions; (2) the investigation of additional measures that might also be suitable for resilience assessment, together with a comparative study; and finally (3) the development of a complete software solution, consisting of data analytics tools and forecasting models for the identification and assessment of potential risks, disruptions and market fluctuations, in uncertain manufacturing environments.
Disclosure statement
No potential conflict of interest was reported by the author(s).
Data availability statement
The authors confirm that the data supporting the findings of this study are available within the article.
Additional information
Notes on contributors

Kosmas Alexopoulos
Dr. Kosmas Alexopoulos graduated from the Computer Engineering and Informatics Department in 1999 and received a Ph.D. in the flexibility in production systems in 2006 from the University of Patras, Greece. He works as Senior Researcher at the Laboratory for Manufacturing Systems and Automation (LMS) in the Department of Mechanical Engineering and Aeronautics of the University of Patras. His research area and expertise include the fields of smart factory, digital factory, flexibility of manufacturing systems, virtual reality, internet of things, cyber-physical systems, industrial product-service systems, semantics, production scheduling and artificial intelligence.

Ioannis Anagiannis
Mr. Ioannis Anagiannis received an equivalent M.Eng. diploma in Mechanical and Aeronautics Engineering from the University of Patras, Greece, in 2021. He is working as Research Engineer at the Laboratory for Manufacturing Systems & Automation (LMS), Department of Mechanical Engineering & Aeronautics, University of Patras. His research fields mainly focus on mathematics/physics-based modelling, predictive maintenance, simulation modelling and stochastic data analytics applications.

Nikolaos Nikolakis
Dr. Nikolaos Nikolakis received the B.Eng. and MSc degree in Electrical Engineering and Computer Science in 2014, and the Ph.D. degree in Cyber-physical Production Systems in 2020 from the University of Patras, Greece. He received an MBA from HOU, Greece, in 2020. He currently works as a post-doctoral research engineer at the Laboratory for Manufacturing Systems & Automation in the Mechanical Engineering Department of the University of Patras in Greece, focusing on industrial planning and control, smart manufacturing and cyber-physical systems.

George Chryssolouris
Prof. George Chryssolouris is Professor Emeritus at the Department of Mechanical Engineering and Aeronautics of the University of Patras, where he was Chairman between 2003 and 2007. He received a Ph.D. (Dr.-Ing.) in Engineering from the University of Hannover, Germany (1979) and a Diploma (M.S.) in Mechanical/Electrical Engineering from the National Technical University of Athens, Greece (1975). He is the founder of the Laboratory for Manufacturing Systems and Automation (LMS). He was the President of CIRP, the Paris-based International Academy for Production Engineering for 2006-2007. He was granted the Frederick W. Taylor Research Medal by SME (2001) for his outstanding contributions to manufacturing research. He was also the recipient of SME's Young Outstanding Manufacturing Engineer Award (1986). Professor Chryssolouris has over 400 publications in international scientific journals and refereed conferences. He is the author of two books published by Springer Verlag.
References
- Aimar, A., A. Palermo, and B. Innocenti. 2019. “The Role of 3D Printing in Medical Applications: A State of the art.” Journal of Healthcare Engineering 2019: 10. Article ID 5340616. 10.1155/2019/5340616.
- Alexopoulos, K., N. Papakostas, D. Mourtzis, and G. Chryssolouris. 2011. “A Method for Comparing Flexibility Performance for the Lifecycle of Manufacturing Systems Under Capacity Planning Constraints.” International Journal of Production Research 49 (11): 3307–3317. doi:10.1080/00207543.2010.482566.
- Amellal, K., C. Tzoganakis, A. Penlidis, and G. L. Rempel. 1994. “Injection Molding of Medical Plastics: a Review.” Advances in Polymer Technology: Journal of the Polymer Processing Institute 13 (4): 315–322. doi:10.1002/adv.1994.060130407.
- Arsovski, S., Z. Arsovski, M. Stefanović, D. Tadić, and A. Aleksić. 2017. “Organisational Resilience in a Cloud-Based Enterprise in a Supply Chain: a Challenge for Innovative SMEs.” International Journal of Computer Integrated Manufacturing 30 (4-5): 409–419. doi:10.1080/0951192X.2015.1066860.
- Bhamra, R., S. Dani, and K. Burnard. 2011. “Resilience: the Concept, a Literature Review and Future Directions.” International Journal of Production Research 49 (18): 5375–5393. doi:10.1080/00207543.2011.563826.
- Caputo, A., P. Pelagagge, and P. Salini. 2019. “A Methodology to Estimate Resilience of Manufacturing Plants.” IFAC-PapersOnLine 52 (13): 808–813. doi:10.1016/j.ifacol.2019.11.229.
- Cardoso, S. R., A. P. Barbosa-Póvoa, S. Relvas, and A. Q. Novais. 2015. “Resilience Metrics in the Assessment of Complex Supply-Chains Performance Operating Under Demand Uncertainty.” Omega 56: 53–73. doi:10.1016/j.omega.2015.03.008.
- Carvalho, H., A. P. Barroso, V. H. Machado, S. Azevedo, and V. Cruz-Machado. 2012. “Supply Chain Redesign for Resilience Using Simulation.” Computers & Industrial Engineering 62 (1): 329–341. doi:10.1016/j.cie.2011.10.003.
- Chryssolouris, G. 2006. Manufacturing Systems Theory and Practice. 2nd Edition. New York: Springer-Verlag.
- Chryssolouris, G., and M. Lee. 1992. “An Assessment of Flexibility in Manufacturing Systems.” Manufac Turing Review 5 (2): 105–116.
- de Vet, J. M., D. Nigohosyan, J. N. Ferrer, A.-K. Gross, S. Kuehl, and M. Flickenschild. 2021. “Impacts of the COVID-19 Pandemic on EU Industries.” Publication for the committee on Industry, Research and Energy, Policy Department for Economic, Scientific and Quality of Life Policies, European Parliament, Luxembourg.
- Dinh, L. T., H. Pasman, X. Gao, and M. S. Mannan. 2012. “Resilience Engineering of Industrial Processes: Principles and Contributing Factors.” Journal of Loss Prevention in the Process Industries 25 (2): 233–241. doi:10.1016/j.jlp.2011.09.003.
- Garsten, E. 2020. “GM Begins Ventilator Production at Indiana Parts Plant.” Forbes Magazine. Accessed 25 April, 2021. https://www.forbes.com/sites/edgarsten/2020/04/14/gm-begins-ventilator-production/#5262faab4092.
- Gu, X., X. Jin, J. Ni, and Y. Koren. 2015. “Manufacturing System Design for Resilience.” Procedia CIRP 36: 135–140. doi:10.1016/j.procir.2015.02.075.
- Han, J., and K. Shin. 2016. “Evaluation Mechanism for Structural Robustness of Supply Chain Considering Disruption Propagation.” International Journal of Production Research 54 (1): 135–151. doi:10.1080/00207543.2015.1047977.
- Hosseini, S., K. Barker, and J. E. Ramirez-Marquez. 2016a. “A Review of Definitions and Measures of System Resilience.” Reliability Engineering & System Safety 145: 47–61. doi:10.1016/j.ress.2015.08.006.
- Hosseini, S., D. Ivanov, and J. Blackhurst. 2020. “Conceptualization and Measurement of Supply Chain Resilience in an Open-System Context.” IEEE Transactions on Engineering Management. doi:10.1109/TEM.2020.3026465.
- Hosseini, S., D. Ivanov, and A. Dolgui. 2019. “Review of Quantitative Methods for Supply Chain Resilience Analysis.” Transportation Research Part E: Logistics and Transportation Review 125: 285–307. doi:10.1016/j.tre.2019.03.001.
- Hosseini, S., A. Khaled, and M. D. Sarder. 2016b. “A General Framework for Assessing System Resilience Using Bayesian Networks: A Case Study of Sulfuric Acid Manufacturer.” Journal of Manufacturing Systems 41: 211–227. doi:10.1016/j.jmsy.2016.09.006.
- Khalfaoui, R., H. Nammouri, O. Labidi, and S. B. Jabeur. 2021. “Is the COVID-19 Vaccine Effective on the US Financial Market?” Public Health 198: 177–179. doi:10.1016/j.puhe.2021.07.026.
- Kusiak, A. 2019. “Fundamentals of Smart Manufacturing: A Multi-Thread Perspective.” Annual Reviews in Control 47: 214–220. doi:10.1016/j.arcontrol.2019.02.001.
- Lea, R. 2021. “The Bank’s Central Case: Vaccination Programme Should Lead to Easing of Restrictions and Rapid Recovery.” Arbuthnot Banking Group 8.
- Mattson, S., and A. Fast-Berglund. 2016. “How to Support Intuition in Complex Assembly?” Procedia CIRP 50: 624–628. doi:10.1016/j.procir.2016.05.014.
- Michalos, G., N. Kousi, P. Karagiannis, C. Gkournelos, K. Dimoulas, S. Koukas, K. Mparis, A. Papavasileiou, and S. Makris. 2018. “Seamless Human Robot Collaborative Assembly – An Automotive Case Study.” Mechatronics 55: 194–211. doi:10.1016/j.mechatronics.2018.08.006.
- Mourtzis, D., V. Zogopoulos, and F. Xanthi. 2019. “Augmented Reality Application to Support the Assembly of Highly Customized Products and to Adapt to Production re-Scheduling.” International Journal of Advanced Manufacturing Technology 105 (9): 3899–3910. doi:10.1007/s00170-019-03941-6.
- Munoz, A., and M. Dunbar. 2015. “On the Quantification of Operational Supply Chain Resilience.” International Journal of Production Research 53 (22): 6736–6751. doi:10.1080/00207543.2015.1057296.
- Myung, I. J. 2003. “Tutorial on Maximum Likelihood Estimation.” Journal of Mathematical Psychology 47: 90–100. doi:10.1016/S0022-2496(02)00028-7.
- Our World in Data. n.d. “Coronavirus (COVID-19) Vaccinations.” Statistics and Research. Accessed 11 May, 2021. https://ourworldindata.org/covid-vaccinations.
- Raj, R., J. W. Wang, A. Nayak, M. K. Tiwari, B. Han, C. L. Liu, and W. J. Zhang. 2015. “Measuring the Resilience of Supply Chain Systems Using a Survival Model.” IEEE Systems Journal 9 (2): 377–381. doi:10.1109/JSYST.2014.2339552.
- Rajesh, R. 2019. “A Fuzzy Approach to Analyzing the Level of Resilience in Manufacturing Supply Chains.” Sustainable Production and Consumption 18: 224–236. doi:10.1016/j.spc.2019.02.005.
- Ribeiro, J. P., and A. Barbosa-Povoa. 2018. “Supply Chain Resilience: Definitions and Quantitative Modelling Approaches – A Literature Review.” Computers & Industrial Engineering 115: 109–122. doi:10.1016/j.cie.2017.11.006.
- Rongier, C., M. Lauras, F. Galasso, and D. Gourc. 2013. “Towards a Crisis Performance-Measurement System.” International Journal of Computer Integrated Manufacturing 26 (11): 1087–1102. doi:10.1080/0951192X.2012.684711.
- Said, S., H. Bouloiz, and M. Gallab. 2020. ““Resilience Assessment of System Process Through Fuzzy Logic: Case of COVID-19 Context.” Advances in Science, Technology and Engineering Systems Journal 5 (5): 1247–1260.
- Sazvar, Z., K. Tafakkori, N. Oladzad, and S. Nayeri. 2021. “A Capacity Planning Approach for Sustainable-Resilient Supply Chain Network Design Under Uncertainty: A Case Study of Vaccine Supply Chain.” Computers & Industrial Engineering 159: 107406. doi:10.1016/j.cie.2021.107406.
- Shin, S., S. Lee, D. R. Judi, M. Parvania, E. Goharian, T. McPherson, and S. J. Burian. 2018. “A Systematic Review of Quantitative Resilience Measures for Water Infrastructure Systems.” Water 10 (2): 164. doi:10.3390/w10020164.
- Stavropoulos, P., A. Papacharalampopoulos, K. Tzimanis, and A. Lianos. 2020. “Manufacturing Resilience During the Coronavirus Pandemic: On the Investigation Manufacturing Processes Agility.” European Journal of Social Impact and Circular Economy 1 (3): 28–57. doi:10.13135/2704-9906/5073.
- Thomas, A., D. T. Pham, M. Francis, and R. Fisher. 2015. “Creating Resilient and Sustainable Manufacturing Businesses–a Conceptual Fitness Model.” International Journal of Production Research 53 (13): 3934–3946. doi:10.1080/00207543.2014.975850.
- World Health Organization (WHO), 2020. “Coronavirus disease (COVID-19) technical guidance: Essential resource planning.” https://www.who.int/emergencies/diseases/novel-coronavirus-2019/technical-guidance/covid-19-critical-items.