ABSTRACT
Supply chain visibility (SCV) has been gaining recognition in recent years as a key factor for achieving analytical capabilities and improving supply chain performance. However, levels of SCV implementation lag behind current technological advances. This research was motivated by the lack of visibility in inbound logistics, which limits the possibility of managing deviation, in particular concerning changes in arrival time of incoming goods, in large industrial firms. We addressed this problem by adopting a design science approach. In particular, we followed context–intervention–mechanism–outcome (CIMO) logic to map and analyse material and information flows. The problems areas were successively translated via business and functional requirements into technological solutions. We evaluated alternative technologies using controlled experiments that mimicked real-life situations. This study provides guidance for manufacturing companies aiming to enhance deviation management and predictive capabilities by improving visibility in their inbound logistics and potentially extending visibility to other areas, such as internal and outbound flows.
1. Introduction
Visibility in supply chains has become an inherent part of supply chain performance in recent years (Sodhi and Tang Citation2019; Bechtsis et al. Citation2021). The key characteristics of visibility are information accessibility, accuracy, timeliness, completeness, and usage to enhance operational and strategic activities (Somapa, Cools, and Dullaert Citation2018). Although the importance of supply chain visibility (SCV) has been widely recognised, supply chain practitioners still suffer from a lack of visibility due to lagging levels of practical implementation. Srinivasan and Swink (Citation2018) studied data from 191 global companies and revealed a consensus among industrial leaders on their need to improve visibility. Supply regulations demand that companies have visibility for activities such as, responsible sourcing (Swift, Guide, and Muthulingam Citation2019; Kittipanya-Ngam and Tan Citation2020), and meeting human rights obligations, which require companies to significantly improve their SCV (Dolgui and Ivanov Citation2022). The COVID-19 pandemic has exacerbated the consequences of low visibility for companies and organisations (Bechtsis et al. Citation2021; Kähkönen et al. Citation2021), and disrupted material supply and delivery processes thus negatively affecting productivity and revenue (Kalaiarasan et al. Citation2021; Yang et al. Citation2021).
Previous research has shown that technologies are vital for gaining organisational visibility (De Oliveira and Handfield Citation2019), including technologies for connectivity (Dubey et al. Citation2019, Citation2020), real-time data collection (Dolgui and Ivanov Citation2022), data management (Giannakis, Spanaki, and Dubey Citation2019), and data analytics and usage (Calatayud, Mangan, and Christopher Citation2019). However, there is a need for empirical research regarding the implications of technologies that target SCV systems (Kähkönen et al. Citation2021; Yang et al. Citation2021). Such studies can provide insights into the possibilities and limitations of improving visibility in practice (Lee and Rim Citation2016; Somapa, Cools, and Dullaert Citation2018; Sodhi and Tang Citation2019). Neglecting to develop an understanding of the practical aspects of visibility is likely to result in the inadequate implementation of visibility systems, leading to both financial and reputational losses (Swift, Guide, and Muthulingam Citation2019).
To address this research gap, we employed a design science (DS) approach (Holmström, Ketokivi, and Hameri Citation2009; Van Aken, Chandrasekaran, and Halman Citation2016) and cooperated with a global manufacturing company to understand and improve its inbound SCV. In particular, we applied DS to the case of a manufacturing company following context–intervention–mechanism–outcome (CIMO) logic (Denyer, Tranfield, and van Aken Citation2008). As recommended in the literature (Denyer, Tranfield, and van Aken Citation2008), a DS approach following CIMO logic is appropriate for addressing practical industrial issues, which in this case were real SCV problems faced by the case company. The research was motivated by the need to improve the company’s decision-making ability, allowing it to respond quickly to supply-related deviations (in particular, changes in arrival time of incoming goods) and increase its predictive capabilities. SCV was acknowledged as a key capability for achieving this objective. A particular feature of this research is that it evaluated various technologies for capturing and transmitting data to potentially improve the SCV of the company’s inbound logistics.
We contributed to the improvement of inbound SCV by collecting and analysing empirical data to understand the case company’s SCV requirements, and we conducted technology testing for a potential visibility system to support its inbound logistics. The requirements and technologies we tested accounted for the disruptions caused by the COVID-19 pandemic, and we aimed to enhance operational activities (such as real-time monitoring, planning, and forecasting) and support the company’s transition to autonomous inbound logistics. Our study provides direction for both practitioners and researchers intending to understand the possibilities and limitations of planning and testing technologies for visibility systems in practice.
The paper is structured as follows: First, we describe the related literature on the requirements and technologies for visibility. Second, we describe the DS approach based on CIMO logic, the data collection, and the data analysis. We then give details of the findings and insights from each step of applying CIMO logic to the case. Lastly, we discuss the results, implications, limitations, and suggestions for further research.
2. Related literature
The two latest systematic literature reviews on SCV have highlighted the need for a practical understanding of the development and implementation of SCV (Somapa, Cools, and Dullaert Citation2018; Kalaiarasan et al. Citation2022). Based on their review, Somapa, Cools, and Dullaert (Citation2018) called for more research on the development and implementation of SCV. Kalaiarasan et al. (Citation2022) proposed a framework that articulates a multi-faceted view of SCV and developed a future research agenda for understanding the practical dimensions of SCV.
Supply chain actors need to collaborate to achieve the common goals of SCV (Lee, Kim, and Kim Citation2014; Srinivasan and Swink Citation2018). Moreover, to successfully and effectively implement SCV, all actors need to systematically understand the process-related requirements underpinning technologies for data generation, handling, sharing, and usage, which is a current gap in the literature (De Oliveira and Handfield Citation2019; Sanders and Swink Citation2019). Previous studies on SCV have indicated that although it is important, it is difficult to establish SCV across supply chains. Kalaiarasan et al. (Citation2022) stated that improving SCV in practice requires a focus on requirements and technologies. However, the extant literature provides little guidance on how requirements for SCV can be mapped against technological solutions for improving SCV in practice (Kähkönen et al. Citation2021; Yang et al. Citation2021). To address this issue, we collaborated with the case company regarding practical perspectives on SCV. Considering the objective of the study, we focused on understanding their perspectives on the requirements for SCV, which were later used to test the technologies and improve SCV. The following sections review the requirements and various SCV technologies discussed in the literature. These formed the basis and reference points for our study before starting the empirical data collection.
2.1. Requirements for visibility
Previous studies have increased understanding of the requirements that should be considered when aiming to improve SCV. The framework proposed by Kalaiarasan et al. (Citation2022) revealed that the requirements for effective SCV relate to supply chain factors (culture, inter-organisational collaboration, and trust) and business processes (aligning businesses, information sharing, information quality, and supply chain integration). We elaborate on each requirement in the following sections.
Doetzer (Citation2020) conducted 49 semi-structured interviews with supply chain experts from 30 companies located in Germany, Japan, and the United States (US). The study revealed the importance of cultural adaptation in improving SCV. A culture that nurtures information sharing is crucial for establishing visibility (Doetzer Citation2020), and utilising technologies to improve visibility requires effective interorganisational collaboration (Wang and Wei Citation2007; Brun, Karasosman, and Barresi Citation2020), both upstream and downstream, in supply chains (Srinivasan and Swink Citation2018). Kaipia and Hartiala (Citation2006) asserted that developing relationships with suppliers and customers can help companies benefit from SCV. Trust is a vital requirement for building and maintaining collaboration among supply chain actors (Wang and Wei Citation2007; Dubey et al. Citation2018; Brun, Karasosman, and Barresi Citation2020). Common and similar business goals generally enable supply chain stakeholders to align processes to improve visibility (Lee, Kim, and Kim Citation2014), supporting the introduction of technologies for visibility and enhancing both operational and strategic activities (Bechtsis et al. Citation2021; Kalaiarasan et al. Citation2021). However, SCV must be planned in detail and synchronised by supply chain actors (Wang and Wei Citation2007; Lee, Kim, and Kim Citation2014). Studies have shown that information sharing is a key requirement for attaining SCV (Kaipia and Hartiala Citation2006; Barratt and Oke Citation2007). In fact, SCV is a crucial outcome of information sharing across supply chains (Brandon-Jones et al. Citation2014; Dubey et al. Citation2019; Dubey et al. Citation2020). Regarding information sharing, Barratt and Oke (Citation2007) urged supply chain actors to address information quality for SCV, arguing that information must be evaluated in terms of its usefulness. However, this requires a certain level of integration with other upstream, internal, and downstream actors in supply chains (Williams et al. Citation2013; Munir et al. Citation2020). For instance, based on their case study, Kim et al. (Citation2011) argued that SCV is improved by supply chain partners’ internal integration and by IT infrastructure that is capable of supporting interorganisational communication.
2.2. Technologies for visibility
A review of current technologies for visibility revealed that they should (1) enable data connectivity, (2) achieve real-time data generation and collection, (3) facilitate data management, and (4) ensure that data usage can improve operational and strategic activities (Sanders and Swink Citation2019).
Regarding data connectivity, past studies have shown that information technology (IT) infrastructure has a direct impact on the level of visibility among supply chain partners (Kim et al. Citation2011). Based on data from 264 United Kingdom (UK)-based companies, Brandon-Jones et al. (Citation2014) concluded that supply chain connectivity, including IT infrastructure, leads to SCV. More recent studies have also identified connectivity as an enabler of visibility (Dubey et al. Citation2019, Citation2020). However, Dubey et al. (Citation2019) warned that connectivity for visibility depends on the quality of the information.
Real-time data can be collected using sensor-based technologies (Dolgui and Ivanov Citation2022), such as radio frequency identification (RFID), which has been widely applied in various industries. Fosso Wamba et al. (Citation2008) investigated the application of RFID in the retail industry. They conducted a pilot study based on warehousing activities and concluded that the implementation of RFID can enhance performance-related activities, such as shipping and receiving. They claimed that integrating RFID into broader supply chains can support end-to-end visibility. Brintrup, Ranasinghe, and McFarlance (Citation2010) claimed that RFID can enhance visibility in manufacturing processes through automated data collection. Challengingly, they indicated that RFID may not provide 100% accuracy and connectivity. Caridi, Perego, and Tumino (Citation2013) conducted a study focusing on visibility in outbound logistics activities and asserted that RFID can facilitate order visibility, leading to reduced costs and improved planning. However, they suggested that future research should measure the impact of visibility. Pero and Rossi (Citation2014) conducted a case study of RFID in an Italian manufacturing company and highlighted its ability to support real-time information sharing among key actors in the supply chain. As a next step, they proposed integrating information with subsystems to benefit from improved visibility. Pfahl and Moxham (Citation2014) examined the integration of RFID and SCV to develop a conceptual framework and proposed that RFID could enable SCV. Yu and Goh (Citation2014) mentioned that a high level of investment in RFID is proportional to the level of visibility gained. However, not all actors in supply chains have the budget to increase SCV (Yu and Goh Citation2014; Herrmann et al. Citation2015). Guo et al. (Citation2015), in a pilot implementation study, developed an RFID-based decision support system for production monitoring and planning. Although the resulting visibility improved risk management, resistance and a lack of training by users posed challenges for implementation. Papert, Rimpler, and Pflaum (Citation2016) proposed that RFID can improve visibility in pharmaceutical supply chains, and they further suggested developing a dashboard to effectively utilise improved visibility. Attaran (Citation2020) argued that the visibility gained from RFID enhances inventory management.
Data management includes storing, handling, and protecting acquired data. Internet of things (IoT) solutions for storing and handling data can support visibility (Attaran Citation2020), such as by providing cloud-based solutions for collaboration. Based on their case study, Barratt and Oke (Citation2007) concluded that collaborative planning systems facilitate visibility and supply chain linkage. Similar results were obtained in a case study by Barratt and Barratt (Citation2011), who found that a collaborative planning system resulted in close-to-real-time visibility of sales in the retail industry, leading to improved stock levels and lead times. A recent study found that cloud-based collaborative systems also increase visibility (Giannakis, Spanaki, and Dubey Citation2019), and blockchains have emerged as a potential technology to aid data security and support visibility (Bechtsis et al. Citation2021). Based on a survey, Van Hoek (Citation2019) identified data protection as the driver of blockchain use, although the author mentioned that a lack of understanding of blockchains could prohibit possible implementation. Based on their pilot study in the UK, Wang, Chen, and Zghari-Sales (Citation2021) claimed that visibility is one of the anticipated outcomes of blockchains, followed by other factors, such as trust and security.
Data usage can be supported by technologies such as artificial intelligence (AI) and big data, which are especially valid for increasing predictive capabilities. Dubey et al. (Citation2018) collected survey data from 205 organisations and concluded that big data has an impact on the predictive capabilities and visibility of supply chains. In their systematic literature study, Calatayud, Mangan, and Christopher (Citation2019) highlighted AI support as necessary for further improving visibility and enhancing predictive capabilities. This aligns with Kosasih and Brintrup’s (Citation2021) study suggesting that visibility in supply chains can be enhanced by AI using an alternative supply chain link prediction method.
3. Research design
3.1. Selection of the case company
This study was part of a large multi-year research project on SCV involving several industrial and academic partners, and it focused on the case of one of the industrial partners—a global manufacturing company considered a leader in transport solutions. The case company has approximately 50,000 employees across 100 countries and is ranked among the top three in terms of profitability. During the interactions, we identified that a lack of SCV led to undesirable consequences. In particular, the inbound flows were severely affected by the COVID-19 pandemic, which caused disruption on various levels. They considered SCV essential for improving the company’s deviation management and predictive capabilities. Thus, we considered the case company to ideally represent the manufacturing industry and to be well-suited for understanding and exploring SCV in inbound logistics flows. By focusing on a single case, this study provides a deep understanding of inbound SCV through interactions with various stakeholders and departments. It can also support effective time utilisation and nurture collaborative problem-solving when stakeholders share a common workplace and/or are seeking solutions for a common problem.
3.2. Design science approach
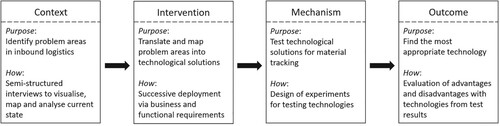
Considering the practical challenges of SCV in inbound logistics at the case company, we aimed to use a research approach that could help solve practical problems and to use the solutions to expand the existing knowledge of SCV. This aligns well with the Design Science (DS) approach, which focuses on improving practice by solving real problems and bridging gaps between practice and theory (Holmström, Ketokivi, and Hameri Citation2009; Van Aken, Chandrasekaran, and Halman Citation2016). DS considers existing problems and the knowledge generated by solving them. It is recommended for practical research involving systems (Van Aken, Chandrasekaran, and Halman Citation2016). Furthermore, DS research creates artificial phenomena or artefacts by using technologies to generate, collect, and evaluate data for solving real problems (Holmström, Ketokivi, and Hameri Citation2009). Researchers have claimed that such phenomena or artefacts can be examined using CIMO logic (Denyer, Tranfield, and van Aken Citation2008; Van Aken, Chandrasekaran, and Halman Citation2016). Hevner, March, and Ram (Citation2004) stated that CIMO logic can ensure robust and scientific solution development and is also appropriate for addressing practical industrial challenges and problems (Denyer, Tranfield, and van Aken Citation2008). Hence, we applied CIMO logic in our DS study (Denyer, Tranfield, and van Aken Citation2008). Context (C) explains the environment in which the problem occurs. Intervention (I) refers to the ability to influence the context and thereby contribute to solving the problem. The mechanism (M) is derived from the intervention, with the aim of solving the problem and achieving the expected outcome. Finally, the outcome (O) refers to the result of the intervention and can include improvements in, for example, performance, cost, and risk management.
3.3. Data collection
To fulfil the study objective, we participated in the project at the case company during the first half of 2021. We collected data by (1) observing, understanding, and recording the current state of inbound logistics and related problem areas due to a lack of visibility; (2) mapping the connections between current problem areas and business requirements; (3) collaborating with the project team to develop and align requirements for a potential visibility system; and (4) selecting and testing technologies based on identified requirements. The purpose was to identify the interrelationships between the current problem areas and the corresponding requirements. Data collection included participating in project meetings, conducting semi-structured interviews, analysing project documents, mapping current IT systems, and designing and participating in a pilot study. The research team consisted of three professors, one postdoctoral researcher, and one PhD student. The PhD student was also part of the project team at the case company. The project team was cross-functional and consisted of one project manager from inbound logistics, who focused on supply chain development (SCD), and two members of the Data and Mobility Services Department. During the pilot study (further explained in Section 4.3), four sensor-based technology suppliers, one IoT supplier, and one master’s degree student also participated. Table shows an overview and summary of the data collection process.
Table 1. Overview of the data collection.
3.4. Data analysis
This section discusses how the collected data were structured and analysed following CIMO logic (see Figure ). Addressing the context (C in CIMO logic) enabled us to identify the main problems in the inbound flows caused by a lack of visibility (listed in Section 4.1). First, we gathered information regarding the context through three semi-structured interviews with the SCD project manager at the case company, which included information about processes, IT systems, and flows of materials. Then, together with the research team, the PhD student further analysed and visualised the current state, which was presented to and verified by the SCD project manager. Next, the visualised current state was presented and discussed during two project meetings.
Figure 1. Data analysis based on CIMO logic.
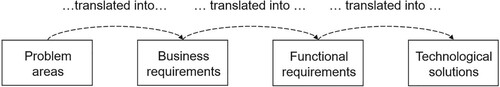
In this study, an intervention (I in CIMO logic) was proposed that would support the company by examining the requirements for a visibility system. The intervention was developed by the research team through the successive translation of current problem areas into technological solutions for a potential SCV system. We did this by adopting the essential components of quality function deployment (QFD; Hauser and Clausing Citation1988; Akao Citation1990), moving from current problem areas to business requirements through two semi-structured interviews with the SCD project manager. This included proposing a potential SCV system to incorporate and support both short-term and long-term inbound logistics goals. Next, the research team analysed the business requirements to determine functional requirements and collaborated with SCD project manager to ensure that the functional requirements aligned with the business requirements. Finally, the research team mapped the technological solutions to the functional requirements, then presented the proposed technological solutions to the project team to plan the pilot study.
The mechanism (M in CIMO logic) in this study was marked by the selection and testing of technological solutions for potentially improving inbound SCV. Based on the previously identified requirements, we planned and supported the testing of technologies to improve inbound SCV. This was mainly accomplished by the PhD student participating in the pilot study, which involved planning, supporting, and collecting the data (see Section 4.3).
In terms of outcome (O in CIMO logic) in this study, the IoT supplier provided connectivity and tracking precision results for each type of technology. The PhD student further reviewed the results with the project and research teams to understand the advantages and disadvantages of each solution (see Table ). Overall, as an outcome of this study, we observed that inadequate SCV could be overcome to yield improved inbound logistics performance (see Section 4.4).
We ensured data validity and reliability in this study by combining various data collection techniques (also referred to as triangulation) in the form of interviews, observations, and experiments. This enabled the weakness of one data collection technique to be offset by the strength of another. Choosing a case company that was well-suited for this study ensured the reliability and content validity of the obtained data and results.
4. Applying CIMO logic and the results
4.1. Context
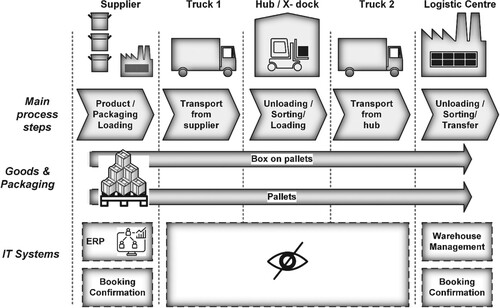
The case company regarded SCV as vital for improving deviation management, predictive capabilities, and the performance of their inbound logistics. Consequently, they were able to identify areas where the lack of visibility hindered both current performance and the desired future state. The importance of addressing these problems areas was exacerbated by the then-current COVID-19 pandemic, which was disrupting material supplies and causing major production delays. To overcome the current challenges and improve their supply chain, the company needed to increase the visibility of their inbound logistics and, more specifically, their inbound deliveries from suppliers via trucks to the logistics centres at their manufacturing sites. The objective was to gain visibility at the pallet level independently of the trailers used for the inbound flows. Since the company did not own the trailers, it needed to find a technology that did not require installation on the trailers but would instead be attached to the pallets or even to boxes on the pallets. Figure illustrates the case company’s inbound logistics process from suppliers to cross-docks (called x-docks) and logistics centres. It shows the main process steps, packaging levels, and IT systems used. Orders were predominately sent to suppliers by electronic data interchange (EDI) using the enterprise resource planning (ERP) system at the case company. Suppliers then sent confirmation of the orders and requested packaging materials since they were normally required to use the packaging material produced by the case company. Once the parts were packed and ready for delivery, the suppliers sent delivery confirmations to the company. A certain percentage of deliveries from suppliers were sent to the case company’s cross-docks. Parts ordered from suppliers needed to be tracked at the pallet or box level, as indicated in Figure . Cross-dock operations mainly consisted of unloading, sorting, and loading, but with minimal verification of the parts received from suppliers. The pallets were loaded at the cross-docks, picked up, and delivered to logistics centres, where their arrival at the gate, unloading, storage, booking, and stock status were confirmed and updated in the warehouse management system (WMS). Arrival confirmations were sent to the production site, which then placed orders to pull orders out of stock as required for production. Although 90–95% of the deliveries arrived on time, when deviations occurred, their solutions involved additional costs, resources, and time. This was exacerbated by the blind spots illustrated in Figure , which revealed a lack of real-time visibility from the point of loading to delivery at the logistics centre. Consequently, deliveries could not be checked and verified in real time, which led to managers requesting high-speed delivery to overcome the deviations, involving even greater cost. Combined with the lack of ability to verify deliveries in real time, the complexity of the supply base forced the company to hold additional stock to ensure material availability for production. The lack of visibility also allowed thefts to occur in certain blind spots, causing additional deviations. Since the production rate was expected to increase, additional investments were needed to ensure expanded material availability, despite the lack of visibility. The study also revealed that there was no unified visualisation of the connections between the article number, pallet, truck, and hub, which led to a reduced ability to monitor, plan, and be proactive.
Figure 2. Current state of inbound logistics.
Based on project documentation and semi-structured interviews with the SCD project manager, we clarified the desired future state in terms of business requirements. As illustrated in Table , each problem area had to be addressed to meet one or more of the short- and long-term business requirements. Short-term requirements were related to improving current operations, whereas long-term requirements focused on the transition to autonomous inbound flows. The business requirements are further described in Appendix 1.
Table 2. Translation of problem areas into business requirements.
4.2. Intervention
To address the problems areas and meet the business requirements, we supported the company in turning the business requirements into functional requirements and technological solutions for a visibility system. The purpose was to enable the company to use the requirements to test and evaluate SCV technologies. We informed the company that the requirements would be used to contact and initiate discussions with technology suppliers and to plan a pilot study.
As a first step, we translated business requirements into functional requirements (see Table ). Each business requirement was related to several functional requirements. The functional requirements were divided into two categories: (1) visualisation of information and (2) event management. The functional requirements are further described in Appendix 2.
Table 3. Translation of business requirements into functional requirements.
In the second step, we translated functional requirements into technological solutions (see Table ) by considering the four steps for approaching the data, as suggested by Sanders and Swink (Citation2019). To address each of the functional requirements, several technological solutions had to be considered for data generation, management, and usage. All functional requirements demanded connectivity and real-time data collection. The technological solutions are further described in Appendix 3.
Table 4. Translation of functional requirements into technological solutions.
Figure illustrates the overall approach to translate problem areas into technological solutions via business and functional requirements. It should be noted that the structural approach outlined in Figure , with successive stages (see Tables , , and ), resembled the fundamental aspects of QFD, which is a methodology for transforming the needs and expectations of customers into demands for product characteristics, engineering parameters, and, ultimately, production systems (Hauser and Clausing Citation1988; Akao Citation1990). In this study, we used it in a similar fashion to identify the technological solutions required to achieve higher levels of SCV.
Figure 3. Approach for successive translation of problem areas into technological solutions.
Within the project timeframe, we decided that the pilot study would focus on testing technologies to evaluate technological solutions for connectivity and real-time data collection (for tracking precision) at the pallet level, independently of trailers. The company expected the results to provide the foundation for future testing and implementation of a visibility system, including data management, data analytics, and data integration.
4.3. Mechanism
4.3.1. Choice of technologies
We identified four sensor-based technologies for real-time data collection as part of the pilot study based on a combination of three factors: (1) suggestions from previous studies, (2) discussions within the project team, and (3) input from technology partners who collaborated in the project. Table presents the selected technologies.
Table 5. Overview of selected technologies.
Table 6. Results of the connectivity tests for the four technologies.
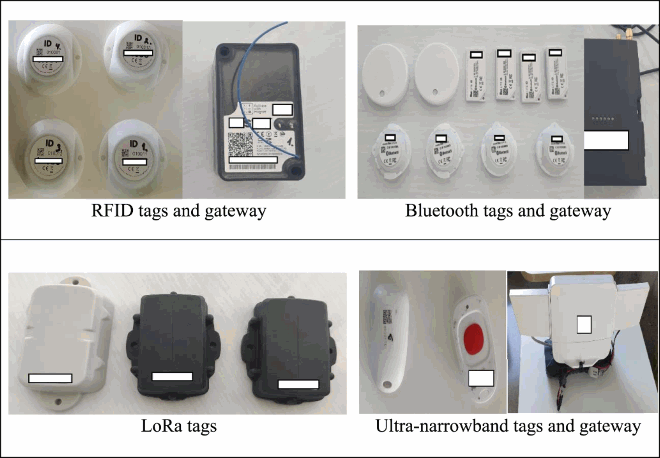
Four different technology suppliers provided the technologies. Each supplier also provided a gateway device, except for the long-range (LoRa) technology, which required the supplier to use their own network. The gateways and tags used during the pilot are presented in Appendix 4. For Bluetooth, three types of tags were recommended. Two types each had four tags, and the last had two tags. The RFID supplier provided one type of tag, which consisted of four tags. The LoRa supplier provided one type of tag that contained three tags. The ultra-narrowband technology supplier provided two tags of the same sort. We focused on evaluating and documenting connectivity and the ability to collect real-time data from the sensors attached to each type of technology, as well as the related tracking precision.
4.3.2. Testing conditions
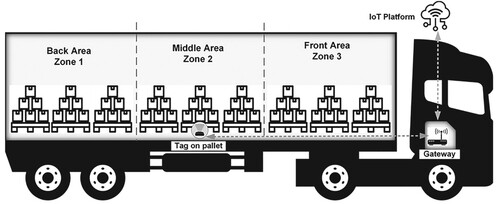
The gateways were placed inside the cabs of the trucks. The tags were placed on pallets owned by the case company and were normally used for inbound flows. The tags captured real-time data, and corresponding gateways sent them to a cloud platform managed by an IoT supplier responsible for the coordination, data gathering, and reporting of the test results. Furthermore, each trailer was divided into zones (zone 1 (back area), zone 2 (middle area), and zone 3 (front area)) because the company wanted to assess connectivity across the trailer, as illustrated in Figure .
Figure 4. Illustration of the technical setup and zones for the test.
4.3.3. Operations performed
To support the objective of the study, we decided to evaluate the technologies using a process that mimicked the inbound flows at the case company. The location for the testing was a demonstration centre belonging to the company, and a truck belonging to the company was rented for the testing. The truck had a semi-trailer with curtains and a storage capacity of approximately 14 × 2.5 m. We aimed to simulate the operations performed by the company’s inbound logistics function. Three operations were used for the pilot: (1) placement of pallets, (2) loading and offloading operations, and (3) movement of tags. The route contained four points: (1) starting point, (2) cross-dock, (3) control point, and (4) end point. We tested the connectivity across the trailer by positioning the tags in alternate zones. To minimise the number of test runs, we changed the position of the tags between the three zones during each test run, instead of running one test per zone. This approach allowed us to evaluate all three zones during each test run, and reduced the total number of test runs from 12 (4 technologies × 3 zones) to 4 runs (one test per technology covering all zones). We performed an additional combination test that tested all the technologies simultaneously to detect possible interference among them.
4.4. Outcomes
The IoT supplier stated that the four technologies were internet of logistics (IoL) compatible. In general, connectivity was achieved using all four technologies. Connectivity was calculated based on the average, best case (highest percentage), and worst case (lowest percentage) scenarios observed for each technology. RFID provided connectivity across all zones and did not lose connections during the test. Another advantage of the RFID technology was its high precision for tracking tags. Connectivity using the Bluetooth-based approach averaged 50% and was generally low across all zones. Furthermore, the difference between the best and worst cases was significant. The LoRa technology had a high level of connectivity, but we observed that the results depended on the coverage of the LoRa network, the presence or absence of which had an impact on connectivity. Another observation was that the LoRa technology provided a low level of precision, whereas ultra-narrowband technology provided a high level of connectivity and precision across all zones. The combination test revealed no notable disturbances or interferences among the technologies. Table provides a summary of the results for each technology.
Based on CIMO logic, the results provided solutions to the problems areas described in Section 4.1, which was achieved by following the intervention and mechanism approach described in Sections 4.2 and 4.3, respectively. All the steps were presented at the case company to give them the opportunity to review the approach and make decisions regarding further testing of technologies and possible implementation of a visibility system that met their requirements.
5. Discussion
In this section, we discuss and interpret the key findings.
5.1 Problem areas in inbound logistics
By mapping and understanding the current state of inbound logistics at the case company (detailed in Section 4.1), we identified multiple factors that caused additional costs for inbound logistics, including high-speed transportation, surplus inventory/safety stocks, and investments in additional storage capacity. Although these additional costs affect revenues and cost advantages, due to low SCV, manufacturing companies have to take such steps to ensure material availability and timely delivery to customers (Caridi, Perego, and Tumino Citation2013; Dubey et al. Citation2019; Yang et al. Citation2021). In line with Kähkönen et al. (Citation2021), this study further identified the limitations of low inbound SCV, which included blind spots during transportation from supplier to manufacturer, due to a lack of real-time visibility (see Figure ), limited proactivity, and a disjointed view caused partly by supply chain complexity (Brandon-Jones et al. Citation2014; Brun, Karasosman, and Barresi Citation2020). Moreover, in terms of integrating SCV (Munir et al. Citation2020), the study highlighted that a lack of upstream integration of suppliers limits SCV for inbound logistics. The problems in this respect were linked to a lack of sharing and availability of information. Thus, the study confirmed that timely information sharing, access, and availability are key for SCV (Doetzer Citation2020; Dubey et al. Citation2020).
5.2 Technologies for improving inbound SCV
The study evaluated four sensor-based technologies for connectivity and tracking precision at the pallet level. Overall, the results were promising in terms of their potential for improving inbound SCV. First, the results of testing active RFID indicated that it has the potential to improve visibility and decision-making (Guo et al. Citation2015). Although it is likely to demand a higher level of investment (Yu and Goh Citation2014), the study indicated that active RFID provides high connectivity and tracking precision close to real time. In turn, it can be argued that investment in such technology will enable companies to manage factors that cause additional costs, such as the ones identified in this study. This is appropriate for inbound flows, where multiple partners in the supply chain need to be involved to improve inventory performance (Attaran Citation2020). However, although not observed during this study, RFID-based sensors are prone to being affected by characteristics of the application environment (e.g. the presence of certain reflective material nearby; Brintrup, Ranasinghe, and McFarlance Citation2010), with a consequent impact on connectivity and tracking precision. The second technology, Bluetooth, has also been recommended for tracking due to its low energy consumption (Jeon et al. Citation2018). Although past studies applied Bluetooth-based tracking to improve in-house operations in manufacturing environments (Zhang et al. Citation2011), our study tested the technology for a simulated flow that mimicked inbound logistics. However, we observed mixed results for Bluetooth in terms of connectivity and tracking precision, depending on the type of sensor type used. Like Bluetooth, LoRa has been proposed for real-time tracking due to its low energy consumption and low cost (Ben-Daya, Hassini, and Bahroun Citation2019). Despite a good level of connectivity, we noted that the availability of the LoRa network had a direct influence on connectivity and precision (Hossain and Markendahl Citation2021). Thus, applying LoRa to improve different areas of SCV will require excellent LoRa network installation and coverage. Finally, the results of testing the ultra-narrowband technology showed high connectivity and precision, supported by low energy consumption and a large coverage area (Ben-Daya, Hassini, and Bahroun Citation2019; Hossain and Markendahl Citation2021). Although past studies have indicated that ultra-narrowband solutions may not be cost-effective for all scenarios, Hossain and Markendahl (Citation2021) established running platforms in 45 countries are beneficial for end-to-end connectivity.
5.3. From requirements to technologies
Acknowledging the importance of both requirements (Kalaiarasan et al. Citation2022) and technologies (De Oliveira and Handfield Citation2019) for SCV, this study identified the possibilities and challenges of implementing SCV technologies. Adding to the findings of Yang et al. (Citation2021) and Kähkönen et al. (Citation2021), we observed that a potential SCV system could be selected by identifying the relationships between requirements and technologies for inbound flows. The primary focus should be on identifying problem areas and defining and aligning business requirements (including short- and long-term goals) with supply chain actors (Lee, Kim, and Kim Citation2014; Bechtsis et al. Citation2021). The related functional requirements expected from an SCV system must then be translated into technological solutions and must be available and shared via an IoT platform. In line with Doetzer (Citation2020), we observed that the project members at the case company had a positive attitude towards improving SCV, which enabled the identification of problem areas in their inbound logistics. Also, considering the involvement of IoT and technology suppliers in this study, it is likely that companies will need to collaborate with IoT platform providers (Ben-Daya, Hassini, and Bahroun Citation2019; Giannakis, Spanaki, and Dubey Citation2019) and suppliers of sensor-based technologies to improve SCV (Dolgui and Ivanov Citation2022). The collaboration in this study confirmed that improving SCV depends on trust and information sharing with various actors in supply chains (Brun, Karasosman, and Barresi Citation2020; Dubey et al. Citation2020).
6. Conclusion
6.1. Concluding remarks
SCV has been gaining attention as a key enabler of supply chain performance. By applying CIMO logic to a global manufacturer of transport solutions, this study provides insights into improving SCV in practice. In particular, this study can help in understanding the possibilities and challenges of improving inbound SCV by testing technological solutions for a potential SCV system. The requirements and technologies we tested accounted for the disruptions caused by the COVID-19 pandemic and showed the potential for improving affected inbound logistics. The results provided guidance for implementing an appropriate potential visibility system. First, mapping, and understanding problem areas and their effects are important. Second, business requirements that consider both the immediate and long-term expected effects of a visibility system must be defined. Here, it is important to understand the relationships among problem areas due to a lack of visibility and poorly defined business requirements. This will ensure that the designed visibility system covers both short- and long-term goals. Third, the business requirements must be translated into functional requirements and describe what functions a potential visibility system should deliver. Fourth, the derived functional requirements must be applied to technological solutions to ensure that the technologies for a visibility system can be properly evaluated.
6.2. Managerial implications
This study serves as a guide for manufacturing companies aiming to enhance visibility in their inbound logistics and potentially extend visibility in other areas, such as internal and outbound logistics. Specifically, managers and practitioners can use the steps for the successive translation of problem areas into technological solutions to test and potentially improve SCV in their supply chains. Although the study focused on inbound SCV, we consider that the identified problem areas, business requirements, functional requirements, and technological solutions are relevant for improving SCV in other areas of supply chains. While the mapping steps should be considered, it is also important to understand that not all problem areas, requirements, and technological are relevant to all practical situations. However, together, they provide a reference for the successful improvement of SCV. Considering the testing of technologies for improving SCV in practice, we recommend that managers select and evaluate technological solutions for SCV that are suitable for their business processes. To improve SCV across supply chains, a crucial step is to evaluate and align technological solutions with internal and external actors in the supply chain (Dubey et al. Citation2018; Srinivasan and Swink Citation2018; Brun, Karasosman, and Barresi Citation2020). This study shows that process-related conditions affect the implementation of technologies to improve SCV. However, technologies alone are not sufficient; they need to be adapted for each case, and for the successful improvement of SCV, managers and practitioners must investigate and apply technological solutions. Our study provides insights into different types of technologies and their purposes for enhancing SCV. First, technologies for connectivity (Dubey et al. Citation2019), real-time data collection (Papert, Rimpler, and Pflaum Citation2016), and data management (Giannakis, Spanaki, and Dubey Citation2019) are crucial for establishing visibility in inbound logistics. The results related to connectivity and precision (Table ) highlight that the choice of technologies influences outcomes. Previous studies have suggested testing sensor-based technologies in various environments and attaching them to different materials to identify possible interference (Brintrup, Ranasinghe, and McFarlance Citation2010). Hence, depending on the process steps and possible constraints, it is essential to choose technologies that facilitate connectivity and data accuracy without major disturbance or downtime. Second, to fully benefit from a visibility system, various technologies must be integrated to support real-time data collection, management, and usage for improving capabilities and performance. For instance, predictive capabilities and the transition to autonomous inbound flows are likely to require a visibility system that includes AI (Calatayud, Mangan, and Christopher Citation2019; Kosasih and Brintrup Citation2021) and big data (Dubey et al. Citation2018) technologies.
6.3. Research implications
In the midst of the COVID-19 pandemic, the successive translation of problem areas into technological solutions in this study offers important perspectives on improving SCV in practice (Somapa, Cools, and Dullaert Citation2018; Sodhi and Tang Citation2019). The translation steps recognise multiple problem areas, business requirements (including both short- and long-term goals), functional requirements, and technological solutions for a potential SCV system. While previous studies have mentioned material disruptions (Yang et al. Citation2021), the problem areas identified (see Table ) in this study provide deeper insights into the disruptions and consequences likely to be faced by manufacturing companies due to poor SCV. Past studies have predominately focused on either SCV process requirements or technologies. The business and functional requirements identified in this study provide guidance on linking both processes and technologies to ensure SCV. Also, the business requirements and functional requirements indicate that it is important to implement SCV for both operational and strategic activities, rather than focusing on a single area. This study also contributes to research involving SCV technologies. Previous research has provided extensive information about RFID for improving visibility (Fosso Wamba et al. Citation2008; Brintrup, Ranasinghe, and McFarlance Citation2010; Caridi, Perego, and Tumino Citation2013; Pero and Rossi Citation2014; Yu and Goh Citation2014; Guo et al. Citation2015; Papert, Rimpler, and Pflaum Citation2016). This study revealed the relevance and potential of RFID for improving inbound SCV, and it also suggests Bluetooth, LoRa, and ultra-narrowband technologies for improving visibility by enabling real-time data collection.
6.4. Limitations and future research directions
It is important to acknowledge the limitations of this study. Together with the findings, these limitations call for future research in three directions. First, this study primarily focused on improving visibility in one particular area of a supply chain—inbound logistics using trucks for transportation. We recommend exploring the possibilities and limitations of increasing visibility beyond the first-tier supplier (Mubarik et al. Citation2021) to enrich and complement the findings of this study. Second, the testing of the technologies was conducted in a test area at the company site. Although the test route simulated real inbound logistics operations, testing technologies with a real flow and/or with potentially multiple modes of transportation would help establish a deeper understanding of the possibilities and limitations of implementing a visibility system. As illustrated in Figure , many companies with real flows use third-party transport providers. Hence, it is crucial to explore and understand the application of technologies for real-time visibility in such scenarios. Third, despite identifying the appropriate requirements and technologies for enhancing predictive capabilities and supporting autonomous inbound flows, such technologies were not tested during this study. Hence, case studies are needed to identify requirements and technologies for improving the visibility of autonomous flows. This will support an understanding of how technologies such as AI can further improve and use visibility to improve predictive capabilities (Calatayud, Mangan, and Christopher Citation2019).
Acknowledgements
The authors acknowledge the kind support of the Vinnova innovation agency, grant number 2019-00782.
Disclosure statement
No potential conflict of interest was reported by the author(s).
Data availability statement
Data are available on request due to privacy/ethical restrictions.
Additional information
Funding
Notes on contributors

Ravi Kalaiarasan
Ravi Kalaiarasan is an industrial PhD student at KTH Royal Institute of Technology and employed at Scania CV. His research focuses on data-driven supply chain visibility for informed decision making to improve supply chain performance. Prior to his doctoral studies, Ravi has been working within the automotive industry with work experiences from production, purchasing and IT. Ravi holds a M.Sc. in Production and Logistics from Mälardalens University.

Tarun Kumar Agrawal
Tarun Kumar Agrawal is a Researcher in Production Logistics at KTH Royal Institute of Technology and Senior Lecturer in Logistics at Chalmers University of Technology. His research interest includes production logistic and supply chain information sharing, supply chain digitalization, blockchain application in manufacturing industry and data driven decision-making. He graduated from ENSAIT, France with an MSc in Industrial Systems Engineering (2015) and conducted his PhD under Erasmus Mundus Fellowship by the European Commission. He holds Joint Doctorate (2019) in Production Automation from University of Lille, France, Engineering from Soochow University, China and Textile Management from University of Borås, Sweden.

Jan Olhager
Jan Olhager is Professor in Supply Chain and Operations Strategy at Lund University. He received a M.Eng. in Industrial Engineering and Operations Research from University of California at Berkeley, and a Ph.D. in Production Economics from Linköping University. He is Honorary Fellow of EurOMA, European Operations Management Association. He is Associate Editor of Decision Sciences and IJOPM and serves on the editorial boards of IJPR and PPC. He has published more than 80 papers in international scientific journals and a couple of books. His research interests include international manufacturing networks, reshoring, operations strategy, supply chain integration, and operations planning and control.

Magnus Wiktorsson
Magnus Wiktorsson is a Professor of Production Logistics at KTH Royal Institute of Technology. His research interest concerns how complex production logistic systems can be described and predicted. The application areas are within manufacturing industry and his research is based on digitization within supply chains and the need for transformation into environmentally sustainable production. Magnus Wiktorsson has a professional background with experience from business, government and universities. He graduated from the KTH Royal Institute of Technology in Stockholm with an MSc in Systems Engineering (1995) and a PhD in Manufacturing Engineering (2000). He is also head of the department for Sustainable Production Development as well as the department for Production Engineering at KTH.

Jannicke Baalsrud Hauge
Jannicke Baalsrud Hauge (female, Dr-Ing) is associate professor in production logistics and currently program director for the master program on sustainable production development. She holds a PhD in Engineering from the University of Bremen. From 2001 to 2003 worked as a research scientist at the University of Bremen responsible for the functional architecture of an e-commerce software. In 2003 she joined BIBA (Bremer institute für Produktion und Logistik responsible for the BIBAGaming Lab as well as coordination of the BIBA contribution in several national and international projects as well as ICT in production and supply chain networks and CPS. Jannicke joined KTH in 2015 first as co-director of GapsLab (working group healthcare logistics) before she changed to the group on production logistics. Besides teaching responsibilities, she is mostly managing and working on national and international research projects focusing on ICT in logistics. Jannicke is member of several boards, chairing IFIP WG14.8 and IFIP WG5.7-SIG on SG as well as member of the board Yrkeshögskoleutbildningen I Logistik in Södertälje. She has authored 250+ papers.
References
- Akao, Y. 1990. Quality Function Deployment: Integrating Customer Requirements Into Product Design. Cambridge, MA: The Productivity Press.
- Attaran, M. 2020. “Digital Technology Enablers and Their Implications for Supply Chain Management.” Supply Chain Forum: An International Journal 21 (3): 158–172. doi:10.1080/16258312.2020.1751568.
- Barratt, M., and R. Barratt. 2011. “Exploring Internal and External Supply Chain Linkages: Evidence from the Field.” Journal of Operations Management 29 (5): 514–528.
- Barratt, M., and A. Oke. 2007. “Antecedents of Supply Chain Visibility in Retail Supply Chains: A Resource-Based Theory Perspective.” Journal of Operations Management 25 (6): 1217–1233.
- Bechtsis, D., N. Tsolakis, E. Iakovou, and D. Vlachos. 2021. “Data-driven Secure, Resilient and Sustainable Supply Chains: Gaps, Opportunities, and a new Generalised Data Sharing and Data Monetisation Framework.” International Journal of Production Research, doi:10.1080/00207543.2021.1957506.
- Ben-Daya, M., E. Hassini, and Z. Bahroun. 2019. “Internet of Things and Supply Chain Management: A Literature Review.” International Journal of Production Research 57 (15–16): 4719–4742.
- Brandon-Jones, E., B. Squire, C. W. Autry, and K. J. Petersen. 2014. “A Contingent Resource-Based Perspective of Supply Chain Resilience and Robustness.” Journal of Supply Chain Management 50 (3): 55–73.
- Brintrup, A., D. Ranasinghe, and D. McFarlance. 2010. “RFID Opportunity Analysis for Leaner Manufacturing.” International Journal of Production Research 48 (9): 2745–2764. doi:10.1080/00207540903156517.
- Brun, A., H. Karasosman, and T. Barresi. 2020. “Supply Chain Collaboration for Transparency.” Sustainability 12 (11): 4429. doi:10.3390/su12114429.
- Calatayud, A., J. Mangan, and M. Christopher. 2019. “The Self-Thinking Supply Chain.” Supply Chain Management: An International Journal 24: 22–38.
- Caridi, M., A. Perego, and A. Tumino. 2013. “Measuring Supply Chain Visibility in the Apparel Industry.” Benchmarking: An International Journal 20: 25–44.
- Denyer, D., D. Tranfield, and J. E. van Aken. 2008. “Developing Design Propositions Through Research Synthesis.” Organization Studies 29 (3): 393–413.
- De Oliveira, M. P. V., and R. Handfield. 2019. “Analytical Foundations for Development of Real-Time Supply Chain Capabilities.” International Journal of Production Research 57 (5): 1571–1589.
- Doetzer, M. 2020. “The Role of National Culture on Supply Chain Visibility: Lessons from Germany, Japan, and the USA.” International Journal of Production Economics 230. https://www.sciencedirect.com/science/article/abs/pii/S0925527320301997.
- Dolgui, A., and D. Ivanov. 2022. “5G in Digital Supply Chain and Operations Management: Fostering Flexibility, End-To-End Connectivity and Real-Time Visibility Through Internet-Of-Everything.” International Journal of Production Research, doi:10.1080/00207543.2021.2002969.
- Dubey, R., A. Gunasekaran, S. J. Childe, and T. Papadopoulos. 2019. “Antecedents of Resilient Supply Chains: An Empirical Study.” IEEE Transactions on Engineering Management 66: 1: 8-19. doi:10.1109/TEM.2017.2723042.
- Dubey, R., A. Gunasekaran, S. J. Childe, T. Papadopoulos, Z. Luo, and D. Roubaud. 2020. “Upstream Supply Chain Visibility and Complexity Effect on Focal Company’s Sustainable Performance: Indian Manufacturers’ Perspective.” Annals of Operations Research 290: 343–367.
- Dubey, R., Z. W. Luo, A. Gunasekaran, S. Akter, B. T. Hazen, and M. A. Douglas. 2018. “Big Data and Predictive Analytics in Humanitarian Supply Chains.” The International Journal of Logistics Management 29 (2): 485–512.
- Giannakis, M., K. Spanaki, and R. Dubey. 2019. “A Cloud-Based Supply Chain Management System: Effects on Supply Chain Responsiveness.” Journal of Enterprise Information Management 32 (4): 585–607.
- Guo, Z. X., E. W. T. Ngai, C. Yang, and X. Liang. 2015. “An RFID-Based Intelligent Decision Support System Architecture for Production Monitoring and Scheduling in a Distributed Manufacturing Environment.” International Journal of Production Economics 159: 16–28.
- Hauser, J. R., and D. Clausing. 1988. “The House of Quality.” Harvard Business Review 66 (3): 63–73.
- Herrmann, S., H. Rogers, M. Gebhard, and E. Hartmann. 2015. “Co-creating Value in the Automotive Supply Chain: An RFID Application for Processing Finished Vehicles.” Production Planning & Control 26 (12): 981–993. doi:10.1080/09537287.2014.1002023.
- Hevner, A. R., S.T., Park March, and S. Ram. 2004. “Design Science in Information Systems Research.” MIS Quarterly 28 (1): 75–105.
- Holmström, J., M. Ketokivi, and A.-P. Hameri. 2009. “Bridging Practice and Theory: A Design Science Approach.” Decision Sciences 40 (1): 65–87.
- Hossain, M. I., and J. I. Markendahl. 2021. “Comparison of LPWAN Technologies: Cost Structure and Scalability.” Wireless Personal Communications 121: 887–903. doi:10.1007/s11277-021-08664-0.
- Jeon, K. E., J. She, P. Soonsawad, and P. C. Ng. 2018. “BLE Beacons for Internet of Things Applications: Survey, Challenges, and Opportunities.” IEEE Internet of Things Journal 5 (2): 811–828. doi:10.1109/JIOT.2017.2788449.
- Kähkönen, A. K., P. Evangelista, J. Hallikas, M. Immonen, and K. Lintukangas. 2021. “COVID-19 as a Trigger for Dynamic Capability Development and Supply Chain Resilience Improvement.” International Journal of Production Research, doi:10.1080/00207543.2021.2009588.
- Kaipia, R., and H. Hartiala. 2006. “Information-Sharing in Supply Chains: Five Proposals on how to Proceed.” The International Journal of Logistics Management 17: 377–393.
- Kalaiarasan, R., T. K. Agrawal, M. Wiktorsson, J. B. Hauge, and J. Olhager. 2021. “Requirements on Supply Chain Visibility: A Case on Inbound Logistics.” Advances in Production Management Systems. Artificial Intelligence for Sustainable and Resilient Production Systems. APMS 2021), IFIP Advances in Information and Communication Technology, vol 631. Springer, Cham. doi: 10.1007/978-3-030-85902-2_13.
- Kalaiarasan, R., J. Olhager, T. K. Agrawal, and M. Wiktorsson. 2022. “The ABCDE of Supply Chain Visibility: A Systematic Literature Review and Framework.” International Journal of Production Economics 248: 108464. doi:10.1016/j.ijpe.2022.108464.
- Kim, K. K., S. Y. Ryoo, S. and M, and D. Jung. 2011. “Inter-Organizational Information Systems Visibility in Buyer-Supplier Relationships: The Case of Telecommunication Equipment Component Manufacturing Industry.” Omega 39: 667–676.
- Kittipanya-Ngam, P., and K. H. Tan. 2020. “A Framework for Food Supply Chain Digitalization: Lessons from Thailand.” Production Planning & Control 31 (2–3): 158–172. doi:https://doi.org/10.1080/09537287.2019.1631462.
- Kosasih, E. E., and A. Brintrup. 2021. “A Machine Learning Approach for Predicting Hidden Links in Supply Chain with Graph Neural Networks.” International Journal of Production Research. doi:10.1080/00207543.2021.1956697.
- Lee, H., M. S. Kim, and K. K. Kim. 2014. “Interorganizational Information Systems Visibility and Supply Chain Performance.” International Journal of Information Management 34 (2): 285–295.
- Lee, Y., and S. C. Rim. 2016. “Quantitative Model for Supply Chain Visibility: Process Capability Perspective.” Mathematical Problems in Engineering 2: 1–11. doi:10.1155/2016/4049174.
- Mubarik, M. S., S. Kusi-Sarpong, K. Govindan, S. A. Khan, and A. Oyedijo. 2021. “Supply Chain Mapping: A Proposed Construct.” International Journal of Production Research, doi:10.1080/00207543.2021.1944390.
- Munir, M., M. S. S. Jajja, K. A. Chatha, and S. Farooq. 2020. “Supply Chain Risk Management and Operational Performance: The Enabling Role of Supply Chain Integration.” International Journal of Production Economics 227: 107667. https://www.sciencedirect.com/science/article/pii/S092552732030061X.
- Papert, M., P. Rimpler, and A. Pflaum. 2016. “Enhancing Supply Chain Visibility in a Pharmaceutical Supply Chain.” International Journal of Physical Distribution & Logistics Management 46 (9): 859–884.
- Pero, M., and T. Rossi. 2014. “RFID Technology for Increasing Visibility in ETO Supply Chains: A Case Study.” Production Planning & Control 25 (11): 892–901.
- Pfahl, L., and C. Moxham. 2014. “Achieving Sustained Competitive Advantage by Integrating ECR, RFID and Visibility in Retail Supply Chains: A Conceptual Framework.” Production Planning & Control 25 (7): 548–571. doi:10.1080/09537287.2012.729100.
- Sanders, N., and M. Swink. 2019. ““Digital Supply Chain Transformation: Visualizing the Possibilities.” Supply Chain Management Review.” January 2019: 30–41.
- Sodhi, M. S., and C. S. Tang. 2019. “Research Opportunities in Supply Chain Transparency.” Production and Operations Management 28 (12): 2946–2959.
- Somapa, S., M. Cools, and W. Dullaert. 2018. “Characterizing Supply Chain Visibility - A Literature Review.” The International Journal of Logistics Management 29 (1): 308–339.
- Srinivasan, R., and M. Swink. 2018. “An Investigation of Visibility and Flexibility as Complements to Supply Chain Analytics: An Organizational Information Processing Theory Perspective.” Production and Operations Management 27 (10): 1849–1186.
- Swift, C., V. D. R. Guide, and S. Muthulingam. 2019. “Does Supply Chain Visibility Affect Operating Performance? Evidence from Conflict Minerals Disclosures.” Journal of Operations Management 65 (5): 406–429.
- Van Aken, J., A. Chandrasekaran, and J. Halman. 2016. “Conducting and Publishing Design Science Research: Inaugural Essay of the Design Science Department of the Journal of Operations Management.” Journal of Operations Management 47–48: 1–8.
- Van Hoek, R. 2019. “Exploring Blockchain Implementation in the Supply Chain.” International Journal of Operations & Production Management 39: 829–859.
- Wamba, Fosso, S. L, A. Lefebvre, Y. Bendavid, and F. Lefebvre. 2008. “Exploring the Impact of RFID Technology and the EPC Network on Mobile B2B ECommerce: A Case Study in the Retail Industry.” International Journal of Production Economics 112: 614–629.
- Wang, Y., C. H. Chen, and A. Zghari-Sales. 2021. “Designing a Blockchain Enabled Supply Chain.” International Journal of Production Research 59: 1450-1475. doi:10.1080/00207543.2020.1824086.
- Wang, E. T. G., and H.-L. Wei. 2007. “Interorganizational Governance Value Creation: Coordinating for Information Visibility and Flexibility in Supply Chains*.” Decision Sciences 38 (4): 647–674.
- Williams, B. D., J. Roh, T. Tokar, and M. Swink. 2013. “Leveraging Supply Chain Visibility for Responsiveness: The Moderating Role of Internal Integration.” Journal of Operations Management 31 (7–8): 543–554.
- Yang, J., H. Xie, G. Yu, and M. Liu. 2021. “Antecedents and Consequences of Supply Chain Risk Management Capabilities: An Investigation in the Post-Coronavirus Crisis.” International Journal of Production Research 59 (5): 1573–1585. doi:10.1080/00207543.2020.1856958.
- Yu, M.-C., and M. Goh. 2014. “A Multi-Objective Approach to Supply Chain Visibility and Risk.” European Journal of Operational Research 233 (1): 125–130.
- Zhang, Y., T. QU, O. K. Ho, and G. Q. Huang. 2011. “Agent-based Smart Gateway for RFID-Enabled Real-Time Wireless Manufacturing.” International Journal of Production Research 49 (5): 1337–1352.
Appendices
Appendix 1
Business requirements
Appendix 2
Appendix 3
Appendix 4
Sensors and gateways used during the pilot study