
 ?Mathematical formulae have been encoded as MathML and are displayed in this HTML version using MathJax in order to improve their display. Uncheck the box to turn MathJax off. This feature requires Javascript. Click on a formula to zoom.
Abstract
Given the scarcity of COVID-19 vaccines, equitable (fair) allocation of limited vaccines across the main administrative units of a country (e.g. municipalities) has been an important concern for public health authorities worldwide. In this study, we address the equitable allocation of the COVID-19 vaccines inside countries by developing a novel, evidence-based mathematical model that accounts for multiple priority groups (e.g. elderly, healthcare workers), multiple vaccine types, and regional characteristics (e.g. storage capacities, infection risk levels). Our research contributes to the literature by developing and validating a model that proposes equitable vaccine allocation alternatives in a very short time by (a) minimising deviations from the so-called ‘fair coverage’ levels that are computed based on weighted pro-rata rations, and (b) imposing minimum coverage thresholds to control the allocation of vaccines to higher priority groups and regions. To describe the merits of our model, we provide several equity and effectiveness metrics, and present insights on different allocation policies. We compare our methodology with similar models in the literature and show its better performance in achieving equity. To illustrate the performance of our model in practice, we perform a comprehensive numerical study based on actual data corresponding to the early vaccination period in Turkey.
1. Introduction
As of December 2021, more than 260 million cases and 5.2 million deaths have been confirmed globally by the World Health Organization (WHO) due to the COVID-19 pandemic (WHO Citation2021). Besides causing a health crisis, the COVID-19 pandemic has led to significant socio-economic problems (WHO Citation2020b). To end the pandemic, reaching herd immunity through vaccination is accepted to be the most effective strategy. Several countries have started administering COVID-19 vaccines in early 2021. While about 56% of the population has received at least one dose in the high-income countries, this level is 7.1% in low-income countries (Ritchie et al. Citation2020) (see Appendix 1 for the coverage distribution). Hence, effective utilisation of available vaccine supplies is still a critical concern for many countries.
Due to large amount of needs and insufficient supplies, allocating vaccines within a country has been an important problem for public health authorities (Joi Citation2021). In particular, there is a need for decision support tools for vaccine allocation planning that (i) avoid disparities among regions based on their needs and vulnerabilities (i.e. equity), and (ii) maximise the total vaccination coverage (i.e. ratio of the vaccinated population to total needs) with the available supplies while prioritising the vaccination of the most vulnerable (i.e. effectiveness) (WHO Citation2020a; Toner et al. Citation2020; Baharmand et al. Citation2021).
Our research seeks to support the equitable (fair) allocation of COVID-19 vaccines among the administrative units in a country (i.e. municipalities, provinces) by developing an evidence-based mathematical model. Specifically, based on the decision-making needs of public health authorities (Baharmand et al. Citation2020), we define and model the central vaccine allocation problem (CVAP), which supports determining the number of vaccine doses to be allocated to each municipality by considering the size and importance of the currently targeted priority groups, requirements of different vaccine types (e.g. doses, batch sizes), vaccine storage capacities and regional differences that may affect vulnerability (such as infection level and socio-economic development status). While our model primarily focuses on achieving equity, it also ensures an effective allocation by maximising total demand coverage and prioritising vulnerable locations and groups. We illustrate the behaviour of the model on synthetic and case study instances, and show the effects of using different allocation policies and parameters on some equity and effectiveness metrics.
The proposed methodology goes beyond available models in the literature. The model addresses the critical challenges brought by the COVID-19 vaccination, such as extreme scarcity of supplies, regional differences, and different vaccine types. We contribute to the literature by presenting a new approach to model equity in the in-country vaccine allocation problem, which can be adapted to other settings with severe supply shortages and high stakes associated with the satisfaction of demand (e.g. humanitarian aid and emergency services). Specifically, we minimise the total deviation from a so-called fair coverage level, which is determined based on a weighted pro-rata allocation policy that accounts for the size and importance of needs and available supply for multiple types of vaccines. The merits of our proposed modelling approach are as follows. First, the relative importance of different priority groups and regions are easily incorporated in our model by using weights, which can be set based on the experts' judgements or available data (e.g. infection levels). Secondly, the model supports decision makers to unfold equitable vaccine allocation alternatives while imposing minimum coverage thresholds to control the allocated vaccines to certain priority group(s). Third, even when the fair coverage levels may not be achieved for some locations due to factors such as the restricted storage capacity, batch sizes, and the user-defined minimum coverage thresholds, the allocations can still be made by prioritising vulnerable groups and locations, thereby improving effectiveness. Finally, the proposed model can be solved quickly, allowing decision makers to evaluate alternative allocation policies and solutions efficiently.
The rest of the paper is organised as follows. In Section 2, we review related supply and vaccine allocation problems and position our study. We describe the problem and present our modelling approach in Section 3. In Section 4, we present numerical results. Finally, we discuss our findings in Section 5.
2. Related literature and contribution
In this section, we first provide an overview of studies that focus on supply allocation problems (Section 2.1). Then, we review the relevant studies that focus on vaccine allocation problems (Section 2.2). Finally, we position our study (Section 2.3).
2.1. Supply allocation problems
Stock allocation problems are widely studied in multi-echelon distribution systems (Chen et al. Citation2022). Different approaches have been used to deal with scarcity of supplies along the supply chains. For instance, stockpiling is widely used to mitigate supply shortages (Yoon, Narasimhan, and Kim Citation2018). In production settings, various policies are utilised to manage supply shortages such as incurring backorders and lost sales, or emergency outsourcing (e.g. Sali and Giard Citation2015; Barron and Hermel Citation2017). Keeping safety stock to ensure a desired stock-out probability or fill rate is also common (e.g. Jönsson and Silver Citation1987; Lagodimos Citation1992; Van der Heijden, Diks, and De Kok Citation1997; Woerner, Laumanns, and Wagner Citation2018). Despite the richness of alternative approaches, studies that address commercial settings often involve objectives that can be easily converted to monetary measures such as cost and profit (Van Wassenhove and Pedraza Martinez Citation2012), and equity (fairness) is often not an explicit concern in allocating stocks.
Supply allocation problems with equity concerns have been more relevant to health care (e.g. Lane et al. Citation2017), humanitarian (e.g. Habib, Lee, and Memon Citation2016) and nonprofit systems (e.g. Orgut et al. Citation2016). In healthcare settings, scarcity is common in managing public health and emergency settings such as blood banks (e.g. Baş et al. Citation2016) and ambulance services (e.g. McLay and Mayorga Citation2013). Similarly, providing equitable access to beneficiaries is an important concern in designing and managing humanitarian operations. For instance, Balcik, Beamon, and Smilowitz (Citation2008) and Noyan, Balcik, and Atakan (Citation2016) present approaches for equitable distribution of scarce relief supplies after a disaster.
Despite some efforts, there is yet no consensus regarding how to proxy equity. Marsh and Schilling (Citation1994) note that formulating an appropriate equity objective is context-dependent. Moreover, as highlighted by De Boeck, Decouttere, and Vandaele (Citation2020), there is a need to develop new approaches to study equity in vaccine supply chains. As discussed by Lemmens et al. (Citation2016), there exist unique features of vaccine allocation problems (such as different dose requirements and storage conditions of vaccine types). That said, the existing models for supply and vaccine allocation problems are not directly applicable to address the COVID-19 vaccine allocation problem.
2.2. Vaccine allocation models
Although a rich literature focuses on designing and managing vaccine supply chains (e.g. De Boeck, Decouttere, and Vandaele Citation2020; Duijzer, van Jaarsveld, and Dekker Citation2018), COVID-19 pandemic has brought unique challenges and required the development of new approaches. First, matching demand and supply has been challenging due to extreme scarcity of vaccines. Vaccines could be administered long after COVID-19 pandemic started. As such, vaccine supplies remained far behind the needs worldwide for several months. In this situation, effective use of even a single dose has been of paramount importance, which has put an extreme pressure on public health authorities to make effective and equitable allocation decisions. That is, although it is widely accepted that vaccine supply chain decisions are highly sensitive to the objectives specified by decision makers and misaligned objectives may curb the benefit of vaccination (Duijzer, van Jaarsveld, and Dekker Citation2018), during COVID-19, choosing appropriate objectives have gained even more importance due to both ethical concerns and the need to vaccinate population quickly (Forman et al. Citation2021; National Academies of Sciences, Engineering, and Medicine Citation2020). Additionally, since COVID-19 is a novel disease, the public health authorities had neither information about the spread of the disease nor historical data unlike previous outbreaks (e.g. influenza), which caused challenges for the response. Finally, unknowns regarding the new vaccines (e.g. efficacy, dose requirements) have also brought challenges in planning and management of vaccination.
Given the challenges faced during the COVID-19 pandemic, an increasing number of studies have addressed problems related to COVID-19 vaccines such as determining vaccination location sites (e.g. Bertsimas et al. Citation2022), designing multi-echelon dynamic cold chain distribution systems (e.g. Manupati et al. Citation2021; Sinha, Kumar, and Chandra Citation2021), designing rollout processes for multi-dose vaccines (e.g. Mak, Dai, and Tang Citation2021), developing prioritisation measures (e.g. Sahinyazan and Araz Citation2022), and sequencing the priority groups (e.g. Chen et al. Citation2020; Foy et al. Citation2021; Bubar et al. Citation2021; Li, Bjørnstad, and Stenseth Citation2021). We consider a different problem setting than these studies, in which scarce amounts of COVID-19 vaccines must be allocated across the regions (e.g. municipalities) of a country. Our work is hence related to studies that focus on allocation of vaccines during the previous outbreaks and pandemics such as the influenza (e.g. Teytelman and Larson Citation2013; Yarmand et al. Citation2014; Huang et al. Citation2017; Enayati and Özaltın Citation2020) and the COVID-19 (e.g. Tavana et al. 2021; Munguía-López and Ponce-Ortega Citation2021; Jadidi et al. Citation2021; Jarumaneeroj et al. Citation2022; Anahideh, Kang, and Nezami Citation2022; Goodarzian et al. Citation2022; Fadaki et al. Citation2022; Walker et al. Citation2022; Yang et al. Citation2022). In Table (Appendix 2), we present a classification of the key aspects of the most relevant studies that focus on vaccine allocation problems, which we briefly discuss in the following.
As observed from Table , studies that consider vaccine allocation problems for previous outbreaks such as influenza often utilise disease spread models (e.g. Teytelman and Larson Citation2013; Yarmand et al. Citation2014). This is barely possible for the COVID-19 pandemic due to lack of prior data related to the disease and vaccination efficacy. Additionally, these studies often ignore priority groups while making regional allocations. This approach does not capture the needs of COVID-19 vaccine allocation context as certain vulnerable groups had to be prioritised (Forman et al. Citation2021). Moreover, while equitable vaccine allocation has been critical during the COVID-19 pandemic, existing studies mostly focus on maximising the effectiveness (i.e. Teytelman and Larson Citation2013; Jadidi et al. Citation2021; Jarumaneeroj et al. Citation2022; Fadaki et al. Citation2022; Walker et al. Citation2022; Yang et al. Citation2022) or efficiency (i.e. Yarmand et al. Citation2014). In some studies, equity is considered by simply setting lower bounds on regional allocations, while others propose more sophisticated approaches for ensuring equity among regions and priority groups (e.g. Huang et al. Citation2017; Tavana et al. 2021; Munguía-López and Ponce-Ortega Citation2021; Anahideh, Kang, and Nezami Citation2022; Goodarzian et al. Citation2022; Fadaki et al. Citation2022). However, the latter studies do not incorporate all aspects relevant to the COVID-19 context such as vaccine types, vial sizes, and regional vaccination capacities. To highlight the benefits of the proposed equity objective, we compare the performance of our model with adapted objective functions from several benchmark studies (i.e. Noyan, Balcik, and Atakan Citation2016; Huang et al. Citation2017; Tavana et al. 2021) (Section 4.2.4) and show that our model has advantages in providing more equitable and also effective allocations.
2.3. Positioning our study
Our review shows that existing models do not necessarily address all critical features of the COVID-19 vaccine allocation problem that public health authorities commonly deal with. Our methodology addresses this gap and has the following features:
We propose a new equitable allocation policy, which minimises deviations from fair coverage levels computed based on weighted pro-rata rations. The proposed objective is novel and can ensure effective allocation of vaccines if fair coverage levels cannot be achieved due to external limitations.
Our methodology allows decision makers to impose minimum coverage thresholds to allocate more vaccines to higher priority groups before starting the vaccination of lower priority groups, if necessary. We present a supplementary model that can adjust high coverage thresholds in a balanced way to better serve the preferences of decision makers.
We incorporate the relative importance of both regions and priority groups according to a set of prioritisation metrics. Our prioritisation methodology, which assigns criteria that affect vulnerability, is simple but practical.
We present numerical experiments and a case study with real data to illustrate our approach and compare different allocation solutions based on several key performance indicators for effectiveness and equity, which provide valuable insights to decision makers.
3. Model development
In this section, we first explain our modelling approach and define our problem. Thereafter, we present our formulation and details of the proposed allocation policy.
3.1. Modeling approach
Our study aims at developing a methodology to allocate vaccines that respect the constraints and specifics of the COVID-19. Our approach focuses on maximising equitable COVID-19 vaccine allocation while accounting for large demands in different eligible priority groups (e.g. health workers, elderly) by a scarce amount of available vaccine supplies with distinct requirements (e.g. doses, batch sizes).
We followed CitationBaharmand et al. (Citation2022)'s exploratory mixed method research design due to its transparent 8-step procedure for developing optimisation models for logistics problems in disaster settings. The design introduces a step-by-step approach to translating qualitative findings into mathematical models. Accordingly, for the qualitative part, we conducted a series of stakeholder workshops with experts from public health authorities in Norway and Belgium between June 2020 and March 2021. These workshops were connected to the CONTRA research project: COVID-19 Network Technology Based Responsive Action. The participants and experts were mainly officials responsible for allocating and distributing vaccines in Norway and Belgium. The meetings revealed the complexity of the decision-making process for designing and managing the COVID-19 vaccine distribution network within a country (Baharmand et al. Citation2020). Acknowledging contextual differences, we think the problem aspects could be generalised to all countries facing similar challenges in COVID-19 vaccine distribution (e.g. see National Academies of Sciences, Engineering, and Medicine Citation2020).
After some rounds of interviews, we identified critical features of the COVID-19 vaccine allocation problem and translated them into a mathematical model. We also ran experiments to ensure that the features are implemented correctly. For experiments, we use data from Turkey due to the access of authors to first-hand data from this country. We focus on the initial months during which the available supply was limited compared to immense needs. Turkey began vaccination, free of charge, sequentially to healthcare personnel and people above 65 years and/or who had chronic diseases. As the vaccine supply became more available, all people above 18 years old became eligible for vaccination. Our observations and reports confirm that other countries have (more or less) followed a similar approach.
3.2. Problem definition and assumptions
We describe the CVAP as the allocation of COVID-19 vaccines to major administrative units within a country (e.g. districts, provinces, municipalities) that involve multiple eligible priority groups. Public health authorities need to allocate the limited supply among locations upon receiving the vaccine shipments, as illustrated in Figure .
Figure 1. An example vaccine distribution network for CVAP.
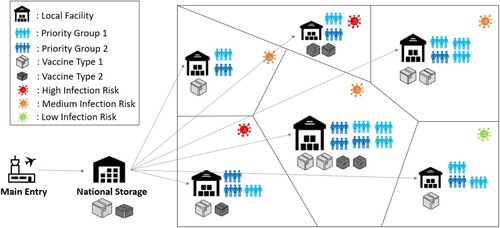
Given limited supplies compared to needs, making equitable and effective vaccine allocation plans by considering diverse concerns and limitations is the main challenge that we focus on in CVAP.
In the following, we explain the features and assumptions of our model, which have been validated during discussions with public health authorities over the course of a national research project.
Supply: Due to limited supplies, COVID-19 vaccines arrive in the country in multiple waves. The arrival frequency and amount of vaccines may highly differ depending on the supplier contracts. For instance, while supply arrivals in Norway from different manufacturers were regularly made weekly and bi-weekly (Norwegian Institute of Public Health, March 18, 2021), sporadic arrivals occurred in Turkey during the early stages of vaccination (Person Citation2021; Fahim and DeYoung Citation2021): Low-income countries (e.g. Kongo and Nepal) could receive donations from the Covax facility once in five or six months (GAVI Citation2021). We assume that the allocation decisions will be made upon each supply arrival, and the planning horizon covers the period between two consecutive supply arrivals.
Vaccine types: We focus on allocating available supplies for multiple types of vaccines, which may differ in batch sizes (i.e. the number of doses per cargo package) due to cold chain or logistical requirements. Since a batch cannot be divided, the allocated number of doses can be an integer multiple of the batch size, which is denoted by
for vaccine type k.
We also assume that the required doses for complete vaccination may vary among vaccine types, and the available supply for each vaccine type,
Priority Groups: We consider multiple priority groups that are eligible for vaccination. The number of unvaccinated people in each priority group p in each municipality m represent demand
Capacity: The capacities of municipalities to store and administer COVID-19 vaccines may be limited due to infrastructural and resource limitations. We assume that the vaccines allocated to each municipality is limited by the number of vaccines of each type that can be stored and administered in the municipality during the planning horizon, which is denoted by
The CVAP does not consider detailed transportation planning of COVID-19 vaccines; i.e. we assume that the allocated amounts can be delivered to the municipalities. For instance, a third-party logistics (3PL) company with sufficient capacity is responsible for the transportation of the COVID-19 vaccines in Norway (Sun, Andoh, and Yu Citation2021). However, if there exist logistical limitations and/or preferences of decision makers to send certain vaccine types to different municipalities, capacity parameters can be used to control shipments to different regions.
Performance metrics: We assume that the primary objective of CVAP is maximising equity (fairness). We define equity in terms of the amount of deviation from pre-determined fair coverage levels for regions and priority groups. Fair coverage is computed based on a weighted pro-rata allocation policy, which incorporates the demand size of each priority group in each municipality, the relative importance of locations and priority groups represented by weights, and total available supply (see Section 3.4.2). In CVAP, effectiveness is considered as a secondary objective and defined in terms of the total weighted average coverage achieved in the network. The cost (efficiency) of the vaccine allocation decision is not considered as a primary concern in CVAP due to the preferences of the public health authorities.
Allocation policy: Given a number of eligible priority groups dispersed across the country, public health authorities can consider different allocation policies in rationing supplies. For example, the available supply of vaccines can be divided by simply applying a pro-rata (proportional) allocation policy to provide the same coverage level for all priority groups in all regions. However, ignoring regional differences and targeting equal vaccination coverage across different groups and regions may not be equitable (WHO Citation2020c). Moreover, due to capacity limitations, achieving the same coverage levels across regions may not even be feasible. Additionally, public health authorities may want to control the amount of vaccines allocated to different groups; for instance, allocating more vaccines to higher priority groups may be desirable. CVAP aims to generate an equitable and effective allocation plan by prioritising vulnerable groups and regions, as well as considering capacity limitations and the additional requirements set by the decision maker.
In the proposed allocation policy, we skew vaccine rations in favour of higher priority groups and regions by utilising composite prioritisation weights,
3.3. The CVAP formulation
We present our notation and the integer programming (IP) model for CVAP as follows.
Index sets
| M: | set of regions (municipalities); | ||||
| P: | set of priority groups; | ||||
| K: | set of vaccine types; | ||||
Model parameters
| dmp: | size of targeted unvaccinated population in priority group p in municipality m | ||||
| αmp: | composite prioritisation weight of priority group p in municipality m | ||||
| fmp: | weighted-proportional allocation amount for priority group p in municipality m (i.e. fair amount) | ||||
| gmp: | minimum coverage threshold for priority group p in municipality m | ||||
| bk: | batch size for vaccine type k | ||||
| cmk: | capacity of municipality m for vaccine type k | ||||
| s¯k: | available total vaccine supply for vaccine type k | ||||
| sk: | amount of supply that will be allocated for vaccine type k; | ||||
| γ: | large penalty value imposed for the infeasibility of minimum coverage threshold | ||||
Decision variables
| Xmpk: | number of vaccines to allocate to priority group p in municipality m of vaccine type k | ||||
| Ymk: | number of vaccine batches to allocate to each municipality m of vaccine type k | ||||
| Wmp−: | amount of deviation from the fair amount for municipality m and priority group p when allocation amount is less than the fair amount (i.e. negative deviation) | ||||
| Wmp+: | amount of deviation from the fair amount for municipality m and priority group p when allocation amount is greater than the fair amount (i.e. positive deviation) | ||||
| Zmp−: | auxiliary variable that takes 1 if the allocation amount is less than the fair amount | ||||
| Zmp+: | auxiliary variable that takes 1 if the allocation amount is greater than the fair amount | ||||
| Vmp: | auxiliary variable that defines the gap between achieved coverage and the minimum coverage threshold for priority group p in municipality m | ||||
Objective function
(1)
(1)
The first and second terms of (Equation1
(1)
(1) ) minimise the weighted sum of the deviation from the fair coverage levels for the cases in which the allocation amount is less than the fair amount (negative deviation) and greater than the fair amount (positive deviation), respectively. These terms ensure that locations and groups with high importance are prioritised, also by considering their demand sizes. The first term is multiplied by
weight to penalise negative deviations more. The third term in (Equation1
(1)
(1) ) applies a large penalty if the minimum coverage threshold set for a priority group in a municipality cannot be met, as defined by constraints (Equation8
(8)
(8) ). In this way, the CVAP model does not report any infeasibility in strictly constrained settings. That is, our approach ensures equitable and effective solutions even if minimum coverage thresholds are not attainable. Additionally, we propose an hierarchical optimisation approach that can adjust infeasible coverage threshold values so that model can find allocations close to decision maker's preferences (see Section 3.5).
Constraints
(2)
(2)
(3)
(3)
Constraints (Equation2
(2)
(2) ) calculate the total number of vaccines sent to each municipality based on the batch size of each vaccine type. Constraints (Equation3
(3)
(3) ) ensure that the total amount of vaccines sent to the municipalities for each type is equal to the total amount of supply that will be allocated.
(4)
(4)
(5)
(5)
Constraints (Equation4
(4)
(4) ) define the amount of deviation from the fair amount for each priority group in each municipality, and constraints (Equation5
(5)
(5) ) ensure that the sum of the fair amount and its corresponding deviation is limited with the demand for each priority group and municipality.
(6)
(6)
(7)
(7)
Constraints (Equation6
(6)
(6) ) ensure that either a positive or negative deviation from the fair amount can occur for each priority group and municipality. Constraints (Equation7
(7)
(7) ) limit deviations by demand size.
(8)
(8)
(9)
(9)
Constraints (Equation8
(8)
(8) ) set the amount of deviation from the minimum coverage threshold for each priority group in each municipality. Constraints (Equation9
(9)
(9) ) ensure that the capacity constraints are respected. Finally, constraints (Equation10
(10)
(10) )–(Equation13
(13)
(13) ) define variable domains.
(10)
(10)
(11)
(11)
(12)
(12)
(13)
(13)
The CVAP model's primary aim is to ensure an equitable allocation of vaccines, rather than seeking equal demand coverage. The fair amount specifies the number of vaccines to allocate to priority groups in municipalities considering multiple important factors (see Section 3.4.2). Thus, minimising the total deviation from the fair coverage levels leads to a network-level equitable solution. While CVAP aims to maximise equity, it also yields an effective allocation as follows. First, all supply is allocated through constraints (Equation3
(3)
(3) ). If the whole supply was not enforced to be distributed, due to various factors that cause deviations from the fair amounts (e.g. capacity limitations, batch sizes), there would be surplus (un–allocated) vaccines, which would lead to lower total vaccine coverage. In cases where fair amounts cannot be achieved, the CVAP model can still allocate all of the vaccines by favouring critical groups and locations through the first and the second term of the objective function (Equation1
(1)
(1) ). Secondly, since objective function penalises the weighted deviations from the fair coverage levels, avoiding shortages for critical groups and regions are more important and hence negative deviations from the fair coverage occur for less important groups. Besides, positive deviations from the fair coverage are realised for critical groups and regions to improve effectiveness. The advantage of this proposed approach compared to alternative benchmarks is illustrated in Section 4.2.4.
We solve the proposed IP model for CVAP by using an off-the-shelf optimisation solver. In our numerical experiments, we solve both small and large (case study) instances. Although the model includes integer variables, it can be solved quickly (within a minute).
3.4. Equitable weighted pro-rata allocation policy
We explain the details of the proposed allocation policy in CVAP in this section. Given the number of eligible population groups dispersed across a country, a traditional pro-rata allocation policy would allocate vaccines to each municipality based on proportional amounts based on the available supplies and the needs. However, as explained before, skewing the proportional allocation amounts in favour of critical groups and locations would be desirable for more equitable solutions. The proposed allocation policy targets to provide vaccines to each priority group in each municipality in the amount proportional to the weighted pro-rata amounts by accounting for multiple constraints that may necessitate deviating from the fair amounts. Below, we explain the methodology followed to set important parameters of this policy to achieve equitable solutions, namely the composite prioritisation weights, the fair amount and fair coverage level, and the minimum coverage thresholds.
3.4.1. Composite prioritisation weights
We calculate the composite prioritisation weights for municipality m and priority group p as follows. We consider (i) weights associated with priority groups that reflect the importance of vaccination for population subgroups, and (ii) weights associated with municipalities that reflect regional differences in each relevant dimension l,
. Public health authorities can specify important contextual dimensions and assign initial scores based on their expert judgment or available data. The initial scores are then scaled between 0 and 1 by subtracting the minimum score from each score, and then dividing it by the range of the scores (i.e. maximum score -- minimum score). We take the geometric average of the resultant weights (i.e.
and
) and compute a prioritisation weight for each priority group and municipality. Finally, we divide each resultant value to the sum of values, which yields the composite prioritisation weights,
, that add up to one. Figure (Appendix 1) summarises the framework followed to set composite prioritisation weights. Note that different vaccine allocations can result from using different
values. In our case study (Section 4.3), we compare four different vaccination plans that are obtained by considering different dimensions (e.g. infection level, socio-economic status).
Assigning importance weights to certain regions and/or population groups is a common prioritisation approach in allocation problems with severe resource shortages. In Miura et al. (Citation2021) and Bubar et al. (Citation2021), importance weights with respect to age groups are used to prioritise allocation of COVID-19 vaccines. Qazi, Simsekler, and Gaudenzi (Citation2021) and Shahparvari et al. (Citation2022) focus on the identification of critical factors influencing COVID-19 risk and their relative importance. Anahideh, Kang, and Nezami (Citation2022) calculate the exposure rates of groups based on their attributes and make the prioritisation accordingly. There exist other methods in the literature that are used to prioritise delivery of services and goods including deprivation costs, which have been used in humanitarian (e.g. Gutjahr and Fischer Citation2018; Zhu, Xu, and Gu Citation2019), healthcare (e.g. Donmez et al. Citation2011), and vaccine allocation (e.g. Taha et al. Citation2022) settings. In our study, assigning importance weights was found to be flexible and practical by the decision makers during the validation test processes, since there may be a multitude of factors to consider while prioritising groups and/or regions.
3.4.2. Fair amount and fair coverage
The CVAP model incorporates equity through so-called ‘fair amount’ and ‘fair coverage level’ values, which are calculated based on the size and the importance of multiple regions and eligible population groups. Given the composite prioritisation weights, , and demands for each priority group in each municipality,
, and the supply available for allocation for each vaccine type,
, the fair amount,
, is obtained by calculating the weighted pro-rata allocation amounts as follows:
(14)
(14)
In the fair amount calculation (Equation14
(14)
(14) ), if the pro-rata weighted allocation amount for a priority group at a municipality is greater than its demand, then its demand becomes the fair amount. This leads to a surplus vaccine supply that is not considered in assessing the fair amounts. To ensure utilising the entire supply in determining fair amounts, we devise and implement an iterative algorithm, which is presented in Appendix 3. Accordingly, if fair amounts can be achieved for all priority groups and locations, the total deviation from fair coverage (i.e. the ratio of the fair amount to demand) would be zero. However, vaccines allocated to municipalities can deviate from their pre-computed fair amounts for several reasons such as the limited storage capacity and vaccine batch sizes. The CVAP seeks an equitable solution by minimising the total deviation from the fair coverage levels under such constraints.
3.5. A hierarchical optimisation approach for adjusting the minimum coverage threshold for feasibility
As discussed before, decision makers may want to ensure certain coverage levels for certain groups and/or locations, which are represented by in CVAP. For instance, it may be desirable to cover a certain proportion of higher priority groups before starting to vaccinate lower groups. If such thresholds exist, the CVAP model would first satisfy the specified minimum coverage levels due to the large infeasibility penalty term in the objective function, and the remaining supply amount is allocated by minimising deviations from the fair coverage levels.
While setting values allows the decision maker to control allocations more closely, setting reasonable thresholds may be difficult given the complexity of the problem in large settings with many municipalities, priority groups, and vaccine types. A possible trial-and-error process to set reasonable bounds may be cumbersome for the decision maker. Moreover, as illustrated in Section 4.2.3, arbitrary coverage values may be obtained when the minimum thresholds cannot be met. To set feasible minimum coverage thresholds that are close to decision maker's preferences, we make use of a hierarchical optimisation method, in which a mathematical model, called the equitable coverage feasibility (ECF) model, is solved in advance of CVAP. Specifically, the ECF adjusts the given
to feasible values while deviating as little as possible from the original values, that is, it adjusts thresholds in a balanced way to satisfy the preferences of the decision maker as closely as possible.
The additional variables defined for developing the ECF model are as follows:
| Gˆmp: | adjusted minimum coverage threshold for each priority group p in municipality m | ||||
| Emp: | difference between | ||||
| A: | auxiliary variable that represents the largest weighted difference between | ||||
The ECF model is presented below.
(15)
(15)
(16)
(16)
(17)
(17)
(18)
(18)
(19)
(19)
(20)
(20)
The objective function (Equation15
(15)
(15) ) minimises the maximum deviation from the initially set minimum coverage threshold values, as defined by constraints (Equation19
(19)
(19) ). The second term, multiplied by a small coefficient, minimises the weighted total deviation and eliminates alternative solutions. Deviations from
values for groups and municipalities with higher
values are penalised more. Constraints (Equation16
(16)
(16) ) are demand-related constraints, modified from the CVAP model. Constraints (Equation17
(17)
(17) ) determine the feasible minimum coverage threshold for each group in each municipality. Constraints (Equation18
(18)
(18) ) specify the difference between the original and the adjusted thresholds. Constraints (Equation19
(19)
(19) ) identify the maximum deviation from the original
values. Constraints (Equation20
(20)
(20) ) specify the domains of the variables.
The binding values from an ECF solution imply that the supply is just enough to cover the adjusted minimum coverage levels and no surplus exist after satisfying these levels. In such a case, applying CVAP model after the ECF model will not change the resulting allocation. However, if the given
cannot be met due to a reason other than the insufficient supply level (e.g. restricted capacity), the resulting
values will not be binding. Then, the CVAP model will allocate the remaining vaccines equitably. In this case, since feasibility is ensured with the ECF model, the value of the
are set to zero in (Equation8
(8)
(8) ) in the CVAP model. As a result, the objective function of CVAP (Equation1
(1)
(1) ) would only consider the first two terms that focus on equity.
4. Numerical study
We conduct numerical analysis to gain insights into how different parameter settings might induce a change in the allocation decisions and key performance indicators (KPIs). We first present the set of KPIs used to evaluate the performance of the solution (Section 4.1). We then provide the analysis of the proposed method on a small instance (Section 4.2) and present our case study (Section 4.3).
In our numerical experiments, we solve the CVAP and ECF models by using CPLEX with default solver parameters. Our model is coded with Java and Concert Technology and solved on a computer with Intel Core i7-7700HQ CPU 2.8 GHz and 16 GB of RAM.
4.1. Key performance indicators (KPIs)
We propose several KPIs for decision makers to evaluate the equity and effectiveness of allocation solutions. The list and descriptions of the KPIs are provided in Table .
Table 1. KPIs for evaluating equity and effectiveness of CVAP solutions.
We evaluate the performance of allocation solutions both at the municipality (aggregate) level and priority group level. That is, KPIs are defined based on the total coverage (i.e. amount allocated respect to demand) achieved at the municipality level, , at the priority group level,
, and also for each priority group across municipalities,
.
Equity metrics. To measure equity, we consider several attributes such as the dispersion of priority group coverage, and the total coverage,
. We also define KPIs based on the difference between the fair coverage and the achieved coverage for each priority group,
, and the difference between the fair total coverage and the achieved total coverage,
. The negative values of the last two attributes are specified by
and
.
KPIs 1a-4a and 1b-4b evaluate the dispersion of vaccination coverage in the network at aggregate and priority group levels, respectively. Specifically, KPIs 1a-3a and 1b-3b measure the dispersion of coverage based on standard deviation, range and the worst value. In KPI 4a and 4b, the Gini coefficient is computed, which is equal to , where
and
represents the relevant attribute values for municipality i and j, respectively, and
is the average value of the attribute over n municipalities. The Gini coefficient takes values between 0 and 1, where 0 indicates the perfect equity.
KPIs 5a-6a and 5b-6b are our main equity metrics, which are based on the deviations from the fair amount values. KPIs 5a and 5b measure the overall deviation from the fair coverage levels, whereas KPIs 6a and 6b focus on only the negative values of the deviations to identify the regions and groups that have received fewer vaccines than their calculated fair amounts.
Effectiveness metrics. We evaluate the effectiveness of the allocation decisions based on weighted average total coverage achieved across municipalities and priority groups. KPI 7 is the main indicator that measures the overall weighted average coverage in the network, and shows how well the prioritised groups and regions are covered. However, it may be important for the decision maker to evaluate effectiveness separately based on each score component included in . Thus, KPIs 8.d and 9 are presented as the breakdown metrics of KPI 7. Specifically, KPI 8.d is calculated based on the dth regional score (
). For instance, in the case study, we consider regional infection risk level (
), and socio-economic status (
). KPI 9 is calculated based on the importance score for priority groups (
).
4.2. CVAP results on small instances
We test our approach on small instances (Table in Appendix 1) and illustrate model behaviour.
We consider eight municipalities (M1–M8) with different population sizes and infection rates. We assume one type of vaccine. The capacities of the municipalities are initially assumed to be enough to store the allocated supplies (Section 4.2.1), but the effects of stricter capacity limitations are also explored (Section 4.2.2). Furthermore, we include multiple priority groups in our analysis (Section 4.2.3). We consider a moderate supply level which can cover 60% of the total demand in Sections 4.2.1 and 4.2.2, scarce supply level, which can cover 30% of total demand, is considered in Sections 4.2.3 and 4.2.4.
We consider different allocation solutions obtained by different composite prioritisation weights (). Each solution is called a ‘plan’. Accordingly, Plan 1 represents the solution obtained from a pro-rata allocation policy, as the fair amounts only depend on demand sizes. In Plan 2 and Plan 3, besides demand sizes, infection levels at the municipalities are also important. Specifically, we give scores of 1, 2, and 3 for locations with low, medium, and high infection levels, and scale these scores to obtain the composite prioritisation weights. Additionally, in Plan 3, the decision maker sets a minimum coverage threshold of 40% for each municipality.
4.2.1. Performance comparison of different vaccine allocation plans
The coverage levels obtained for the three allocation plans with respect to the corresponding fair coverage levels are presented in Figure . In Plan 1, each municipality receives 60% of its demand, as expected. Under Plan 2, municipalities with higher infection levels receive a higher number of vaccines since their fair amounts are larger. In Plan 3, each municipality is delivered at least 40% of their demand due to minimum coverage thresholds, which leads to some municipalities with moderate infection rates (e.g. M6) receiving less than their fair amounts. In Plan 3, the fair amounts could be achieved for the municipalities with high infection risk levels, and some municipalities with low infection rates (e.g. M4 and M8) receive higher than their fair amounts.
Figure 2. Attained and fair coverage levels for Plans 1, 2 and 3.
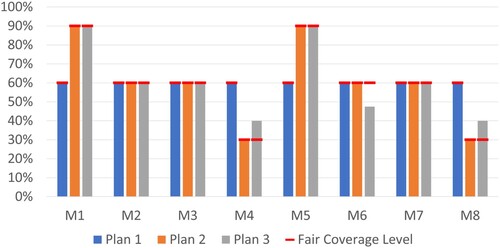
Table presents the KPI values for each plan. Plan 1, which is a pro-rata policy, achieves equal coverage levels. While Plan 2 causes variations among coverage levels of municipalities, Avg [] and Min [
] indicate that the allocation is equitable since all municipalities reach their fair coverage levels. Furthermore, Plan 2 can skew allocations in favour of locations with higher infection risk levels, leading to a more effective solution as indicated by a higher (
) WAvg [
] value. In Plan 3, Min [
] is 40% due to the minimum coverage thresholds. However, Avg [
] and Min [
] are worse under Plan 3 since fair coverage levels cannot be achieved in some municipalities, leading to less equitable solutions. Nevertheless, under Plan 3, (
) WAvg [
] is slightly lower compared to Plan 2, indicating that Plan 3 could achieve effective solutions compared to Plan 1.
Table 2. Equity and effectiveness KPIs for the three allocation plans.
4.2.2. Effects of capacity
The vaccine storage capacity at the municipalities may prevent municipalities from receiving their fair amounts. The CVAP allocates vaccines that could not be delivered due to locations with low capacity to other locations with high demand and importance. Therefore, while equity may be compromised due to capacity constraints, vaccines would still be distributed by considering effectiveness measures.
We illustrate these effects by an example. The capacity of municipality M5, which has a comparatively high infection rate and demand than other municipalities, is set at 300 units, while its fair amount is 360 units. Table presents KPI values for the two solutions obtained for Plan 2 when M5 has sufficient versus restricted capacity. When capacity is restricted, since fair coverage cannot be achieved for M5, Avg [] is larger. Moreover, the effectiveness metrics (see KPI 7 and 8.1) worsen since a risky municipality, M5, could not be served sufficiently. However, the remaining vaccines that could not be received by M5, are now allocated to M7, which has large demand and medium infection level. Therefore, the most equitable and effective solution could be achieved under the given limitations.
Table 3. KPIs of solution with sufficient and restricted capacity for municipality M5.
4.2.3. Effects of minimum coverage threshold and the ECF model
We next illustrate benefit of using the ECF model and the proposed hierarchical optimisation approach. We consider an instance with multiple priority groups by extending the instance in Section 4.2.1. We consider two priority groups (P1 and P2), whose demand, prioritisation weights, and the fair amounts are provided in Table (Appendix 1). Group P1 has higher priority than P2. In addition, we set =90% and
=10%
. Figure presents results of the CVAP attained with and without implementing the ECF model a priori. Table present the values of KPIs associated with these solutions.
Figure 3. Coverage values with and without ECF model.
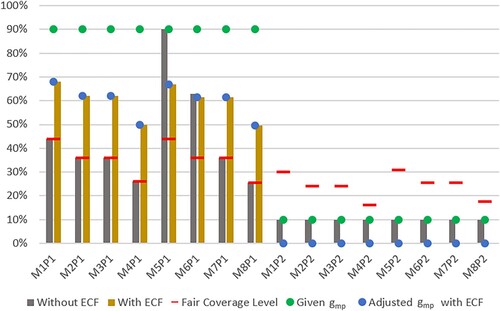
Table 4. KPIs of CVAP solutions with and without ECF model.
As observed from Figure , the minimum coverage thresholds set by the decision maker, , cannot be achieved. Without the ECF model, the CVAP model yields coverage levels that can highly deviate from the desired
values. That is, while the minimum threshold is satisfied for priority group P2, these values could not be satisfied for P1 with the supply at hand, except for one municipality (i.e. M5). As a result, a large infeasibility penalty is avoided for this municipality and priority group. However, other municipalities receive vaccines which are away from the desired threshold; the gap between achieved coverage and the given thresholds range between 27.0% and 64.5%, and is 51.9% on average for P1. As observed from Table , this solution also causes highly varying coverage levels among priority groups in municipalities (e.g. see StDevP [
] and RangeP [
]). When the ECF model is utilised, the preferences of the decision maker in satisfying the minimum coverage thresholds are captured better. The adjusted thresholds are set by considering
weight for each group in each municipality (see Table in Appendix 1), which can be achieved by the CVAP model as shown in Figure . The distance to the original thresholds decreases, ranging from 22.0% to 40.5% and is 29.8% on average for P1.
In summary, if values that cannot be achieved are set, the CVAP model produces a solution in which some thresholds may be met, and the remaining vaccines are allocated based on the fair coverage levels. This allocation may lead to high deviations from the preferences of the decision maker. Applying the ECF model would provide guidance with the decision maker for adjusting
values by considering the importance of regions and priority groups, and produce a solution that can capture the decision maker's preferences in covering higher priority groups. That is, this approach achieves a solution that gets close to the decision maker's pre-set thresholds, while maintaining equity and effectiveness.
4.2.4. Benchmarking with similar equity objectives
As discussed in Section 2, equitable supply allocation problems have been studied in different contexts. Here, we evaluate the value of our proposed equity objective by comparing CVAP solutions with alternative equity objectives adapted from the literature. Our first benchmark model, , is developed by adapting the objective function of Huang et al. (Citation2017), which allocates H1N1 vaccines by minimising the sum of weighted unsatisfied demands. Our second benchmark,
, is based on the equity objective of Noyan, Balcik, and Atakan (Citation2016), which focuses on allocating humanitarian relief supplies in a distribution network in a post-disaster setting. In
, we minimise the sum of weighted negative deviations from fair coverage. Finally, we consider maxmin objectives, adapted from Tavana et al. (2021), which allocate COVID-19 vaccines among multiple states and equally important groups by maximising the minimum coverage of a group in a state. We consider the original unweighted version (
) and also adapt a weighted version (
, in which we maximise the minimum priority-weighted coverage across groups and regions. The formulation of objective functions adapted from these studies for CVAP are presented in Online Appendix B.
We solve different CVAP models on a synthetic instance with eight municipalities and two priority groups, where the first group has higher priority than the second. The demand and weight parameters are in Table (Appendix 1). We set a total supply level that can cover 30% of total demand. For simplification, we set for each group. Moreover, we solve instances with and without capacity restrictions. In the capacitated setting, the capacity of M5, which has a comparatively higher infection rate and/or demand than other municipalities, is set at 100 units.
Figure presents coverage values attained by different models. In the setting without capacity restrictions, the proposed CVAP yields an allocation in which all municipalities reach their fair coverage levels. However, when capacity is restricted, deviations from the fair coverage levels occur. In particular, since the demanded amount cannot be delivered to M5 due to capacity restrictions, CVAP first aims to satisfy the demand of the higher prioritised group (P1) in the municipality, and if the limited capacity permits, vaccines are allocated to the lower prioritised group (P2). For this reason, the capacity restriction causes a low coverage level for M5P2. The excess vaccine then needs to be distributed within the network, since we enforce in CVAP model to deliver the whole supply at hand for a more effective solution. With the CVAP solution, we observe that population group M7P1 received the excess vaccine, which carries the characteristics of a highly populated and moderately risky region, and being a prioritised group. That is, when deviations from fair coverage levels are unavoidable, degrading the equity, CVAP allocates vaccines effectively by favouring high priority groups and locations. The aggregate KPI values and the illustration of these values with and without capacity restrictions that highlights the balanced effective and equitable solution obtained by CVAP model is presented in Online Appendix C.
Figure 4. Coverage values with and without capacity restriction.
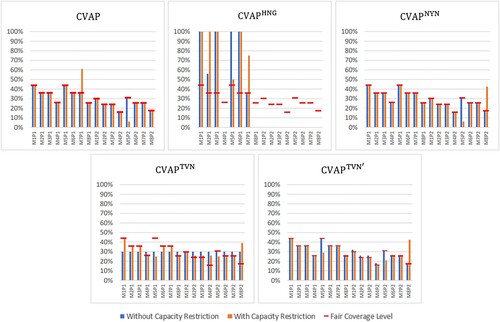
As observed from Figure , , which focuses on serving high priority weighted population groups, can disregard lower priority groups or municipalities with lower risks and hence may lead to an inequitable allocation. Similarly,
leads to equal coverage values, which may be inequitable since the importance of covering certain regions and groups cannot be captured. When there is no capacity restriction,
provides similar and
result in the same allocation with CVAP. However, in the capacitated setting, both models allocate the vaccines that cannot be delivered to municipality M5 to low risk regions and groups (i.e. priority group 2 in municipality M8), leading to less effective solutions. This highlights the benefit of the CVAP objective, which minimises both positive and negative deviations, thereby allocating each vaccine dose equitably and effectively. That is, CVAP model allocates the excess vaccine to a more prioritised group and risky municipality, where the most similar two benchmark objectives,
and
, both provide a higher coverage level for the lower prioritised group in a less risky municipality, leading to less effective solutions. As for the other benchmarks,
result in an allocation plan that is less effective, and that deviates more from the fair coverage level for the higher prioritised group. Although
performs better according to the effectiveness KPIs, the equity KPI values are significantly worse compared to the CVAP solution. Since regions may have different capacity restrictions due to cold chain requirements of vaccines and decision makers may impose additional contextual constraints, it may be beneficial and practical to use the proposed CVAP model to achieve equitable and effective solutions.
4.3. Case study
We present a case study based on Turkey's vaccination data to illustrate the implementation of the proposed approach. In the following, we first describe our case context and explain how the case data set is generated. Then, we present numerical results and analysis.
4.3.1. Case description and data set
In Turkey, COVID-19 vaccine administration started in early January 2021, and the healthcare personnel, the elderly, people with chronic diseases, and the essential workers were among the first eligible priority groups. During the initial months, once eligible groups are announced, vaccination appointments could be made online or via telephone. Vaccines have been administered both at family health centres and hospitals. During the first two months, only Sinovac vaccine was available; later, eligible groups have been given the opportunity to choose either Sinovac or Pfizer-BionTech vaccines.
We consider the within-country allocation of vaccines by focussing on the vaccination coverage levels, eligible groups, and available supply on 29th March 2021. On this date, the Pfizer-BioNTech vaccine has started to be used for the first time in the country, in addition to Sinovac vaccine. Moreover, the attained vaccination coverage and supply availability were still low at that period, and the allocation of vaccines was a critical decision for public health authorities. Specifically, only 9.75% of the total population was given the first dose, and 7.15% of the total population was given both doses of Sinovac in the country Ucar et al. (Citation2021) (see the Online Appendix for the coverage data).
To implement our model, we have obtained a significant portion of the necessary data from publicly available sources. We next briefly explain how we processed data to estimate model parameters. The raw data and obtained input values are presented in detail in the Online Appendix.
Demand (
We note that during the dates we are considering for the case study, there was high interest in vaccination, and vaccine hesitancy was not a major issue. Therefore, we consider the entire unvaccinated population in each priority group while estimating demands. However, at later stages, as the vaccination of younger groups has started, hesitancy levels have increased. Estimating demands by considering hesitancy rates would require further research and data.
Available supply: By 28 March 2021, Turkey received 28 million doses of Sinovac and 4.5 million doses of Pfizer-BionTech vaccines. We consider half of these amounts for the first dose allocation, and subtract the already administered amounts. Approximately 8.2 million Sinovac vaccines were already administered, therefore, 5.8 million doses of Sinovac are available for allocation. The Pfizer-BionTech vaccines were not administered yet, thus, 2.25 million doses can be allocated. The total supply is enough to cover 74.93% of the targeted eligible population.
Vaccine batch size: We assume that 40 units of Sinovac and 150 units of Pfizer-BionTech vaccines are available in the smallest non-divisible batch that can be shipped to municipalities.
Vaccination capacity: We analysed the data for daily vaccinations in each municipality between 26th January and 28th March 2021 and compute the average daily administered vaccines, which are used to set the total daily vaccination capacity. We divide the total daily capacity between different vaccine types by assuming that the daily capacity for each vaccine type will be proportional to its available supply. We assume that the storage capacity of each municipality for each vaccine type,
Vulnerability weights (
Our preliminary analysis does not indicate any strong relationship between the human development indices (TEPAV Citation2020) and the number of cases (Ucar et al. Citation2021). However, this may be due to the low number of conducted tests in the municipalities with low socio-economic development levels (Birgun Citation2021). That is, the number of infections may be much higher and the lack of health services may result in higher mortality rates for the infected people. Therefore, vaccination in these regions gains even more importance. That is why we consider the socio-economic development status of the regions as a prioritisation aspect in our case study.
4.3.2. CVAP results on case instances
We evaluate the following four vaccination plans in our case study to gain more insights on CVAP solutions. Note that these plans are mostly different from the ones introduced in Section 4.2.
Plan 1: Pro-rata allocation. The vaccines are distributed to municipalities proportional to their demand (i.e. equal
Plan 2: On top of Plan 1, the importance of priority groups in each municipality are incorporated (i.e.
Plan 3: On top of Plan 2, the infection risk weights of municipalities are considered (i.e.
Plan 4: On top of Plan 3, regional differences in socio-economic status are considered (i.e.
Plan 1, which allocates vaccines proportional to demand sizes of municipalities, can be considered as a benchmark policy. This plan ignores regional differences (in terms of infection risk and socio-economic status) and the relative importance of priority groups. Under Plan 2, we consider the relative importance of the priority groups but still continue to disregard the regional differences. Under Plan 3, in addition to the relative importance of priority groups, we also take into account the infection risk of the municipalities. Finally, under Plan 4, we also consider the socio-economic status of the municipalities in setting the composite prioritisation weight.
In our case analysis, we set for all municipalities and priority groups to ensure a certain coverage for each population group. However,
is not feasible for all municipalities and priority groups, thus, we first apply the ECF model to obtain feasible thresholds.
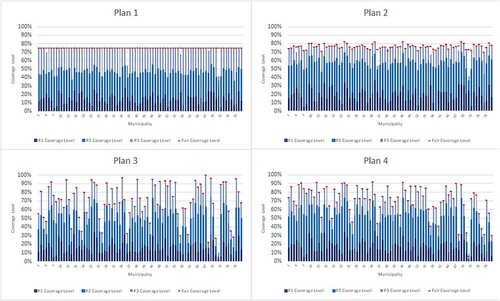
In Figure , we present the coverage levels of 81 municipalities for each allocation plan obtained by the CVAP model. In the figure, histograms for each plan show the number of municipalities covered at different levels. Moreover, Figure shows the achieved coverage levels for priority groups and municipalities in detail, as well as the total fair coverage levels for municipalities under different plans (for brevity, we omit presenting the fair coverage level for each priority group).
Figure 5. Coverage levels of municipalities under different plans for the case study instance.
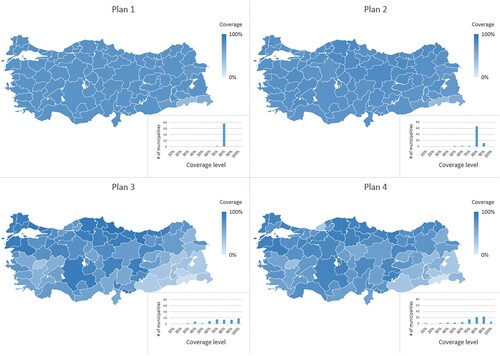
Figure 6. Coverage values for each municipality and priority group for different plans for the case study.
According to the results, under Plan 1 and Plan 2 we observe nearly the same coverage levels for all municipalities as we ignore the regional differences. However, different than Plan 1, under Plan 2, some municipalities receive higher number of vaccines due to the consideration of priority groups. Under Plan 3 and Plan 4, we also observe the effect of considering regional differences. According to Plan 3, municipalities with higher infection risks are prioritised; that is, the Eastern parts of the country received fewer number of vaccines, whereas coverage levels become higher especially in the Northern, Northeastern, and Western parts of the country. Under Plan 4, we observe that more importance is given to the internal and Eastern parts of the country due to the inclusion of socio-economic development scores as an indicator of vulnerability.
Table presents the KPI values for different solutions, and an illustration of the aggregate KPI values to support the comparison of plans can be found in Online Appendix C. In the following, we evaluate the equity and effectiveness of each vaccine allocation plan.
Table 5. KPIs for different plans for the case study.
Plan 1. We observe that similar coverage levels are achieved across municipalities. Low values of StDev [], Range [
], and Gini [
] and the high value of MinP [
] (compared to other plans) indicate similar municipality-wise coverage levels. While Avg [
] is also low, Min [
] value indicates that there is at least one municipality that could not receive enough vaccines to achieve its fair coverage level. Specifically, six municipalities (e.g. M4 (Ağrı), M36 (Hakkari), M57 (Mardin), M67 (Samsun), M68 (Siirt), M72 (Şırnak)) could not receive their fair shares due to insufficient capacity. The surplus vaccines are then allocated based on demand sizes since all priority groups and municipalities have the same
values in Plan 1.
From Table , we also observe different values of StDevP [], RangeP [
], MinP [
] and GiniP [
] for different priority groups. This difference is mostly caused by the different demand sizes of groups. For instance, since P3 demand is the highest, more variation in coverage levels is realised among municipalities. Effectiveness metrics indicate about 74% coverage, which is close to the ratio of total supply to total demand, that is 74.93%.
Plan 2. For Plan 2, StDev [], Range [
], and Gini [
] values are slightly higher than those of Plan 1, indicating that total coverage levels are still similar among municipalities. On the priority group level, we observe that P1 is now almost fully covered (see MinP [
]). Figure also shows that priority groups are covered based on their importance values. Moreover, low StDevP [
] and GiniP [
] values indicate similar coverage levels for each priority group across municipalities.
Similar to Plan 1, some municipalities and groups could not get their fair shares as indicated by Min [] and MinP [
]. Specifically, negative deviation occurred for only five municipalities (same municipalities with Plan 1, except M67) due to insufficient capacity. However, Avg [
] and AvgP [
] indicate an equitable solution. Finally, effectiveness KPIs improve under Plan 2 (e.g.
Wavg [
],
Wavg [
]) since important priority groups could be covered more.
Plan 3. Since we consider regional characteristics in Plan 3, the difference in coverage levels among municipalities and priority groups are higher (e.g. StDev [], Range [
], Min [
], and Gini [
]). Nevertheless, the solution is equitable with respect to fair amounts, as evident from low values of Min [
], MinP [
], Avg [
] and AvgP [
]. The reason for achieving better values for these metrics compared to the previous two plans is that in certain municipalities (i.e. M4 (Ağrı), M36 (Hakkari), M57 (Mardin), M72 (Şırnak)), capacity restrictions prevent allocation of enough number of vaccines to these regions. However, under Plan 3, fair coverage levels are lower for these municipalities that have lower infection risk scores, and hence satisfying the fair coverage level in these regions becomes possible. That is, under this plan, capacity restrictions become a less important factor resulting in small deviations from the fair coverage levels. As a result, the surplus vaccine to allocate is also much less compared to the previous two plans, leading to improved equity.
We observe that the average coverage of 10 municipalities with the highest infection levels (i.e. M67 (Samsun), M40 (İstanbul), M79 (Yalova), M34 (Giresun), M69 (Sinop), M22 (Çanakkale), M12 (Balıkesir), M53 (Konya), M46 (Kastamonu), M51 (Kilis)) has increased significantly from 77.68% in Plan 2 to 95.50% in Plan 3. As for the effectiveness of the allocation, we observe that the value of ) Wavg [
is lower compared to the previous two plans. However, municipalities with higher infection levels are now covered more as indicated by the (
) Wavg [
] value.
Plan 4. Similar to Plan 3, the KPIs reflect the effects of considering different regional characteristics on coverage levels among municipalities and priority groups. Plan 4 solutions are equitable given the small values of Min [], MinP [
], Avg [
] and AvgP [
]. Moreover, with the consideration of socio-economic development score as an indicator, we observe an increase in the (
) Wavg [
] value compared to Plan 3, while conserving favourable (
) Wavg [
] values.
Although the increase in () Wavg [
] is not significant from Plan 3 to Plan 4, we observe the effects of considering
weights from the coverage of the 10 municipalities with the lowest socio-economic status (i.e. M4 (Augrı), M60 (Muş), M35 (Gümüşhane), M78 (Van), M71 (Şanlıurfa), M36 (Hakkari), M72 (Şırnak), M18 (Bitlis), M68 (Siirt), M45 (Kars)). The average coverage for these municipalities has increased from 34.93% to 48.7% under Plan 4.
These results show that the proposed approach is effective and can capture different contextual parameters and the decision maker's preferences. The CVAP model can achieve equitable solutions under different settings with varying concerns and parameters. Since the model runs quickly, the decision maker may test the instance with different components that are included in the composite prioritisation weights, and easily observe the effects of including different factors and compare the allocation plans based on the proposed KPIs.
5. Discussion and concluding remarks
Our study seeks to support public health authorities in making effective and equitable COVID-19 vaccine allocation decisions. To this end, we present a novel methodology that is tailored to decisions makers' needs. The model investigates equity through ‘fair coverage level’, which is calculated based on the size and the importance of multiple regions and eligible population groups. For the analysis, we work on both a hypothetical small instance and a case study of Turkey. We show that our approach to model equity can easily handle specific limitations and can give superior solutions than alternative approaches. Despite the specific characteristics of COVID-19, we argue that our approach to model equity can be adapted to the contexts of other pandemics and humanitarian situations where supply shortage is a critical concern for saving lives. Overall, we think that this study provides an effective methodology for the decision makers that wonder how the limited number of scarce supplies can be assigned to different regions and demand groups equitably and effectively.
We analysed and evaluated several allocation plans, which address different concerns of public health authorities in allocating COVID-19 vaccines within a country. Our numerical results indicate that the factors used for the prioritisation of regions may result in significantly different allocation decisions. While we consider prioritisation of regions according to their infection rates and socio-economic development levels in our case study, our proposed prioritisation framework is general and can be extended to incorporate other relevant contextual factors. Our results also show that the limited capacity of municipalities can significantly hamper equity. We also show that our approach can effectively guide the decision makers to set minimum coverage thresholds and achieve equitable solutions in a highly constrained environment.
We proposed a set of equity and effectiveness KPIs to evaluate different vaccine plans, which are defined based on the vaccine coverage levels achieved in the region for different priority groups. Note that it may be also crucial to evaluate the potential impact of the proposed vaccination plans by considering disease propagation effects (e.g. the number of infected and death after vaccination). Such evaluations can be made by implementing compartmental epidemiological models (e.g. SIR). We illustrate the adaptation of a SIR model on our synthetic instances (Online Appendix D). Specifically, we simulate the progression of COVID-19 disease through an adapted SIR model and analyse the effects of the provided vaccination coverage on the total number of infected people and deaths. Our results show that vaccination reduces the mortality rate significantly in all regions as the overall death percentages decrease nearly 70% with any vaccination plan compared to a no vaccination setting, and prioritising vaccinations based on infection risks can further reduce the total number of deaths. Moreover, our SIR-based analysis shows that both the daily vaccine administration capacity limitations and the limited storage capacities can significantly increase the number of infected people and deaths due to extended vaccination periods. Our results highlight the importance of setting enough daily storage and administrative capacity in each location for a fast, equitable, and effective vaccine rollout.
Besides presenting a new vaccine allocation problem and model, we believe this paper has also important practical importance. Although COVID-19 vaccination has started about a year ago, the in-country vaccine allocation problem is still up-to-date globally, especially for low-income countries, due to ongoing scarcity of supplies, new virus variants, and additional vaccination (i.e. booster) requirements. Hence, our proposed allocation policies, models, and results from our case study provide insights to public health authorities for making vaccine allocation decisions during both the ongoing COVID-19 pandemic and future possible pandemics.
Future research can enhance the proposed model in a few directions. For instance, we assume that the vaccine demands are known and deterministic, since public health authorities relied on national population registry in allocating vaccines. However, the actual demand may be affected by several factors such as mobility of people (e.g. education, vacation) leading them to receive vaccines away from their residencies, vaccine hesitancy and uptake rate. During the early stages of vaccination, these factors may not be critical due to sheer size of initial demands with respect to available supplies. Moreover, the proposed model can be solved quickly, which would allow decision makers to test the effects of uncertain parameters through sensitivity analysis efficiently. Nevertheless, it would be valuable if methods that can forecast demand for vaccination during a pandemic are available, as addressed by some recent studies (e.g. WHO Citation2022; Zhou and Li Citation2022). If data for measuring demand uncertainty at national level are available, scenario-based optimisation models can also be used to make vaccine allocation decisions. Moreover, in this study, we consider a policy that reserves full amounts required for second dose vaccinations since supply arrivals were sporadic during initial stages and guaranteeing the follow up doses for people who received the first dose was important (Mak, Dai, and Tang Citation2021). Future research can focus on different policies to reserve supplies and extending the current model to analyse how much inventory to reserve for the second doses under demand and supply uncertainty.
Furthermore, comparing the model outcomes with actual allocation decisions of policy makers in practice and investigating potential gaps could be another future research direction of our study. We argue that as we progress towards the end of the pandemic in the following years, more reliable information about grounds for allocation decisions (e.g. what the exact supply was, when they arrived, and what political considerations were necessary?) would become publicly available. Furthermore, it is more likely that policy makers would have more freedom for participating in research than their current time with heavy workload for COVID-19 vaccination. As such, collecting reliable and complete data could be easier for further investigation of decisions.
Supplemental Material
Download PDF (591.6 KB)Acknowledgements
The authors thank the anonymous reviewers that helped to improve the paper in different parts with their constructive and detailed comments. We would like to thank experts from the Norwegian public health authorities who helped the model development with their insights over the course of the CONTRA project. The authors are also gratful for the support from other principal investigators of the CONTRA project.
Disclosure statement
No potential conflict of interest was reported by the author(s).
Data availability statement
The authors confirm that the data supporting the findings of this study are available within the article [and/or] its supplementary materials.
Additional information
Funding
Notes on contributors

Burcu Balcik
Burcu Balcik is aProfessor in the Department of Industrial Engineering (IE) at Özyeğin University. She holds a Ph.D. in IE from the University of Washington. Her research focuses on developing mathematical models and solution methods to improve humanitarian supply chains for better disaster preparedness and response. She is an Associate Editor of Transportation Science, and on the Editorial Boards of various journals including Production and Operations Management, Transportation Research Part E, and Journal of Humanitarian Logistics and Supply Chain Management. She has served at professional societies including the INFORMS Public Sector Operations Research (PSOR) and the EURO Working Group on Humanitarian Operations (EURO-HOpe). She is a recipient of the Young Scientist Award from the Turkish Science Academy.

Ecem Yucesoy
Ecem Yucesoy is an M.Sc. student in Industrial Engineering at Özyeğin University. She received her B.Sc. degree in Industrial Engineering with a minor degree in Computer Science from Özyeğin University. Her research interests include humanitarian and healthcare operations, supply chain management, mathematical modelling, optimisation, and predictive analytics.

Berna Akca
Berna Akca is an M.Sc. student in Industrial Engineering at Özyeğin University. She received her B.Sc. degree in Industrial Engineering with a minor degree in Computer Science from Özyeğin University.Her research interests are humanitarian operations, logistics, supply chain management, optimisation and heuristic methods.

Sirma Karakaya
Sirma Karakaya received B.S. and M.S. degrees from Industrial Engineering Program at Bilkent University and METU, in 2014 and in 2017, respectively. Currently, she continues her Ph.D studies at the same department of Ozyegin University under the supervision of Prof. Dr. Burcu Balçğk. Her research interests include stochastic programming and their applications to healthcare and humanitarian operations.

Asena A. Gevsek
Asena A. Gevsek will receive her B.S. degree in Industrial Engineering and double major in Computer Science from Ozyegin University at the end ofthe 2022 summer, and 2023 spring terms respectively. Her research interests are humanitarian relief operations, logistics, and optimisation.

Hossein Baharmand
Hossein Baharmandis Associate Professor in Project and Supply Chain Management at the School of Business and Law, University of Agder (UiA), Norway. He co-chairs the research cluster ‘Technological Advancements in Humanitarian Aid’ at the Centre for Integrated Emergency Management (CIEM), UiA. Hossein conducts research that deals with supporting policy makers in the context of health and humanitarian logistics with evidence-based decision support systems. He has won multiple prestigious international awards for his work on disasters management and humanitarian aid. Hossein serves as the Publications and Academic Standards Chair in the International Society for Crisis Response and Management (ISCRAM.org).

Fabio Sgarbossa
Fabio Sgarbossa is Full Professor of Industrial Logistics at the Department of Mechanical and Industrial Engineering (MTP) at NTNU (Norway) from October 2018. He was Associate Professor at University of Padova (Italy) where he also received his PhD in Industrial Engineering in 2010. He is currently leader of the Production Management Group at MTP, and he is responsible of the logistics 4.0 Lab at NTNU. He has been and he is involved in several European and National Projects. He is author and co-author of about 150 publications in relevant international journals, about industrial logistics, material handling, materials management, supply chain. He is member of Organizing and Scientific Committees of several International Conferences, and he is member of editorial boards and associate editor in relevant International Journals.
References
- Anahideh, H., L. Kang, and N. Nezami. 2022. “Fair and Diverse Allocation of Scarce Resources.” Socio-Economic Planning Sciences 80: Article ID 101193.
- Baharmand, H., B. Balcik, L. Boey, C. Decouttere, R. Phillips, N. Saeed, and N. Vandaele. 2021. “Toward a Decision Support System for COVID-19 Vaccine Allocation Inside Countries.” In Norsk IKT-Konferanse for Forskning og Utdanning, Number 2.
- Baharmand, H., B. Balcik, C. Decouttere, R. Phillips, N. Saeed, and N. Vandaele. 2020. “COVID-19 Network Technology-Based Responsive Action (CONTRA).” CONTRA Project report #1: Requirements identification and system mapping. Technical Report, ISBN 978-82-8427-006-7.
- Baharmand, H., D. Vega, T. Comes, and M. Lauras. 2022. “A Methodology for Developing Evidence-Based Optimization Models in Humanitarian Logistics. Annals of Operations Research. Forthcoming. https://doi.org/10.1007/s10479-022-04762-9
- Balcik, B., B. M. Beamon, and K. Smilowitz. 2008. “Last Mile Distribution in Humanitarian Relief.” Journal of Intelligent Transportation Systems 12 (2): 51–63.
- Barron, Y., and D. Hermel. 2017. “Shortage Decision Policies for a Fluid Production Model with Map Arrivals.” International Journal of Production Research 55 (14): 3946–3969.
- Baş, S., G. Carello, E. Lanzarone, Z. Ocak, and S. Yalçındağ. 2016. “Management of Blood Donation System: Literature Review and Research Perspectives.” Health Care Systems Engineering for Scientists and Practitioners 169: 121–132.
- Bertsimas, D., V. Digalakis Jr, A. Jacquillat, M. L. Li, and A. Previero. 2022. “Where to Locate COVID-19 Mass Vaccination Facilities?.” Naval Research Logistics (NRL) 69 (2): 179–200.
- Birgun. 2021. “Few Tests, Few Cases.” (in Turkish). Accessed September 29, 2021. https://www.birgun.net/haber/az-teste-az-vaka-336395.
- Bubar, K. M., K. Reinholt, S. M. Kissler, M. Lipsitch, S. Cobey, Y. H. Grad, and D. B. Larremore. 2021. “Model-Informed COVID-19 Vaccine Prioritization Strategies by Age and Serostatus.” Science 371 (6532): 916–921.
- Chen, H., B. Dai, Y. Li, Y. Zhang, X. Wang, and Y. Deng. 2022. “Stock Allocation in a Two-Echelon Distribution System Controlled by (s, S) Policies.” International Journal of Production Research 60 (3): 894–911.
- Chen, X., M. Li, D. Simchi-Levi, and T. Zhao. 2020. “Allocation of COVID-19 Vaccines under Limited Supply.” https://www.medrxiv.org/content/10. 1101/2020.08.23.20179820v2.
- De Boeck, K., C. Decouttere, and N. Vandaele. 2020. “Vaccine Distribution Chains in Low- and Middle-Income Countries: A Literature Review.” Omega 97: Article ID 102097.
- Donmez, Z., S. Turhan, O. Karsu, B. Y. Kara, and O. Karasan. 2011. “Fair Allocation of Personal Protective Equipment to Health Centers During Early Phases of a Pandemic.” Computers & Operations Research 141: Article ID 105690.
- Duijzer, L. E., W. van Jaarsveld, and R. Dekker. 2018. “Literature Review: The Vaccine Supply Chain.” European Journal of Operational Research 268 (1): 174–192.
- Enayati, S., and O. Y. Özaltın. 2020. “Optimal Influenza Vaccine Distribution with Equity.” European Journal of Operational Research 283 (2): 714–725.
- Fadaki, M., A. Abareshi, S. M. Far, and P. T.-W. Lee. 2022. “Multi-Period Vaccine Allocation Model in a Pandemic: A Case Study of COVID-19 in Australia.” Transportation Research Part E: Logistics and Transportation Review 161: Article ID 102689.
- Fahim, K., and K. DeYoung. 2021. “China Has Made Big Vaccine Promises. When They Come Up Short, Nations Struggle.” The Washington Post. Accessed October 24, 2021. https://www.washingtonpost.com/world/middle_east/china-sinovac-turkey-coronavirus-vaccine/2021/04/06/f87bc1bc-93cd-11eb-aadc-af78701a30ca_story.html.
- Forman, R., S. Shah, P. Jeurissen, M. Jit, and E. Mossialos. 2021. “COVID-19 Vaccine Challenges: What Have We Learned So Far and What Remains to Be Done?” Health Policy 125 (5): 553–567.
- Foy, B. H., B. Wahl, K. Mehta, A. Shet, G. I. Menon, and C. Britto. 2021. “Comparing COVID-19 Vaccine Allocation Strategies in India: A Mathematical Modelling Study.” International Journal of Infectious Diseases 103: 431–438.
- GAVI. 2021. “Covax Vaccine Roll-Out.” Accessed 24 October, 2021. https://www.gavi.org/covax-vaccine-roll-out.
- Goodarzian, F., A. Navaei, B. Ehsani, P. Ghasemi, and J. Muñuzuri. 2022. “Designing An Integrated Responsive-Green-Cold Vaccine Supply Chain Network Using Internet-of-Things: Artificial Intelligence-Based Solutions.” Annals of Operations Research doi:10.1007/s10479-022-04713-4
- Gutjahr, W. J., and S. Fischer. 2018. “Equity and Deprivation Costs in Humanitarian Logistics.” European Journal of Operational Research 270 (1): 185–197.
- Habib, M. S., Y. H. Lee, and M. S. Memon. 2016. “Mathematical Models in Humanitarian Supply Chain Management: A Systematic Literature Review.” Mathematical Problems in Engineering 2016: 1–20.
- Huang, H.-C., B. Singh, D. P. Morton, G. P. Johnson, B. Clements, and L. A. Meyers. 2017. “Equalizing Access to Pandemic Influenza Vaccines Through Optimal Allocation to Public Health Distribution Points.” PLoS ONE 12 (8): Article ID e0182720.
- Jadidi, M., S. Jamshidiha, I. Masroori, P. Moslemi, A. Mohammadi, and V. Pourahmadi. 2021. “A Two-Step Vaccination Technique to Limit COVID-19 Spread Using Mobile Data.” Sustainable Cities and Society 70: Article ID 102886.
- Jarumaneeroj, P., P. O. Dusadeerungsikul, T. Chotivanich, T. Nopsopon, and K. Pongpirul. 2022. “An Epidemiology-Based Model for the Operational Allocation of COVID-19 Vaccines: A Case Study of Thailand.” Computers & Industrial Engineering 167: Article ID 108031.
- Joi, P.. 2021. “Why Helping Countries Deliver COVID-19 Vaccines is Just as Vital as Boosting Supply.” Accessed September 6, 2021. https://www.gavi.org/vaccineswork/qa-why-helping-countries-deliver-covid-19-vaccines-just-vital-boosting-supply.
- Jönsson, H., and E. A. Silver. 1987. “Stock Allocation among a Central Warehouse and Identical Regional Warehouses in a Particular Push Inventory Control System.” International Journal of Production Research 25 (2): 191–205.
- Lagodimos, A.. 1992. “Multi-Echelon Service Models for Inventory Systems under Different Rationing Policies.” International Journal of Production Research 30 (4): 939–956.
- Lane, H., M. Sarkies, J. Martin, and T. Haines. 2017. “Equity in Healthcare Resource Allocation Decision Making: A Systematic Review.” Social Science & Medicine 175: 11–27.
- Lemmens, S., C. Decouttere, N. Vandaele, and M. Bernuzzi. 2016. “A Review of Integrated Supply Chain Network Design Models: Key Issues for Vaccine Supply Chains.” Chemical Engineering Research and Design 109: 366–384.
- Li, R., O. N. Bjørnstad, and N. C. Stenseth. 2021. “Prioritizing Vaccination by Age and Social Activity to Advance Societal Health Benefits in Norway: A Modelling Study.” The Lancet Regional Health-Europe 10: Article ID 100200.
- Mak, H.-Y., T. Dai, and C. S. Tang. 2021. “Managing Two-Dose COVID-19 Vaccine Rollouts with Limited Supply.” Working Paper (Available at SSRN 3790836).
- Manupati, V. K., T. Schoenherr, N. Subramanian, M. Ramkumar, B. Soni, and S. Panigrahi. 2021. “A Multi-Echelon Dynamic Cold Chain for Managing Vaccine Distribution.” Transportation Research Part E: Logistics and Transportation Review 156: Article ID 102542.
- Marsh, M. T., and D. A. Schilling. 1994. “Equity Measurement in Facility Location Analysis: A Review and Framework.” European Journal of Operational Research 74 (1): 1–17.
- McLay, L. A., and M. E. Mayorga. 2013. “A Dispatching Model for Server-to-Customer Systems that Balances Efficiency and Equity.” Manufacturing & Service Operations Management 15 (2): 205–220.
- Miura, F., K. Y. Leung, D. Klinkenberg, K. E. Ainslie, and J. Wallinga. 2021. “Optimal Vaccine Allocation for COVID-19 in the Netherlands: A Data-Driven Prioritization.” PLoS Computational Biology 17 (12): Article ID e1009697.
- Munguía-López, A. d. C., and J. M. Ponce-Ortega. 2021. “Fair Allocation of Potential COVID-19 Vaccines Using an Optimization-Based Strategy.” Process Integration and Optimization for Sustainability 5 (1): 3–12.
- National Academies of Sciences, Engineering, and Medicine. 2020. “Applying the Framework for Equitable Allocation of COVID-19 Vaccine in Various Scenarios.” In Framework for Equitable Allocation of COVID-19 Vaccine, edited by Gayle H, Foege W, Brown L, and Kahn B, Washington, DC: The National Academies Press. Accessed September 17, 2021. https://www.nap.edu/catalog/25917/framework-for-equitable-allocation-of-covid-19-vaccine.
- Noyan, N., B. Balcik, and S. Atakan. 2016. “A Stochastic Optimization Model for Designing Last Mile Relief Networks.” Transportation Science 50 (3): 1092–1113.
- Orgut, I. S., J. Ivy, R. Uzsoy, and J. R. Wilson. 2016. “Modeling for the Equitable and Effective Distribution of Donated Food under Capacity Constraints.” IIE Transactions 48 (3): 252–266.
- Person. 2021. “Turkey Steps Up COVID-19 Vaccinations, Offering Hope for Economy.” Accessed October 20, 2021. https://www.reuters.com/world/middle-east/turkey-steps-up-covid-19-vaccinations-offering-hope-economy-2021-06-18/.
- Qazi, A., M. C. Simsekler, and B. Gaudenzi. 2021. “Prioritizing Multidimensional Interdependent Factors Influencing COVID-19 Risk.” PLoS Comput Biol 42 (1): 143–161.
- Ritchie, H., E. Mathieu, L. Rodés-Guirao, C. Appel, C. Giattino, E. Ortiz-Ospina, J. Hasell, et al. 2020. “Coronavirus (COVID-19) Vaccinations.” Accessed December 28, 2021. https://ourworldindata.org/covid-vaccinations.
- Sahinyazan, F. G., and O. M. Araz. 2022. “An Alternative Vaccine Prioritization Approach in Response to COVID-19 Pandemic.” Journal of Humanitarian Logistics and Supply Chain Management doi:10.1108/JHLSCM-02-2022-0029
- Sali, M., and V. Giard. 2015. “Optimal Stock-Out Risk When Demand is Driven by Several Mixed-Model Assembly Lines in the Presence of Emergency Supply.” International Journal of Production Research 53 (11): 3448–3461.
- Shahparvari, S., B. Hassanizadeh, A. Mohammadi, B. Kiani, K. H. Lau, P. Chhetri, and B. Abbasi. 2022. “A Decision Support System for Prioritised COVID-19 Two-Dosage Vaccination Allocation and Distribution.” Transportation Research Part E: Logistics and Transportation Review 159: Article ID 102598.
- Sinha, P., S. Kumar, and C. Chandra. 2021. “Strategies for Ensuring Required Service Level for COVID-19 Herd Immunity in Indian Vaccine Supply Chain.” European Journal of Operational Research Forthcoming.
- Sun, X., E. A. Andoh, and H. Yu. 2021. “A Simulation-Based Analysis for Effective Distribution of COVID-19 Vaccines: A Case Study in Norway.” Transportation Research Interdisciplinary Perspectives 11: Article ID 100453.
- Taha, M.-K., F. Martinon-Torres, R. Köllges, P. Bonanni, M. A. P. Safadi, R. Booy, V. Smith, et al. 2022. “Equity in Vaccination Policies to Overcome Social Deprivation As a Risk Factor for Invasive Meningococcal Disease.” Expert Review of Vaccines 21 (5): 659–674.
- TEPAV. 2020. “Human Development Index in 81 Cities and Turkey's 2020 Global Performance.” (in Turkish). Accessed June 13, 2021. https://www.tepav.org.tr/tr/yayin/s/1564.
- Teytelman, A., and R. C. Larson. 2013. “Multiregional Dynamic Vaccine Allocation During An Influenza Epidemic.” Service Science 5 (3): 197–215.
- Toner, E., A. Barnill, C. Krubiner, J. Bernstein, L. Privor-Dumm, M. Watson, E. Martin, et al. 2020. “Interim Framework for COVID-19 Vaccine Allocation and Distribution in the United States.” Accessed December 20, 2021. https://www.centerforhealthsecurity.org/our-work/pubs_archive/pubs-pdfs/2020/200819-vaccine-allocation.pdf.
- Ucar, A.. et al. 2021. “TURCOVID Open Dataset.” Accessed June 13, 2021. https://turcovid19.com/acikveri/.
- Van der Heijden, M., E. Diks, and A. De Kok. 1997. “Stock Allocation in General Multi-Echelon Distribution Systems with (R, S) Order-up-to-Policies.” International Journal of Production Economics 49 (2): 157–174.
- Van Wassenhove, L. N., and A. J. Pedraza Martinez. 2012. “Using OR to Adapt Supply Chain Management Best Practices to Humanitarian Logistics.” International Transactions in Operational Research 19 (1–2): 307–322.
- Walker, J., P. Paul, K. Dooling, S. Oliver, P. Prasad, M. Steele, P. A. Gastañaduy, et al. 2022. “Modeling Strategies for the Allocation of SARS-CoV-2 Vaccines in the United States.” Vaccine 40 (14): 2134–2139.
- WHO. 2020a. “Ethics and COVID-19: Resource Allocation and Priority-Setting.” Accessed November 18, 2021. https://www.who.int/ethics/publications/ethics-covid-19-resource-allocation.pdf?ua=1.
- WHO. 2020b. “Strategic Considerations in Preparing for Deployment of COVID-19 Vaccine and Vaccination in the WHO European Region.” Accessed October 24, 2021. https://apps.who.int/iris/bitstream/handle/10665/335940/WHO-EURO2020-1148-40894-55356-eng.pdf?sequence=1isAllowed=y.
- WHO. 2020c. “WHO Sage Roadmap for Prioritizing Uses of COVID-19 Vaccines in the Context of Limited Supply.” Accessed October 14, 2021. https://www.who.int/docs/default-source/immunization/sage/covid/sage-prioritization-roadmap-covid19-vaccines.pdf?Status=Tempsfvrsn=bf227443_2ua=1.
- WHO. 2021. “WHO Coronavirus (COVID-19) Dashboard.” Accessed October 24, 2021. https://covid19.who.int/.
- WHO. 2022. “Generating Acceptance and Demand for COVID-19 Vaccines – The Country Readiness and Dleivery.” Accessed May 11, 2022. https://www.who.int/initiatives/act-accelerator/covax/covid-19-vaccine-country-readiness-and-delivery/acceptance-and-demand.
- Woerner, S., M. Laumanns, and S. M. Wagner. 2018. “Joint Optimisation of Capacity and Safety Stock Allocation.” International Journal of Production Research 56 (13): 4612–4628.
- Yang, T., W. Deng, Y. Liu, and J. Deng. 2022. “Comparison of Health-Oriented Cross-Regional Allocation Strategies for the COVID-19 Vaccine: A Mathematical Modelling Study.” Annals of Medicine 54 (1): 941–952.
- Yarmand, H., J. S. Ivy, B. Denton, and A. L. Lloyd. 2014. “Optimal Two-Phase Vaccine Allocation to Geographically Different Regions Under Uncertainty.” European Journal of Operational Research 233 (1): 208–219.
- Yoon, J., R. Narasimhan, and M. K. Kim. 2018. “Retailer's Sourcing Strategy Under Consumer Stockpiling in Anticipation of Supply Disruptions.” International Journal of Production Research 56 (10): 3615–3635.
- Zhou, X., and Y. Li. 2022. “Forecasting the COVID-19 Vaccine Uptake Rate: An Infodemiological Study in the US.” Human Vaccines & Immunotherapeutics 18 (1): Article ID 2017216.
- Zhu, L., Y. Xu, and J. Gu. 2019. “Emergency Relief Routing Models for Injured Victims Considering Equity and Priority.” Annals of Operations Research 283: 1573–1606.
Appendices
Figure A1. Worldwide vaccination coverages by December 9, 2021 (Ritchie et al. Citation2020).
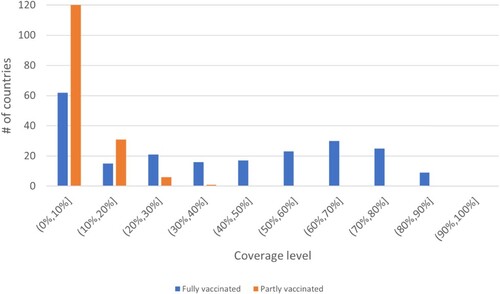
Table B1. Small instance parameters.
Table B2. Parameters for small instance with priority groups.
Figure A2. The framework for calculation of the composite prioritization weight .
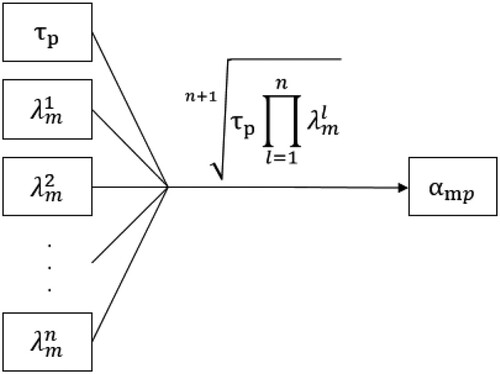
Table C1. Summary of relevant vaccine allocation studies.
Appendix 3. Algorithm for setting the fair amounts
We use Algorithm 1 to use the entire supply in determining fair amounts. We illustrate the calculation of on a small example with the parameters presented in Table and a supply level of 200 to provide a better understanding.
Table D1. Example calculation.
Here, the fair amounts calculated according to (Equation14(14)
(14) ), would lead to nine units of surplus vaccines that can not be allocated since pro-rata weighted allocation values for the first two population groups would be more than their demand. Algorithm 1 eliminates this situation by distributing the excess vaccines to the population groups that can still receive vaccines iteratively, considering their demands and prioritization weights, resulting in the fair amounts and coverages presented Table .
Table