
 ?Mathematical formulae have been encoded as MathML and are displayed in this HTML version using MathJax in order to improve their display. Uncheck the box to turn MathJax off. This feature requires Javascript. Click on a formula to zoom.
ABSTRACT
Numerous studies have focused on digital twins (DTs) and their applications. However, a common method for evaluating the performance of DTs is lacking. Digital twins performance assessment mechanism is crucial when improving or monitoring any process or system in a business, such a strategy could serve as a guide to help researchers and practitioners create more effective digital twins. Guided by these challenges, we propose a structured method for measuring the performance and flexibility of digital twins, and our study provides a procedure for quantitative calculation of the performance of DTs based on four key performance indicators (KPIs). Moreover, we propose a new KPI, DTflex, for determining the flexibility of digital twins. We evaluated the performance of DTflex as a KPI to demonstrate its use as a simple tool for designers and practitioners to quickly compare different DT methodologies, which might provide valuable input for the iterative improvement of DTs to increase their efficiency in future applications. The knowledge provided along with the method proposed in this paper is expected to help researchers and practitioners working in different fields to compare DT methodologies and DT performance which will lead to higher efficiency DT solutions and increased re-usage of existing DTs.
1. Introduction
Digital twins (DTs) can be defined as virtual replicas of entities such as processes and systems (Tao et al. Citation2019a; Grieves Citation2014). DTs increase understanding of how these systems are currently performing and how they will perform in the future (Haag and Anderl Citation2018). DTs are used in different industries for applications including real-time monitoring, process design and optimization, remote access and troubleshooting, quality improvement, and predictive maintenance (Barricelli, Casiraghi, and Fogli Citation2019; Liu, Meyendorf, and Mrad Citation2018a). The benefits of using DTs are manifold: improved reliability of manufacturing equipment and systems, increased overall equipment effectiveness (OEE) via a decrease in downtime, increased productivity, reduced maintenance costs, shorter production times, improved product quality, and supply chain optimization (Y. Wang et al. Citation2020; Errandonea, Beltrán, and Arrizabalaga Citation2020; Grieves and Vickers Citation2017; Uhlemann et al. Citation2017).
The concept with the name ‘digital twin’ first appeared in the draft version of NASA’s roadmap prepared by Shafto et al. (Citation2010). The requirements of modern manufacturing combined with the most recent advances brought by the Fourth Industrial Revolution within the last decade have led to a significant rise in the number of interconnected and autonomous smart manufacturing systems (Qi and Tao Citation2018; Vachalek et al. Citation2017; Pires et al. Citation2019). The huge amount of data generated by these systems has paved the way for the use of DTs for many applications in several industries (Psarommatis, Dreyfus, and Kiritsis Citation2022; Durão et al. Citation2018; Tao et al. Citation2017).
The DT technique has already attracted early adopters in industry, with numerous studies on DTs and their applications in different domains (Khan et al. Citation2022; Yu et al. Citation2020; Yang et al. Citation2019). Important information technology companies have also created platforms that allow businesses to use DTs for a variety of purposes, such as continuously evaluating and forecasting the performance of industrial systems or assisting in the optimization of production decisions (“The Digital Twin , Industry, and Siemens Global” Citation2022). Furthermore, a growing number of academic papers are addressing the topic of DTs (Tao et al. Citation2019b; Psarommatis and May Citation2022). Currently, most DTs lack an appropriate technique and key performance indicators (KPIs) to assess their performance (Psarommatis and May Citation2022). Although a few studies have discussed KPIs and their role in evaluating DTs (Mourtzis, Fotia, and Vlachou Citation2017; Tambare et al. Citation2021), the scope of these studies is limited to improving the administration and implementation of DTs. It is evident that a suitable method for evaluating the performance of DTs is lacking (Chen et al. Citation2021; Abusohyon et al. Citation2021; Shangguan, Chen, and Ding Citation2020; Psarommatis and May Citation2022). Moreover, although accuracy is one of the most critical parameters for DTs, few studies have measured the accuracy of DTs (Jones et al. Citation2020). A better evaluation of performance through a suitable method as well as well-defined KPIs could improve the management of the effectiveness of DTs (Psarommatis Citation2021; Papacharalampopoulos et al. Citation2020; Haße Citation2019). Furthermore, since a performance measurement method is essential when improving any process or system in industry, such a method could serve as a guide to help researchers and practitioners design and develop better DTs. The management of the effectiveness of DTs may be improved with better performance evaluation using appropriate KPIs. However, few studies have evaluated the precision of the algorithms they implement (Psarommatis and May Citation2022).
Purpose of the Study
Guided by the aforementioned obstacles and gaps, in this study, we propose a novel structured method for measuring the performance and flexibility of DTs. The novelty of the current study, in addition to creating a common procedure for measuring the performance and flexibility of DTs, is that our approach makes direct comparisons between DT implementations feasible, straightforward, and valid, which will lead to better solutions, increasing efficiency and ultimately increasing manufacturing sustainability.
This paper is structured as follows. We first provide some key points from the state of the art in section 2. In section 3, we provide a procedure for quantitative calculation of the performance of DTs as a function of their accuracy, accuracy variance, response time, and response time variance. Next, we present a new KPI for determining the flexibility of DTs: DTflex. In section 4, we present the utilisation of the proposed KPI then test it through a use case. In section 5, the knowledge provided with the proposed method is presented and discussed, in particular, how the proposed method would help researchers and practitioners working in different fields to measure the performances and estimate the flexibility of their DTs, hence providing a useful tool for improving the design process in the development of new DTs.
2. State of the art
In the last decade, DTs have entered the industrial world and have been intensively used in industries including the oil and gas (Wanasinghe et al. Citation2020), manufacturing (Kritzinger et al. Citation2018), construction (Opoku et al. Citation2021), aerospace (Phanden, Sharma, and Dubey Citation2021), and automotive sectors (Son et al. Citation2021). There have been numerous studies in the field. (Liu et al. Citation2021) conducted a comprehensive and systematic analysis of the literature and concluded that DTs are about to enter a rapid development phase in which practitioners and researchers explore real industrial technologies and practices. Schleich et al. (Citation2017) provided a comprehensive reference model that served as a DT of a physical product in manufacturing and design. Rosen, Boschert, and Sohr (Citation2018) introduced the concept of next-generation DTs and highlighted the benefits of using DTs (Rosen, Boschert, and Sohr Citation2018). (Tao et al. Citation2019b) developed a new DT-driven method for the engineering, design, manufacturing, and servicing of products and demonstrated some future applications of DTs (Tao et al. Citation2017).
DTs have also entered manufacturing applications and become an essential element of the smart manufacturing portfolio. Scholars working on diverse areas of data-driven smart manufacturing (DDSM) have studied DTs to improve the overall performance of production systems. One of the key topics is zero defect manufacturing (ZDM) (Psarommatis, Zheng, and Kiritsis Citation2021; Psarommatis et al. Citation2020c; Psarommatis et al. Citation2020b). Psarommatis (Citation2021) proposed a new method to develop DTs for the design and modeling of manufacturing systems by considering ZDM as a target performance metric (Psarommatis Citation2021). Ruiz, Bru, and Escoto (Citation2021) designed a DT for scheduling job shop orders in the context of ZDM (Ruiz, Bru, and Escoto Citation2021). Franciosa et al. (Citation2020) provided an AI-powered and deep-learning-enhanced DT to improve the quality of manufacturing (Franciosa et al. Citation2020). Mourtzis, Angelopoulos, and Panopoulos (Citation2021) focused on optimizing the design of manufacturing equipment based on ZDM principles (Mourtzis, Angelopoulos, and Panopoulos Citation2021). Another important area addressed in the use of DTs for overall performance improvement is predictive maintenance (PdM). Werner, Zimmermann, and Lentes (Citation2019) illustrated a DT-based approach for PdM to better estimate the remaining useful life (RUL) of manufacturing equipment (Werner, Zimmermann, and Lentes Citation2019). Aivaliotis, Georgoulias, and Chryssolouris (Citation2019) proposed a method to calculate the RUL of machines by using DTs and tested their method with an industrial robot use case (Aivaliotis, Georgoulias, and Chryssolouris Citation2019). Luo et al. (Citation2020) utilised a DT-driven model for the PdM of CNC machine tools (Luo et al. Citation2020). In a recent study by Hosamo et al. (Citation2022), a PdM framework based on DTs was implemented for automatic fault detection and prognosis (Hosamo et al. Citation2022). Other important areas focused on in DDSM that benefit from DTs include industrial energy efficiency (Li et al. Citation2022a; Bermeo-Ayerbe, Ocampo-Martinez, and Diaz-Rozo Citation2022; Zhang, Zuo, and Tao Citation2018; Karanjkar et al. Citation2019), flexible and customised manufacturing (Fan et al. Citation2021; Martinez et al. Citation2021; Guo et al. Citation2021), and human-centered manufacturing (Longo, Nicoletti, and Padovano Citation2022; Li et al. Citation2022b; Wang et al. Citation2022; Lv et al. Citation2021).
Traditionally, DTs are often created and used at the equipment operation stage. However, a DT might be applied and created during the equipment design phase. The design of a physical system may be supported by the employment of a DT. For example, (Leng et al. Citation2021a) provided a Function–Structure–Behavior–Control–Intelligence–Performance (FSBCIP) framework that emphasises the role of DTs for the design of intelligent manufacturing systems. (Liu et al. Citation2021) proposed an efficient and feasible design strategy for flow-type smart manufacturing systems based on DTs. (Liu et al. Citation2018b) proposed a DT-driven technique for rapidly creating individualised automated flow-shop production systems. DTs have been highlighted as the next wave in the simulation domain.
The validation and testing of a DT should be supported effectively by updating the DT from the standpoint of system reconfiguration. An essential factor to be considered while evaluating DTs is their capacity for semi-physical simulation. In that regard, (Leng et al. Citation2021b) proposed a remote semi-physical commissioning method for open-architecture, flow-type smart manufacturing systems. They showed that commissioning a new flow-type smart manufacturing system is more sustainably accomplished by integrating the open architectural design paradigm with the proposed DT-based strategy. Moreover, (Leng et al. Citation2020) presented a new DT-driven method for quickly reconfiguring automated production systems. Their method can quickly adjust the capacity of manufacturing systems and integrate numerous processes into current systems, enabling the rapid introduction of new product orders.
Another critical factor to be assessed in the functioning of a system is the capability of rapid optimization or AI algorithms. For this critical aspect, (Liu et al. Citation2021) proposed a unique joint optimization method for large-scale automated high-rise warehouse product-service systems. They created a DT system to collect real-time data from product-service systems in physical warehouses and then map it to a cyber model. The effectiveness and efficiency of the large-scale automated high-rise warehouse product-service system can be maximised using the proposed strategy. (Leng et al. Citation2020) created a technology for customised manufacturing on a decentralised network by integrating a blockchain into a DT. Moreover, they presented a method for assessing the production efficiency that may be used with the proposed procedure. Hence, the creation of DTs for the rapid evaluation of cyber-physical systems is an important area of research and development in this domain.
Few studies have focused on developing specific methods for measuring DT performance. Chen et al. (Citation2021) proposed a DT maturity model based on Gemini principles for managing manufacturing assets (Chen et al. Citation2021). This proposed model supports the quantitative evaluation of the flexibility and implementation level of DTs. Chakraborty and Adhikari (Citation2021), in their attempt to develop machine learning–based DTs for dynamical systems, evaluated the performance of DTs on a multi-time scale dynamical system with stiffness and mass variations by utilising an efficient framework that exploits expectation maximisation and a sequential Monte Carlo sampler. Shangguan, Chen, and Ding (Citation2020) used a pre-defined threshold approach to evaluate and compare the performance of their DT for fault diagnosis by focusing on the three concepts of accuracy (ACC), specificity (SPE), and sensitivity (SEN) (Shangguan, Chen, and Ding Citation2020). The DT studies in the literature thus do not have a common method of evaluating the performance and flexibility of their developed models.
DT studies have focused on one metric: accuracy. A performance measurement method that integrates other important factors such as accuracy variance, response time, and response time variance has not yet been proposed. Moreover, there is no assessment method or indicators available for evaluating the flexibility of DT models. Accordingly, in this study, we identified a research gap to be addressed as the development of a new method for measuring the performance and flexibility of DTs and the provision of a guide for academics and practitioners to design and develop better DTs.
3. Dt performance and flexibility KPIs
DTs are becoming an industry standard, and an increasing number of industries are utilising DT technologies and exploiting the numerous advantages of DTs. Because DT utilisation and technologies are fairly new to the industry, there is no standardized approach for evaluating the performance of DT implementations. The development of many DT models whose performance is not evaluated has been reported. Furthermore, to increase the sustainability of DT development, it is necessary to reuse DT methods and models in different applications, rather than create a new DT model in each case. For this purpose, the flexibility of DT methodologies requires quantification. Section 3.1 presents a structured methodology for calculating the performance of a DT model, whereas in section 3.2 the methodology for quantifying the flexibility of DTs is presented and analyzed. Finally, in section 4 a flexibility KPI is calculated for an existing DT to demonstrate the use of the proposed KPI in practice.
3.1. Calculation procedure of DT operational performance
Calculating the performance of DT models is a critical process for identifying the true benefits from implementing DT models. However, calculating the performance is not a straightforward procedure, and the absolute global accuracy of a DT model is impossible to calculate. DTs are data-driven models that emulate different systems, and the more data available, the more accurately the performance is calculated. However, there is a tradeoff between the number of data points used to measure the performance of the DT and the resources and time required to acquire the required data points. Figure illustrates the difficulty of acquiring new data points in terms of the time and cost required. According to the literature, a sample size of 10% of the initial training data points is sufficient to calculate the performance of a DT model (Liu et al. Citation2011; Sargent Citation2010; Riedmaier et al. Citation2021). As mentioned earlier, the more data points available for the calculation of the performance, the higher the accuracy of the measurement, and 10% of the training data is the minimum required to ensure accurate evaluation and this mainly applies to the use cases in which it is difficult to acquire new data points (Figure ). It is critical to measure the performance of a DT model prior to its actual deployment to identify the effect of the DT model on the system and to develop corresponding KPIs.
Figure 1. Difficulty of acquiring data points.
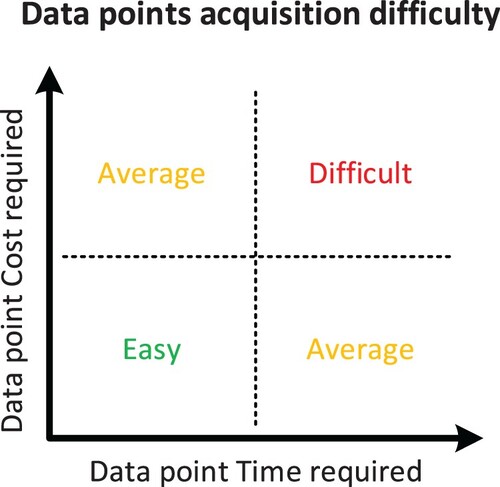
Table presents generic KPIs used to measure the operational performance of DT models. These KPIs are identified as the most critical for evaluating the performance of a DT. The most important performance is the accuracy of the DT model. Returning to the definition of a DT, a DT is a digital representation of a system. DTs have input parameters and also output parameters. The goal of DT models is to estimate the output parameters for a given set of input parameters. The difference between the estimated output parameters and the values taken from the actual system is defined as the DT accuracy. In the current study, two different accuracies are defined: the accuracy of each output parameter (AOP), which is calculated using equation (1) (y: DT output parameter, Y: total number of output parameters), and the global DT accuracy, which is the average of the accuracies of all individual output parameters (GDTA) and is calculated using equation (2). If a DT model has only one output parameter, then equation (2) is simplified to equation (3) where xy,R,i is the value of output parameter y for the ith validation data point from the actual system and xy,DT,i is the same value from the DT model. In general, the accuracy demonstrated by a KPI is how well the DT model fits the deployed use case. Although global accuracy is an important KPI, the repeatability of the DT model in terms of accuracy is also important. For this reason, the accuracy variance is defined and is calculated for each output parameter (ACVAR) using equation 4, and the global accuracy variance (GAVAR) is the average of the variance of all the output parameters (equation 5). The next two KPIs in Table are related to the computational time required by the DT model to estimate the output parameters. The response time (ART) is defined as the actual time required by the DT model to calculate the output parameters (equation 6), and the response time variance (RTVAR) (equation 7) indicates whether the computational time of the DT model is affected by the input parameters.
Table 1. Generic KPIs of DTs
The defined KPIs presented in Table are generic and can be applied to any DT application. A specific methodology should be followed to correctly and consistently calculate these KPIs to ensure that the results can be compared. Figure illustrates the steps that must be followed to calculate the defined KPIs. The first step is to develop the required DT model. Then, the KPIs must be calculated before the model is deployed. To calculate the defined KPIs, the sample size must be calculated. Then, validation experiments can be performed. The DT accuracy and response time can be calculated in parallel as depicted in Figure .
Figure 2. Steps for calculating KPIs.
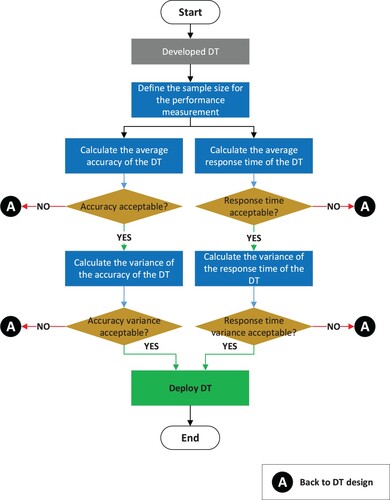
The first step is to calculate the average global accuracy of the DT as well as the response time. If either of these metrics is not acceptable, then the design of the DT model should be revised until an acceptable result is achieved. This is when the accuracy and the response time have been calculated and returned acceptable variances of the accuracy and response time. Again, if either of the variances has an unacceptable value, the design of the DT should be revised. Once the KPIs have been calculated, the DT model is ready to be deployed. The proposed approach for measuring the KPIs of a DT model can be considered as use case specific, meaning that the same DT methodology may give different KPI results in different use cases.
3.2. DT flexibility measurement (DTflex)
This subsection presents a structured methodology for evaluating the flexibility of DT methodologies. In contrast with the previous section, where the KPIs were use case specific, the current approach for evaluating the DT flexibility refers to the DT methodology and is independent of the use case. The evaluation of the DT flexibility is critical for comparing different DT methodologies and for deriving interesting results by studying the flexibility of DT approaches.
The flexibility of a DT method is defined as its ability to be used in different applications and the ability to vary the initial methodology with as little intervention as possible. The quantification of the DT flexibility is a complex and difficult challenge. In the current study, we propose a simple approach that utilises a structured questionnaire to evaluate the flexibility of a DT method. The proposed questionnaire is presented in Table and includes nine questions, some of which have conditional sub-questions. Each question is analyzed in detail in the following subsections, along with some examples required for the explanation and full comprehension of questions. Each question has only two possible answers, Yes and No, to avoid subjectivity. Such Yes/No surveys have been used successfully for decades in different research domains, especially in biomedical and health sciences (Raphael Citation2018; Haasz, Ostro, and Scolnik Citation2018; Ivanoff et al. Citation2017; Patel et al. Citation2012), manufacturing (Tregerman et al. Citation2019), and education research (Cotos Citation2011). Psarommatis and May (Citation2022) proposed a design methodology that includes some fundamental information that should be considered and provided in every DT development. The following list presents the basic information required for DT development as identified by Psarommatis and May (Citation2022):
Industry for which the DT is developed
Purpose of the DT
Process or asset described by the DT
Type of use of the DT (continuously, when needed, both, etc.)
Technologies used for the DT
Input parameters of the DT
Output parameters of the DT
Table 2. Questionnaire for calculating DT flexibility.
A different weight has been assigned for each question depending on its importance. The weights are based on the importance of each question using a scale in the range (0, 0.8], where 0 is of no importance and 0.8 is extremely important. This weight assignment was inspired and adopted by the Scale of Relative Importance used in the analytical hierarchy process (Saaty Citation1987). Additionally, we added some conditions while assigning the weights. For a question with conditional questions, the sum of the weights of the sub-questions should be less than or equal to the weight of the parent question, otherwise there will be information loss and the contribution of each question will be unbalanced and the flexibility measurement will be inaccurate. The values of the YES/NO answers are given in the third column of Table . After answering all the questions, DTflex is calculated using equation 8. In order for DTflex to take only positive values, a constant of 4.8 is added to the sum of the question weights of equation 8, since the minimum sum of the question weights is 4.8.
3.2.1. Q1: can the DT methodology be used in other use cases without any changes?
The development of a DT model requires a certain methodology. Q1 concerns the applicability of the DT methodology to other use cases without any changes. Each DT methodology considers some input parameters and has at least one output parameter. In other words, Q1 determines whether the DT methodology is use case specific. For example, if a DT methodology is developed to emulate the chatter during the milling of aluminum parts, can the same methodology be applied with the same input parameters to give the same output parameters to study the chatter during the milling of titanium or turning steel parts? If the DT methodology can adapt to different use cases, then the answer to Q1 is YES, and otherwise the answer is NO.
3.2.2. Q2: does the DT methodology require specific experiments to collect the data required to develop the DT (Specific) or can it be developed using real-time or historical data from a repository (Non-specific)?
DT models are developed utilising data collected from the system emulated by the DT. Different DT technologies require different types and amounts of data. Furthermore, some technologies for developing DT models require structured real-time data or historical data. On the other hand, other DT methodologies require the conduction of specific experiments to develop the DT model. For example, if a DT is developed using machine learning, then historical data is required to train the DT model. In other words, Q2 checks whether organizations already have the required data integrated into their repositories or whether they can easily acquire them. Other methodologies based on statistical methods such as the design of experiments require the conduction of specific experiments to acquire the data required to train the DT model.
3.2.3. Q3 (and sub-questions): can the number of input parameters be increased?
It is important that a DT methodology has the ability to increase the number of input parameters to produce a more complete and accurate DT model. Therefore, to ensure a flexible DT methodology, it is critical to be able to increase the number of DT input parameters. Otherwise, if the number of input parameters is fixed, then the DT methodology can only be applied to the use case that it was designed for.
3.2.4. Q3.1: are there any limitations on increasing the number of input parameters? (if Q3 is YES)
If the reply to Q3 is YES, which means that the number of input parameters can be increased, Q3.1 must be answered. Q3 covers the scenario that the number of input parameters can be increased, but it does not cover the scenario of some limitations on increasing the number of input parameters. For this reason, Q3.1 is included to cover this scenario. Although many DT methodologies can handle an arbitrary number of input parameters, others have certain limitations. For example, DT methodologies based on the design of experimental methodologies, particularly the Taguchi approach (Klingaa et al. Citation2021; Sedighiani et al. Citation2020; Psarommatis Citation2021), are strongly dependent on orthogonal arrays for conducting the required experiments to acquire the necessary data to develop the DT.
3.2.5. Q3.2: does increasing the number of input parameters beyond a certain point require additional data/experiments? (if Q3.1 is YES)
Q3.2 is included to analyze the consequences of further increasing the number of input parameters if the answer of Q3.1 is YES, which means that there are limitations on further increasing the number of input parameters. If it is possible to increase the number of input parameters, then how easy is to increase them? Simply adding some existing data to the DT methodology concerning the new input parameters or increasing the number of input parameters may result in the need for additional experiments or, in some cases, the entire series of DT model training experiments to be reconducted. Methods with such a limitation on the input parameters include those based on the design of experimental methodologies, particularly the Taguchi approach described before. Such approaches are based on orthogonal arrays that contain a fixed number of parameters. If the number of parameters is increased beyond a certain point, changes are required in the DT methodology and a different orthogonal array should be used, which also changes the number of experiments required to train the DT model.
3.2.6. Q3.3: does increasing the number of input parameters require modification of the DT method? (if Q3 is YES)
The ability to increase the number of parameters is critical for a DT methodology to be flexible. If the number of input parameters of a DT methodology can be increased without the need to modify any aspect of the DT methodology, then the DT methodology is flexible. If changes to the DT methodology are required, as described in the example in subsection 3.2.5, then the flexibility of the DT methodology are limited.
3.2.7. Q3.4: does increasing the number of input parameters affect the output parameters? (if Q3 is YES)
Increasing the number of input parameters is important, but what are the effects of this increase on the output parameters in terms of the DT methodology for analyzing the training data? Q3.4 aims to cover this topic. In more detail, the number of input parameters can be increased for three purposes: a) to increase the accuracy and detail of the DT model, b) to study extra output parameters, and c) to study a different use case with different requirements and control parameters.
3.2.8. Q4: can the number of input parameters be decreased?
Different use cases might have different requirements in terms of input parameters. Therefore, it is critical that a DT methodology can be utilised in other use cases. Q4 takes into this aspect into consideration when evaluating the total flexibility of the DT method.
3.2.9. Q4.1: does decreasing the number of input parameters affect the output parameters? (if Q4 is YES)
If the answer to Q4 is YES, then Q4.1 is required to establish whether decreasing the number of input parameters in the DT methodology affects the output parameters.
3.2.10. Q4.2: does decreasing the number of input parameters require modification of the DT method? (if Q4 is YES)
If the answer to Q4 is YES, then Q4.2 establishes whether the DT methodology is fixed or allows modifications, enabling its application to other use cases.
3.2.11. Q5: can the DT methodology handle more than one output parameter at the same time?
Most industrial systems that can be modelled using a DT are multiparametric systems having multiple input and output parameters. Therefore, it is critical that the DT methodology can handle more than one parameter at the same time for the same DT model. This question (Q5) is added because, for example, some DT methods are based on the design of experiments that can handle only one parameter per DT model. For these cases, all the output parameters must be aggregated into a single value using, for example, a weighted sum formula, then the DT model is trained using this value. However, using a weighted sum formula is a single-direction procedure, meaning that once the output parameter have been aggregated you cannot go back to the initial values. Therefore, it is critical to the flexibility of the DT method that more than one output parameter can be handled at the same time for the same DT model.
3.2.12. Q6: can the number of output parameters be increased?
Each DT method is designed and developed for a specific use case having a certain number of input and output parameters. As mentioned before, different use cases might have different requirements in terms of output parameters. Therefore, for a DT methodology to be flexible, it must be able to adapt to the requirements of use cases. Q6 is included to establish whether it is possible to increase the number of output parameters without altering the DT methodology.
3.2.13. Q6.1: are there any limitations on increasing the number of output parameters in the DT method?
If the answer to Q6 is YES, then Q6.1 must be answered. If the number of output parameters can be increased, then are there any limitations to the DT methodology that prohibit the number of output parameters from being increased? If there is at least one limitation that prohibits the number of output parameters from being increased beyond a certain point, then the answer is YES.
3.2.14. Q7: can the DT adapt to new operational conditions?
A key aspect of the flexibility of a DT method is its ability to adapt to changes occurring in the modelled system. An possible example of this is a DT model emulating the milling process of a metal part with the probability of chatter as an output parameter that is dependent on the input parameters. In this case, since the milling machine wears out as it is used, the dynamic characteristics are changing, and therefore the point at where chatter occurs may change. Therefore, it is very important for a flexible DT model to be able to adapt to such changes.
3.2.15. Q7.1: is the adaptation of the DT model performed automatically or manually?
There are two ways in which a DT method can adapt to changes (if Q7 is YES): a) automatically, meaning that the DT method can automatically adjust its training using data, and b) manually, meaning that the model is adjusted manually using any form of data source.
3.2.16. Q7.2: does the adaptation of the DT model require additional data/experiments? (if Q7 is YES)
If the DT method allows adaptation (if Q7 is YES), can the model be adapted using existing data, historical data, or real-time data from the system, or are specific experiments necessary to extract the required data to adjust the model? For example, experiments may be necessary for DT methodologies that are based on the design of experiments.
3.2.17. Q8: can the DT model be executed using a conventional hardware desktop computer (six-core desktop)?
DT models are software tools that emulate a system. These software tools require computers for their execution. Depending on the principles used to design a DT methodology, different amounts of computational power may be required to operate the DT model. For example, if a DT method requires a special high-end and expensive computer setup to operate, then this requirement might limit its use.
3.2.18. Q9: does the use of the DT require special training?
Developing and deploying a DT model is one aspect, and the operation of the DT model is another important factor. Q9 aims to ascertain whether using the DT requires special training and knowledge.
4. Example of flexibility measurement
To validate and demonstrate the use of the proposed approach for measuring the flexibility of a DT method, we refer to a previous study in which all the necessary information for the DTflex calculation is provided (Psarommatis Citation2021). The selected DT model was developed to emulate a ZDM-oriented scheduling tool (Psarommatis and Kiritsis Citation2018; Psarommatis, Gharaei, and Kiritsis Citation2020a; Psarommatis, Vuichard, and Kiritsis Citation2020d; Psarommatis, Zheng, and Kiritsis Citation2021). Actual simulations using the ZDM-oriented scheduling tool require at least 2.5 h of computational time to provide the KPIs. The DT model had six parameters as inputs, and the KPIs were output in the form of an aggregated value, meaning that all the KPIs were combined into one value. Table presents the answers to the questions in Table along with the corresponding explanations of the answers. The total DTflex of the selected DT methodology is 6.4, which indicates an average flexibility value. We used equation 9 to convert DTflex of 6.4 into a percentage [0%, 100%] of 48.88%. Figure graphically illustrates this result.
(9)
(9)
Figure 3. Conversion of DTflex to percentage for easy comparison.
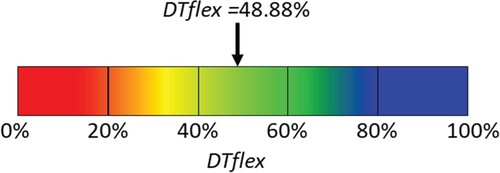
Table 3. Example of DTflex measurement for DT developed by Psarommatis (Citation2021).
5. Discussion
Current state-of-the-art DTs lack KPIs or performance measurement methods to manage their effectiveness. A review of the scientific literature in the broad domain of DTs, as well as industry and consulting reports, highlighted the absence of KPIs or other measurements of the effectiveness of DTs. Although confusion matrixes have been used in some studies and industrial practices, they simply identify false positives or false negatives, considering these as two leading indicators of a problem with a DT. However, these confusion matrixes provide no quantitative value to measure and compare the effectiveness of different DTs, hence enabling only minimal opportunities for improvement by trial and error. For this reason, further studies and practices of DTs could benefit from our proposed method for evaluating their performance and flexibility.
The proposed approach aims to contribute to two different levels in the process of DT development: the development of a methodology for measuring the DT flexibility (DTflex), which applies at the methodology level regardless of the use case and present a common set of KPIs for measuring the performance of a DT during the operation phase. This means that manufacturers and researchers can compare different DT methodologies and select an appropriate DT for each case. However, for this to occur, DT developers should present their DTs in detail, providing all the information identified by Psarommatis and May (Citation2022), with DTflex calculated or all the information required to calculate it. This will allow the standardization of DT development, which is a critical aspect for all the domains where DTs are used. In contrast with DTflex, which refers to the DT method and is independent of the use case, the proposed performance KPIs are use case specific, which means that the same KPIs for the same method may give different values for different use cases.
DTflex is not studied together with the other performance KPIs because it refers to the method and not the operational performance of a DT, making it inappropriate to aggregate DTflex with the other defined performance KPIs. On the other hand, the performance KPIs could be aggregated using a weighted sum formula to give a single value for the performance of the DT, but this value would be relative and not absolute. For this reason, we decided not to aggregate the KPIs; the aggregation should occur when a direct comparison of two or more DTs is required. Furthermore, the purpose of this paper is to provide tools for evaluating the flexibility of DT methods and measuring the operational performance of DTs, and the comparison of DT implementations is beyond the scope of the paper. We carefully selected four generic performance KPIs. We considered other KPIs, such as the cost of developing a DT, but decided not to include them because they strongly depend on the use case. To ensure a valid comparison of DT implementations, DTs should be developed for the same use case. Comparing the performance KPIs for DTs developed for different use cases can only indicate which DT method performs better but cannot provide an absolute comparison. As also mentioned in section 3.1, the same DT method could have completely different performance KPIs for different applications.
DT technology providers should consider the proposed approach to track the performance of their DTs when developing new DT implementations. The use of such methods would highly benefit manufacturers, especially in cases where they are used for highly critical assets. In that regard, having a standardized and common approach for calculating the performance of DT models will enable manufacturers to select appropriate technologies, approaches, and solutions for developing or implementing a DT in their production settings. The full potential of DTs in manufacturing settings can only be exploited with the ability to simulate a complete industrial environment and accurately predict the metrics the DT was designed for. Hence, our proposed method will help to better understand whether a DT is performing its functions and objectives specified in the design phase.
Furthermore, simulation-based design is an essential method. A DT directly performs validation and tests that can rapidly identify the cause of a malfunction or inefficiency, rule out errors, and assess the viability of a physical solution when put into practice. As a result, the design of DTs may be involved in evaluating the effectiveness and adaptability of DTs.
The proposed methodology for measuring the flexibility of DT methods is lean, straightforward, and easy to use. One of the purposes of the proposed methodology was to create an easy-to-use practical solution for measuring the flexibility of DT methods. Past practices in different application domains have revealed that highly complex methods that are difficult to use are not desired by industry. For this reason, we used Yes/No questions because of their easy-to-select options and to maximise the objectivity of the replies. Yes/No surveys are closed ended and the scale used is considered nominal. The advantage of this type of survey is that it allows respondents derive their conclusions rapidly and efficiently. Since the aim of our proposed method is to provide an easy-to-use tool for domain experts in their respective areas, this type of Yes/No survey fits our purpose. Furthermore, measuring the flexibility of DT methodologies gives manufacturers an extra criterion for selecting DT methodologies. The flexibility measurement questions also support the structuring of the design of DT methodologies and models by pointing out key aspects requiring consideration. This will also contribute to the development of flexible DT methodologies and the increased reuse of DT methods, leading to higher sustainability.
6. Conclusion
In this paper, we first identified an important challenge: in the current scientific literature and industrial practices and applications, there is no common method that is accepted and adopted by researchers and practitioners for measuring the effectiveness and flexibility of DTs and DT methods. We provided a new quantitative methodology for performance measurement through the key metrics of a DT of accuracy, accuracy variance, response time, and response time variance. These performance KPIs are associated with the operational performance of a DT. Moreover, we presented a new KPI, DTflex, which determines the flexibility of a DT method by using a qualitative method of evaluation based on a series of questions that can be used to iteratively improve the design of new DTs. The testing of the proposed KPI demonstrated its value as an easy-to-use method for designers and practitioners for the rapid comparison of their DTs that can provide important feedback for the iterative redesign of DTs to increase their effectiveness in future applications. This work is a first step in guiding academics and industry practitioners to facilitate the design and development phase of their DTs.
Future work should focus on using these new methods and the KPI in more industrial use cases where DT applications are utilised. In this context, the performance method proposed in section 3.1 can be tested further as a means of evaluating the effectiveness of already used or newly built DTs. Furthermore, DTflex can be used by researchers and practitioners in different industry sectors building diverse DT applications to evaluate and continuously improve the flexibility, and hence the effectiveness, of DTs. Future work will also focus on clarifying the tradeoff between DTflex and other KPIs that characterize DT methods, such as the cost, for specific use cases.
Acknowledgments
The presented work was partially supported by the projects Eur3ka and QU4LITY, EU H2020 projects under grant agreements No 101016175 and No 825030 accordingly. The paper reflects the authors’ views, and the Commission is not responsible for any use that may be made of the information it contains.
Disclosure statement
No potential conflict of interest was reported by the author(s).
Data availability
The authors confirm that the data supporting the findings of this study are available within the article.
Additional information
Funding
Notes on contributors

Foivos Psarommatis
Dr. Foivos Psarommatis is a passionate and active researcher in the area of quality improvement in manufacturing systems. More specifically is a pioneer in the area of Zero Defect Manufacturing (ZDM), as is the first who modernized and set the foundation of modern ZDM. His scientific interests, motivation and vision are around Industry 4.0 and on how ZDM can be applied efficiently to production systems, focusing on the decision making, scheduling and design of a system or a product, with ultimate goal to achieve true sustainable manufacturing. He is actively involved in EU research programs in the area of Factories of the Future and Enabling ICT for Sustainable Manufacturing. Foivos holds a BSc and an MSc in Mechanical engineering with specialization on design and manufacturing engineering from the University of Patras. He has also an MSc from National University of Athens in Automation systems with specialization on manufacturing and production systems. He did his PhD around the topic of Zero Defect Manufacturing École polytechnique fédérale de Lausanne - EPFL. Currently he is a senior researcher at the University of Oslo, at SIRIUS – Centre for Scalable Data Access, and also founder and CEO of Zerofect, a company focusing on ZDM and sustainability. Foivos is an active member on a CEN/CENELEC working group responsible for standardizing ZDM and a member of IOF (Industrial Ontologies Foundry) where he is the chair of the ZDM working group.

Gokan May
Dr. May is an Assistant Professor at the University of North Florida, Editorial Board Member of the World Manufacturing Forum, and member of the World Economic Forum’s Expert Network comprising only select 3,000 leading experts from academia, business, government, and international organizations (https://www.weforum.org/people/gokan-may). He received his PhD in Industrial and Manufacturing Engineering, and excelled in several areas of data-driven innovation for advanced and sustainable manufacturing by being involved in numerous collaborative research initiatives building an extensive network of industrial and academic partners in the field and by publishing in high impact journals on different subjects of data-driven engineering for advanced manufacturing including studies on manufacturing strategies, zero-defect manufacturing and intelligent maintenance as growing trends in industry 4.0, and industrial energy efficiency toward a sustainable future. He published more than 40 journal papers and conference proceedings gathering ca. 900 citations to date. He has been involved in several EU-Funded Projects (H2020 & FP7) and in preparing new proposals for EC calls and received more than 3 Million Euros funding between 2010 and 2019. Dr. May served as the project coordinator at Politecnico di Milano (2010-2015) and École Polytechnique Fédérale de Lausanne (2015-2019) for several funded projects in his research expertise areas. These projects include H2020 QU4LITY (https://qu4lity-project.eu/), H2020 BOOST4.0 (https://boost40.eu/), H2020 Z-BRE4K (https://www.z-bre4k.eu/), H2020 Z-Fact0r (https://www.z-fact0r.eu/), FP7 MAN-MADE, FP7 PLANTCockpit, and FP7 EMC2 Eco-Factory.
References
- Abusohyon, Islam Asem Salah, Alberto Crupi, Faezeh Bagheri, and Flavio Tonelli. 2021. How to Set Up the Pillars of Digital Twins Technology in Our Business: Entities, Challenges and Solutions.” Processes 2021, Vol. 9, Page 1307 9(8). Multidisciplinary Digital Publishing Institute: 1307. doi:10.3390/PR9081307.
- Aivaliotis, P., K. Georgoulias, and G. Chryssolouris. 2019. The Use of Digital Twin for Predictive Maintenance in Manufacturing.” https://doi.org/10.1080/0951192X.2019.1686173 32 (11). Taylor & Francis: 1067–1080.
- Barricelli, Barbara Rita, Elena Casiraghi, and Daniela Fogli. 2019. “A Survey on Digital Twin: Definitions, Characteristics, Applications, and Design Implications.” IEEE Access 7. Institute of Electrical and Electronics Engineers Inc. doi:10.1109/ACCESS.2019.2953499.
- Bermeo-Ayerbe, Miguel Angel, Carlos Ocampo-Martinez, and Javier Diaz-Rozo. 2022. “Data-Driven Energy Prediction Modeling for Both Energy Efficiency and Maintenance in Smart Manufacturing Systems.” Energy 238 (January): Pergamon: 121691. doi:10.1016/j.energy.2021.121691.
- Chakraborty, S. 2021. “Machine learning based digital twin for dynamical systems with multiple time-scales.” Computers and Structures 243.
- Chen, Long, Xiang Xie, Qiuchen Lu, Ajith Kumar Parlikad, Michael Pitt, and Jian Yang. 2021. Gemini Principles-Based Digital Twin Maturity Model for Asset Management.” Sustainability 2021, Vol. 13, Page 8224 13 (15). Multidisciplinary Digital Publishing Institute: 8224. doi:10.3390/SU13158224.
- Cotos, Elena. 2011. “Potential of Automated Writing Evaluation Feedback.” CALICO Journal 28 (2): 420–459. doi:10.11139/cj.28.2.420-459.
- Durão, Luiz Fernando C.S., Sebastian Haag, Reiner Anderl, Klaus Schützer, and Eduardo Zancul. 2018. “IFIP Advances in Information and Communication Technology.” IFIP Advances in Information and Communication Technology AICT-540 (July): Springer International Publishing: 204–214. doi:10.1007/978-3-030-01614-2_19.
- Errandonea, Itxaro, Sergio Beltrán, and Saioa Arrizabalaga. 2020. “Digital Twin for Maintenance: A Literature Review.” Computers in Industry 123 (December): Elsevier: 103316. doi:10.1016/j.compind.2020.103316.
- Fan, Yepeng, Jianzhong Yang, Jihong Chen, Pengcheng Hu, Xiaoyu Wang, Jianchun Xu, and Bin Zhou. 2021. “A Digital-Twin Visualized Architecture for Flexible Manufacturing System.” Journal of Manufacturing Systems 60 (July): Elsevier: 176–201. doi:10.1016/J.JMSY.2021.05.010.
- Franciosa, P, M Sokolov, S Sinha, T Sun, and D Ceglarek. 2020. “Deep learning enhanced digital twin for Closed-Loop In-Process quality improvement.” CIRP annals 69 (1): 369–372.
- Grieves, Michael. 2014. “Digital Twin: Manufacturing Excellence through Virtual Factory Replication.” https://www.researchgate.net/publication/275211047_Digital_Twin_Manufacturing_Excellence_through_Virtual_Factory_Replication.
- Grieves, Michael, and John Vickers. 2017. Digital Twin: Mitigating Unpredictable, Undesirable Emergent Behavior in Complex Systems.” Transdisciplinary Perspectives on Complex Systems: New Findings and Approaches, January. Springer, Cham, 85–113. doi:10.1007/978-3-319-38756-7_4.
- Guo, Hongfei, Minshi Chen, Khalgui Mohamed, Ting Qu, Siming Wang, and Jianke Li. 2021. “A Digital Twin-Based Flexible Cellular Manufacturing for Optimization of Air Conditioner Line.” Journal of Manufacturing Systems 58 (January): Elsevier: 65–78. doi:10.1016/J.JMSY.2020.07.012.
- Haag, Sebastian, and Reiner Anderl. 2018. “Digital Twin – Proof of Concept.” Manufacturing Letters 15 (January): Elsevier Ltd: 64–66. doi:10.1016/j.mfglet.2018.02.006.
- Haasz, Maya, Daniel Ostro, and Dennis Scolnik. 2018. “Examining the Appropriateness and Motivations Behind Low-Acuity Pediatric Emergency Department Visits.” Pediatric Emergency Care 34 (9): Pediatr Emerg Care: 647–649. doi:10.1097/PEC.0000000000001598.
- Haße, Hendrik. 2019. Digital Twin for Real-Time Data Processing in Logistics.” doi:10.15480/882.2462.
- Hosamo, Haidar Hosamo, Paul Ragnar Svennevig, Kjeld Svidt, Daguang Han, and Henrik Kofoed Nielsen. 2022. “A Digital Twin Predictive Maintenance Framework of Air Handling Units Based on Automatic Fault Detection and Diagnostics.” Energy and Buildings 261 (April): Elsevier: 111988. doi:10.1016/j.enbuild.2022.111988.
- Ivanoff, Chris S., Krassimira Yaneva, Diana Luan, Bogomil Andonov, Reena R. Kumar, Anirudha Agnihotry, Athena E. Ivanoff, et al. 2017. “A Global Probe Into Dental Student Perceptions About Philanthropy, Global Dentistry and International Student Exchanges.” International Dental Journal 67 (2): Int Dent J: 107–116. doi:10.1111/idj.12260.
- Jones, David, Chris Snider, Aydin Nassehi, Jason Yon, and Ben Hicks. 2020. “Characterising the Digital Twin: A Systematic Literature Review.” CIRP Journal of Manufacturing Science and Technology 29 (May): Elsevier: 36–52. doi:10.1016/j.cirpj.2020.02.002.
- Karanjkar, Neha, Ashish Joglekar, Sampad Mohanty, Venkatesh Prabhu, D. Raghunath, and Rajesh Sundaresan. 2019. Digital Twin for Energy Optimization in an SMT-PCB Assembly Line.” Proceedings - 2018 IEEE International Conference on Internet of Things and Intelligence System, IOTAIS 2018, January. Institute of Electrical and Electronics Engineers Inc., 85–89. doi:10.1109/IOTAIS.2018.8600830.
- Khan, Latif U, Zhu Han, Walid Saad, Ekram Hossain, Mohsen Guizani, Choong Seon Hong, and Senior Member. 2022. Digital Twin of Wireless Systems: Overview, Taxonomy, Challenges, and Opportunities.” Accessed March 10.
- Klingaa, C. G., S. Mohanty, C. V. Funch, A. B. Hjermitslev, L. Haahr-Lillevang, and J. H. Hattel. 2021. “Towards a Digital Twin of Laser Powder Bed Fusion with a Focus on Gas Flow Variables.” Journal of Manufacturing Processes 65 (May): Elsevier: 312–327. doi:10.1016/j.jmapro.2021.03.035.
- Kritzinger, Werner, Matthias Karner, Georg Traar, Jan Henjes, and Wilfried Sihn. 2018. “Digital Twin in Manufacturing: A Categorical Literature Review and Classification.” IFAC-PapersOnLine 51 (11): Elsevier: 1016–1022. doi:10.1016/j.ifacol.2018.08.474.
- Leng, Jiewu, Qiang Liu, Shide Ye, Jianbo Jing, Yan Wang, Chaoyang Zhang, Ding Zhang, and Xin Chen. 2020. “Digital Twin-Driven Rapid Reconfiguration of the Automated Manufacturing System via an Open Architecture Model.” Robotics and Computer-Integrated Manufacturing 63 (June): Pergamon: 101895. doi:10.1016/j.rcim.2019.101895.
- Leng, Jiewu, Dewen Wang, Weiming Shen, Xinyu Li, Qiang Liu, and Xin Chen. 2021a. “Digital Twins-Based Smart Manufacturing System Design in Industry 4.0: A Review.” Journal of Manufacturing Systems 60 (July): Elsevier: 119–137. doi:10.1016/j.jmsy.2021.05.011.
- Leng, Jiewu, Man Zhou, Yuxuan Xiao, Hu Zhang, Qiang Liu, Weiming Shen, Qianyi Su, and Longzhang Li. 2021b. “Digital Twins-Based Remote Semi-Physical Commissioning of Flow-Type Smart Manufacturing Systems.” Journal of Cleaner Production 306 (July): Elsevier: 127278. doi:10.1016/j.jclepro.2021.127278.
- Li, Hongcheng, Dan Yang, Huajun Cao, Weiwei Ge, Erheng Chen, Xuanhao Wen, and Chongbo Li. 2022a. “Data-Driven Hybrid Petri-Net Based Energy Consumption Behaviour Modelling for Digital Twin of Energy-Efficient Manufacturing System.” Energy 239 (January): Pergamon: 122178. doi:10.1016/J.ENERGY.2021.122178.
- Li, Chengxi, Pai Zheng, Shufei Li, Yatming Pang, and Carman K.M. Lee. 2022b. “AR-Assisted Digital Twin-Enabled Robot Collaborative Manufacturing System with Human-in-the-Loop.” Robotics and Computer-Integrated Manufacturing 76 (August): Pergamon: 102321. doi:10.1016/J.RCIM.2022.102321.
- Liu, Yu, Wei Chen, Paul Arendt, and Hong-Zhong Huang. 2011. “Toward a Better Understanding of Model Validation Metrics.” Journal of Mechanical Design 133 (7), American Society of Mechanical Engineers Digital Collection. doi:10.1115/1.4004223.
- Liu, Qiang, Jiewu Leng, Douxi Yan, Ding Zhang, Lijun Wei, Ailin Yu, Rongli Zhao, Hao Zhang, and Xin Chen. 2021. “Digital Twin-Based Designing of the Configuration, Motion, Control, and Optimization Model of a Flow-Type Smart Manufacturing System.” Journal of Manufacturing Systems 58 (January): Elsevier: 52–64. doi:10.1016/J.JMSY.2020.04.012.
- Liu, Zheng, Norbert Meyendorf, and Nezih Mrad. 2018a. The Role of Data Fusion in Predictive Maintenance Using Digital Twin ARTICLES YOU MAY BE INTERESTED IN A Comparative Study on Digital Twin Models AIP Conference Cyber Physical Systems Role in Manufacturing Technologies AIP Conference.” doi:10.1063/1.5031520.
- Liu, Qiang, Hao Zhang, Jiewu Leng, and Xin Chen. 2018b. Digital Twin-Driven Rapid Individualised Designing of Automated Flow-Shop Manufacturing System.” https://doi.org/10.1080/00207543.2018.1471243 57 (12). Taylor & Francis: 3903–3919.
- Longo, Francesco, Letizia Nicoletti, and Antonio Padovano. 2022. “New Perspectives and Results for Smart Operators in Industry 4.0: A Human-Centered Approach.” Computers & Industrial Engineering 163 (January): Pergamon: 107824. doi:10.1016/j.cie.2021.107824.
- Luo, Weichao, Tianliang Hu, Yingxin Ye, Chengrui Zhang, and Yongli Wei. 2020. “A Hybrid Predictive Maintenance Approach for CNC Machine Tool Driven by Digital Twin.” Robotics and Computer-Integrated Manufacturing 65 (October): Pergamon: 101974. doi:10.1016/J.RCIM.2020.101974.
- Lv, Qibing, Rong Zhang, Xuemin Sun, Yuqian Lu, and Jinsong Bao. 2021. “A Digital Twin-Driven Human-Robot Collaborative Assembly Approach in the Wake of COVID-19.” Journal of Manufacturing Systems 60 (July): Elsevier: 837–851. doi:10.1016/J.JMSY.2021.02.011.
- Martinez, Santiago, Alexis Mariño, Sofia Sanchez, Ana María Montes, Juan Manuel Triana, Giacomo Barbieri, Sepideh Abolghasem, John Vera, and Marco Guevara. 2021. A Digital Twin Demonstrator to Enable Flexible Manufacturing with Robotics: A Process Supervision Case Study.” http://Mc.Manuscriptcentral.Com/Tpmr 9 (1). Taylor & Francis: 140–156. doi:10.1080/21693277.2021.1964405.
- Mourtzis, Dimitris, John Angelopoulos, and Nikos Panopoulos. 2021. “Equipment Design Optimization Based on Digital Twin Under the Framework of Zero-Defect Manufacturing.” Procedia Computer Science 180 (January): Elsevier: 525–533. doi:10.1016/j.procs.2021.01.271.
- Mourtzis, D., S. Fotia, and E. Vlachou. 2017. “Lean Rules Extraction Methodology for Lean PSS Design via Key Performance Indicators Monitoring.” Journal of Manufacturing Systems 42 (January): Elsevier: 233–243. doi:10.1016/j.jmsy.2016.12.014.
- Opoku, De Graft Joe, Srinath Perera, Robert Osei-Kyei, and Maria Rashidi. 2021. “Digital Twin Application in the Construction Industry: A Literature Review.” Journal of Building Engineering 40 (August): Elsevier: 102726. doi:10.1016/j.jobe.2021.102726.
- Papacharalampopoulos, Alexios, Christos Giannoulis, Panos Stavropoulos, and Dimitris Mourtzis. 2020. A Digital Twin for Automated Root-Cause Search of Production Alarms Based on KPIs Aggregated from IoT.” Applied Sciences 2020, Vol. 10, Page 2377 10 (7). Multidisciplinary Digital Publishing Institute: 2377. doi:10.3390/APP10072377.
- Patel, Nihar, Vivek A. Rao, Elizabeth R. Heilman-Espinoza, Raymond Lai, Ramon A. Quesada, and Alexander C. Flint. 2012. “Simple and Reliable Determination of the Modified Rankin Scale Score in Neurosurgical and Neurological Patients.” Neurosurgery 71 (5): Neurosurgery: 971–975. doi:10.1227/NEU.0b013e31826a8a56.
- Phanden, Rakesh Kumar, Priavrat Sharma, and Anubhav Dubey. 2021. “A Review on Simulation in Digital Twin for Aerospace, Manufacturing and Robotics.” Materials Today: Proceedings 38 (January): Elsevier: 174–178. doi:10.1016/j.matpr.2020.06.446.
- Pires, Flavia, Ana Cachada, Jose Barbosa, Antonio Paulo Moreira, and Paulo Leitao. 2019. Digital Twin in Industry 4.0: Technologies, Applications and Challenges.” IEEE International Conference on Industrial Informatics (INDIN) 2019-July (July). Institute of Electrical and Electronics Engineers Inc.: 721–726. doi:10.1109/INDIN41052.2019.8972134.
- Psarommatis, Foivos. 2021. “A Generic Methodology and a Digital Twin for Zero Defect Manufacturing (ZDM) Performance Mapping Towards Design for ZDM.” Journal of Manufacturing Systems 59 (April): Elsevier: 507–521. doi:10.1016/j.jmsy.2021.03.021.
- Psarommatis, Foivos, Paul Arthur Dreyfus, and Dimitris Kiritsis. 2022 January. “The Role of Big Data Analytics in the Context of Modeling Design and Operation of Manufacturing Systems.” Design and Operation of Production Networks for Mass Personalization in the Era of Cloud Technology, Elsevier, 243–275. doi:10.1016/B978-0-12-823657-4.00012-9.
- Psarommatis, Foivos, Ali Gharaei, and Dimitris Kiritsis. 2020a. “Identification of the Critical Reaction Times for Re-Scheduling Flexible Job Shops for Different Types of Unexpected Events.” Procedia CIRP 93 (January): Elsevier: 903–908. doi:10.1016/j.procir.2020.03.038.
- Psarommatis, Foivos, and Dimitris Kiritsis. 2018. “A Scheduling Tool for Achieving Zero Defect Manufacturing (ZDM): A Conceptual Framework.” IFIP Advances in Information and Communication Technology 536: 271–278. Springer New York LLC. doi:10.1007/978-3-319-99707-0_34.
- Psarommatis, Foivos, Gökan May, Paul-Arthur Dreyfus, and Dimitris Kiritsis. 2020b. “Zero Defect Manufacturing: State-of-the-Art Review, Shortcomings and Future Directions in Research.” International Journal of Production Research 58: 1–17. doi:10.1080/00207543.2019.1605228.
- Psarommatis, Foivos, and Gokan May. July 2022. “A Literature Review and Design Methodology for Digital Twins in the Era of Zero Defect Manufacturing.” International Journal of Production Research, 1–21. doi:10.1080/00207543.2022.2101960.
- Psarommatis, Foivos, Sylvain Prouvost, Gökan May, and Dimitris Kiritsis. 2020c. “Product Quality Improvement Policies in Industry 4.0: Characteristics, Enabling Factors, Barriers, and Evolution Toward Zero Defect Manufacturing.” Frontiers in Computer Science 2 (August): 1–15. doi:10.3389/fcomp.2020.00026.
- Psarommatis, Foivos, Martin Vuichard, and Dimitris Kiritsis. 2020d. “Improved Heuristics Algorithms for Re-Scheduling Flexible Job Shops in the Era of Zero Defect Manufacturing.” Procedia Manufacturing 51 (January): Elsevier: 1485–1490. doi:10.1016/j.promfg.2020.10.206.
- Psarommatis, Foivos, Xiaochen Zheng, and Dimitris Kiritsis. 2021. “A Two-Layer Criteria Evaluation Approach for Re-Scheduling Efficiently Semi-Automated Assembly Lines with High Number of Rush Orders.” Procedia CIRP 97 (January): Elsevier: 172–177. doi:10.1016/j.procir.2020.05.221.
- Qi, Qinglin, and Fei Tao. 2018. “Digital Twin and Big Data Towards Smart Manufacturing and Industry 4.0: 360 Degree Comparison.” IEEE Access 6 (January): Institute of Electrical and Electronics Engineers Inc.: 3585–3593. doi:10.1109/ACCESS.2018.2793265.
- Raphael, Dennis. 2018. “Understanding the Promotion of Health Equity at the Local Level Requires Far More Than Quantitative Analyses of YesNo Survey Data Comment on "Health Promotion at Local Level in Norway: The Use of Public Health Coordinators and Health Overviews to Promote Fair Distribution Among Social Groups.” International Journal of Health Policy and Management 7 (10): Int J Health Policy Manag: 964–967. doi:10.15171/ijhpm.2018.70.
- Riedmaier, Stefan, Jakob Schneider, Benedikt Danquah, Bernhard Schick, and Frank Diermeyer. 2021. “Non-Deterministic Model Validation Methodology for Simulation-Based Safety Assessment of Automated Vehicles.” Simulation Modelling Practice and Theory 109 (May): Elsevier: 102274. doi:10.1016/j.simpat.2021.102274.
- Rosen, Roland, Stefan Boschert, and Annelie Sohr. 2018. “Next Generation Digital Twin.” Atp Magazin 60 (10): Vulkan-Verlag GmbH: 86–96. doi:10.17560/atp.v60i10.2371.
- Ruiz, Julio Cesar Serrano, Josefa Mula Bru, and Raul Poler Escoto. June 2021. “Smart Digital Twin for ZDM-Based Job-Shop Scheduling.” 2021 IEEE International Workshop on Metrology for Industry 4.0 and IoT, MetroInd 4.0 and IoT 2021 - Proceedings, Institute of Electrical and Electronics Engineers Inc., 510–515. doi:10.1109/METROIND4.0IOT51437.2021.9488473.
- Saaty, R. W. 1987. “The Analytic Hierarchy Process—What It Is and How It Is Used.” Mathematical Modelling 9 (3–5): Pergamon: 161–176. doi:10.1016/0270-0255(87)90473-8.
- Sargent, Robert G. 2010. “Verification and Validation of Simulation Models.” Proceedings - Winter Simulation Conference, 166–183. doi:10.1109/WSC.2010.5679166.
- Schleich, Benjamin, Nabil Anwer, Luc Mathieu, and Sandro Wartzack. 2017. “Shaping the Digital Twin for Design and Production Engineering.” CIRP Annals 66 (1): Elsevier: 141–144. doi:10.1016/j.cirp.2017.04.040.
- Sedighiani, K., M. Diehl, K. Traka, F. Roters, J. Sietsma, and D. Raabe. 2020. “An Efficient and Robust Approach to Determine Material Parameters of Crystal Plasticity Constitutive Laws from Macro-Scale Stress–Strain Curves.” International Journal of Plasticity 134 (November): Pergamon: 102779. doi:10.1016/j.ijplas.2020.102779.
- Shafto, Mike, Mike Conroy Rich, Doyle Ed Glaessgen, Chris Kemp, Jacqueline Lemoigne, and Lui Wang. 2010. DRAFT MoDeling, SiMulATion, InFoRMATion Technology & PRoceSSing RoADMAP Technology Area 11.”.
- Shangguan, Duansen, Liping Chen, and Jianwan Ding. 2020. A Digital Twin-Based Approach for the Fault Diagnosis and Health Monitoring of a Complex Satellite System.” Symmetry 2020, Vol. 12, Page 1307 12 (8). Multidisciplinary Digital Publishing Institute: 1307. doi:10.3390/SYM12081307.
- Son, Yoo Ho, Kyu Tae Park, Donggun Lee, Seung Woo Jeon, and Sang do Noh. 2021. Digital Twin–Based Cyber-Physical System for Automotive Body Production Lines.” The International Journal of Advanced Manufacturing Technology 2021 115:1 115 (1). Springer: 291–310. doi:10.1007/S00170-021-07183-3.
- Tambare, Parkash, Chandrashekhar Meshram, Cheng Chi Lee, Rakesh Jagdish Ramteke, and Agbotiname Lucky Imoize. 2021. Performance Measurement System and Quality Management in Data-Driven Industry 4.0: A Review.” Sensors 2022, Vol. 22, Page 224 22 (1). Multidisciplinary Digital Publishing Institute: 224. doi:10.3390/S22010224.
- Tao, Fei, Jiangfeng Cheng, Qinglin Qi, Meng Zhang, He Zhang, and Fangyuan Sui. 2017. Digital Twin-Driven Product Design, Manufacturing and Service with Big Data.” The International Journal of Advanced Manufacturing Technology 2017 94:9 94 (9). Springer: 3563–3576. doi:10.1007/S00170-017-0233-1.
- Tao, Fei, He Zhang, Ang Liu, and A. Y. C. Nee. 2019a. “Digital Twin in Industry: State-of-the-Art.” IEEE Transactions on Industrial Informatics 15 (4): IEEE Computer Society: 2405–2415. doi:10.1109/TII.2018.2873186.
- Tao, Fei, He Zhang, Ang Liu, and A. Y. C. Nee. 2019b. “Digital Twin in Industry: State-of-the-Art.” IEEE Transactions on Industrial Informatics 15 (4): IEEE Computer Society: 2405–2415. doi:10.1109/TII.2018.2873186.
- “The Digital Twin | Industry | Siemens Global”. 2022. Accessed August 3. https://new.siemens.com/global/en/company/stories/industry/the-digital-twin.html.
- Tregerman, Irving, Walter Renne, Abigail Kelly, and Dalton Wilson. 2019. “Evaluation of Removable Partial Denture Frameworks Fabricated Using 3 Different Techniques.” The Journal of Prosthetic Dentistry 122 (4): J Prosthet Dent: 390–395. doi:10.1016/j.prosdent.2018.10.013.
- Uhlemann, Thomas H.J., Christoph Schock, Christian Lehmann, Stefan Freiberger, and Rolf Steinhilper. 2017. “The Digital Twin: Demonstrating the Potential of Real Time Data Acquisition in Production Systems.” Procedia Manufacturing 9 (January): Elsevier: 113–120. doi:10.1016/j.promfg.2017.04.043.
- Vachalek, Jan, Lukas Bartalsky, Oliver Rovny, Dana Sismisova, Martin Morhac, and Milan Loksik. 2017. The Digital Twin of an Industrial Production Line within the Industry 4.0 Concept.” Proceedings of the 2017 21st International Conference on Process Control, PC 2017, July. Institute of Electrical and Electronics Engineers Inc., 258–262. doi:10.1109/PC.2017.7976223.
- Wanasinghe, Thumeera R., Leah Wroblewski, Bui K. Petersen, Raymond G. Gosine, Lesley Anne James, Oscar de Silva, George K.I. Mann, and Peter J. Warrian. 2020. “Digital Twin for the Oil and Gas Industry: Overview, Research Trends, Opportunities, and Challenges.” IEEE Access 8: Institute of Electrical and Electronics Engineers Inc.: 104175–104197. doi:10.1109/ACCESS.2020.2998723.
- Wang, Yankai, Shilong Wang, Bo Yang, Lingzi Zhu, and Feng Liu. 2020. “Big Data Driven Hierarchical Digital Twin Predictive Remanufacturing Paradigm: Architecture, Control Mechanism, Application Scenario and Benefits.” Journal of Cleaner Production 248 (March): Elsevier: 119299. doi:10.1016/j.jclepro.2019.119299.
- Wang, Baicun, Huiying Zhou, Geng Yang, Xingyu Li, and Huayong Yang. 2022. “Adaptive Coordinated Path Tracking Control Strategy for Autonomous Vehicles with Direct Yaw Moment Control.” Chinese Journal of Mechanical Engineering 35 (1): Springer Science and Business Media LLC: 1–6. doi:10.1186/s10033-021-00666-0.
- Werner, Andreas, Nikolas Zimmermann, and Joachim Lentes. 2019. “Approach for a Holistic Predictive Maintenance Strategy by Incorporating a Digital Twin.” Procedia Manufacturing 39 (January): Elsevier: 1743–1751. doi:10.1016/j.promfg.2020.01.265.
- Yang, Yong, Zhu Chen, Jing Yan, Zhi Xiong, Jun Zhang, Hongxia Yuan, Yali Tu, and Tianyun Zhang. 2019. State Evaluation of Power Transformer Based on Digital Twin.” Proceedings - IEEE International Conference on Service Operations and Logistics, and Informatics 2019, SOLI 2019, November. Institute of Electrical and Electronics Engineers Inc., 230–235. doi:10.1109/SOLI48380.2019.8955043.
- Yu, Bo, Heping Xie, Ling Chen, Wu Zhao, and Zhiqiang He. 2020. “Exploration of Digital Twin Design Mechanism of the Deep in Situ Rock Insulation Coring Device.” Geofluids 2020. Hindawi Limited. doi:10.1155/2020/8835085.
- Zhang, Meng, Ying Zuo, and Fei Tao. May 2018. Equipment Energy Consumption Management in Digital Twin Shop-Floor: A Framework and Potential Applications.” ICNSC 2018 - 15th IEEE International Conference on Networking, Sensing and Control, Institute of Electrical and Electronics Engineers Inc., 1–5. doi:10.1109/ICNSC.2018.8361272.