
 ?Mathematical formulae have been encoded as MathML and are displayed in this HTML version using MathJax in order to improve their display. Uncheck the box to turn MathJax off. This feature requires Javascript. Click on a formula to zoom.
Abstract
Population growth in urban cities has created transport problems such as traffic congestion, pollution, accidents, and infrastructure failures. These problems often lead to disruption of mobility, especially in emerging economies. The goal of any city is to have a resilient transport system that is free from frequent and severe disruptions. Resilience can be incorporated into smart mobility systems to create a robust, integrated and intelligent transport system. Therefore, this study sought to determine resilience factors required for a resilient smart mobility system in emerging economies. The study used interpretive structural modelling (ISM) to establish the causal interrelationships among the factors drawing from data from experts in smart cities, city transport and academia. It was found that the most critical factor to drive resilience is foresight – the ability to anticipate disruptions. Three other resilience factor categories identified were dynamism, certainty and optimisation, which all point to the importance of building dynamic capabilities. The key implication for practice highlights the role that human and artificial intelligence can play in anticipating natural, social and infrastructure disruptions. ISM offered a mechanism to determine the critical causal resilience factors to be prioritised amongst the competing demands on the limited resources of emerging economies. Apart from foresight, which was found to be a driving factor, the other resilience factors are equally strong linkage factors (influence each other), thus further revealing the complexities that decision-makers in urban cities of emerging economies constantly face. A research agenda for resilience in smart mobility in emerging economies was developed.
1. Introduction
Cities in emerging economies have experienced tidal-wave migration of people from rural areas that has outpaced the transport systems (Stead and Pojani Citation2017). While gridlock, a form of transport disruption, is now part of life in these cities, it significantly impacts supply chain systems and economies (Dolgui and Ivanov Citation2021b; Labuschagne et al. CitationJuly, 2017). Smart mobility, a data-driven and citizen-centred transport system that offers shared multimodal services based on cooperative and connected transport (Šemanjski, Mandžuka, and Gautama Citation2018), promises relief to urban areas, especially in emerging economies. Smart mobility integrates artificial intelligence (AI) and other advanced technologies, such as smart sensors (Internet of Things – IoT), geospatial technologies, blockchains, and big data analytics. Such an integration is geared towards facilitating the seamless movement of people, goods and services using multiple modes of transport, including road, rail, pedestrian infrastructure and maritime (Dolgui and Ivanov Citation2021a; Enjalbert, Kahn Ribeiro, and Vanderhaegen Citation2020). Smart mobility enables intelligent foiling of city transport disruptions caused by congestion, accidents, adverse weather conditions, and protests. Therefore, it has the potential to infuse resilience into transport systems of emerging cities.
More importantly, the COVID-19 pandemic has brought into sharp focus the importance of building resilience into all types of systems. In a smart mobility context, resilience would mean building into the transport system the capability to recover from shock and disruptions as well as survive, adapt and grow in the face of turbulent change (Fiksel Citation2015; Alexopoulos et al. Citation2022). Resilience in smart mobility ensures continued growth and evolution of current and future transport systems to satisfy the dynamic needs of a burgeoning urban area and its stakeholders (Bhamra, Dani, and Burnard Citation2011).
This paper seeks to develop and evaluate the resilience of a smart mobility system in the context of cities in an emerging economy. Transport systems in urban areas of emerging economies often have legacy infrastructure and planning challenges that require huge but not readily available financial and non-financial resources. For example, urban areas in South Africa were designed based on a paradigm of segregated development and have, therefore, unique demands (Stead and Pojani Citation2017) such as high levels of urban sprawl and extensive commuting distances. To this end, smart mobility offers an opportunity to optimise the usage of existing systems and infrastructure that are limited by current constraints while simultaneously recovering from various forms of disruption to become resilient. Thus, smart mobility offers a dynamic and non-infrastructure solution for existing transport challenges faced by cities of emerging economies. Resilience is, however, a complex concept, which typically consists of several elements. This being the case, understanding the importance of the role of these elements in a smart mobility system and how these elements interact with each other in an emerging city environment is critical for a successful system design. It is for this reason that this research seeks to address the following two research questions:
What are the influential resilience factors that must be built into a smart mobility system from an emerging economy perspective?
How do resilience factors in such a smart mobility system relate to one another in a model?
This paper has adopted the rapidly growing City of Johannesburg (CoJ) as a case study. The CoJ is the commercial hub of South Africa and has the highest influx of migrants in Africa; this is from a perspective of both rural–urban migration within the borders of the country and migration of foreign nationals into the country (BusinessTech Citation2020). Inevitably, massive population growth levels are experienced in the CoJ. Mobility in the CoJ is thus frequently constrained by congestion and infrastructure that is not keeping up with the ever-increasing societal needs. Transport disruptions in the CoJ, which are caused by, amongst other things, potholes, traffic signal malfunctions, and industrial actions, often lead to commuter delays of up to 119 hours a year (BusinessTech Citation2016). Whilst smart mobility is generally aimed at increasing resilience in the transport system, resilience in African countries is highly constrained by challenges such as rapid population growth, urban sprawl and long commuting distances. The resultant deterioration of infrastructure and dominance of the informal sector in the provision of services such as transit services ultimately requires smart mobility solutions to address these unique challenges (Dixon et al. Citation2018). Infrastructure and informal sector challenges are common in cities of emerging economies (Stead and Pojani Citation2017). While published research exists on smart mobility (Fiksel Citation2015; Sima et al. Citation2021; Stead and Pojani Citation2017), a literature dearth regarding building resilience using smart mobility systems, especially in cities of emerging economies, still prevails.
The remainder of this paper is structured as follows: the next section presents a review of literature of transport systems disruptions in emerging economies, smart mobility, resilience, and dynamic capabilities as a theoretical lens; Section 3 comprises a description and implementation of the interpretive structural modelling (ISM) approach to identify the most influential factors of resilience required for incorporating into smart mobility in emerging economies; Section 4 presents a discussion and implications of the study and dovetails into the future research agenda presented in Section 5. Section 6 concludes the paper.
2. Literature review and theoretical perspective
2.1. Transport system disruptions
Public transport is central to commuting within large cities. It is therefore an important component for supporting social and economic interactions and ultimately the active functioning and general well-being of society (Cebecauer et al. Citation2021). Although transport systems are designed to operate under defined conditions (Rodrigue Citation2020), they must also consider efficient and cost-effective transportation of passengers by transport companies (FastCo Works Citation2020). Even when such mitigation strategies are introduced, high-capacity public transport services such as metro and commuter buses and trains are often vulnerable to disruptions (Cebecauer et al. Citation2021; Rodrigue Citation2020).
Transport disruptions are ‘any significant delay, interruption, or stoppage in the flow of trade caused by a natural disaster, heightened threat level, an act of terrorism, or any transportation security incident’ (Legal Information Institute Citation2006). In respect of public transport, disruptions consist of any incidents that cause a slowdown or stoppage in the flow of the transportation system. These include natural disasters and anthropogenic disasters, the latter of which include accidents; infrastructure failures; conflicts, terrorism and piracy; economic and political shocks; and pandemics (Rodrigue Citation2020). With reference to emerging economies, transportation disruptions often result from infrastructure failure, limited skills, service suspensions, industrial action, and even crime. The recent onset of the COVID-19 pandemic has further disrupted transport systems in emerging economies, thus worsening social and economic challenges for passengers and service providers alike (Yap and Cats Citation2021).
This paper therefore investigates the ability to overcome transport system disruptions in emerging economies, giving specific prominence to the use of smart mobility solutions to build intelligence within transport systems.
2.2. Smart mobility
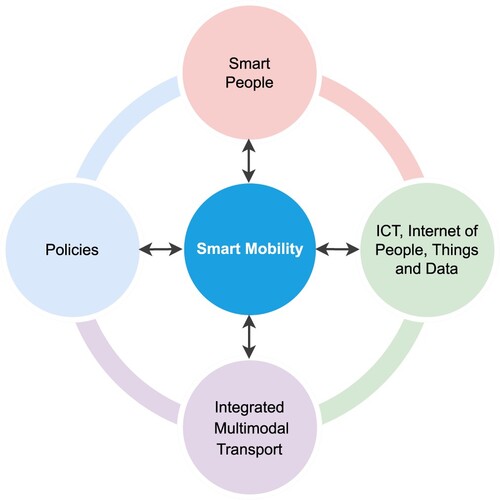
Smart mobility can be defined as a citizen-centred transport system that is digital technology permeated to offer shared multimodal transport services based on cooperative and connected traffic systems that are data driven (Šemanjski, Mandžuka, and Gautama Citation2018). Smart mobility offers an integrated and intelligent transport system that is based on the following dimensions: (1) transport modes; (2) users; and (3) digitisation, including Mobility as a Service (MaaS) and other digital platforms found within a city (Enjalbert, Kahn Ribeiro, and Vanderhaegen Citation2020). Some of the benefits of smart mobility include reduction in pollution, reducing traffic congestion, increasing people safety, improving transfer speed and reducing transfer costs (Cledou, Estevez, and Soares Barbosa Citation2018). Cities often adopt a smart mobility model, as shown in Figure , to improve the quality of life of their citizens. Smart mobility aims to facilitate the seamless movement of people across multiple modes of transport such as cars, buses, motorcycles, and aerial vehicles, while leveraging on information within the city.
Figure 1. Smart mobility model (figure by authors).
2.3. Smart mobility enabling technologies
The overlaying contextual intent for smart mobility is to achieve integration of different mobility objects and constraints, to cognitively recognise them within four-dimensional space-time mobility solutions, thereby achieving spatial-temporal intelligence. This integration of different mobility objects can only be achieved by first considering the requisite data infrastructure within the context of the multiplicities of objects in a smart mobility environment (Amović et al. Citation2021), and then considering practical aspects of IoT. The desired data and information infrastructure involves the collection (sensing the data from the environment and heterogeneous sources such as vehicles and nodes), interpretation, and integration or sharing of data with all the relevant objects in the smart city environment. The data and information integration consoles should observe the five dimensions of big data to enable the handling of both structured and unstructured data (Gürsoy and Yücelen Citation2017; Mageto Citation2021). Further, data-centric AI algorithms should be designed to promote intelligence and automation in smart mobility environments.
Integration of the objects in the smart city environment enables the attainment of a good level of smart mobility where any device, anyone using any path (mesh network), anywhere and anytime (ubiquitous) and any service can access information and make instantaneous intelligent decisions (Paiva et al. Citation2021).
Achieving smart mobility can principally be explored using a two-dimensional methodology – a techno-centric and data-driven approach (Zan, Gueta, and Okochi Citation2015). Technology acts as the enabler for semantic, ontological and information integration. Within the ambit of technology integration, the IoT – and more recently the Internet of Everything (IoE) – allows the different objects of the smart architecture to achieve information integration (Balakrishna Citation2012). This enables all the different objects in the smart mobility space to share information and make intelligent decisions with regards to mobility. The IoE enables the networked connection of people, process, data, and things thus enabling increased connectedness of everything. In addition, the IoE enables the realisation of shared mobility systems (information sharing with everything and anything, and anywhere and anytime) within a conceptual overlay of MaaS (Zan, Gueta, and Okochi Citation2015).
Key enabling technologies on which smart mobility innovations have been developed include geospatial technologies, blockchain-based technologies, smart sensors and IoT, AI and big data. Many conceptual, prototype, or ready-to-use smart mobility technologies are principally based on IoT and/or IoE, AI, blockchain, and big data to achieve route optimisation, and promotion of active and inclusive mobility (Amović et al. Citation2021; Paiva et al. Citation2021).
Some examples of smart mobility solutions include: the CityGML (GAMINESS), Hanoi's data monitoring tool used for adaptive traffic scheduling, and Smart Mobility for All (SMAll) (Paiva et al. Citation2021). The next section discusses resilience and opportunities available for using smart mobility technologies to embed resilience into smart mobility solutions for emerging economies.
2.4. Resilience
Resilience measures the extent to which an entity recovers from shock and disruptions in its environment, the ability to survive, adapt and in fact grow in the face of turbulent change (Fiksel Citation2015). According to Alexopoulos et al. (Citation2022), resilience is the ability to withstand difficult situations, adjust to a change, and recover from undesired to desired states. Resilience carries with it the elements of flexibility, adaptability and foresight in surviving beyond disruptions and eventually adapting and even thriving in the new normal (Louisot Citation2015). The ability to be resilient ensures that entities will continue to grow and evolve to satisfy the dynamic needs of its stakeholders and population in the present and future. Both living and organisational entities display resilience (Bhamra, Dani, and Burnard Citation2011).
Unlike risk management which focuses on reducing vulnerabilities and limiting uncertainty, resilience always places the emphasis on speeding recovery and facilitating adaptation to new conditions and embracing change and uncertainty about the future as a necessary eventuality (Fiksel Citation2015). Therefore, resilience is almost always related to complexities that arise in a set context (Gunasekaran, Subramanian, and Rahman Citation2015). These complexities can be internal or external. For example, with reference to external complexities, cities have the fastest growing populations worldwide with half of the global population now living in urban areas. The challenge for cities is therefore how to balance economic prosperity against the quality of life (Louisot Citation2015; Yılmaz Börekçi, Rofcanin, and Gürbüz Citation2015). In terms of internal complexities, organisations are today so interconnected in their supply chains that small shocks in any part of the supply chain can cause a significant disruption in the entire supply chain (Louisot Citation2015; Yılmaz Börekçi, Rofcanin, and Gürbüz Citation2015).
Resilience at a point in time is not automatic since organisations can become victims of their own prior success (Yılmaz Börekçi, Rofcanin, and Gürbüz Citation2015). Fiksel (Citation2015) highlights three objectives for measuring resilience: (1) to characterise the attributes of alternative plans or designs before implementation; (2) to estimate the predicted performance of plans or designs before they are implemented; and (3) to assess the actual performance of plans or designs after they have been implemented. This study focuses on the attributes of alternative plans or designs before implementation at the system level (as opposed to the node level).
Namdar, Blackhurst, and Azadegan (Citation2022) identified five strategies to achieve resilience, namely: (1) acceptance (acquiesce to disruptions and accept them as inevitable); (2) inventory slack strategy (have a little more than enough in the inventory); (3) backup supplier strategy (to ensure alternative suppliers in the event that one supplier in the supply chain is unavailable); (4) volume flexibility (the ability to increase operational capacity on demand); and (5) responsiveness (to reduce process and/or lead times, preparation time to deliver, and the recovery rate).
The following subsection therefore presents a composite perspective on resilience in transport systems (Namdar, Blackhurst, and Azadegan Citation2022; Sazvar et al. Citation2021; Yılmaz Börekçi, Rofcanin, and Gürbüz Citation2015; Fiksel Citation2015; Alexopoulos et al. Citation2022; Hosseini, Barker, and Ramirez-Marquez Citation2016; Kähkönen et al. Citation2021; Fiksel Citation2015):
2.4.1. Flexibility (capabilities built into the system)
The transport system must be able to fit within the disruptions and continue to offer the same quality of service as before, usually by increasing capacity on demand (volume flexibility) (Namdar, Blackhurst, and Azadegan Citation2022; Yılmaz Börekçi, Rofcanin, and Gürbüz Citation2015). Flexibility enables the service to remain undisrupted or offers alternatives, to the extent that the person outside the transport system would not notice the disruption or experience minimum effects from the disruption (Yılmaz Börekçi, Rofcanin, and Gürbüz Citation2015). For example, to ensure flexibility of the transport system, the following questions should be posed and answered: What capacity does the transport system have and can it have? Is there a scope for the transport system to expand, as well as contract after expansion? This is related to responsive demand. With reference to the CoJ for instance, if the Metrorail train service is not working, are minibus taxi services temporarily and readily available to passengers?
2.4.2. Adaptability (a learning system)
This is the ability to adjust and/or make changes in the business model in response to disruptions over the long term (Hosseini, Barker, and Ramirez-Marquez Citation2016; Fiksel Citation2015). Adaptability carries with it the essence of the ability to learn, and this is what distinguishes it from flexibility. For transport, this describes the extent to which smart mobility can enable the transport system to respond to surges in demand after a disruption. For example, can smart mobility enable 1,000 passengers stranded from a train disruption to be served by an alternative transport mode every time?
2.4.3. Foresight
Foresight is the ability to predict when disruptions will happen, the ability to anticipate changes and/or disruptions (Fiksel Citation2015). Foresight also has an element of knowing how much time would be needed for switch overs after the disruption. For example, enabling smart mobility to reasonably predict flooding based on weather patterns and then offer alternatives to continue delivering on transport needs.
2.4.4. Vulnerability
Vulnerability relates primarily to the existence of a weak element in the system that can threaten business continuity (Fiksel Citation2015). For example, the failure of a highly utilised transport mode such as minibus taxis may impact the functioning of other transport modes (where taxis are used as feeder systems to these modes), the capacity of the entire transport system (where modal switching places extreme pressure on the other modes), and the functioning of the broader economy. Smart mobility can identify areas of high and low vulnerability in terms of the broader impact on the overall transport and mobility system.
2.4.5. Cohesion
The extent to which there are unifying linkages between the various parts of a system is cohesion (Fiksel Citation2015). For a transport system, this would represent the extent to which the various modal systems work together. Smart mobility can enable these linkages so that they function as a cohesive whole.
2.4.6. Efficiency
Efficiency is about optimising existing resources, or limiting the number of resources or costs required (Fiksel Citation2015). For transport systems, this means ensuring that costs and wastage of transport resources are kept at a minimum. For example, the ability to find the cheapest and fastest route using different types of modal systems.
2.4.7. Diversity
Diversity is an important element as it allows for choice (Fiksel Citation2015). For transport systems, there is a type of ‘captive transport users’ who are limited by a lack of choice to only one type of modal system such as taxis. Smart mobility should be able to allow for multiple modal options.
2.4.8. Stability
Stability refers to when systems are available all the time and can be relied upon and be available when needed (Fiksel Citation2015; Hosseini, Barker, and Ramirez-Marquez Citation2016). In transport systems, this relates to the extent to which modal systems are available as required without a loss of service. For example, passengers are assured of a public transport service with a sense of certainty.
2.4.9. Recoverability
Recoverability refers to the ability of a system to cope during and after a disruption (Hosseini, Barker, and Ramirez-Marquez Citation2016; Sazvar et al. Citation2021) and thereafter bounce back and restore services (Fiksel Citation2015; Alexopoulos et al. Citation2022). It also relates to how long the disruption lasts, how much the disruption costs, and the tolerable degree of disruption after the service has become unavailable (Fiksel Citation2015; Kähkönen et al. Citation2021). For example, the extent to which transport users can make a choice on what to use, the ability to select an alternative, and how readily and when that alternative is available. An example of time ‘recoverability is how it took Hiroshima three days for the transport services to restart following a bomb attack (Hiroshima for Global Peace Citation2014).
2.5. Dynamic capabilities theory
Cities, especially those in emerging economies, are faced with changing requirements owing to increased disruptions of mobility, leading to long travel times, congestion, air pollution, and poor quality of life. The emerging cities are expected to develop dynamic capabilities to overcome these challenges. While some of the cities in emerging economies possess adequate resources in terms of infrastructure and know-how, it is difficult to optimally utilise the resources to meet the dynamic needs of cities. This implies that having resources is not enough, however, the development of dynamic capabilities is likely to unlock the potential of the cities in emerging economies to offer better and resilient mobility solutions. Dynamic capabilities are identified as being behavioural and point to the ability to integrate, reconfigure, renew, and recreate (Linde et al. Citation2021; Wang and Ahmed Citation2007) in response to the changing environment. Dynamic capabilities have three common components, namely: (1) adaptive – which refers to the strategic flexibility (Staber and Sydow Citation2002); (2) absorptive – which is the ability to evaluate and utilise external knowledge; and (3) innovative – which is the ability to develop new competencies and solutions (Wang and Ahmed Citation2007).
Mobility challenges in emerging cities require the application of dynamic resources to achieve a sustainable and resilient transportation system. This might require incorporating advanced information technologies, that is smart mobility tools to achieve integration, adaptation, absorption and innovation capabilities (Linde et al. Citation2021). It is against this background that we argue that cities in emerging economies should adopt smart mobility solutions as a dynamic capability that can allow them to achieve resilience in the ever-changing city transportation sector. Dynamic capabilities theory has previously been applied in research, especially in smart city ecosystems (Linde et al. Citation2021), airport competitiveness (Chwiłkowska-Kubala Citation2021), and application of blockchain in maritime (Lambourdiere and Corbin Citation2020), as well as in emerging economies (Owoseni and Twinomurinzi Citation2018). However, limited studies have applied dynamic capabilities in smart mobility solutions in emerging cities. To this end, this study contributes to the extant literature by extending the application of the theory.
3. Methodology
3.1. The interpretive structural modelling approach
ISM is a qualitative mathematical and analytical technique conceptualised by Warfield in the early 1970s to make sense of complex phenomena as a heterogeneous set of factors (Warfield Citation1973, Citation1974, Citation1976; Sage Citation1977). These factors undergo a series of steps guided by graph theory, resulting in an all-encompassing and structured systematic model. This model serves as a theoretical basis for reasoning about the existent relationships amongst these factors.
ISM has three key guiding characteristics (Attri, Dev, and Sharma Citation2013). Firstly, it is interpretive. This means that it relies on the lived experiences, knowledge, and informed opinions of knowledgeable experts who understand how factors influence each other (Walsham Citation1995). Secondly, it is structural which means that an overall structure is extracted from the heterogeneous set of factors that represent the phenomenon under investigation. Thirdly, it is a modelling technique; this means that the approach culminates in a model which articulates the interrelatedness of the factors, from which valuable insights can be drawn.
ISM comprises two preliminary steps and six core steps. The preliminary steps serve a dual purpose, namely: to isolate the phenomenon under investigation and decompose it into its elementary factors; and to establish a pairwise relationship amongst these factors. The six core steps are:
Formulating a structural self-interaction matrix (SSIM). The SSIM is a consensual view of the pairwise relationship amongst all factors as determined in the preliminary steps. This view is described using four symbols: V, A, X and O.
Developing a reachability matrix (RM). The RM is developed iteratively from the SSIM by following a set of rules that inform the conversion of the SSIM symbols into binary values. It is also in this step that the driving power and dependence power values of each factor are computed to serve as input to the final step.
Deriving level partitions. In this step, the final RM is utilised in an iterative process to derive the various levels into which the factors should be partitioned. These levels are an essential component for devising the final structural model.
Drawing a relationship graph. This step entails drawing a directed graph (digraph) that represents a binary relation amongst the factors.
Generating a structural model. From the preceding step, the digraph is transformed into a hierarchical model informed by the levels derived in the third step. This model is assessed for any conceptual inconsistencies, which are systematically eliminated if they exist.
Classifying factors. Through MICMAC (matrice d'impacts croisés-multiplication appliquée à un classement or cross impact matrix-multiplication applied to classification) analysis (Duperrin and Godet Citation1973; Godet Citation1986), the factors are classified as a quadrant chart into four different categories using the driving power and dependence power values extracted from the RM.
3.2. Model development
The aim of this research was twofold – to identify influential resilience factors to build into a smart mobility system and to establish how the identified resilience factors relate to one another in a smart mobility system. Thus, the ISM approach was adopted to help visualise the interrelatedness of these factors that collectively describe the embedding of resilience in smart mobility, represent this visualisation as a multilevel model, and systematically classify these factors according to their driving power and dependence power.
3.2.1. Identify elementary factors
There are several ways in which to decompose a phenomenon into its constituent factors in ISM. These include conducting focus group discussions with domain experts (Singh, Gupta, and Gunasekaran Citation2018; Gholami et al. Citation2020), leaning on academic expertise, conducting literature reviews, and drawing insights from industry experts (Raj, Shankar, and Suhaib Citation2008; Azevedo, Carvalho, and Cruz-Machado Citation2013; Janssen et al. Citation2018). In this study, the factors were elicited through an extensive literature review by academics and domain experts. The next step established pairwise relationships amongst the factors.
3.2.2. Establishing a pairwise relationship amongst factors
Consistent with the scarcity of experts in intelligent transport systems, five experts (three senior industry experts and two senior academics, both with extensive industry experience) were purposively selected because of their seniority, experience, and involvement in the domains central to smart mobility – Transport and Logistics or Smart Cities (see Table ). The two senior academics have been immersed in the transport sector as former professionals, consultants and advisers for more than twenty years each. Similar to other researchers using ISM in transport, logistics and supply chain (Diabat, Govindan, and Panicker Citation2012; Marodin and Abreu Saurin Citation2015; Ghobakhloo Citation2020; Rathore, Thakkar, and Jha Citation2021), Yousefi and Tosarkani (Citation2022) utilised five experts for their transport study that uses ISM.
Table 1. Respondent demographic profile.
The university hosting the academics granted all the necessary ethics approvals. All respondents gave informed consent prior to their participation in this research. During each session, data were collected through a semi-structured questionnaire carefully designed to solicit each pairwise relationship amongst all factors and supplemented by individual researcher notes. This individualised approach was essential ‘to avoid possible influence of one expert on another’ (Azevedo, Carvalho, and Cruz-Machado Citation2013, 216). The data collected were analysed, synthesised, and served as input to the subsequent 2 steps in which an SSIM was formulated and an RM was developed. The final RM was validated with the experts.
3.2.3. Formulating a structural self-interaction matrix
An SSIM is the core construct of the ISM approach, which seeks to represent the pairwise relationship amongst all factors underpinning the phenomenon under investigation as uncovered in the previous step (Sushil Citation2012). When formulating an SSIM, the relationship between each pair of factors (i, j) is represented by one of the following four symbols: V, A, X, and O. Each symbol is a mutually exclusive representation of the relationship for the pair. Collectively, these symbols are exhaustive. These symbols can be interpreted in the following manner:
V – factor i will influence factor j;
A – factor j will influence factor i;
X – factor i will influence factor j AND factor j will influence factor i; and
O – factor i will NOT influence factor j AND factor j will NOT influence factor i.
Table presents the SSIM from the data that were collected from the participant experts. According to the collective view of the participants, factor 2 (adaptability) will influence factor 4 (vulnerability) in the context of embedding resilience in smart mobility, and this relationship is presented by the symbol A at position (2, 4) in Table . Similarly, neither factor 3 (foresight) nor factor 5 (cohesion) will influence each other in the context of embedding resilience in smart mobility, hence the symbol O at position (3, 5) in Table . There will always be a tautological relationship between each factor with itself, hence the symbol X for all positions (i, j; where i = j).
Table 2. Structural self-interaction matrix.
A complete SSIM leads to the consequent step of developing an RM, a process which is explained further in the next subsection.
3.2.4. Developing a reachability matrix
An RM is a representation of the binary relationship between factors i and j. It is derived from the SSIM by following specific rules to interpret and convert symbols V, A, X, and O. These conversion rules are as follows for each symbol:
V – if entry (i, j) in the SSIM contains the symbol V, then in the RM, entry (i, j) must become 1 and entry (j, i) must become 0;
A – if entry (i, j) in the SSIM contains the symbol A, then in the RM, entry (i, j) must become 0 and entry (j, i) must become 1;
X – if entry (i, j) in the SSIM contains the symbol X, then in the RM, entry (i, j) must become 1 and entry (j, i) must become 1; and
O – if entry (i, j) in the SSIM contains the symbol O, then in the RM, entry (i, j) must become 0 and entry (j, i) must become 0.
Applying these rules to the SSIM depicted in Table results in the initial RM shown in Table . This initial RM iteratively undergoes further transformation by incorporating the mathematical transitivity concept (i.e. if factor i influences factor j, and factor j influences factor k, then factor i influences factor k) present amongst the factors. A total of 24 transitive relationships were identified from the initial RM. Table shows the final RM with transitive links denoted as 1* entries.
Table 3. Initial reachability matrix developed from the structural self-interaction matrix.
Table 4. Final reachability matrix incorporating transitivity (with driving and dependence power).
Developing the final RM also introduces two necessary measures for each factor, that is, driving power and dependence power. The driving power is the row sum of the values in the final RM and contextually denotes the total number of factors it influences (including itself). The dependence power is the column sum of the values in the final RM and contextually denotes the total number of factors that influence it (including itself). These two measures are an essential input into the final step of the ISM process, wherein all factors are classified. The final RM is also instrumental in deriving partition levels, which inform the build of the final structural model.
3.2.5. Deriving level partitions
Deriving partition levels is iterative and finite. It starts with constructing two sets for each factor and iteration, the reachability set and the antecedent set. The intersection between these two sets results in a third set called the intersection set (Warfield Citation1974; Sage Citation1977). The reachability set contains all those factors that are influenced by the current factor, including the current factor itself. For instance, from the final RM, factor 4 (vulnerability) influences factors 1, 2, 4, 5, 6, 7, 8 and 9, and these factors thus become the reachability set for factor 4, as indicated in Table . The antecedent set contains all those factors that influence the current factor, including itself. For instance, from the final RM, factor 4 (vulnerability) is influenced by factors 1, 2, 3, 4, 6, 7, and 9; thus, these factors become the antecedent set for factor 4, as indicated in Table . Performing a set intersection between these factor 4 sets derives the intersection set, which is noted in Table as containing only those common to both sets, namely factors 1, 2, 4, 6, 7 and 9.
Table 5. Deriving level partitions from the final reachability matrix (Iteration I).
Once all three sets are constructed and computed for each factor, the final step in each iteration involves comparing the intersection and reachability sets. For those factors where these two sets are the same, their partition level is indicated as being the same; for instance, factors 1 (flexibility), 5 (cohesion), 6 (efficiency) and 7 (diversity) in Table are both at partition level I – the topmost level partition. With reference to embedding resilience in smart mobility, this means that, amongst all the factors considered, flexibility, cohesion, efficiency and diversity are the least likely to influence any of the other factors.
Subsequent iterations in this process begin by first eliminating all those factors that are already partitioned into levels, and thereafter comparing the intersection and reachability sets for each factor to arrive at the next level partition clustering. Tables illustrate the respective second, third and fourth (final) iterations for deriving level partitions in the context of embedding resilience in smart mobility.
Table 6. Deriving level partitions from the final reachability matrix (Iteration II).
Table 7. Deriving level partitions from the final reachability matrix (Iteration III).
Table 8. Deriving level partitions from the final reachability matrix (Iteration IV).
The process is complete when all the factors have been eliminated and partitioned into various levels. The last iteration derives the base level partition and allows the relationship graph to be generated; this is explained further in the next section.
3.2.6. Drawing a relationship graph
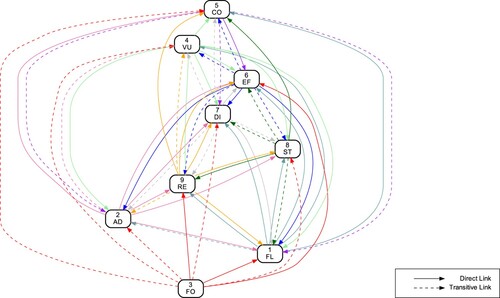
The relationship graph, which consists of nodes and directed edges, depicts the pairwise relationship between all the factors. Each node represents the factors, while the directed edges represent the relationship between a pair of factors as derived from the final RM. The first step when drawing this relationship graph is to draw the nodes. The next step is to incorporate the edges using the information contained in the final RM. When drawing the edges, if factor i influences factor j (i.e. there is a 1 or 1* at entry (i, j) in the final RM), an edge with an arrow is drawn from the node representing factor i to the node representing factor j. This process is repeated until all the pairs in the final RM have been processed. This interim representation of the final structural model is called a directed graph (or digraph). Figure shows a complete relationship graph in which direct relations are presented as solid arcs and transitive relations are presented as dashed arcs. This digraph aids the creation of the final structural model.
Figure 2. Relationship graph (digraph) showing interrelation between all factors (including transitive links).
3.2.7. Generating a structural model
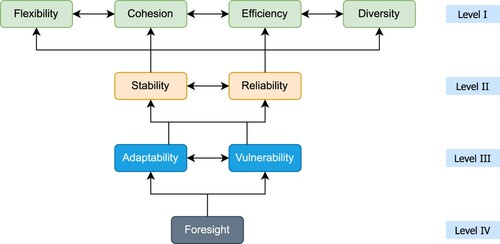
The final structural model is generated from the relationship graph by first incorporating the level partitions earlier derived, then systematically eliminating any contextually irrelevant interrelations between factors, and finally replacing the nodes with contextual terms or phrases. This model, as shown in Figure , is the final and succinct artefact describing the phenomenon under study and further reveals insights into the extant relationships amongst the factors. When it comes to embedding resilience in smart mobility, foresight – the bottommost factor – is the most significant factor for driving and embedding resilience in smart mobility. Conversely, flexibility, cohesion, efficiency and diversity – the topmost factors – primarily reflect the optimisation characteristics of a resilient smart mobility ecosystem.
Figure 3. Final structural model.
3.2.8. Classifying factors
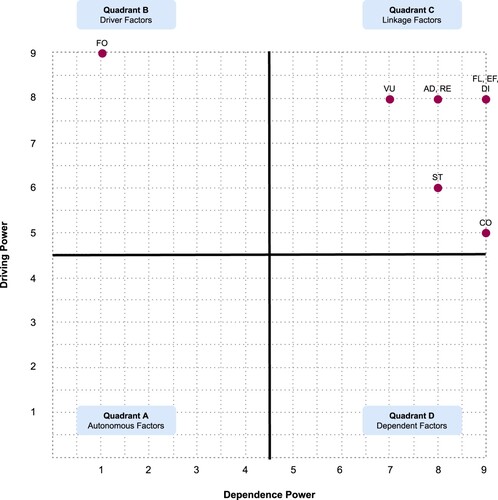
The final step in the ISM approach is to use the MICMAC analysis to classify the factors into four different categories based on the driving power and dependence power values. This classification is presented as a quadrant chart in which the driving power values are on the vertical axis and the dependence power values are on the horizontal axis. The quadrants are formed by drawing a solid horizontal line at the midpoint of the vertical axis and a solid vertical line at the midpoint of the horizontal axis. Since there are 9 factors, the midpoint is at value 4.5 for both axes. Factors appearing at the bottom-left of the quadrant chart are autonomous factors. This means that these factors are relatively independent, with little driving power and dependence power. The top-left quadrant contains driver factors. These factors possess a lot of driving power but with relatively weak dependence power, implying that they are rarely influenced by other factors. The top-right quadrant contains linkage factors, which are strong in both the driving power and dependence power. Azevedo, Carvalho, and Cruz-Machado (Citation2013, 222) caution that “action on these [factors] will have an effect on the other [factors] and also a feedback effect on themselves”. The final category of factors is the dependent category, which is located at the bottom-right of the quadrant chart. Dependent factors are those factors which have a strong potential to be influenced by many other factors while their influence on other factors is somewhat limited.
As for embedding resilience in smart mobility, the final RM informs that factor 8 (stability) has a driving power of 6 and a dependence power of 8. Thus, ST is plotted at position (8, 6) of the MICMAC analysis quadrant chart as depicted in Figure . Similarly, factors 2 (adaptability) and 9 (reliability) are plotted as AD and RE at position (8, 8) of the MICMAC analysis quadrant chart. Figure further depicts that all but one factor fall into the third category (linkage factors). This interesting finding is discussed further in the next section.
Figure 4. MICMAC analysis quadrant chart.
4. Discussion
The study sought to: (1) identify influential resilience factors to build into a smart mobility system in an emerging economy; and (2) develop an interpretive structural model hierarchy for the factors influencing resilience in such a smart mobility system. The study is amongst the few that have sought to develop a resilient smart mobility solution from an emerging economy perspective with clearly ranked resilience factors from which policymakers can choose. This is important since decision-makers in emerging economies often have the complex challenge of choosing between competing demands for limited resources.
The resultant ISM model indicates that the resilience factors are partitioned into four distinct levels, namely: policy/intelligence, dynamism, certainty and optimisation.
4.1. Policy and intelligence – level IV
Foresight was the only factor at Level IV, thus emerging as a foundational factor for building resilience into smart mobility systems in emerging economies. Being a driver factor means it is minimally influenced by other factors. The finding reveals that government agencies should enact supportive laws and policies that will foster a culture that anticipates disruptions as part of long-term planning. Policy is equivalent to leveraging human intelligence to anticipate disruptions. The alternative intelligence is artificial, wherein advanced technologies such as AI can be used to anticipate disruptions. The deployment of advanced technologies to enhance foresight is strategic and supports Jain et al. (Citation2017), who argued that organisations can promote supply chain resilience by modifying their strategic assets. Similarly, Narassima et al. (Citation2022) claimed that preparedness is an important driver of resilience. In transport, Auvinen, Tuominen, and Ahlqvist (Citation2012) assert that foresight is essential to building resilience into a transportation system to meet societal needs. By implication, for a smart mobility system to be successful and resilient, human and artificial intelligence should be mutually existent to assure that the rest of the system can function effectively. Thus, embedding foresight in a smart mobility solution creates a proactive dynamic capability.
4.2. Dynamism – level III
The Level III factors, vulnerability and adaptability, were interpreted as the dynamic layer. Emerging cities are characterised by many modes of transport, some of which are dysfunctional (vulnerability), resulting in long travel times at a high cost with huge safety and security risks. A resilient smart mobility solution should enable a quick identification of the sources of vulnerability within the transport system. Quick identification of vulnerabilities requires advanced technologies and laws that promote information sharing (Chowdhury and Quaddus Citation2017) as argued under Level IV. Thus, a smart mobility solution should enable changes to the functioning modes to quickly adapt to the likely higher demand owing to failure within some parts of the transport system, hence, a dynamic capability is built into the system. As such, a resilient transport system should anticipate vulnerability and proactively develop an adaptable smart mobility system. This is contrary to Zhang, Jia, and You (Citation2021) who argued that vulnerability is an opposition to resilience. On the other hand, Mattsson and Jenelius (Citation2015) and Rodríguez-Núñez and Carlos García-Palomares (Citation2014) found that identifying and measuring vulnerability was essential to building resilience in transport.
4.3. Certainty – level II
Level II factors, stability and recoverability, are interpreted as certainty factors. Many cities within emerging economies are subject to high levels of disruptions. Some of the disruptions are due to social factors such as protests and strikes and rapid urbanisation causing congestion. Others relate to infrastructure failure or natural phenomena such as climate change related disasters such as heavy storms. Disruptions tend to have severe impacts, significantly reducing mobility across the city. Smart mobility systems require that the transport service can recover quickly from disruptions and achieve a state of stability. The finding supports Jain et al. (Citation2017) who argued that a resilient system should recover quickly to a stable state to improve its performance. Where a system fails to recover quickly, there is a likelihood of customers, in this case transport users, experiencing a complete service failure.
4.4. Optimisation – level I
Level I factors, flexibility, cohesion, efficiency (acceptable cost levels) and diversity were interpreted as optimisation factors since they reveal an ideal transport system with a variety of modal offerings for users to choose from. Flexibility helps to create agility in a system regarding responding to dynamic customer requirements especially when there is a disruption, thus, resulting in an optimised system as also claimed by Dolgui, Ivanov, and Sokolov (Citation2018). The current finding extends on this claim by arguing that an ideal or agile smart mobility system should also be cohesive, efficient and diverse in its offering. Thus, Level I factors can only be achieved once the right laws and policies are in place, an acceptable level of dynamism is built in the system to overcome vulnerability and promote adaptability, and certainty is created in the system by achieving high recoverability and stability in the provision of mobility services within emerging cities.
4.5. Resilient smart mobility in emerging economies
The current study contributes by developing a four-level hierarchical model for identifying influential factors of a resilient transport system and showing their interrelationships. The model informs city authorities to develop policies and mechanisms that promote smart mobility related solutions to overcome transport disruptions. In addition, the policies and mechanisms (technological and otherwise) should allow for a cohesive transport system that integrates all the modes so as to optimise transport costs through improved efficiencies, while giving users a variety of modal choices to cater for their diversified transport needs.
Further, this study identifies the important resilience factors in a smart mobility solution based on their driving and dependence powers. Foresight is the only factor that falls within Quadrant B (comprising driver factors) of the MICMAC analysis chart. This implies that foresight has high driving power and low dependence power, and thus plays a key role in developing resilience in smart mobility transport systems. This ties well with the four-level hierarchical model, whereby foresight was identified as the fundamental factor when building a resilient smart mobility solution, thus, developing a proactive dynamic capability through preparedness (Narassima et al. Citation2022). Therefore, assets such as advanced technologies should be deployed strategically, and supportive should be laws enacted to accurately predict future scenarios and prepare adequately.
The remainder of the factors are all clustered in Quadrant C (comprising linkage factors) of the MICMAC analysis chart. This implies that each of the factors in this quadrant both influences and depends on all the other factors within the model. As a result, policymakers need to leverage smart mobility systems such as IoT, big data analytics, and mobile technologies to build highly resilient transport systems that consider all the identified factors and the relationships amongst them. Such a resilient transport system is likely to be sufficiently robust to provide seamless mobility for city commuters, as well as for supply chain deliveries that are on the rise due to the massive growth in online shopping in emerging economies.
The results also reveal the complexities that cities in emerging economies constantly deal with and point to the importance of drawing on dynamic capabilities theory. ISM, therefore, allowed these complexities to be simplified and ordered so that policy and decision-makers can decide on what is most critical, given the limited resources. For the CoJ, foresight is quite essential and should be the cornerstone resilience factor embedded in initial smart mobility solutions. The CoJ is generalisable to other cities in emerging economies as they face similar challenges of urban sprawl, a growing migrant population and extreme pressure on limited public resources.
The results also imply that a dynamic capability can be developed when a smart mobility solution incorporates the identified resilience factors. The smart mobility solution forms a dynamic capability that will help emerging cities to reduce travel time by overcoming mobility disruptions occasioned by modal fragmentation, and infrastructural failures. Therefore, this study supports the dynamic capabilities theory by arguing that each emerging city should establish the critical resilience factors and embed them in a smart mobility solution to develop a unique dynamic capability based on its prevailing environmental situation.
The current study was limited to the ISM results, which have not yet been statistically validated, despite being validated by experts in the field. Future studies can adopt total interpretive structural modelling (TISM) (Dubey, Gunasekaran, and Tripti Singh Citation2015; Sushil Citation2018, Citation2020), a survey design and structural equation modelling techniques to validate the resultant model using data from cities in emerging economies. Nevertheless, ISM enabled an initial model using expert opinions to visualise and establish the interrelationships among resilience factors.
5. Future research agenda
Policymakers will need to develop capacities and dynamic capabilities within the system that allow the system to expand and contract, as required, which can only be achieved with high levels of foresight regarding the formulation of legislation that supports long-term planning, analytics and intelligent predictions in a smart mobility environment. Similarly, policymakers should promote smart mobility solutions that are highly adaptable to overcome vulnerability, which is regarded as weakness in a transport system. Thus, a resilient smart mobility system should not only withstand disruptions through quick recovery to assure stability, but it should also fundamentally have the ability to anticipate disruptions caused by social, infrastructural, and natural phenomena and allow for the optimisation of user options.
The following represent a research agenda for smart mobility in emerging economies:
Policy and intelligence
How can policy enable the anticipation of disruptions?
How should artificial intelligence be used to anticipate natural and social disruptions?
Dynamism
How can dynamic capabilities be built into smart mobility systems to overcome vulnerabilities?
How can smart mobility systems anticipate the vulnerable areas, and offer alternatives to deal with them?
Certainty
What are acceptable levels of delay?
How can delays caused by disruptions be relayed to all affected parties automatically?
Optimisation
What is the nature of an ideal resilient smart mobility solution in terms of flexibility, cohesion, efficiency and diversity?
What are the different levels of optimisation required in unique emerging economy cities?
Design and method
How can advanced methodological approaches such as TISM be leveraged to develop and explain the interrelations of contextual factors for different emerging cities?
6. Conclusion
Cities in emerging economies can overcome mobility disruptions by building resilient transport systems. Such systems should be based on smart mobility. This requires the resilient transport system to be built with foresight in terms of long-term planning and predictions to anticipate failure and provide solutions. With foresight embedded in the smart mobility system, vulnerability can be minimised by making the system adaptable. Further, the system should be able to recover from any disruptions and attain stability in minimal time. Thus, city authorities should aim at an optimal resilient smart mobility solution in terms of being flexible, cohesive, efficient and diverse. The developed ISM model, using the MICMAC analysis, classifies eight of the nine resilience factors as linking factors, implying that any one of them affects and depends on the others. Foresight was classified as a driver factor. This implies that with its high driving power, it is the foundation of a smart mobility solution and should be the primary focus based on the city and country context. In addition, a truly resilient transport system in an emerging economy context that is based on smart mobility should consider all the linkage resilience factors, and the dynamic capabilities theory, with a principal focus on foresight.
Data availability statement
The data that support the findings of this study are available from the corresponding author, J. Mageto, upon reasonable request.
Disclosure statement
No potential conflict of interest was reported by the author(s).
Additional information
Funding
Notes on contributors

Joash Mageto
Joash Mageto holds a PhD in Logistics Management from the University of Johannesburg. He also holds a postgraduate diploma in Data Science and Business Analytics from the University of Texas (USA). He is a published author, a reviewer with five journals and regular participant in industry forums. He has over 10 years of research and university teaching in transport, logistics, operations, and supply chain management both locally and internationally. Research interests include public passenger transportation, smart mobility (public transport modal integration in South Africa), big data analytics, supply chain sustainability, logistics outsourcing, applications of AI technologies in transportation, logistics network planning and SCM, human machine interaction in logistics in the era of robotics and business process re-engineering. He has done commission research with passenger transport companies in SA, AMREF Africa, government agencies and JICA. He is currently a Senior Lecturer and Deputy HoD in the Department of Transport and Supply Chain Management at the University of Johannesburg.

Hossana Twinomurinzi
Hossana Twinomurinzi Professor with the Department of Applied Information Systems, University of Johannesburg. He is currently leading the efforts in the College of Business and Economics on infusing data science into research, teaching/learning and community efforts of the College. He is also an Associate Editor for the African Journal of Information and Communication, past Associate Editor at the African Journal of Information Systems, the Immediate Past Chairperson for the ICT4D Flagship at University of South Africa, and immediate Past Secretary for SAICSIT. His primary research interests are in Applied Data Science, Digital Skills, Digital Government, Digital Innovation and ICT for development. He has supervised 15+ Masters and Doctoral students in the areas of data analytics, digital government and ICT for development. He serves on the editorial boards of a number of academic publications and has served as a convener and technical chair on several international and national conferences. He has led national research projects of ICT and done contract research in various sectors ranging from the military, government, non-profit organisations and banking. He has management and executive experience having served in chief executive and senior management positions in South Africa, England, Swaziland and Uganda. He is a professional facilitator and is involved in a number of social enterprise activities. Rose Luke

Rose Luke
Rose Luke is an associate professor and deputy head of department (research) in the Department of Transport and Supply Chain Management at the University of Johannesburg, as well as being a researcher in the Institute of Transport and Logistics Studies (Africa). She holds BCom Hons (University of Stellenboch), MCom (Rand Afrikaans University) and DCom (University of Johannesburg) degrees in transport economics. She has led 20 Masters and Doctoral students in the fields of transport economics, is an associate editor of the Journal of Transport and Supply Chain Management, and a regular reviewer for numerous local and international transport and supply chain journals. She consults and reviews in the field of transport and supply chain for firms, research foundations and NGOs. Prior to joining academia, she held management positions in logistics companies and management consultancies.

Siyabonga Mhlongo
Siyabonga Mhlongo is a Lecturer in the Department of Applied Information Systems and one of the founding members of the Centre for Applied Data Science at the University of Johannesburg. He holds a Masters degree in Computer Science from the University of Cape Town and is currently pursuing a doctoral qualification at the University of the Witwatersrand, specialising in Educational Information Technology. His primary interests are in information and communication technology for development (ICT4D), applications of data science across disciplines, educating for the fourth industrial revolution (4IR) and the symbiotic relationship between education and technology in the classroom, primarily at a high school level. He is a member of the Institute of Information Technology Professionals South Africa (IITPSA), the Institute for Electrical and Electronics Engineers (IEEE) Education Society and the Association for Information Systems (AIS) amongst other professional organisations. He has 15 years of combined experience spanning telecommunications, investment banking, consulting, and academic industries.

Kelvin Bwalya
Kelvin Bwalya is a full professor in the School of Consumer Intelligence and Information Systems, University of Johannesburg (UJ). He is a rated scholar by the South African National Research Foundation and vice chairperson of the UJ Senate Academic Freedom Committee, a Fellow of the International Engineering and Technology Institute (Hong Kong), and a member of the Board of Directors for the Institute of Data Science and Artificial Intelligence (Singapore). Kelvin is a visiting professor in three different universities: Rajamangla University of Technology, Sri Lanka; Alagappa University, India; and the Information and Communications University, Zambia. He has supervised 6 PhDs to completion and significant number of Masters students. He has a PhD in Information Management (University of Johannesburg), Masters in Computer Science (Korea Advanced Institute of Science and Technology – KAIST), and Bachelor's in Electrical Electronics Engineering (Moscow PE Technical University). He has worked as a Senior Windows Programming Researcher at Samsung Electronics (Taejon, South Korea) specialising in Digital Image Processing and MPEG 7/21 Digital Media Adaption. Kelvin has delivered numerous keynote speeches at reputable international conferences. He has a Google scholar H-Index of 20 (1885 citations) and a Scopus H index of 10 with a field-weighted citation index of 1.65 (65% more than the world average).

Stella Bvuma
Stella Bvuma is the HoD in the Department of Applied Information Systems (AIS) UJ. She holds several qualifications in the field of Information Technology and attained her PhD in Information Technology Management. She has a driven robust passion in the area of ICT4Development & technology adoption in particular areas such as ICT as an enabler for business growth and sustainability, digital technology for inclusivity, and the digital economy. Her research focuses on ICT adoption by SMMEs towards growth, sustainability, and development. She also serve/d on various boards such as the State Information Technology Agency (SITA) as Deputy Chair of the Board, an advisory board on digitisation and digitalisation, and served: City of Johannesburg Group Advisory Committee – Smart City/4IR. South Africa amongst others. Dr. Bvuma holds a personal interest towards building an inclusive digital economy.
References
- Alexopoulos, Kosmas, Ioannis Anagiannis, Nikolaos Nikolakis, and George Chryssolouris. 2022. “A Quantitative Approach to Resilience in Manufacturing Systems.” International Journal of Production Research: 1–16. doi:10.1080/00207543.2021.2018519.
- Amović, Mladen, Miro Govedarica, Aleksandra Radulović, and Ivana Janković. 2021. “Big Data in Smart City: Management Challenges.” Applied Sciences 11 (10): 4557.
- Attri, Rajesh, Nikhil Dev, and Vivek Sharma. 2013. “Interpretive Structural Modelling (ISM) Approach: An Overview.” Research Journal of Management Sciences 2 (2): 3–8. http://www.isca.in/IJMS/Archive/v2/i2/2.ISCA-RJMS-2012-054.php.
- Auvinen, Heidi, Anu Tuominen, and Toni Ahlqvist. 2012. “Towards Long-term Foresight for Transport: Envisioning the Finnish Transport System in 2100.” Foresight (Los Angeles, Calif.) 14 (3): 191–206.
- Azevedo, Susana, Helena Carvalho, and V. Cruz-Machado. 2013. “Using Interpretive Structural Modelling to Identify and Rank Performance Measures.” Baltic Journal of Management 8 (2): 208–230.
- Balakrishna, Chitra. September, 2012. “Enabling Technologies for Smart City Services and Applications.” In 2012 Sixth International Conference on Next Generation Mobile Applications, Services and Technologies, 223–227. Paris, France: IEEE.
- Bhamra, Ran, Samir Dani, and Kevin Burnard. 2011. “Resilience: The Concept, a Literature Review and Future Directions.” International Journal of Production Research 49 (18): 5375–5393.
- BusinessTech. March, 2016. “All You Need to Know About Joburg's Traffic Light Mess.” Online, Accessed 30 May 2022. https://businesstech.co.za/news/lifestyle/118192/all-you-need-to-know-about-joburgs-traffic-light-mess/.
- BusinessTech. March, 2020. “Mass Migration to Johannesburg and Pretoria – Here's How Many South Africans are Moving.” Online, Accessed 30 May 2022. https://businesstech.co.za/news/property/379407/mass-migration-to-johannesburg-and-pretoria-heres-how-many-south-africans-are-moving/.
- Cebecauer, Matej, Wilco Burghout, Erik Jenelius, Tatiana Babicheva, and David Leffler. 2021. “Integrating Demand Responsive Services into Public Transport Disruption Management.” IEEE Open Journal of Intelligent Transportation Systems 2: 24–36.
- Chowdhury, Md Maruf H., and Mohammed Quaddus. 2017. “Supply Chain Resilience: Conceptualization and Scale Development Using Dynamic Capability Theory.” International Journal of Production Economics 188: 185–204.
- Chwiłkowska-Kubala, Anna. 2021. “What are the Sources of Regional Airport Economic Effectiveness? The Dynamic Capabilities Perspective with Evidence from Poland.” Journal of Air Transport Management 92: 102024.
- Cledou, Guillermina, Elsa Estevez, and Luis Soares Barbosa. 2018. “A Taxonomy for Planning and Designing Smart Mobility Services.” Government Information Quarterly 35 (1): 61–76.
- Diabat, Ali, Kannan Govindan, and Vinay V. Panicker. 2012. “Supply Chain Risk Management and Its Mitigation in a Food Industry.” International Journal of Production Research 50 (11): 3039–3050.
- Dixon, Simon, Haris Irshad, Derek M. Pankratz, and Justine Bornstein. 2018. “Gauging Global Readiness for the Future of Mobility.” Deloitte City Mobility Index (DCMI). Deloitte Insights. https://www2.deloitte.com/content/dam/Deloitte/za/Documents/Consumer_Industrial_Products/ZA_Deloitte_Global_Mobility_Index_October_2018.pdf.
- Dolgui, Alexandre, and Dmitry Ivanov. 2021a. “5G in Digital Supply Chain and Operations Management: Fostering Flexibility, End-to-End Connectivity and Real-Time Visibility Through Internet-of-Everything.” International Journal of Production Research 60 (2): 442–451.
- Dolgui, Alexandre, and Dmitry Ivanov. 2021b. “Ripple Effect and Supply Chain Disruption Management: New Trends and Research Directions.” International Journal of Production Research 59 (1): 102–109.
- Dolgui, Alexandre, Dmitry Ivanov, and Boris Sokolov. 2018. “Ripple Effect in the Supply Chain: An Analysis and Recent Literature.” International Journal of Production Research 56 (1-2): 414–430.
- Dubey, Rameshwar, Angappa Gunasekaran, and Sushil Tripti Singh. 2015. “Building Theory of Sustainable Manufacturing Using Total Interpretive Structural Modelling.” International Journal of Systems Science: Operations & Logistics 2 (4): 231–247.
- Duperrin, J. C., and Michel Godet. 1973. “Méthode de Hiérarchisation des éléments d'un système, Rapport economique du CEA.” Technical Report. R-45-41, Paris.
- Enjalbert, Simon, Suzana Kahn Ribeiro, and Frédéric Vanderhaegen. 2020. “Concepts and Models about Smart Urban Transport Control Systems for City Resilience.” IFAC-PapersOnLine 53 (2): 10090–10095.
- FastCo Works. January, 2020. “What's Driving Disruption in Transportation?” Online, Accessed 30 May 2022, https://www.fastcompany.com/90450897/whats-driving-disruption-in-transportation.
- Fiksel, Joseph. 2015. “From Risk to Resilience.” In Resilient by Design, 19–34. Washington, DC: Island Press / Center for Resource Economics.
- Fiksel, Joseph. 2015. Resilient by Design. Washington, DC: Island Press / Center for Resource Economics.
- Ghobakhloo, Morteza. 2020. “Determinants of Information and Digital Technology Implementation for Smart Manufacturing.” International Journal of Production Research 58 (8): 2384–2405.
- Gholami, Hamed, Mohamad Faizal Bachok, Muhamad Zameri Mat Saman, Dalia Streimikiene, Safian Sharif, and Norhayati Zakuan. 2020. “An ISM Approach for the Barrier Analysis in Implementing Green Campus Operations: Towards Higher Education Sustainability.” Sustainability 12 (1): 363.
- Godet, Michel. 1986. “Introduction to la Prospective: Seven Key Ideas and One Scenario Method.” Futures 18 (2): 134–157. https://www.sciencedirect.com/science/article/pii/0016328786900947.
- Gunasekaran, Angappa, Nachiappan Subramanian, and Shams Rahman. 2015. “Supply Chain Resilience: Role of Complexities and Strategies.” International Journal of Production Research 53 (22): 6809–6819.
- Gürsoy, Serkan, and Murat Yücelen. 2017. “Can Big Data Analysis Make Cities Smarter? Emerging Issues and Stakeholder Implications in Smart Mobility.” European Journal of Economics and Business Studies 8 (1): 23–28.
- Hiroshima for Global Peace. 2014. “Learning from Hiroshima's Reconstruction Experience: Reborn from the Ashes.” Hiroshima Reconstruction and Peacebuilding Research Project. Hiroshima Prefecture and the City of Hiroshima. https://hiroshimaforpeace.com/en/wp-content/uploads/sites/2/2019/09/189227.pdf.
- Hosseini, Seyedmohsen, Kash Barker, and Jose E. Ramirez-Marquez. 2016. “A Review of Definitions and Measures of System Resilience.” Reliability Engineering & System Safety 145: 47–61.
- Jain, Vipul, Sameer Kumar, Umang Soni, and Charu Chandra. 2017. “Supply Chain Resilience: Model Development and Empirical Analysis.” International Journal of Production Research 55 (22): 6779–6800.
- Janssen, Marijn, Nripendra P. Rana, Emma L. Slade, and Yogesh K. Dwivedi. 2018. “Trustworthiness of Digital Government Services: Deriving a Comprehensive Theory Through Interpretive Structural Modelling.” Public Management Review 20 (5): 647–671.
- Kähkönen, Anni-Kaisa, Pietro Evangelista, Jukka Hallikas, Mika Immonen, and Katrina Lintukangas. 2021. “COVID-19 as a Trigger for Dynamic Capability Development and Supply Chain Resilience Improvement.” International Journal of Production Research: 1–20. doi:10.1080/00207543.2021.2009588.
- Labuschagne, F., E. De Beer, D. Roux, and K. Venter. July, 2017. “The Cost of Crashes in South Africa 2016.” In 36th Southern African Transport Conference (SATC 2017), 474–485. Pretoria, South Africa: Southern African Transport Conference.
- Lambourdiere, Eric, and Elsa Corbin. 2020. “Blockchain and Maritime Supply-Chain Performance: Dynamic Capabilities Perspective.” Worldwide Hospitality and Tourism Themes 12 (1): 24–34.
- Legal Information Institute, Cornell Law School. October, 2006. “6 U.S. Code § 901 – Definitions.” Online, Accessed 12 January 2022. https://www.law.cornell.edu/uscode/text/6/901.
- Linde, Lina, David Sjödin, Vinit Parida, and Joakim Wincent. 2021. “Dynamic Capabilities for Ecosystem Orchestration a Capability-Based Framework for Smart City Innovation Initiatives.” Technological Forecasting and Social Change 166: 120614.
- Louisot, Jean-Paul. 2015. “Risk and/or Resilience Management.” Risk Governance and Control: Financial Markets and Institutions 5 (2–1): 84–91.
- Mageto, Joash. 2021. “Big Data Analytics in Sustainable Supply Chain Management: A Focus on Manufacturing Supply Chains.” Sustainability 13 (13): 7101.
- Marodin, Giuliano Almeida, and Tarcisio Abreu Saurin. 2015. “Managing Barriers to Lean Production Implementation: Context Matters.” International Journal of Production Research 53 (13): 3947–3962.
- Mattsson, Lars-Göran, and Erik Jenelius. 2015. “Vulnerability and Resilience of Transport Systems – a Discussion of Recent Research.” Transportation Research Part A: Policy and Practice 81: 16–34.
- Namdar, Jafar, Jennifer Blackhurst, and Arash Azadegan. 2022. “On Synergistic Effects of Resilience Strategies: Developing a Layered Defense Approach.” International Journal of Production Research 60 (2): 661–685.
- Narassima, M. S., S. P. Anbuudayasankar, K. Mathiyazhagan, K. Ganesh, and Tzong-Ru (Jiun-Shen) Lee. 2022. “Supply Chain Resilience: Conceptual Model Building and Validation.” International Journal of Logistics Research and Applications: 1–33. doi:10.1080/13675567.2022.2056584.
- Owoseni, Adebowale, and Hossana Twinomurinzi. 2018. “Mobile Apps Usage and Dynamic Capabilities: A Structural Equation Model of SMEs in Lagos, Nigeria.” Telematics and Informatics 35 (7): 2067–2081.
- Paiva, Sara, Mohd Abdul Ahad, Gautami Tripathi, Noushaba Feroz, and Gabriella Casalino. 2021. “Enabling Technologies for Urban Smart Mobility: Recent Trends, Opportunities and Challenges.” Sensors 21 (6): 2143.
- Raj, T., R. Shankar, and M. Suhaib. 2008. “An ISM Approach for Modelling the Enablers of Flexible Manufacturing System: The Case for India.” International Journal of Production Research 46 (24): 6883–6912.
- Rathore, Rishabh, J. J. Thakkar, and J. K. Jha. 2021. “Impact of Risks in Foodgrains Transportation System: A System Dynamics Approach.” International Journal of Production Research 59 (6): 1814–1833.
- Rodríguez-Núñez, Eduardo, and Juan Carlos García-Palomares. 2014. “Measuring the Vulnerability of Public Transport Networks.” Journal of Transport Geography 35: 50–63.
- Rodrigue, Jean-Paul. 2020. The Geography of Transport Systems. 5th ed. London: Routledge.
- Sage, Andrew P. 1977. Methodology for Large-Scale Systems. New York: McGraw-Hill.
- Sazvar, Zeinab, Keivan Tafakkori, Nastaran Oladzad, and Sina Nayeri. 2021. “A Capacity Planning Approach for Sustainable-Resilient Supply Chain Network Design under Uncertainty: A Case Study of Vaccine Supply Chain.” Computers & Industrial Engineering 159: 107406.
- Šemanjski, Ivana, Sadko Mandžuka, and Sidharta Gautama. 2018. “Smart Mobility.” In 2018 International Symposium ELMAR, 63–66. Zadar, Croatia: IEEE.
- Sima, Alexandra Catalina, Mariacristina Roscia, Claudia Laurenta Popescu, Mihai Octavian Popescu, and Jacques Jansen. 2021. “Smart Mobility in Africa.” In Holistic Approach for Decision Making Towards Designing Smart Cities, edited by George Cristian Lazaroiu, Mariacristina Roscia, and Vasile Sebastian Dancu, Vol. 18 of Future City, 199–211. Cham, Switzerland: Springer International Publishing.
- Singh, Rajesh Kumar, Ayush Gupta, and Angappa Gunasekaran. 2018. “Analysing the Interaction of Factors for Resilient Humanitarian Supply Chain.” International Journal of Production Research 56 (21): 6809–6827.
- Staber, Udo, and Jörg Sydow. 2002. “Organizational Adaptive Capacity: A Structuration Perspective.” Journal of Management Inquiry 11 (4): 408–424.
- Stead, Dominic, and Dorina Pojani. 2017. “The Urban Transport Crisis in Emerging Economies: A Comparative Overview.” In The Urban Transport Crisis in Emerging Economies, edited by Dorina Pojani and Dominic Stead, 283–295. Cham, Switzerland: Springer International Publishing.
- Sushil, S. 2012. “Interpreting the Interpretive Structural Model.” Global Journal of Flexible Systems Management 13 (2): 87–106.
- Sushil, S. 2018. “How to Check Correctness of Total Interpretive Structural Models?” Annals of Operations Research 270 (1-2): 473–487.
- Sushil, S. 2020. “Interpretive Multi-Criteria Ranking of Production Systems with Ordinal Weights and Transitive Dominance Relationships.” Annals of Operations Research 290 (1-2): 677–695.
- Walsham, G. 1995. “Interpretive Case Studies in IS Research: Nature and Method.” European Journal of Information Systems 4 (2): 74–81.
- Wang, Catherine L., and Pervaiz K. Ahmed. 2007. “Dynamic Capabilities: A Review and Research Agenda.” International Journal of Management Reviews 9 (1): 31–51.
- Warfield, John N. 1973. “Binary Matrices in System Modeling.” IEEE Transactions on Systems, Man, and Cybernetics 5: 441–449.
- Warfield, John N. 1974. “Developing Interconnection Matrices in Structural Modeling.” IEEE Transactions on Systems, Man, and Cybernetics 1: 81–87.
- Warfield, John N. 1976. Societal Systems: Planning, Policy, and Complexity. New York: Wiley-InterScience.
- Yap, Menno, and Oded Cats. 2021. “Predicting Disruptions and Their Passenger Delay Impacts for Public Transport Stops.” Transportation 48: 1703–1731.
- Yılmaz Börekçi, Dilek, Yasin Rofcanin, and Hasan Gürbüz. 2015. “Organisational Resilience and Relational Dynamics in Triadic Networks: A Multiple Case Analysis.” International Journal of Production Research 53 (22): 6839–6867.
- Yousefi, Samuel, and Babak Mohamadpour Tosarkani. 2022. “An Analytical Approach for Evaluating the Impact of Blockchain Technology on Sustainable Supply Chain Performance.” International Journal of Production Economics 246: 108429.
- Zan, Thaw Tar Thein, Lounell Bahoy Gueta, and Toshio Okochi. December, 2015. “Enabling Technology for Smart City Transportation in Developing Countries.” In 2015 IEEE International Conference on Smart City/SocialCom/SustainCom (SmartCity), edited by Xingang Liu, Robert Hsu, Peicheng Wang, Feng Xia, Yufeng Wang, Mianxiong Dong, and Yuhui Deng, 170–174. Chengdu, China: IEEE.
- Zhang, Hao, Fu Jia, and Jian-Xin You. 2021. “Striking a Balance Between Supply Chain Resilience and Supply Chain Vulnerability in the Cross-Border E-Commerce Supply Chain.” International Journal of Logistics Research and Applications: 1–25. doi:10.1080/13675567.2021.1948978.