
 ?Mathematical formulae have been encoded as MathML and are displayed in this HTML version using MathJax in order to improve their display. Uncheck the box to turn MathJax off. This feature requires Javascript. Click on a formula to zoom.
ABSTRACT
The financial implications of the worldwide COVID-19 pandemic and the effective mitigation of the negative effects are the subject of an ongoing debate. We aim to empirically substantiate this debate. Based on a sample of 4,032 publicly traded U.S. and Chinese firms, we conduct an event study and find that the COVID-19 pandemic is associated with a substantial decrease in shareholder value, significantly varying between U.S. and Chinese firms and across industries. We further identify structure- and supply chain-related firm factors that mitigate the negative impact. Specifically, we find that smaller firms experience a less negative impact on shareholder value, challenging established findings. Our results also suggest that a lower dependence on physical assets, a shorter trade cycle, and a higher degree of vertical integration attenuate the negative impact on shareholder value. Our findings provide important insights for managers and policymakers. We recommend managers to reduce the dependency on business models that strongly rely on physical assets, to streamline trade cycles, and to reduce supply chain complexity. From a policy perspective, we emphasise the importance of more industry-specific granularity of public support measures.
1. Introduction
In late December 2019, a novel coronavirus (COVID-19) emerged and quickly spread across Asia, Europe, and America. On March 11, 2020, the World Health Organization (WHO) declared COVID-19 a pandemic. The following healthcare emergency counts more than 550 million COVID-19 infection cases and about 6 million deaths worldwide, as of July 2022.Footnote1 Given the public health risk associated with the spread of the disease through individual human mobility, governments across the globe have imposed different measures, including restrictions on social gatherings, travel, and commerce (Ivanov Citation2021; WHO Citation2020). The resulting ad-hoc policies substantially affect firm operations and the general flow of goods and services along the supply chain (Choi Citation2021; Ivanov and Dolgui Citation2020; Ketchen and Craighead Citation2020). According to 2020 industry reports, 94% of the Fortune 1000 firms were facing substantial supply chain disruptions (Shen and Sun Citation2022; Sherman Citation2020).
The COVID-19 pandemic presented firms with an unexpected exogenous shock. Especially during the ‘first wave’ in 2020, the COVID-19 pandemic has evoked substantial financial consequences for firms (Singh et al. Citation2021; Ketchen and Craighead Citation2020). In March 2020, for example, Poland closed its borders, creating a bottleneck for the flow of supplies along Europe's key east-west transportation axis. Truck queues of more than 20 miles illustrated the delays at the border to Germany and symbolise the substantial economic impact (Shotter, Milne, and Fleming Citation2020).
In the U.S., new vehicle sales, for instance, declined by about in 2020 (Wayland Citation2020). The unexpected massive drop in demand forced General Motors, Ford, and Fiat Chrysler to all temporarily shut down several U.S. factories (LeBeau and Higgins-Dunn Citation2020). Ford reported an operating loss of $1.9 billion in the second quarter of 2020 (Colias and Bender Citation2020). The global agriculture sector presents another illustrative example, where border closures and labour shortages entailed massive food supply fluctuations that propagated across global supply chains (Ali et al. Citation2022). In contrast, some firms reported surging revenues, as demands were also rising unexpectedly. During times of social distancing and lock-downs, home fitness equipment sales, for instance, grew by 170% (Wood Citation2020). Peloton Interactive, one major manufacturer of exercise bikes, was struggling to adjust its production to meet demand. However, the firm reported $757.9 million in revenue in the third quarter of 2020, more than triple compared to 2019 (Chin and Needleman Citation2020).
To mitigate the effects of the COVID-19 pandemic, firms adjusted supply chain structures and processes (Ivanov Citation2021; Ateş et al. Citation2022; Raj et al. Citation2022). During the early stages of the COVID-19 pandemic, firms explored the role of short-term cash and trade cycles to overcome the associated uncertainty (Broughton Citation2021; Francis and Gryta Citation2020). In April 2020, the UK fashion retailer New Look delayed payments to suppliers and shortened payment terms to generate cash and ensure survival (BBC Citation2020b). In contrast, TK Maxx, for example, extended supplier payment terms by 90 days to improve supplier relationships and mitigate associated supplier default risks (Gault Citation2020). The COVID-19 pandemic exposed several weaknesses in global supply chains, and has started a re-shoring trend, reducing global dependencies (Raj et al. Citation2022; Giannoccaro and Iftikhar Citation2022). According to a survey conducted in late April 2020 by McLaughlin and Associates, 59% of the U.S. respondents indicated re-shoring considerations, for example a strategic withdrawal of manufacturing from China (Rapoza Citation2020).
Policy makers are faced with the challenge of understanding the structural impact of the COVID-19 pandemic, to adapt regulations and support programmes (Freund Citation2021). Firms in typically knowledge-intensive industries and with digital processes in place are able to adjust quickly and maintain or even improve productivity (Ovide Citation2021; Ivanov, Dolgui, and Sokolov Citation2019). On the other hand, firms relying on physical factories, stores and equipment are less flexible to navigate strict regulations, including safety precautions, lock-downs and work-from-home orders. For example, in February 2020, the Taiwanese electronics supplier Foxconn announced the temporary closure of its Shenzhen plant, mandated by the authorities to contain the spread of the virus. After weeks of production halt, Foxconn pushed for permission to resume operations, compliant with respective COVID-19 policies, including regular temperature checks and surgical mask equipment for thousands of workers (BBC Citation2020a). These measures created substantial direct costs for the firm. Compared to the previous year, Foxconn reported a 90% profit drop for the first quarter of 2020 (Kubota and Wang Citation2020).
In contrast to prior studies on adverse firm events, the COVID-19 pandemic arguably presents an unprecedented and novel environment for firms, based on three dimensions. First, it is an unprecedented large-scale event, affecting economies worldwide and not just a single firm or a specific industry (Linton and Vakil Citation2020). Second, the COVID-19 pandemic presents a truly exogenous shock. While acknowledging few notable exceptions (e.g. Hendricks, Jacobs, and Singhal Citation2020), prior studies predominantly focus on firm-endogenous events like supplier bankruptcy, production issues, or part shortages (e.g. Schmidt et al. Citation2020; Hendricks and Singhal “An Empirical Analysis of the Effect of Supply Chain,” Citation2005). Third, the COVID-19 pandemic affects the entire value chain, ranging from raw materials to end consumers, and disrupting both supply and demand (Shih Citation2020). Given the potential implications for firms and policymakers, we believe it is important to study the financial impact associated with the COVID-19 pandemic and the potential mitigating factors, as they are discussed in academia and practice. Contributing to the ongoing debate on the COVID-19 pandemic and extending the literature on adverse events in an operations and supply chain management context, we address two prominent research questions: (1) What is the financial impact of the COVID-19 pandemic? and (2) What are the mitigating firm factors for the financial impact of the COVID-19 pandemic?
Given the recency and high uncertainty associated with the COVID-19 pandemic, the actual impact on financial firm performance is inherently difficult to measure. Scholars across different disciplines commonly use the event study method to estimate the financial consequences of global events and subsequent policies (e.g. Cousins et al. Citation2020; Gaertner, Hoopes, and Williams Citation2020). The event study method is also suitable to address our research questions, providing a first assessment of the financial impact that investors attribute to the COVID-19 pandemic, based on expectations of future cash flows (Hendricks, Jacobs, and Singhal Citation2020). In this study, we analyse a sample of 4,032 public firms, composed of 1,719 from the U.S. and 2,313 from China, across six industries. Focusing on the first wave of the pandemic, we find that our sample firms experience a significant average decrease in shareholder value of in the first month and
over the three months period after the beginning of the COVID-19 pandemic in January 2020. Estimating a set of robust linear regression models, we find that smaller firms experience a less negative impact on shareholder value. Less dependence on physical assets, shorter trade cycles, and a higher degree of vertical integration further attenuate the negative effects on shareholder value. In a series of robustness checks, we test the sensitivity of the results to our empirical design choices.
The contribution of our work on the impact and mitigation of adverse effects of the COVID-19 pandemic on firm operations is twofold. First, providing empirical evidence for the negative impact on shareholder value, we advance the ongoing debate on the COVID-19 pandemic (Sodhi, Tang, and Willenson Citation2022; Ivanov Citation2022; Ketchen and Craighead Citation2020; Ivanov “Viable supply Chain Model: Integrating Agility,” Citation2020). We also extend the general body of work on adverse supply chain events, such as delays and disruptions, by studying an unprecedented and structurally different phenomenon (Liu et al. Citation2022; Giannoccaro and Iftikhar Citation2022; Xu et al. Citation2020; Jacobs and Singhal Citation2017; Bode et al. Citation2011). In a post-hoc test, we further show that there are significant differences between U.S. and Chinese firms, and across industries, regarding both the magnitude and persistence of the negative effects on shareholder value. Based on the intricacies on a country and industry level, we derive several recommendations for international policymakers.
Second, we identify a set of mitigating firm factors that attenuate the negative shareholder value impact of the COVID-19 pandemic. We challenge established findings and add important factors to the scholarly debate on the mitigation of adverse events (Lo et al. Citation2018; Hendricks, Singhal, and Zhang Citation2009; Hendricks and Singhal Citation2003). The identification of these factors may provide insights for managers and policymakers with respect to the recovery after the COVID-19 pandemic and the implementation of potential mitigation measures for future adverse events.
2. Related literature on the COVID-19 pandemic
Academic literature on the COVID-19 pandemic is emerging. Across multiple disciplines, studies examine the effects of the COVID-19 pandemic on firm innovation (Cooper Citation2021), risk management (El Baz and Ruel Citation2021; Choi Citation2021), its relationship to supply chain management (Raj et al. Citation2022; Kähkönen et al. Citation2022; Mohammed, Jabbour, and Diabat Citation2022), and resilience (Ali et al. Citation2022; Kamalahmadi, Shekarian, and Parast Citation2022).
During the beginning of the COVID-19 pandemic, early conceptual work contributed to our general understanding of the phenomenon (e.g. Craighead, and Darby Citation2020; Ivanov “Viable supply Chain Model: Integrating Agility,” Citation2020; Ivanov and Dolgui Citation2020; Ketchen and Craighead Citation2020; Shih Citation2020). For instance, Craighead, and Darby (Citation2020) present multiple theoretical lenses to better understand and examine pandemics. Ivanov and Dolgui (Citation2020) take a novel intertwined supply chain perspective to discuss supply chain resilience in the context of the COVID-19 pandemic. Ardolino, Bacchetti, and Ivanov (Citation2022) conduct a systematic literature review on the impact of the COVID-19 pandemic in manufacturing, identifying pathways for future research.
Beyond conceptual research, multiple analytical and simulation-based studies have emerged in the context of the COVID-19 pandemic. Ivanov “Predicting the Impacts of Epidemic Outbreaks,” (Citation2020), for instance, was among the first to use discrete event simulation models to predict the impact of COVID-19 disruptions on supply chains. In this study, the author demonstrates that facility closing and opening timing was a crucial factor. In the context of food supply chains, Singh et al. (Citation2021) implemented simulation modelling to study the elevated demand uncertainty during the pandemic, highlighting the importance of supply chain resilience. In another exemplary piece, Ivanov and Dolgui (Citation2021) provide specific implementation guidance for simulation-based research as a powerful tool for supply chain stress testing.
Given the recency of the COVID-19 pandemic and the corresponding limited availability of real world data, related empirical research has just started to emerge. To capture the current state of empirical research on the COVID-19 pandemic from a supply chain resilience perspective, we screened the leading operations management journals in the Web of Science database, using a keyword search string including combinations of COVID-19, coronavirus, supply chain, resilience, and mitigation, including their variations and related terms. The search resulted in 41 papers, which we reduced to 11 after an abstract screening, ensuring to be consistent with the applied methodology (i.e. the study follows an empirical design) and the context (i.e. the study subject is the COVID-19 pandemic). Table presents a summary overview of these papers, including the applied method and the key findings. Most papers collect survey-based primary data, followed by case study designs, and mixed methods approaches (e.g. Dohmen et al. Citation2022; Saïah et al. Citation2022). For example, based on survey data from 470 French firms, El Baz and Ruel (Citation2021) demonstrate the importance of dedicated supply chain risk management practices in facilitating resilience against the COVID-19 disruptions. Kähkönen et al. (Citation2022) use a survey design to show that dynamic capabilities, such as firms re-configuring abilities, foster supply chain resilience. In addition, Shen and Sun (Citation2022) conduct a single case study based on data from the Chinese online retailer JD.com, examining the firm's impact and response to the COVID-19 pandemic. The authors find that an integrated supply chain structure and intelligent platforms helped JD.com to deal with disruptions. Taking a supply chain viability perspective, Ivanov (Citation2021) follows a mixed methods approach, including case studies and quantitative data, to identify four adaptation strategies that firms employ to maintain supply chain viability during the COVID-19 pandemic.
Table 1. Overview of recent empirical literature on resilience to COVID-19.
However, we find that there is a lack of large-scale quantitative studies, with only few notable exceptions (e.g. Y. Li et al. Citation2022). Specifically, the financial consequences of the COVID-19 pandemic as well as potential mitigating factors remain unclear. Addressing this gap, our objective is to inform scholars and managers on the financial impact, and outline potential mitigation paths for COVID-19 and future large-scale disruptions.
3. Hypotheses development
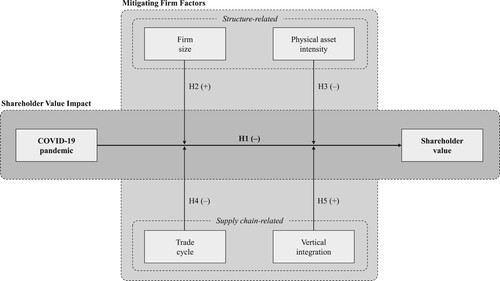
We conduct our hypotheses development in two steps. First, we present previous work on the financial consequences of adverse events along the supply chain to argue for the shareholder value impact of the global COVID-19 pandemic. Second, we discuss a set of potential mitigating firm factors that are either structure- or supply chain-related, and their potential effects on these financial consequences. Figure shows our corresponding conceptual model.
Figure 1. Conceptual model.
3.1. The shareholder value impact of the COVID-19 pandemic
Prior academic literature on adverse events affecting firm operations and supply chains consistently finds negative consequences for firms (e.g. Hendricks and Singhal “Association Between Supply Chain,” Citation2005). As a subset of this stream, few studies also empirically demonstrate that there are negative effects on shareholder value (e.g. Schmidt et al. Citation2020; Hendricks, Jacobs, and Singhal Citation2020; Zsidisin, Petkova, and Dam Citation2016; Hendricks and Singhal Citation2003). In contrast to the phenomena examined in prior studies, the COVID-19 pandemic presents an exogenous, systemic shock that affects firms globally on an unprecedented scale (Sodhi, Tang, and Willenson Citation2022; Govindarajan and Bagla Citation2020; Craighead, and Darby Citation2020). However, we argue that investors may similarly react to the additional costs and lost revenues of the COVID-19 pandemic. Specifically, we argue that the COVID-19 pandemic can impact firms along three distinct risk dimensions: (1) supply uncertainty, (2) demand uncertainty and (3) operational disruptions due to compliance with new ad-hoc restrictions and policies.
First, the COVID-19 pandemic drives supply uncertainty, as both transportation and production are affected. On the one hand, increased health and safety checks or even (partial) closings delay processing at international borders, slowing down global transport (Sodhi, Tang, and Willenson Citation2022; Mohammed, Jabbour, and Diabat Citation2022). Restrictions on individual mobility further create workforce shortages. For instance, the COVID-19 pandemic has exacerbated the challenge for firms to find enough truck drivers to maintain operations (Singh et al. Citation2021; Splitter Citation2020). In addition, as more airlines drastically reduce services, air freight capacity also decreases. When the U.S. decided to ban foreign travel in February 2020, they lost an estimated 85% of air freight capacity (Saul, Dowsett, and Baertlein Citation2020). The delays in processing and limited transport capacity are highly dynamic, driving supply uncertainty and increasing overall costs for firms. On the other hand, slowing movements of goods and workforce mobility restrictions affect production. Production interruptions at suppliers can create ripple effects along the entire supply chain, magnifying supply uncertainties for downstream firms (Ivanov Citation2021; Dolgui, Ivanov, and Sokolov Citation2018; Bode and Wagner Citation2015). These ripple effects are especially strenuous on supply chain resilience and add complexity to recovery measures (Giannoccaro and Iftikhar Citation2022). In March 2020, the Italian automotive component manufacturer MTA, a strategic supplier to Fiat Chrysler, General Motors and Volkswagen, had to shut down its plants for a full week, adversely affecting its customers (Malan Citation2020).
Second, the COVID-19 pandemic is associated with changes in buying behaviour of consumers and business customers, raising demand uncertainty. Ad-hoc policies imposing new restrictions, financial uncertainty and individual health concerns evoke significant demand decreases for some goods and services and substantial demand increases for others. For example, firms in the industrial equipment industry experience strong decreases in demand, as many buying companies delay investments in new machinery and postpone upgrades and maintenance, due to the uncertainty created by the COVID-19 pandemic. According to a McKinsey & Company survey, about 80% of the respondents from machinery and automation firms reported disruptions as a result of substantial demand decreases (Becker et al. Citation2020). Another example is the automotive industry, where the demand for cars across the globe has collapsed by up to 82% during the spring and summer months of 2020, disrupting the entire industry (Collie et al. Citation2020). Volkswagen, one of the world's largest car manufacturers, lost more than 50% of its shareholder value between January and late March 2020, even exceeding the negative shareholder value impact following the company's emission scandal in 2015 (Jacobs and Singhal Citation2020). The food industry has also experienced a massive shift in demand, as store sales for groceries and supplies increased by 29% over the year 2020, whereas sales at restaurants and fast-food locations decreased by 27% (Singh et al. Citation2021; Felix et al. Citation2020). The unexpected demand shifts challenge forecasting and planning, generating revenue losses and additional costs, for example due to excess inventory.
Third, the COVID-19 pandemic further evokes operational disruptions, as firms establish and maintain compliance with new ad-hoc restrictions and policies, creating unexpected additional direct costs (Sodhi, Tang, and Willenson Citation2022; Trentmann Citation2020). Health and safety measures, including mobility restrictions and social distancing rules, decrease production capacity and can even result in a (temporary) halt of production. For example, Volkswagen, Fiat Chrysler, and Hyundai, among others, were forced to halt their production lines at different manufacturing plants due to compliance issues (Hart Citation2020). Illustrating the severe financial consequences, Volkswagen subsequently reported that one of their factory shutdowns in Germany costs around $13 million an hour (Rauwald Citation2020). Increasing compliance efforts further drive operating expenses, especially since restrictions and policies are short-term actions and subject to continuous adaption. To deal with this highly dynamic environment, firms are creating dedicated COVID-19 task-forces to manage their policy implementation, further driving administrative expenses (Ivanov Citation2021; Lev-Ram Citation2020). Some firms provide personal protective equipment, such as face masks and gloves, and install a variety of amenities, including disinfectant dispensers, touch-free water fountains, or table dividers, in order to keep their operations running. For example, the IT company Iron Mountain reported pandemic-related short-term expenses of over $10 million (Trentmann Citation2020).
Overall, we propose that investors negatively assess the cost increases and revenue losses associated with the COVID-19 pandemic due to increased supply and demand uncertainty as well as operational disruptions, resulting in an overall negative impact on shareholder value.
Hypothesis 1: The COVID-19 pandemic is associated with a decrease in shareholder value.
3.2. Factors mitigating the shareholder value impact
As adverse events affecting firm operations and supply chains can be detrimental to firm value, multiple studies explore firm factors mitigating the negative consequences (Bai, Gao, and Sarkis Citation2021; Hendricks, Singhal, and Zhang Citation2009; Raj et al. Citation2022). In line with the established literature, we argue that specific firm resources and capabilities can reduce the direct negative operational and financial consequences, and facilitate supply chain viability (Ruel et al. Citation2021; Ivanov “Viable supply Chain Model: Integrating Agility,” Citation2020), defined by Ivanov (Citation2018) as the ‘ability to survive and exist after a disruption’ (p. 59). Specifically, we examine the following factors related to firm structure: (1) firm size, (2) physical asset intensity, and the supply chain: (3) trade cycle, and (4) vertical integration.
Three aspects mainly influenced our selection of these mitigating firm factors. First, as the COVID-19 pandemic is associated with novel challenges due to its global and large-scale nature, it presents an exogenous and unprecedented shock to firms (e.g. Sodhi, Tang, and Willenson Citation2022). Given the high initial uncertainty, firms are hesitant to make ad-hoc decisions (Ivanov Citation2021; Craighead et al. Citation2007). Thus, we primarily focus on structural mitigation factors (i.e. firm size, physical asset intensity, and vertical integration) and those decisions directly related to generating cash for operational survival (i.e. trade cycle). Structural factors may further add specific insights for policymakers. Second, adding to the public discourse on the COVID-19 pandemic, we include factors that have received significant attention in the current media coverage of the COVID-19 pandemic. These include concepts commonly discussed in the extant literature on supply chain risk and resilience (Ivanov Citation2022, Citation2021; Iftikhar, Purvis, and Giannoccaro Citation2021), and less common factors (i.e. physical asset intensity). Third, as the COVID-19 pandemic adversely affects not only single firms, but whole supply chains (e.g. Craighead, and Darby Citation2020), we include (1) structure- and (2) supply chain-related mitigating firm factors. Table further presents exemplary prior literature contributions related to our proposed mitigating factors, including their corresponding supply chain disruption context.
Table 2. Exemplary prior literature on the disruption mitigating factors.
3.2.1. Structure-related mitigating factors
Prior literature suggests that firms are differently affected by adverse events, depending on structural characteristics (Hendricks, Singhal, and Zhang Citation2009; Hendricks and Singhal Citation2003). In this section, we explore the potential mitigation effects of: (1) firm size and (2) physical asset intensity.
Firm size. Literature suggests that larger firms are less negatively affected by disruptions than smaller firms (Hendricks and Singhal Citation2003). We present three reasons for an analogous effect during the COVID-19 pandemic.
First, larger firms are associated with higher financial stability and thus more financial slack (Kovach et al. Citation2015; Hendricks, Singhal, and Zhang Citation2009). As firms across many industries experience declining sales, superior financial resources enable larger firms to endure periods of low revenues and liquidity shortages. For example, Nike experienced a 38% decline in sales, however, investors arguably valued Nike's potential for future growth positively, boosting shareholder value (Safdar Citation2020). In contrast, smaller firms are more reliant on continuous cash flows to meet their obligations. A prolonged COVID-19 pandemic could therefore significantly reduce profits and eventually threaten firm survival (Monson Citation2020). Further, superior financial resources also enable larger firms to invest in new technologies and infrastructure. According to a McKinsey & Company executive survey, firms have accelerated investments in digital initiatives, in order to stay competitive during and after the COVID-19 pandemic (McKinsey Citation2020).
Second, as the COVID-19 pandemic creates supply shortages, firms often need to secure critical resources (Choi, Rogers, and Vakil Citation2020; Linton and Vakil Citation2020). Larger firms are associated with higher bargaining power in pricing and contract negotiations with suppliers (Mitra and Singhal Citation2008). As a result, contracts might be more advantageous for larger firms, in terms of securing priority supply during shortages, and negotiating fixed and lower prices with longer contract terms.
Third, prior studies also suggest a positive relationship between firm size and firm diversification (Salter and Weinhold Citation1979; Gort Citation1962). Firm diversification can be understood as the number of industries or business segments in which a firm operates (i.e. business diversification), or as the number of countries or regions in which a firm operates (i.e. geographical diversification) (Hendricks, Singhal, and Zhang Citation2009). In case of an adverse event, both facets enable firms to flexibly shift resources to less affected (business or geographical) areas. In March 2020, Dow Chemical, for example, shifted resources to their hand sanitiser production, compensating shrinking revenues in other business areas (Lamb and Schikorra Citation2020). Overall, based on financial slack, long-term developmental investment opportunities, bargaining power, and diversification arguments, we propose that the negative shareholder value impact associated with the COVID-19 pandemic is weaker for larger firms.
Hypothesis 2: The associated decrease in shareholder value is weaker for larger firms.
Physical asset intensity. A firm's physical asset intensity is understood as the degree to which a firm relies on physical assets to create value (Patnayakuni, Rai, and Seth Citation2006). Physical assets are, for example, property, plants, and production equipment, while non-physical assets include financials, intellectual property, or software. As social distancing and remote working policies limit the number of on-site workers, the COVID-19 pandemic disrupts production processes of firms that heavily rely on physical assets, including machinery and other production equipment. Property, such as stores, are also physical assets. Stores are an important firm distribution channel, but heavy reliance on store sales can limit flexibility during the COVID-19 pandemic (Ardolino, Bacchetti, and Ivanov Citation2022; Dolgui, Ivanov, and Sokolov Citation2020). For example, retail sales decreased by 3.5% in the second quarter of 2020 in comparison to the previous year, while e-commerce sales rose by 44.5% (DOC Citation2020). More specifically, multiple retailers that traditionally relied on sales in physical stores had to file for bankruptcy, including J. Crew, J.C. Penney, and Brooks Brothers (Friedman, Maheshwari, and Merced Citation2020). In contrast, retailers with stronger e-commerce channels were able to benefit (Ardolino, Bacchetti, and Ivanov Citation2022). For example, Walmart's e-commerce sales doubled in the second quarter of 2020 (Wahba Citation2020).
We argue that firms, which are mainly relying on physical assets to create value, face less negative financial consequences from the COVID-19 pandemic, since dominantly variable cost structures are flexibly scalable and work processes are either less affected by ad-hoc restrictions or can be easier adapted to distributed working environments. In sum, we propose that firms less dependent on physical assets are less negatively affected by the COVID-19 pandemic than firms with a higher dependency on physical assets.
Hypothesis 3: The associated decrease in shareholder value is weaker for firms with a lower physical asset intensity.
3.2.2. Supply chain-related mitigating factors
The COVID-19 pandemic has a negative impact on firm operations and supply chains (e.g. Sodhi, Tang, and Willenson Citation2022). Supply chain resilience, in terms of structures, processes and ad-hoc measures, has gained increasing attention by academics and practitioners (e.g. Ivanov Citation2022; Kamalahmadi, Shekarian, and Parast Citation2022; Ivanov Citation2018). In this section, we specifically explore the potential mitigation effects of: (1) trade cycle and (2) vertical integration.
Trade cycle. The COVID-19 pandemic has shifted the focus of many firms from profit maximisation to survival (Monson Citation2020; Francis and Gryta Citation2020). Financial liquidity is an important firm objective, as it indicates a firm's ability to meet obligations and maintain operations during times of high uncertainty. McKinsey & Company find firms to increasingly prioritise cash in their short-term decision-making to ensure firm survival and prepare for their financial recovery (Grube, Park, and Ruden Citation2020).
Literature suggests that firms can shorten their trade cycle to control cash flows and manage financial liquidity (Wiengarten et al. Citation2017). The trade cycle indicates a firm's capability to transform resource inputs into cash outcomes (Hendricks, Singhal, and Zhang Citation2009). Specifically, the trade cycle represents the time period between a firm paying their suppliers (payables) and receiving payments from their customers (receivables). Shorter trade cycles are associated with operational efficiency and flexibility (Hendricks, Singhal, and Zhang Citation2009). Firms with shorter trade cycles can adjust to increased supply and demand volatility more efficiently and quickly. Arguably, during disruptions like the COVID-19 pandemic that are characterised by high levels of uncertainty, elevated velocity through more streamlined buying processes may help to mitigate the negative financial consequences and facilitates supply chain viability (Ruel et al. Citation2021; Ivanov and Dolgui Citation2020).
In practice, firms have already started to optimise (i.e. shorten) their trade cycle (Shumsky and Trentmann Citation2018). In sum, we argue that firms with shorter trade cycles can build cash reserves to maintain operations in unstable environments, as during the COVID-19 pandemic.
Hypothesis 4: The associated decrease in shareholder value is weaker for firms with a shorter trade cycle.
Vertical integration. Prior literature indicates that firms with a higher degree of vertical integration experience a less negative impact following disruptions (Bode and Wagner Citation2015). Firms with a higher degree of vertical integration can attain more control over their supply chain by integrating related supply chain stages to secure the supply of critical resources or ensure the distribution of products (Hendricks, Singhal, and Zhang Citation2009). Vertical integration can be achieved by either acquiring key supply chain partners or expanding in-house capabilities.
The COVID-19 pandemic puts a strain on global supply and production networks, resulting in delays and shortages. As ports close and trade restrictions slow down global transport, firms with a higher degree of vertical integration are less reliant on a network of external resource providers and might thus be less negatively affected. Consistent with Hendricks, Singhal, and Zhang (Citation2009) and others, we argue that more vertically integrated firms have to coordinate their mitigation and recovery efforts with a lower number of supply chain partners, saving time and costs. Less vertical integration makes firms susceptible to price fluctuations, potentially raising costs for competitive goods during the pandemic.
Anecdotal evidence further indicates that multinational firms increase vertical integration to shorten the distance between customer and supplier and to improve production flexibility. A ‘shorter’ global supply chain is associated with lower vertical complexity, reducing the risk of disruptions and the chances for negative ripple effects and disruption propagation along the entire supply chain (Dolgui, Ivanov, and Sokolov Citation2018; Bode and Wagner Citation2015). Ateş and Memiş (Citation2021) also show that supply chain complexity can lead to lower operational performance and flexibility. A reduction in complexity seems particularly crucial during the COVID-19 pandemic, as ad-hoc restrictions and policies affect all tiers of a supply chain. Similarly, Ali et al. (Citation2022) suggest that firms with both domestic and global suppliers and customers exhibit higher resilience towards unexpected global shocks, than those having only global supply chain partners, indicating the vulnerabilities of excessive outsourcing and low vertical integration. Overall, we propose that during the COVID-19 pandemic investors will positively value the greater independence from complex sourcing networks and the resulting viability and flexibility of more vertically integrated firms.
Hypothesis 5: The associated decrease in shareholder value is weaker for firms with a higher degree of vertical integration.
4. Methodology
To examine the impact of the COVID-19 pandemic on a firm's shareholder value, we conduct an event study (Hypothesis 1). Based on our event study results, we examine a set of firm factors that might mitigate the shareholder value impact, using robust regression analysis (Hypotheses 2–5).
4.1. Sample selection and description
The standard event study procedure requires the construction of a sampling pool of firms that have been affected by the event of interest, measuring the impact of that event on the market value of the firm. Consequently, many event study samples are based on firm announcement texts, implicitly assuming that the event of interest may be attributed to announcing firms and not to non-announcing firms. While this strategy seems reasonable for firm-endogenous events like outsourcing decisions (e.g. Duan et al. Citation2014), environmental incidents (e.g. Lo et al. Citation2018), or IT investments (e.g. Klöckner, Schmidt, and Wagner Citation2022), it may be problematic for exogenous and systemic events, where relying on announcements as a proxy for attribution can introduce a sample selection bias. Arguably, (almost) all firms are affected by the COVID-19 pandemic, directly or indirectly, or in a positive or negative way. As we are interested in the overall impact of the COVID-19 pandemic, a global and systemic event, we deliberately deviate from an announcement-based sampling procedure, consistent with prior work examining large-scale exogenous events (e.g. Gaertner, Hoopes, and Williams Citation2020; Tielmann and Schiereck Citation2017).
Specifically, we draw on a large-scale sample of publicly traded firms from selected industries in the U.S. and China. We select these countries for two reasons. First, these markets reflect the two largest economies in the world, as both collectively represent 40% of the world's total gross domestic product (GDP) (IMF Citation2020), and also exhibit the highest total domestic market capitalisation, with more than half of the global firm market value being traded on U.S. (44%) and Chinese stock markets (12%) (Worldbank Citation2020). Second, the U.S. and China both play a major role in the global development of the COVID-19 pandemic. While China has been the world's first country to be hit by the pandemic, the U.S. could be the country that has been hit hardest, based on the number of total cases and total deaths.Footnote2
To maintain an operations and supply chain management focus, we limit our sample to the following industries and all corresponding sub-industries: Energy, Materials, Industrials, Consumer Discretionary, Consumer Staples, and Health Care, based on the Global Industry Classification Standard (GICS)Footnote3. Excluded industries are, for instance, Communication Services, Financials, or Real Estate. We further restrict our sample to firms listed on the New York Stock Exchange (NYSE) and the NASDAQ, the two largest U.S. stock exchanges (Schmidt et al. Citation2020), and on the Shanghai Stock Exchange (SSE) and the Shenzhen Stock Exchange (SZSE), the two major stock exchanges in mainland China (Bai, Gao, and Sarkis Citation2021). We exclude 408 firms with insufficient stock price data available in the Thomson Reuters Eikon database (Lo et al. Citation2018). Our final sample consists of 4,032 public firms, 1,719 (42.6%) from the U.S and 2,313 (57.4%) from China. Appendix Table B1 shows the detailed distribution of our sample firms across industries and countries. The majority of firms () belongs to Industrials, with the largest subgroups being Machinery and Electrical Equipment. The next largest industries are Health Care (
), including Biotechnology or Pharmaceuticals, and Consumer Discretionary (
), including Auto Components or Household Durables.
4.2. Variables and measures
To measure and test our proposed relationships, we retrieve additional financial firm data from the Thomson Reuters Eikon database. Table presents an overview of the measures and data sources used in this study.
Table 3. Measurement details for hypothesised and control variables.
Hypothesised variables. To measure firm size, we follow previous empirical work and use the natural logarithm of total revenues (Chatterjee, Pacini, and Sambamurthy Citation2002). For a firm's physical asset intensity, we calculate the ratio of property, plant and equipment (PP&E), indicating physical assets, to total assets. Assessing a firm's trade cycle, we use the cash-to-cash cycle from the previous fiscal year, as provided by Thomson Reuters (Hendricks, Singhal, and Zhang Citation2009). A firm's vertical integration is measured by the ratio of total revenues minus purchasing expenses to total revenues, indicative of the importance of sourcing goods and services from suppliers.
Control variables. Following previous event studies, we include a set of financial control variables that have been shown to influence the shareholder value of a firm. Specifically, we control for firm growth, measured as the percentage change in total revenues. Firm growth reflects a firm's past performance, possibly affecting investor decisions (Chatterjee, Pacini, and Sambamurthy Citation2002). We also include the market-to-book-ratio to control for potential over- and undervaluation of a firm (Schmidt et al. Citation2020; Fama and French Citation1998). It is also conceivable that the impact of the COVID-19 pandemic on shareholder value depends on the industry in which a firm is operating. We capture industry effects using dummy variables as controls, where Industrials functions as the base category. Similarly, we control for systematic country effects using a dummy variable for the U.S. firms in our sample, denoting China as the reference category (Klöckner, Schmidt, and Wagner Citation2022; Lo et al. Citation2018). We refer to Table for more details on the measurements of both hypothesised and control variables. Table further presents descriptive summary statistics of all variables.
Table 4. Descriptive summary statistics.
4.3. Data analysis
Our data analysis comprises two steps. First, using an event study approach, we examine the shareholder value impact of the COVID-19 pandemic. Subsequently, we use cross-sectional regression models to test our hypothesised mitigating factors.
4.3.1. Event study
The established event study method allows researchers to analyse the shareholder value impact associated with a specific event (McWilliams and Siegel Citation1997; Brown and Warner Citation1985). As the method facilitates the assessment of financial firm performance on the stock market, it is also a prominent approach in empirical operations and supply chain management research (e.g. Lo et al. Citation2018; Ni, Flynn, and Jacobs Citation2016; Zsidisin, Petkova, and Dam Citation2016). Event studies rely on the central assumption of an efficient market, in which stock prices instantaneously reflect any public information related to an event (McWilliams and Siegel Citation1997). As prior studies provide excellent summaries of this method (see Kothari and Warner Citation2006; McWilliams and Siegel Citation1997), we limit our discussion here to the key design decisions, regarding the definition of the event window, and the computation of abnormal returns.
Definition of the event window. On January 7, 2020, a leading Chinese virologist publicly announced that a novel coronavirus (COVID-19) is responsible for recently diagnosed pneumonia cases in Wuhan (Khan Citation2020). In this study, we understand January 7, 2020 as the start of the COVID-19 pandemic, and thus of our event window, denoted as Day 0. We follow the standard event study procedure of translating calendar days into U.S. and Chinese trading days, where Day −1 denotes the prior trading day, Day 1 the trading day following January 7, and so forth. It is important to note that trading days do not always correspond to the exact same calendar day in the U.S. and China, due to differences in national holidays affecting trading times. However, consistent with prior international event studies (e.g. Klöckner, Schmidt, and Wagner Citation2022), this is adequate since the time differences are marginal, especially when considering longer event windows.
The majority of event studies examines short-term stock market reactions to discrete events, such as announcements of outsourcing decisions (Duan et al. Citation2014) or environmental incidents (Lo et al. Citation2018). In operations and supply chain management, few studies examining large-scale exogenous events consider longer event windows. Exemplary studies investigate the stock market response to the 2011 Great East Japan Earthquake (Hendricks, Jacobs, and Singhal Citation2020) or the shareholder value impact of the 2016 Brexit referendum for logistics service providers (Tielmann and Schiereck Citation2017). As the COVID-19 pandemic unfolds gradually, it seems crucial to also examine a longer period. Our data allows us to cover a period of 100 trading days, starting on January 7 and ending in early June 2020, capturing the first wave of the pandemic. Following Hendricks, Jacobs, and Singhal (Citation2020), we report different monthly event windows, assuming that 20 trading days correspond to one calendar month.
Computation of abnormal returns. Abnormal returns are defined as the difference between observed and expected stock market returns (Brown and Warner Citation1985). For the estimation of expected stock market returns, we use the commonly applied market model (Hendricks, Jacobs, and Singhal Citation2020; Ni, Flynn, and Jacobs Citation2016; Zsidisin, Petkova, and Dam Citation2016):
(1)
(1) where
is the observed return for stock i on Day t.
denotes the market return of the country-specific stock market index m, used as a benchmark for stock i on Day t. We use the S&P 500 as the market index for U.S. stocks and the CSI 300 for Chinese stocks.
and
are linear regression coefficients, and
is the residual error. To estimate these parameters, we run an ordinary least squares (OLS) regression over an estimation period of 200 trading days, with an offset of 10 trading days prior to Day 0, January 7, 2020 (Lo et al. Citation2018; Zsidisin, Petkova, and Dam Citation2016). We note that our estimation period is within the calendar year 2019, ensuring that the estimation of expected returns is isolated from the systemic stock market shock of the COVID-19 pandemic in 2020. With the resulting regression estimators
and
, we then compute the abnormal return
as the difference between each stock's observed return and the expected return:
(2)
(2) Here, it is important to note that the use of standard OLS predictions to compute expected returns seems inappropriate in the context of this study. The COVID-19 pandemic is an exogenous large-scale event, affecting all businesses on a global scale. Global stock markets were systemically affected during 2020. For instance, compared to previous years, both the volatility and the magnitude were structurally different. As it is crucial in event study research to compute expected returns that represent a benchmark under regular market conditions, using predictions that consider negatively distorted market returns would lead to a systematic underestimation of abnormal returns (Hendricks, Jacobs, and Singhal Citation2020). Hence, we follow the approach outlined in Hendricks, Jacobs, and Singhal (Citation2020), who adjust the computation of abnormal returns in a comparable setting (i.e. the Great East Japan Earthquake systemically impacting Japanese stock market returns), and simulate market returns for our period of interest in 2020. Specifically, we randomly draw one market return with replacement from the 2019 estimation period for each of the one hundred trading days in our event window. We then predict the expected return as shown in Equation (Equation2
(2)
(2) ) for each of our 4,032 U.S. and Chinese firms. Analogous to Hendricks, Jacobs, and Singhal (Citation2020), we repeat the drawing process 1,000 times, resulting in 1,000 abnormal returns for each Day t (
) and each stock i (
). We then take the mean of these 1,000 trials as the abnormal return
for stock i on Day t (Hendricks, Jacobs, and Singhal Citation2020).
We compute the mean abnormal return for any given Day t as
(3)
(3) where N denotes the number of firms included in our sample. As we are examining extended event windows, we calculate cumulative abnormal returns over a given window (
), given by
(4)
(4) Analogous to the mean abnormal return, we then derive the mean cumulative abnormal return for the event window, ranging from Day
to Day
, as
(5)
(5) In addition to the mean cumulative abnormal returns, we also report the median cumulative abnormal returns and the percentage of negative cumulative abnormal returns for the (
) event windows. To test the significance of mean cumulative abnormal returns, we compute and report BW (Brown and Warner Citation1985) and BMP (Boehmer, Musumeci, and Poulsen Citation1991) test statistics. We further use Wilcoxon signed rank tests for the median and generalised sign tests for the share of negative cumulative abnormal returns. Appendix Section A.1 provides details on the test statistics used.
4.3.2. Cross-sectional analysis
To test the proposed mitigating factors (Hypotheses 2–5), we estimate multiple cross-sectional regression models. First, we identify an appropriate event window for our dependent variable to capture the impact on shareholder value. Second, we present our model specification.
Identification of the dependent variable. Our objective is to test a set of mitigating factors that might explain the variance in the shareholder value decrease across our sample of U.S. and Chinese firms. We use cumulative abnormal returns as our dependent variable. To facilitate our regression analysis, we need to identify an event window that reasonably captures the shareholder value impact. We explore three different facets of the COVID-19 pandemic to guide our selection of an appropriate event window: (1) the course and severity of, (2) the public attention towards, and (3) the stock market volatility associated with the COVID-19 pandemic.
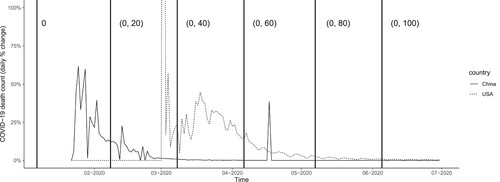
First, measuring the course and severity of the COVID-19 pandemic between January and June 2020, we retrieve official COVID-19 death counts from the John Hopkins University database.Footnote4 Figure presents the percentage change of daily deaths in the U.S. and China. The vertical lines separate 20 trading days, corresponding to one calendar month. In China, the number of deaths increased rapidly during January and February, and the curve started flattening in March 2020. In contrast, U.S. death cases began rising in March and started slowing down between April and May 2020. After mid-May (approximately Day 80), growth rates remained similarly low in both countries. To capture the majority of the effect without extending the event window longer than necessary, Figure suggests the use of an (0, 80) event window for our regression analysis.
Figure 2. Percentage change of daily COVID-19 death count.
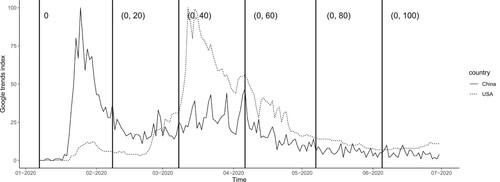
Second, we use Google Trends data to examine the level of public attention towards the COVID-19 pandemic. The public attention towards a specific topic is associated with the release of new information, allowing us to assess the time when available information has been absorbed by stock prices (e.g. Cziraki, Mondria, and Wu Citation2021). Similar to Gaertner, Hoopes, and Williams (Citation2020), we use publicly available Google Trends data to determine a suitable event window. Google Trends data reflects the number of searches for a given keyword during a specified period in a certain country, indexed between 0 and 100. Figure illustrates the Google Trends indices for the U.S. and China during the COVID-19 pandemic. The observed pattern is similar to the severity of the COVID-19 pandemic (see Figure ), as we also see a sharp increase in China in late January, followed by a U.S. peak in March 2020. The public attention towards the pandemic also supports the selection of an (0, 80) event window.
Figure 3. Google Trends indices for keyword ‘coronavirus’.
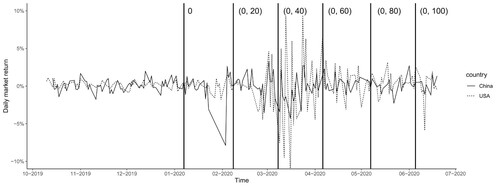
Third, we follow the approach outlined in Hendricks, Jacobs, and Singhal (Citation2020) and analyse the stock market volatility during the period of interest. Increased stock market volatility is also indicative of new information release that is relevant to investors (Hendricks, Jacobs, and Singhal Citation2020). Figure illustrates the daily stock market returns for the main stock market indices, respectively the S&P 500 for the U.S. and the CSI 300 for China. The overall stock market volatility has drastically increased in both countries compared to the pre-event period (before Day 0). We see the highest standard deviations of stock market returns in China between January and February, corresponding to event window (0, 20), and in the U.S. in March 2020, captured in the (41, 60) event window. While the Chinese stock market reached the pre-event volatility level after Day 60, the U.S. stock market volatility was decreasing, but still higher than in the pre-event period. The (0, 80) event window adequately includes the period of raised stock market volatility for both the U.S. and China.
Figure 4. Stock market volatility (S&P 500 for the U.S. and CSI 300 for China).
Our three identification approaches suggest that the (0, 80) event window sufficiently captures the shareholder value effects associated with the first wave of the COVID-19 pandemic. The subsequent regression analysis is based on these cumulative abnormal returns as the dependent variable. In a robustness check, we repeat our analysis using alternative event window specifications (see Section 5.3).
Model specification. In our study, the high stock market volatility is indicative of potential outlier values that could bias regression estimates. We thus estimate multiple robust regression models (Kutner et al. Citation2005). In contrast to standard OLS regression, observations are iteratively re-weighted based on their residuals, putting less emphasis on outliers (Rousseeuw and Leroy Citation1987). In contrast to OLS regression on a trimmed or capped sample, the robust regression approach allows us to account for potential outliers without reducing our sample size, mitigating the risk of sample selection-induced endogeneity (Wooldridge Citation2010). Specifically, we estimate the following robust regression model:
(6)
(6) where
are the maximum likelihood regression coefficients for the explanatory variables defined in Table . In a step-wise approach, we sequentially add the covariates to our model and report the estimates of all interim models. Coefficients are tested using two-tailed t-tests with robust standard errors.
5. Results
5.1. The shareholder value impact of the COVID-19 pandemic
In Hypothesis 1, we argue that the COVID-19 pandemic evokes a decrease in shareholder value. Table illustrates the results of our event study, specifically the BW and BMP t-tests, the Wilcoxon signed rank tests, and the generalised sign tests for five different event windows, presented in 20 trading day increments. The mean cumulative abnormal returns are decreasing during the first 60 days (Columns 1–3). Column 3 indicates that our sample firms experience an average decrease of in shareholder value in the (0, 60) event window (
). In Column 4, the cumulative abnormal return in the (0, 80) event window shows a negative impact on shareholder value, with a mean of
. In the (0, 80) event window, the average decrease in shareholder value for our sample firms equates to approximately $560 million. Columns 4 and 5 also suggest first recovery effects after Day 60, as the mean cumulative abnormal returns turn positive after 100 days.
Table 5. Event study results. Cumulative event windows.
Looking at the median cumulative abnormal return, which is the more appropriate measure in the context of high stock market volatility, all event windows show significant negative effects, especially in the (0, 60) event window (Column 3,
) and
in the (0, 80) event window (Column 4,
). In Column 3 of Table , the percentage of negative cumulative abnormal returns peaks at 70.11% in the (0, 60) event window (
). Despite recovery effects after Day 60, our event study results suggest a significantly negative shareholder impact after the start of the COVID-19 pandemic, supporting Hypothesis 1.
In addition to the cumulative windows, Table also presents non-overlapping event windows. Similar to Table , Columns 1 and 3 of Table indicate significantly negative mean and median cumulative abnormal returns. Column 3 suggests an average decrease of in shareholder value during the third month (
). Regarding the recovery effects, Columns 4 and 5 also show positive mean and median cumulative abnormal returns after Day 60.
Table 6. Event study results. Non-overlapping event windows.
5.2. The factors mitigating the shareholder value impact
In Hypotheses 2–5, we propose four structure- and supply chain-related firm factors that potentially mitigate the negative impact on shareholder value during the COVID-19 pandemic. We test our hypotheses estimating a set of robust regression models. Table presents the correlation matrix including our main dependent variable () and the explanatory variables, as introduced in Section 3. All pairwise correlation coefficients are below an absolute value of 0.23. We further compute variance inflation factors (V IFs), which are below the threshold of 2 for all variables, limiting the risk of multicollinearity biasing our estimates (Kutner et al. Citation2005).
Table shows our robust linear regression results. Column 1 presents the base model, including only firm financial, industry and country controls. Columns 2–4 show the step-wise model estimates for our hypothesised variables. Column 5 presents the full model, corresponding to Equation (Equation6(6)
(6) ) in Section 3.3.2. In Hypothesis 2, we argue that the decrease in shareholder value is weaker for larger firms. Surprisingly, our findings reveal the exact opposite, a statistically significant negative effect (
, p<0.001), indicating that smaller firms experience a less negative impact on shareholder value. While the effect of a firm's physical asset intensity is significant in Model 2 (Column 3,
, p<0.05), our full model (Model 4) can only marginally support this effect (Column 5,
, p<0.10), providing only partial support for Hypothesis 3. Column 5 also suggests that firms with shorter trade cycles experience a less negative impact on shareholder value (
, p<0.05), supporting Hypothesis 4. Lastly, in Hypothesis 5, we argue that firms with a higher degree of vertical integration receive a weaker negative impact on shareholder value. Confirming Hypothesis 5, the corresponding regression coefficient is positive and statistically significant (
, p<0.05).
Table 7. Robust linear regression results.
5.3. Robustness checks
We conduct three robustness checks to mitigate the risk of particular study design choices biasing our empirical results. First, since the market-wide effects of the COVID-19 pandemic would bias event studies using regular market or Fama-French four-factor models, we adopt a market model with simulated benchmark returns to compute abnormal returns (Hendricks, Jacobs, and Singhal Citation2020). As this presents a specific design choice, we repeat our main analyses using the two alternative approaches that are not reliant on a market benchmark, mean-adjusted returns and actual returns (e.g. Hendricks, Jacobs, and Singhal Citation2020; Zsidisin, Petkova, and Dam Citation2016). The event study and regression results are largely supported, suggesting no systematic bias by our choice of expected return model. Please refer to Appendix A.2.1 for more details.
Second, our event window length and start date could also affect our results. In our main analysis, we determine the official announcement of a novel coronavirus on January 7, 2020, as the start date of our event window. Based on the course of, the attention towards, and the stock market volatility associated with the COVID-19 pandemic, we use a (0, 80) event window for our main analysis. To ensure that these choices are not driving our results, we repeat our event study and the cross-sectional regression analysis for several alternative event window start dates and lengths, yielding similar results (see Appendix A.2.2 for more details).
Third, missing data is a common issue in secondary data studies. While we report the step-wise regression results on the largest possible sample size for every hypothesised effect, we provide two additional robustness checks using (1) complete observations only and (2) a regression-based data imputation strategy. The detailed procedures and results are described in Appendix A.2.3. Missing data likely does not introduce a bias.
5.4. Post-Hoc analyses
In our main analysis, we account for potential country and industry effects using binary control variables in our regression models. As our results suggest high variance in cumulative abnormal returns dependent on the firm's macro (i.e. country) and competitive (i.e. industry) environment, we further explore the effects of different firm environments.
The policies addressing the COVID-19 pandemic are developed and enforced on a national level, highlighting the importance of a firm's macro environment. To further explore the differences in shareholder value between both countries, we split our sample into 1,719 U.S. and 2,313 Chinese firms. We conduct separate event studies for each split sample and compute cumulative abnormal returns, as described in Section 3. Appendix Tables B9–B10 present the results. The shareholder value impact is substantially more severe for the U.S. sample firms, up to a median cumulative abnormal return of (
) in the (0, 60) event window. In contrast, Chinese firms experience the most negative shareholder value impact during the first month, with a median cumulative abnormal return of
(
). In sum, our results indicate that the negative impact on shareholder value is larger in magnitude and more persistent for U.S. firms than for Chinese firms.
A potential explanation may relate to the spread and severity of the COVID-19 pandemic, which varies substantially between both countries. The severity of the pandemic, indicated, for example, by the rate of daily infections or deaths, influences the restrictiveness and duration of national ad-hoc policies, such as border closings or individual mobility restrictions. We assume that conditions of restrictive and prolonged policies put more financial distress on firms, reflected in investor expectations and shareholder value. After strong early infection spikes, China managed to push new daily cases down to a continuously low level. In contrast, daily new infections in the U.S. began surging in mid-March, and rapidly increasing again in June 2020. The country-specific shareholder value impact as shown in Appendix Tables B9–B10 reflects these developments, indicating that the impact on shareholder value might be partially explained by the national severity of the COVID-19 pandemic.
On the industry level, anecdotal evidence also suggests a highly heterogeneous shareholder value impact of the COVID-19 pandemic. While, for example, airlines experienced a substantial decrease in firm revenue, medical technology firms faced unexpected spikes in demand, both reflected by changes in shareholder value. In this post-hoc analysis, we leverage the large-scale nature of our sample to create split samples on the industry level and conduct separate event studies to better understand the implications of a firm's competitive environment.
Appendix Tables B11–B13 present the results based on industry splits for our full sample, our U.S. sample firms and the Chinese firms. Consistent with the main results, firms in the Energy industry experience the strongest decrease in shareholder value, up to in the (0, 60) event window. Firms in the Consumer Discretionary industry also undergo a relatively strong decline in shareholder value. As expected, both Consumer Staples and Health Care firms experience a comparatively weaker decrease, and even a significant increase in the fourth and fifth month, indicating early recovery effects. Our results suggest that these positive recovery effects in the longer event windows are largely driven by Chinese firms. In the U.S., we find a substantially negative impact on shareholder value across all of our sample industries.
We also explore industry effects on a more granular level. Appendix Table B14 reports event study results on a 6-digit GICS industry level in the U.S. (Panel A) and China (Panel B). In the U.S., the top beneficiaries are Health Care, specifically Health Care Technology and Biotechnology, followed by Household Products, Internet Retail and Food and Staples Retailing. For China, we see similar industries to perform comparatively better than others. Not surprisingly, the industries that experienced surging demands during the COVID-19 pandemic experience positive shareholder value implications. In contrast, industries undergoing demand slumps due to adjusted consumer behaviour (e.g. Leisure Products) or mobility restrictions (e.g. Airlines) face a particularly strong decline in shareholder value. For example, publicly traded Airlines in the U.S. lost on average in shareholder value in the (0, 80) event window.
6. Summary and implications
6.1. Discussion and implications for literature
In this study, based on a sample of 4,032 publicly traded U.S. and Chinese firms, we demonstrate that the COVID-19 pandemic is associated with a statistically and economically significant shareholder value decrease of in the first month and
over the three months period after the start of the COVID-19 pandemic in early January 2020.
In our post-hoc analyses, we find that this shareholder value impact is highly heterogeneous between the U.S. and China, and across industries. On the country level, the negative impact of the COVID-19 pandemic on shareholder value is substantially higher and more prolonged for U.S. firms, potentially driven by differences in the course and severity of the pandemic. Our findings add to the literature on country-specific contingencies for stock market valuations (e.g. Klöckner, Schmidt, and Wagner Citation2022; Hau, Massa, and Peress Citation2010). On the industry level, we find Energy and Consumer Discretionary to experience the overall most negative impact, while Consumer Staples and Health Care are less affected. In China, the latter two can even significantly ‘benefit’ due to surging demands. In the context of the Great East Japan Earthquake in 2011, Hendricks, Jacobs, and Singhal (Citation2020) also find both negative and positive consequences. We provide first indication for a potentially similar diverging effect in the context of the COVID-19 pandemic.
We further identify multiple factors that mitigate the negative financial consequences of the COVID-19 pandemic. Specifically, we test established factors, including firm size and vertical integration, in a novel context. We also explore new factors that are discussed in the context of the COVID-19 pandemic, such as a firm's dependency on physical assets and trade cycle. Unexpectedly, we find that larger firms actually experience a significantly stronger negative impact than smaller firms, challenging prior empirical results. In our hypothesis development, we argue that the decrease in shareholder value associated with the COVID-19 pandemic should be weaker for larger firms, as they exhibit sufficient financial slack to limit the negative consequences of operational disruptions. However, our results indicate that the negative shareholder value impact of the COVID-19 pandemic is significantly weaker for smaller firms. To explain our finding, we look at implications of firm size that might be more prominent during the COVID-19 pandemic. First, one could argue that larger firms are more likely part of more complex and globally dispersed supply networks (Hendricks, Hora, and Singhal Citation2015), while smaller firms would source more locally and are thus less reliant on international supplier and customer markets. Local supply chains might be beneficial during the global COVID-19 pandemic, when international mobility is restricted. Second, it is conceivable that investors also consider the effects of governmental financial support programmes, which are particularly focusing on smaller firms. In the U.S., for example, the Coronavirus Aid, Relief, and Economic Security (CARES) Act includes specific measures for smaller businesses, such as forgivable loans or the Paycheck Protection Programme (USDT Citation2021; Garcia-Navarro and Mak Citation2020). In China, there are similar governmental relief measures for smaller firms (Cheng Citation2020). We assume that investors are aware of and reacting to the government aid programmes during the COVID-19 pandemic. As smaller firms receive external financial support, the negative financial consequences of the COVID-19 pandemic may be reduced. In sum, the specific advantages of smaller firms during the COVID-19 pandemic likely outweigh the general financial benefits associated with a larger firm size, potentially explaining our counter-intuitive finding.
With this study, we generally aim to empirically substantiate the interdisciplinary debate on the COVID-19 pandemic (e.g. Ardolino, Bacchetti, and Ivanov Citation2022; Sodhi, Tang, and Willenson Citation2022; Ivanov Citation2021; Choi Citation2021; Ketchen and Craighead Citation2020). Given that the COVID-19 pandemic presents a novel and unprecedented environment, our findings also add to the existing literature stream on the consequences of adverse supply chain events (e.g. Hendricks, Jacobs, and Singhal Citation2020; Zsidisin, Petkova, and Dam Citation2016; Bode and Wagner Citation2015; Hendricks and Singhal Citation2003). Identifying the factors that mitigate the negative impact of the COVID-19 disruptions may further add to the established stream on supply chain resilience (e.g. Liu et al. Citation2022; Kamalahmadi, Shekarian, and Parast Citation2022) and the concept of supply chain viability (e.g. Ivanov Citation2021; Ivanov and Dolgui Citation2020). As cost increases and revenue losses for firms are primarily related to ad-hoc restrictions and policies imposed to counter the spread of the virus, our study further adds to the emerging stream on regulatory and policy risks in operations and supply chain management (e.g. Cousins et al. Citation2020; Gaertner, Hoopes, and Williams Citation2020).
6.2. Implications for managers and policymakers
Our findings provide actionable insights that could guide managers to navigate the COVID-19 pandemic and prepare for future large-scale disruptions. Our post-hoc findings also support policymakers in their decision making, for example regarding financial support programmes.
First and foremost, we quantify the financial impact of the first wave of the COVID-19 pandemic, corresponding to an average loss of approximately $560 million in shareholder value for each sample firm. Consequently, we urge firms to be aware of the detrimental impact of such exogenous shocks that even threaten firm survival. Our findings demonstrate that preparedness is essential to mitigate the negative consequences of such events. Specifically, second, we emphasise the counterintuitive role of firm size. As our cross-sectional results indicate, it seems reasonable to not solely rely on common-held beliefs that larger firms have superior slack capabilities to overcome large-scale shocks. Third, we suggest that managers should consider evaluating and potentially reducing their firm's dependency on physical assets to optimise operational flexibility. We understand that physical assets are inherently important for production-intensive businesses, requiring plants and machinery. However, managing and adapting the current physical asset intensity can be beneficial for all firms. For example, renting contracts or sharing platforms may offer more flexible options to reduce the intensity of holding long-term physical assets. We correspondingly recommend to leverage such more flexible options. Fourth, shortening the trade cycle, for example by renegotiating payment terms with customers and suppliers, can enable a firm to quickly increase liquidity, which has shown to be crucial during the COVID-19 pandemic. A shortened trade cycle further increases supply chain efficiency. However, we caution managers to consider additional risks associated with pressuring a supplier in a weak economic state and carefully weigh benefits and drawbacks. Fifth, as we show the degree of vertical integration to partially mitigate the negative impact of the COVID-19 pandemic, we emphasise the importance of reducing the complexity of supply chains, in accordance with prior empirical studies (Bier, Lange, and Glock Citation2020; Bode and Wagner Citation2015; Ateş and Memiş Citation2021). While decreasing the degree of vertical integration is not a suitable short-term measure, managers should consider the potential risks during large-scale crises in their long-term decision making. We recommend managers to carefully evaluate a potential re-integration of critical business processes and to ensure the availability of critical supplies, for instance by reducing the dependency on more susceptible overseas sources. This is consistent with the current debate questioning the efficiency orientation of global supply networks, that can be at the expense of resilience (Shih Citation2020).
The results of our post-hoc analyses, exploring the macro and competitive environment effects on shareholder value during the COVID-19 pandemic, seem particularly relevant for policymakers. First, we find the shareholder value impact to be highly heterogeneous across different industries. For example, according to our analysis, firms in the Energy industry, specifically in the U.S. but also in China, experience the most negative impact on shareholder value, quite contrary to anecdotal evidence and public awareness. Policymakers should consider increasing the industry-specific granularity of support measures and policies. In contrast to a ‘scattergun’ approach, this may enhance the accuracy and effectiveness of public relief measures (Freund Citation2021). Second, also regarding the design of support measures, policymakers might take specific firm characteristics into account. For example, it might be particularly relevant to support firms whose business models heavily rely on physical assets. Manufacturing firms, for example, are strongly affected by the COVID-19 pandemic. Third, as suggested by our country-level post-hoc analysis, the negative impact on shareholder value significantly varies between U.S. and Chinese firms. While countermeasures and ad-hoc policies are enforced on a national level, people, goods and services move across international borders, emphasising the importance of international collaboration and policy coordination to mitigate the negative impact of the COVID-19 pandemic.
6.3. Limitations and future research
While this study takes a foray into exploring the financial consequences of the COVID-19 pandemic, and how firms can mitigate the negative impact, it is not without limitations. Our data covers a period of 100 trading days after the start of the pandemic, ending in early June 2020. While we sufficiently cover the entire course of the COVID-19 pandemic in China and the ‘first wave’ in the U.S., future research could examine the cumulative effects of subsequent ‘waves’, especially in the U.S. Assessing the first 100 trading days after the start of the COVID-19 pandemic, we take on a medium-term perspective. We encourage future research to assess the long-term financial implications of the COVID-19 pandemic. We also intentionally focus on firms in the U.S. and China.
As our findings indicate substantial differences in the impact on shareholder value between both countries, it might be particularly interesting for future research to expand the geographical scope. In this context, an examination of the stock market reaction to policy announcements (e.g. economic stimulus packages) might provide valuable insights, informing international policymakers on the effectiveness of specific countermeasures.
In our study, we intentionally focus on structure- and supply chain-related firm factors as mitigating factors, acknowledging that such factors may not be easily adjustable in the short-term. Consequently, we encourage future work to examine further actionable mitigating factors. We specifically emphasise the increasingly prominent role of digital technologies in facilitating resilience (G. Li et al. Citation2022; Ivanov, Dolgui, and Sokolov Citation2019). For instance, emerging technologies like blockchain or digital platforms can substantially increase supply chain visibility (G. Li et al. Citation2022; Klöckner, Schmidt, and Wagner Citation2022). Hence, we would expect digital capabilities to be another crucial mitigating factor against disruptions, warranting academic examination.
Finally, while we examine the impact and the mitigation of the COVID-19 pandemic, it might also be worthwhile to assess firm response and recovery effects. For instance, future quantitative research could investigate whether and how certain structure- or supply chain-related firm factors changed during the course of the COVID-19 pandemic, and in how far this facilitated firm resilience. Relatedly, future work could also identify and evaluate the factors that drive the speed of recovery.
Supplemental Material
Download PDF (286.5 KB)Disclosure statement
The authors report no conflict of interest.
Data availability statement
The data that support the findings of this study are available from Refinitiv Eikon. Restrictions apply to the availability of these data, which were used under license for this study. Data are available from the authors with the permission of Refinitiv Eikon.
Additional information
Notes on contributors

Maximilian Klöckner
Maximilian Klöckner is a Postdoctoral Researcher at the Chair of Logistics Management at the Swiss Federal Institute of Technology Zurich (ETH Zurich), Switzerland. His research interests include the implications of digitalisation initiatives in operations and supply chain management, supply chain disruptions, and crisis and risk management. His research has been published in operations and supply chain management journals, such as Production and Operations Management, Journal of Business Logistics, International Journal of Production Research, Transportation Research Part E: Logistics and Transportation Review, or Research-Technology Management.

Christoph G. Schmidt
Christoph G. Schmidt is a Senior Researcher and Lecturer at the Chair of Logistics Management at the Swiss Federal Institute of Technology Zurich (ETH Zurich), Switzerland. His research interests include supply chain risks and disruptions, sustainability, and digital technologies. His work has appeared in Production and Operations Management, Journal of Operations Management, Journal of Supply Chain Management, Journal of Business Logistics, International Journal of Production Research, Journal of Purchasing & Supply Management, and other journals.

Stephan M. Wagner
Stephan M. Wagner is Professor, holds the Chair of Logistics Management, and is Director of the HumOSCM Lab at the Swiss Federal Institute of Technology Zurich (ETH Zurich). Current research interests include the management of startups as suppliers, supplier innovation, digitalisation, supply chain sustainability, last-mile logistics, and humanitarian operations and supply chain management. His work has been published in management journals, such as the Academy of Management Journal, Journal of Management, or Journal of Business Research, as well as operations management journals, such as Production and Operations Management, Journal of Operations Management, Decision Sciences, Journal of Supply Chain Management, or Journal of Business Logistics.
Notes
1 https://coronavirus.jhu.edu/; Accessed: Jul 15, 2022
2 https://coronavirus.jhu.edu/; Accessed: Mar 25, 2022
4 https://coronavirus.jhu.edu/; Accessed: July 9, 2020
References
- Ali, I., A. Arslan, M. Chowdhury, Z. Khan, and S. Y. Tarba. 2022. “Reimagining Global Food Value Chains Through Effective Resilience to COVID-19 Shocks and Similar Future Events: A Dynamic Capability Perspective.” Journal of Business Research 141: 1–12.
- Ardolino, M., A. Bacchetti, and D. Ivanov. 2022. “Analysis of the COVID-19 Pandemic's Impacts on Manufacturing: A Systematic Literature Review and Future Research Agenda.” Operations Management Research 15: 551–566.
- Ateş, M. A., and H. Memiş. 2021. “Embracing Supply Base Complexity: The Contingency Role of Strategic Purchasing.” International Journal of Operations & Production Management 41 (6): 830–859.
- Ateş, M. A., R. Suurmond, D. Luzzini, and D. Krause. 2022. “Order From Chaos: A Meta-analysis of Supply Chain Complexity and Firm Performance.” Journal of Supply Chain Management 58 (1): 3–30.
- Bai, C., W. Gao, and J. Sarkis. 2021. “Operational Risks and Firm Market Performance: Evidence From China.” Decision Sciences 52 (4): 920–951.
- BBC. 2020a. “Coronavirus: Much of ‘the world's factory’ still shut.” (BBC News, February 10, 2020).
- BBC. 2020b. “Coronavirus: New Look Delays Supplier Payments ‘Indefinitely’.” (BBC News, April 3, 2020).
- Becker, M., D. Distel, H. Freund, and D. Herring. 2020. “Beyond COVID-19: Rapid Steps That Can Help Machinery and Industrial Automation Companies Recover.” McKinsey & Company, May 26 (2020).
- Bier, T., A. Lange, and C. H. Glock. 2020. “Methods for Mitigating Disruptions in Complex Supply Chain Structures: A Systematic Literature Review.” International Journal of Production Research 58 (6): 1835–1856.
- Bode, C., and S. M. Wagner. 2015. “Structural Drivers of Upstream Supply Chain Complexity and the Frequency of Supply Chain Disruptions.” Journal of Operations Management 36 (1): 215–228.
- Bode, C., S. M. Wagner, K. J. Petersen, and L. M. Ellram. 2011. “Understanding Responses to Supply Chain Disruptions: Insights From Information Processing and Resource Dependence Perspectives.” Academy of Management Journal 54 (4): 833–856.
- Boehmer, E., J. Musumeci, and A. B. Poulsen. 1991. “Event-study Methodology Under Conditions of Event-induced Variance.” Journal of Financial Economics 30 (2): 253–272.
- Bose, I., and A. C. M. Leung. 2019. “Adoption of Identity Theft Countermeasures and Its Short- and Long-term Impact on Firm Value.” MIS Quarterly 43 (1): 313–327.
- Broughton, K. 2021. “Some Companies are Taking Longer to Pay Suppliers Despite Recovery.” (The Wall Street Journal, June 7, 2021).
- Brown, S. J., and J. B. Warner. 1985. “Using Daily Stock Returns: The Case of Event Studies.” Journal of Financial Economics 14 (1): 3–31.
- Chatterjee, D., C. Pacini, and V. Sambamurthy. 2002. “The Shareholder-Wealth and Trading-Volume Effects of Information-Technology Infrastructure Investments.” Journal of Management Information Systems 19 (2): 7–42.
- Cheng, E. 2020. “China Extends Stimulus Measures for Small Businesses – a Sign the Recovery is Not Yet Complete.” (CNBC News, December 23, 2020).
- Chin, K., and S. E. Needleman. 2020. “Peloton, Pizza and Videogames Grow in Stay-at-Home World.” (The Wall Street Journal, November 5, 2020).
- Choi, T.-M. 2021. “Risk Analysis in Logistics Systems: A Research Agenda During and After the COVID-19 Pandemic.” Transportation Research Part E: Logistics and Transportation Review 145 (2021): Article ID 102190.
- Choi, T. Y., D. Rogers, and B. Vakil. 2020. “Coronavirus is a Wake-Up Call for Supply Chain Management.” (Harvard Business Review Digital Articles, March 27, 2020).
- Colias, M., and R. Bender. 2020. “Auto Giants Swing to Loss During Coronavirus-Driven Downturn.” (The Wall Street Journal, July 30, 2020).
- Collie, B., A. Wachtmeister, A. Waas, R. Kirn, K. Krebs, and H. Quresh. 2020. “COVID-19's Impact on the Automotive Industry.” (Boston Consulting Group, December 1, 2020).
- Cooper, R. G. 2021. “Accelerating Innovation: Some Lessons From the Pandemic.” Journal of Product Innovation Management 38 (2): 221–232.
- Cousins, P., M. Dutordoir, B. Lawson, and J. Q. F. Neto. 2020. “Shareholder Wealth Effects of Modern Slavery Regulation.” Management Science 66 (11): 5265–5289.
- Craighead, C. W., J. Blackhurst, M. J. Rungtusanatham, and R. B. Handfield. 2007. “The Severity of Supply Chain Disruptions: Design Characteristics and Mitigation Capabilities.” Decision Sciences 38 (1): 131–156.
- Craighead, C. W., D. J. Ketchen, Jr., and J. L. Darby. 2020. “Pandemics and Supply Chain Management Research: Toward a Theoretical Toolbox.” Decision Sciences 51 (4): 838–866.
- Cziraki, P., J. Mondria, and T. Wu. 2021. “Asymmetric Attention and Stock Returns.” Management Science 67 (1): 48–71.
- DOC. 2020. “Quarterly Retails e-Commerce Sales 3rd Quarter 2020.” U.S. Department of Commerce -- Census Bureau News, November 19, 2020.
- Dohmen, A. E., J. R. Merrick, L. W. Saunders, T. P. Stank, and T. J. Goldsby. 2022. “When Preemptive Risk Mitigation is Insufficient: The Effectiveness of Continuity and Resilience Techniques During COVID-19.” Production and Operations Management, forthcoming. doi: 10.1111/poms.13677.
- Dolgui, A., D. Ivanov, and B. Sokolov. 2018. “Ripple Effect in the Supply Chain: An Analysis and Recent Literature.” International Journal of Production Research 56 (1–2): 414–430.
- Dolgui, A., D. Ivanov, and B. Sokolov. 2020. “Reconfigurable Supply Chain: The X-network.” International Journal of Production Research 58 (13): 4138–4163.
- Duan, C., V. Grover, N. Roberts, and N. Balakrishnan. 2014. “Firm Valuation Effects of the Decision to Adopt Relationally Governed Business Process Outsourcing Arrangements.” International Journal of Production Research 52 (15): 4673–4694.
- El Baz, J., and S. Ruel. 2021. “Can Supply Chain Risk Management Practices Mitigate the Disruption Impacts on Supply Chains' Resilience and Robustness? Evidence From An Empirical Survey in a COVID-19 Outbreak Era.” International Journal of Production Economics 233 (2021): Article ID 107972.
- Fama, E. F., and K. R. French. 1998. “Value Versus Growth: The International Evidence.” The Journal of Finance 53 (6): 1975–1999.
- Felix, I., A. Martin, V. Mehta, and C. Mueller. 2020. “US Food Supply Chain: Disruptions and Implications From COVID-19.” (McKinsey & Company, July 2, 2020).
- Francis, T., and T. Gryta. 2020. “Coronavirus Shows Cash is King, Even for Biggest U.S. Companies.” (The Wall Street Journal, March 25, 2020).
- Freund, C. 2021. “Policy Support Can Help Firms Weather COVID-19, But Reach and Targeting Must be Improved.” (World Bank Blogs, January 19, 2021).
- Friedman, V., S. Maheshwari, and M. J. d. l. Merced. 2020. “J. Crew Files for Bankruptcy in Virus's First Big Retail Casualty.” (The New York Times, May 3, 2020).
- Gaertner, F. B., J. L. Hoopes, and B. M. Williams. 2020. “Making Only America Great? Non-U.S. Market Reactions to U.S. Tax Reform.” Management Science 66 (2): 687–697.
- Garcia-Navarro, L., and T. Mak. 2020. “Who is Watching Over Coronavirus Bailout Spending?” (NPR, April 19, 2020).
- Gault, B. 2020. “TK Maxx Extends Payment Terms.” (Drapers Online, April 6, 2020).
- Giannoccaro, I., and A. Iftikhar. 2022. “Mitigating Ripple Effect in Supply Networks: The Effect of Trust and Topology on Resilience.” International Journal of Production Research 60 (4): 1178–1195.
- Gort, M. 1962. Diversification and Integration in American Industry. Princeton: Princeton University Press.
- Govindarajan, V., and G. Bagla. 2020. “As COVID-19 Disrupts Global Supply Chains, Will Companies Turn to India?” (Harvard Business Review Digital Articles, May 25, 2020).
- Grube, C., S.-Y. Park, and J. Ruden. 2020. “Moving From Cash Preservation to Cash Excellence for the Next Normal.” (McKinsey & Company, September 29, 2020).
- Hart, C. 2020. “Fiat Chrysler Production at Risk Due to Coronavirus.” (Supply Management Digital Articles, February 7, 2020).
- Hau, H., M. Massa, and J. Peress. 2010. “Do Demand Curves for Currencies Slope Down? Evidence From the MSCI Global Index Change.” Review of Financial Studies 23 (4): 1681–1717.
- Hendricks, K. B., M. Hora, and V. R. Singhal. 2015. “An Empirical Investigation on the Appointments of Supply Chain and Operations Management Executives.” Management Science 61 (7): 1562–1583.
- Hendricks, K. B., B. W. Jacobs, and V. R. Singhal. 2020. “Stock Market Reaction to Supply Chain Disruptions From the 2011 Great East Japan Earthquake.” Manufacturing & Service Operations Management 22 (4): 683–699.
- Hendricks, K. B., and V. R. Singhal. 2003. “The Effect of Supply Chain Glitches on Shareholder Wealth.” Journal of Operations Management 21 (5): 501–522.
- Hendricks, K. B., and V. R. Singhal. 2005. “Association Between Supply Chain Glitches and Operating Performance.” Management Science 51 (5): 695–711.
- Hendricks, K. B., and V. R. Singhal. 2005. “An Empirical Analysis of the Effect of Supply Chain Disruptions on Long-run Stock Price Performance and Equity Risk of the Firm.” Production and Operations Management 14 (1): 35–52.
- Hendricks, K. B., and V. R. Singhal. 2009. “Demand-supply Mismatches and Stock Market Reaction: Evidence From Excess Inventory Announcements.” Manufacturing & Service Operations Management11 (3): 509–524.
- Hendricks, K. B., V. R. Singhal, and R. Zhang. 2009. “The Effect of Operational Slack, Diversification, and Vertical Relatedness on the Stock Market Reaction to Supply Chain Disruptions.” Journal of Operations Management 27 (3): 233–246.
- Iftikhar, A., L. Purvis, and I. Giannoccaro. 2021. “A Meta-analytical Review of Antecedents and Outcomes of Firm Resilience.” Journal of Business Research 135: 408–425.
- IMF. 2020. “GDP Report for Selected Countries and Subjects.” (International Monetary Fund: World Economic Outlook Database, October 7, 2020).
- Ivanov, D. 2018. Structural Dynamics and Resilience in Supply Chain Risk Management. New York: Springer.
- Ivanov, D. 2020. “Predicting the Impacts of Epidemic Outbreaks on Global Supply Chains: A Simulation-based Analysis on the Coronavirus Outbreak (COVID-19/SARS-CoV-2) Case.” Transportation Research Part E: Logistics and Transportation Review 136: Article ID 101922.
- Ivanov, D. 2020. “Viable Supply Chain Model: Integrating Agility, Resilience and Sustainability Perspectives–Lessons From and Thinking Beyond the COVID-19 Pandemic.” Annals of Operations Research, doi: 10.1007/s10479--020--03640--6
- Ivanov, D. 2021. “Supply Chain Viability and the COVID-19 Pandemic: A Conceptual and Formal Generalisation of Four Major Adaptation Strategies.” International Journal of Production Research 59 (12): 3535–3552.
- Ivanov, D. 2022. “Digital Supply Chain Management and Technology to Enhance Resilience by Building and Using End-to-end Visibility During the COVID-19 Pandemic.” IEEE Transactions on Engineering Management, forthcoming, doi: 10.1109/TEM.2021.3095193.
- Ivanov, D., and A. Dolgui. 2020. “Viability of Intertwined Supply Networks: Extending the Supply Chain Resilience Angles Towards Survivability. A Position Paper Motivated by COVID-19 Outbreak.” International Journal of Production Research 58 (10): 2904–2915.
- Ivanov, D., and A. Dolgui. 2021. “Stress Testing Supply Chains and Creating Viable Ecosystems.” Operations Management Research 15: 475–486.
- Ivanov, D., A. Dolgui, and B. Sokolov. 2019. “The Impact of Digital Technology and Industry 4.0 on the Ripple Effect and Supply Chain Risk Analytics.” International Journal of Production Research 57 (3): 829–846.
- Jacobs, B. W., and V. R. Singhal. 2017. “The Effect of the Rana Plaza Disaster on Shareholder Wealth of Retailers: Implications for Sourcing Strategies and Supply Chain Governance.” Journal of Operations Management 49–51 (1): 52–66.
- Jacobs, B. W., and V. R. Singhal. 2020. “Shareholder Value Effects of the Volkswagen Emissions Scandal on the Automotive Ecosystem.” Production and Operations Management 29 (10): 2230–2251.
- Kähkönen, A.-K., P. Evangelista, J. Hallikas, M. Immonen, and K. Lintukangas. 2022. “COVID-19 As a Trigger for Dynamic Capability Development and Supply Chain Resilience Improvement.” International Journal of Production Research, forthcoming, doi: 10.1080/00207543.2021.2009588
- Kamalahmadi, M., M. Shekarian, and M. Mellat Parast. 2022. “The Impact of Flexibility and Redundancy on Improving Supply Chain Resilience to Disruptions.” International Journal of Production Research60 (6): 1992–2020.
- Ketchen, D. J., and C. W. Craighead. 2020. “Research At the Intersection of Entrepreneurship, Supply Chain Management, and Strategic Management: Opportunities Highlighted by COVID-19.” Journal of Management 46 (8): 1330–1341.
- Khan, N. 2020. “New Virus Discovered by Chinese Scientists Investigating Pneumonia Outbreak.” (The Wall Street Journal, January 8, 2020).
- Klöckner, M., C. G. Schmidt, and S. M. Wagner. 2022. “When Blockchain Creates Shareholder Value: Empirical Evidence From International Firm Announcements.” Production and Operations Management 31 (1): 46–64.
- Kothari, S., and J. B. Warner. 2006. Econometrics of Event Studies. Vol. A. Amsterdam: Elsevier.
- Kovach, J. J., M. Hora, A. Manikas, and P. C. Patel. 2015. “Firm Performance in Dynamic Environments: The Role of Operational Slack and Operational Scope.” Journal of Operations Management 37 (1): 1–12.
- Kubota, Y., and Y. Wang. 2020. “Apple Supplier Foxconn, Hit by Coronavirus, Posts 90% Profit Drop.” (The Wall Street Journal, May 15, 2020).
- Kutner, M. H., C. J. Nachtsheim, J. Neter, and W. Li. 2005. Applied Linear Statistical Models. Vol. 5. New York: McGraw-Hill Irwin.
- Lamb, N., and R. Schikorra. 2020. “Dow Commits $3 Million to aid COVID-19 Relief Efforts and Adjusts Manufacturing Processes to Produce Hand Sanitizer.” (Business Wire, March 23, 2020).
- LeBeau, P., and N. Higgins-Dunn. 2020. “General Motors, Ford and Fiat Chrysler to Temporarily Close all US Factories Due to the Coronavirus.” (CNBC News, March 18, 2020).
- Lev-Ram, M. 2020. “Who Should be on Your COVID-19 Task Force?” (Fortune, May 25, 2020).
- Li, Y., X. Wang, T. Gong, and H. Wang. 2022. “Breaking out of the Pandemic: How Can Firms Match Internal Competence with External Resources to Shape Operational Resilience?” Journal of Operations Management, forthcoming, doi: 10.1002/joom.1176
- Li, G., J. Xue, N. Li, and D. Ivanov. 2022. “Blockchain-supported Business Model Design, Supply Chain Resilience, and Firm Performance.” Transportation Research Part E: Logistics and Transportation Review 163: Article ID 102773.
- Linton, T., and B. Vakil. 2020. “Coronavirus is Proving we Need More Resilient Supply Chains.” (Harvard Business Review Digital Articles, March 5, 2020).
- Liu, Z., M. Li, Y. Lei, and X. Zhai. 2022. “A Joint Strategy Based on Ordering and Insurance for Mitigating the Effects of Supply Chain Disruption on Risk-averse Firms.” International Journal of Production Economics 244: Article ID 108375.
- Lo, C. K., C. S. Tang, Y. Zhou, A. C. Yeung, and D. Fan. 2018. “Environmental Incidents and the Market Value of Firms: An Empirical Investigation in the Chinese Context.” Manufacturing & Service Operations Management 20 (3): 422–439.
- Malan, A. 2020. “Italian pupplier MTA Restarts Production After Coronavirus Stoppage.” (Automotive News Europe, March 6, 2020).
- McKinsey. 2020. “How COVID-19 has Pushed Companies Over the Technology Tipping Point – And Transformed Business Forever.” (McKinsey & Company, October 5, 2020).
- McWilliams, A., and D. Siegel. 1997. “Event Studies in Management Research: Theoretical and Empirical Issues.” Academy of Management Journal 40 (3): 626–657.
- Mitra, S., and V. Singhal. 2008. “Supply Chain Integration and Shareholder Value: Evidence From Consortium Based Industry Exchanges.” Journal of Operations Management 26 (1): 96–114.
- Mohammed, A., A. B. L. d. S. Jabbour, and A. Diabat. 2022. “COVID-19 Pandemic Disruption: A Matter of Building Companies' Internal and External Resilience.” International Journal of Production Research, forthcoming, doi: 10.1080/00207543.2021.1970848
- Monson, C. 2020. “What Small Businesses Need to Survive the Coronavirus Crisis.” (Harvard Business Review Digital Articles, March 27, 2020).
- Münch, C., and E. Hartmann. 2022. “Transforming Resilience in the Context of a Pandemic: Results From a Cross-industry Case Study Exploring Supply Chain Viability.” International Journal of Production Research, forthcoming, doi: 10.1080/00207543.2022.2029610
- Ni, J., B. B. Flynn, and F. R. Jacobs. 2016. “The Effect of a Toy Industry Product Recall Announcement on Shareholder Wealth.” International Journal of Production Research 54 (18): 5404–5415.
- Ovide, S. 2021. “How Big Tech won the pandemic.” (The New York Times, October 12, 2021).
- Patnayakuni, R., A. Rai, and N. Seth. 2006. “Relational Antecedents of Information Flow Integration for Supply Chain Coordination.” Journal of Management Information Systems 23 (1): 13–49.
- Raj, A., A. A. Mukherjee, A. B. L. de Sousa Jabbour, and S. K. Srivastava. 2022. “Supply Chain Management During and Post-COVID-19 Pandemic: Mitigation Strategies and Practical Lessons Learned.” Journal of Business Research 142: 1125–1139.
- Rapoza, K. 2020. “New Data Shows U.S. Companies are Definitely Leaving China.” (Forbes, April 7, 2020).
- Rauwald, C. 2020. “VW's Factory Shutdown is Costing $13 Million an Hour.” (Bloomberg, March 27, 2020).
- Rousseeuw, P. J., and A. M. Leroy. 1987. Robust Regression and Outlier Detection. New York: John Wiley & Sons.
- Ruel, S., and J. El Baz. 2022. “Disaster Readiness' Influence on the Impact of Supply Chain Resilience and Robustness on Firms' Financial Performance: A COVID-19 Empirical Investigation.” International Journal of Production Research, forthcoming, doi: 10.1080/00207543.2021.1962559
- Ruel, S., J. El Baz, D. Ivanov, and A. Das. 2021. “Supply Chain Viability: Conceptualization, Measurement, and Nomological Validation.” Annals of Operations Research. doi: 10.1007/s10479--021--03974--9
- Safdar, K. 2020. “Nike's Sales Bounce Back From Coronavirus Slide.” (The Wall Street Journal, September 22, 2020).
- Saïah, F., D. Vega, H. de Vries, and J. Kembro. 2022. “Process Modularity, Supply Chain Responsiveness, and Moderators: The Médecins Sans Frontières Response to the COVID-19 Pandemic.” Production and Operations Management, forthcoming, doi: 10.1111/poms.13696
- Salter, M., and W. Weinhold. 1979. Diversification Through Acquisition. New York: Free Press.
- Saul, J., S. Dowsett, and L. Baertlein. 2020. “Western Supply Chains Buckle as Coronavirus Lockdowns Spread.” (Reuters, March 23, 2020).
- Schmidt, C. G., D. A. Wuttke, G. P. Ball, and H. S. Heese. 2020. “Does Social Media Elevate Supply Chain Importance? An Empirical Examination of Supply Chain Glitches, Twitter Reactions, and Stock Market Returns.” Journal of Operations Management 66 (6): 646–669.
- Shen, Z. M., and Y. Sun. 2022. “Strengthening Supply Chain Resilience During COVID-19: A Case Study of JD.com.” Journal of Operations Management, forthcoming, doi: 10.1002/joom.1161
- Sherman, E. 2020. “94% of the Fortune 1000 are Seeing Coronavirus Supply Chain Disruptions: Report.” (Fortune, February 21, 2020).
- Shih, W. C. 2020. “Global Supply Chains in a Post-pandemic World.” Harvard Business Review 98 (5): 1–9.
- Shotter, J., R. Milne, and S. Fleming. 2020. “Flow of Goods Slows as Poland Tightens Borders.” (Financial Times, March 17, 2020).
- Shumsky, T., and N. Trentmann. 2018. “Delaying Payments to Suppliers Helps Companies Unlock Cash.” (The Wall Street Journal, June 28, 2018).
- Singh, S., R. Kumar, R. Panchal, and M. K. Tiwari. 2021. “Impact of COVID-19 on Logistics Systems and Disruptions in Food Supply Chain.” International Journal of Production Research 59 (7): 1993–2008.
- Sodhi, M. S., C. S. Tang, and E. T. Willenson. 2022. “Research Opportunities in Preparing Supply Chains of Essential Goods for Future Pandemics.” International Journal of Production Research, forthcoming, doi: 10.1080/00207543.2021.1884310
- Splitter, J. 2020. “COVID-19 and Truck Driver Shortage May Threaten Food Supply Chain.” (Forbes, March 18, 2020).
- Tielmann, A., and D. Schiereck. 2017. “Arising Borders and the Value of Logistic Companies: Evidence From the Brexit Referendum in Great Britain.” Finance Research Letters 20: 22–28.
- Trentmann, N. 2020. “Companies Adjust Earnings for COVID-19 Costs, but are They Still a One-Time Expense?” (The Wall Street Journal, September 24, 2020).
- USDT. 2021. “The Cares Act Provides Assistance to Small Businesses.” (U.S. Department of the Treasury, January 8, 2021).
- van Hoek, R. 2021. “Larger, Counter-intuitive and Lasting–The PSM Role in Responding to the COVID-19 Pandemic, Exploring Opportunities for Theoretical and Actionable Advances.” Journal of Purchasing and Supply Management 27 (3): Article ID 100688.
- Wahba, P. 2020. “Walmart's e-Commerce Sales Nearly Double as Shoppers go Beyond Groceries in Online Orders.” (Fortune, August 18, 2020).
- Wayland, M. 2020. “Coronavirus Crippled U.S. Auto Sales in 2020 But it Could Have Been far Worse.” (CNBC News, December 23, 2020).
- WHO. 2020. “Overview of Public Health and Social Measures in the Context of COVID-19.” World Health Organization, May 18, 2020.
- Wiengarten, F., D. Fan, C. K. Lo, and M. Pagell. 2017. “The Differing Impacts of Operational and Financial Slack on Occupational Safety in Varying Market Conditions.” Journal of Operations Management 52 (1): 30–45.
- Wood, L. 2020. “Fitness Equipment Sales Grow by 170% During Coronavirus Lockdown.” (Business Wire, May 7, 2020).
- Wooldridge, J. M. 2010. Econometric Analysis of Cross Section and Panel Data. 2nd ed. Boston: MIT Press.
- Worldbank. 2020. “Market Capitalization of Listed Domestic Companies (Current US$).” (The World Bank Database, October 7, 2020.
- Xu, S., X. Zhang, L. Feng, and W. Yang. 2020. “Disruption Risks in Supply Chain Management: A Literature Review Based on Bibliometric Analysis.” International Journal of Production Research 58 (11): 3508–3526.
- Yang, J., H. Xie, G. Yu, and M. Liu. 2021. “Antecedents and Consequences of Supply Chain Risk Management Capabilities: An Investigation in the Post-coronavirus Crisis.” International Journal of Production Research 59 (5): 1573–1585.
- Zsidisin, G. A., B. N. Petkova, and L. Dam. 2016. “Examining the Influence of Supply Chain Glitches on Shareholder Wealth: Does the Reason Matter?” International Journal of Production Research 54 (1): 69–82.