
 ?Mathematical formulae have been encoded as MathML and are displayed in this HTML version using MathJax in order to improve their display. Uncheck the box to turn MathJax off. This feature requires Javascript. Click on a formula to zoom.
ABSTRACT
China’s cotton textile industry is undergoing a critical period of digital transformation and upgrading to cope with pressure and challenges such as rising labour costs and large fluctuations in raw material prices. Developing a cost-based competitive advantage while ensuring a high-quality product is a critical problem in intelligent manufacturing. From the perspective of big data and reinforcement learning, the authors designed a reward value combining transaction, interaction, and measurement data by combining the reward mechanism and Markov decision for a combination of different raw materials in the intelligent textile factory. The authors propose a big data-driven application to the depth of the reinforcement learning to solve problems and build a big-data-driven matching model based on deep reinforcement learning to cotton matching. The offline strategy is designed to construct a memory bank and neural network, and the incentive mechanism of reinforcement learning is used to iterate the optimal yarn matching scheme to achieve the goal of intelligent cotton matching. The results show that deep reinforcement learning can be optimised using big data on the premise of quality assurance. Manufacturing costs can be optimised using a matching model of big data based on a deep reinforcement learning model.
1. Introduction
Intelligent manufacturing has become a compelling topic for researchers and industries worldwide (He and Bai Citation2021; Jung et al. Citation2020; Law, Lau, and Ip Citation2021; Roden et al. Citation2017; Wang et al., Citation2021). The intelligent development of Chinese textile enterprises is in a critical period of industrial transformation and upgrading. As the textile industry faces pressures and challenges, such as rising labour and energy costs and volatile raw material prices, more enterprises are transitioning to smart factories (Tian et al. Citation2021). Big data-driven technology provides an excellent opportunity for today’s manufacturing industry to transition from traditional textile manufacturing to intelligent manufacturing (Gholami, Nishant, and Emrouznejad Citation2021; Li et al., Citation2021a; Sultana et al. Citation2021).
At present, most cotton spinning enterprises have to bear inaccurate calculations of cotton yarn consumption per ton and low efficiency in statistics (Chengwei et al. Citation2021). In the production process of textile enterprises, raw materials account for more than 70% of the total cost. Cotton blending is an essential technical work closely related to product cost quality and enterprise economic benefit (Chen, He, and Shi Citation2014). Cotton blending is a resource allocation problem that is NP-hard (Bahreini, Badri, and Grosu Citation2021). From the initial manual experience of cotton matching to the current intelligent cotton matching, different kinds of heuristic algorithms have become mainstream, but these algorithms have not solved the optimal solution (Chen, He, and Shi Citation2014; Song and Li Citation2016). Particle swarm optimization (PSO) is used to optimise the objective function of cotton blending. The algorithm easily falls into the local optimal solution, which leads to the failure to find the globally optimal solution (Chen, He, and Shi Citation2014). The improved genetic algorithm solves the problem of weak global optimisation ability of automatic cotton blending and improves the optimisation and efficiency of cotton blending, but some indexes of cotton blending are not up to the standard (Song and Li Citation2016). For textile manufacturers, data-driven optimisation of the cotton blending model is critical, which is the focus of this study.
With the development of big data and artificial intelligence, the application of Reinforcement Learning (RL) in resource scheduling has become possible (Wang et al., Citation2021, Panzer & Bender, Citation2022). RL plays a role in solving the problem of resource allocation (Nussenbaum et al. Citation2020). The RL algorithm requires autonomous learning from experience collected by robots, in which many options are provided in defining goals or rewards (Ibarz et al. Citation2021). RL algorithms include policy-based algorithms and value-based algorithms. Cotton matching is the addition and subtraction of different kinds of cotton, which is a discrete action, so the value-based RL algorithm is suitable for cotton matching (Hwang et al. Citation2022). Value-based RL consists of value functions that map each state-action pair to the value of the best action with a maximum value. It works well when a finite set of actions maximises the cumulative return. Common value function-based RL algorithms include Q-learning, Deep Q-Learning (Tong et al. Citation2020), and SARSA (Wang et al., Citation2021). The policy-based RL approach does not directly optimise the policy using a value function but in a continuous or random action space to find a good scoring function to evaluate the maximum cumulative return of a policy (Yoo et al. Citation2021). Q-learning, a policy-based RL algorithm, is an adaptive local search method that transitions from one heuristic to another rationally and guided way, improving the local search ability (Qi et al. Citation2022). While deep RL, which combines RL and deep neural network (DNN) with many hidden layers, can be regarded as the basis for many successful applications of RL (Kuhnle et al. Citation2021). It combines deep learning and RL model characteristics, learns control methods from high-dimensional inputs, and can solve multi-dimensional complex motion problems (Li et al. Citation2022).
For existing matching models, many scholars have conducted research, such as similarity matching (Pang, Wang, and Xia Citation2022), two-sided matching (Chen et al. Citation2021), and dual scale matching (Ye et al. Citation2020). Among them, two-sided matching is used more, mainly to solve the problem of finding a suitable match between two groups of objects (Zhang et al., Citation2021b). In two-sided matching, it is crucial to adopt fuzzy preference (Li et al. Citation2020) and incomplete preference (Liang, He, and Xu Citation2020). However, these methods are generally model-driven, and the amount of data is not large, especially since the data dimension is not enough to verify the model (Liang, He, and Xu Citation2020). Big data-driven approaches can address the complexity of data, enhance reservoir representation, and accelerate historical matching (Hendraningrat et al. Citation2020). We propose a big data-driven decision-matching model for cotton matching based on Industry 4.0. Few scholars have adopted RL for decision optimisation in the cotton blending problem. Therefore, combined with the matching model driven by big data, the deep RL model was used to optimise the cotton blend.
In this paper, deep RL technology and big data-driven matching technology are used to optimise the cotton blending scheme of textile enterprises, which reduces the manufacturing cost of products and the error loss caused by the evaluation of empirical cotton blending by cotton blending engineers. Combining cotton supporting systems, cotton warehouse management systems, and yarn product management systems to realise a real intelligent enterprise needs to answer some research questions.
RQ1: How to reduce the cost of manufacturing enterprises under the premise of ensuring product quality?
RQ2: How to optimize the deep RL model with a big-data-driven matching model?
RQ3: How to optimize intelligent manufacturing cost by a big-data-driven matching model based on deep RL?
The rest of the paper is structured as follows. Section 2 reviews the previous literature and establishes an intelligent manufacturing cotton compounding optimisation model of a big-data-driven matching model based on deep RL. Section 3 outlines the research process, including data acquisition and model validation experiments. Section 4 presents the analysis of the experimental results. Section 5 summarises the contribution, limitation, and future research direction.
2. Literature review
2.1. Machine Learning and RL
The use of Machine learning (ML) has increased significantly in fields ranging from gaming to manufacturing (Cheng, Hu, and Wu Citation2021; Srivastava and Eachempati Citation2021; Xia et al. Citation2021; Zhang et al., 2021). In recent years, integrating ML techniques into meta-heuristic algorithms for combinatorial optimisation problems has attracted more and more research interest (Karimi-Mamaghan et al. Citation2021). For example, ten ML algorithms are used to optimise the performance of the task of identifying temperature anomaly alarms (Konovalenko and Ludwig Citation2021). Supervised learning and unsupervised learning of machine learning are mainly aimed at prediction problems (Khaled, Elsir, and Shen Citation2022). However, in the manufacturing industry, finding the optimal solution becomes the focus of the optimisation problem, and RL is very important to find the optimal solution (Perrusquía and Yu Citation2021).
The evolution of RL in ML has been a powerful driver of change in many industries, including intelligent healthcare finance technology, surveillance systems, and supply chains (Helo and Hao Citation2021; Lam et al. Citation2021; Liu, Ji, and Wei Citation2021; Rehman et al. Citation2021; Uniyal et al. Citation2021; Xanthidis and Xanthidou Citation2021). From a mathematical perspective, RL is usually implemented in the form of the Markov Decision Process (MDP), which models the decision process based on a set of state actions and rewards (Oliff et al. Citation2020). RL is usually applied without an accurate mathematical model of MDP, which is mainly a model-free method. Depending on the data available and the type of problem solved, neural networks allow problem-solving through reinforcement or supervised learning (Gama and Fernandes Citation2021). The combinatorial optimisation problem of cotton matching is also a process of finding the optimal solution. The RL method is better than the supervised machine learning method. We use the Deep Q Network(DQN) RL method to realise and evaluate the cotton blending planning scheme through virtual reality simulation.
2.2. Intelligent manufacturing
With the advent of the new generation of technology and the new industrial revolution, more and more countries have successfully launched strategies and plan to promote the intelligent development of manufacturing (Li et al., 2021). Unlike Industry 4.0, “Made in China 2025” starts from the weak points and faces the challenge of simultaneous improvement of competitiveness such as innovation, quality, and ecology (Wang, Wu, and Chen Citation2020). Smart manufacturing is receiving increasing attention as it can improve quality, increase productivity, reduce costs and increase manufacturing flexibility (He and Bai Citation2021). The booming development of intelligent manufacturing has spawned many advanced business models and new industries while injecting new vitality into the manufacturing industry (Müller, Buliga, and Voigt Citation2018).
At present, relevant researches mainly focus on intelligent equipment, intelligent products, intelligent manufacturing process, and management, among which intelligent manufacturing process and intelligent management have attracted more and more attention (Liu, Ji, and Wei Citation2021). In the intelligent manufacturing of textile enterprises, the linear model of optimisation parameter B is used to obtain the best blend ratio of composite yarn for the production of colour fabric, to meet the personalised needs of users, and create a better experience for users (Cui and Xue Citation2021). Most enterprises are still in the stage of digital transformation, and only a few have entered the stage of intelligent development. Some manufacturing enterprises use advanced technologies such as big data analytics and artificial intelligence to embed into the full lifecycle chain of products to enhance the degree of digitalisation (Akter et al. Citation2021; Huang, Chou, and Wu Citation2021; Li, Tan, and Chaudhry Citation2019; Varsha et al. Citation2021). As a result, production and services will become more rapid, low-cost, efficient, and personalised, thereby increasing added value and competitiveness (Hong et al. Citation2021; Patel et al. Citation2021; Yang and Yi Citation2021; Yoo and Roh Citation2021).
2.3. Cost optimization model of cotton blending
Natural fibers such as cotton, hemp, and silk are widely used in furniture, medical treatment, and clothing due to their light, soft and non-stick characteristics (Attia and Morsy, Citation2016). Cotton, one of the world’s most important crops, has also become a popular natural textile (Gao et al. Citation2021). Both the original manual experience of cotton blending and the current automatic cotton blending are restricted by the production cost and yarn quality of each group of cotton yarn ratio and cotton quality index, resulting in slow blending speed, high cost, and unstable yarn quality. Experts in the industry try to establish simplified optimisation models; the common optimisation of cotton blending is the automatic cotton blending model based on the PSO algorithm (Chen, He, and Shi Citation2014), the automatic cotton blending model based on a genetic algorithm (Song and Li Citation2016), mapping model of cotton data stretching algorithm and principal component analysis (Wu et al. Citation2019). Solving the determination of cotton ratio has always been a big problem in the field of the textile industry; this paper adopts RL modelling and uses the data-driven model to get the best cotton blending scheme.
At present, there are no perfect technical means to control and optimise cotton blending quality in textile enterprises. Some scholars have optimised the properties of textiles. The neural network and genetic algorithm are combined. The genetic algorithm considers the initial weights and thresholds of the backpropagation neural network, further improving the training speed and accuracy (Xiao et al. Citation2020). The convolutional neural network (CNN) and BP neural network are combined to optimise the yarn forming strength index, to better control the yarn forming quality (Hu, Zhao, and Wang Citation2018). Given the timing characteristic of the cotton yarn production process, the intensity of cotton yarn is optimised using a deep neural network (Hu, Zhao, and Wang Citation2020). RL Effective decision-making helps the organisation to accurately optimise the rewards and penalties of each decision so that it can meaningfully compare available options and take the action that will bring the greatest return (Bennett, Philippides, and Nowotny Citation2021). This paper uses data-driven deep RL to establish a cotton matching optimisation model to avoid failing to find the global optimal solution and find the lowest-cost cotton matching scheme for a certain yarn.
3. Model construction and evaluation
In this paper, the manual sorting and annotation of the data are firstly carried out, and the ML PCA is used to extract the attributes of the data. DQN algorithm of RL is used to construct three Dense layers and create an Agent and Environment. The state of each cotton blending proportion and price attribute is taken as the state, and the reciprocal of cotton blending cost is taken as the reward for iterative optimisation. To ensure quality, the cotton blending scheme provided has the lowest cost. Finally, the model is evaluated utilising RL of average score, and the model is judged according to the smoothness of curves.
3.1. Reward value design based on big data
The specific construction logic of big data in the reward mechanism design of deep RL is as follows:
A roughly specified reward function in achieving a simple goal problem is sufficient to obtain the desired behaviour (Arora and Doshi Citation2021). The design of the Reward value can affect the outcome of the objective optimisation problem because of the complexity of the Agent traversing the high-dimensional continuous state space to find the optimal policy with maximum payoff return (Zhang et al., 2021). From the perspective of big data, this paper divides big data into three dimensions: transaction data (TD), interaction data (ID), and measurement data (MD), and adds big data to the design of reward value (Amanullah et al. Citation2020; Wu et al. Citation2013), as shown in Formula (1):
(1)
(1) where α1, α2, and α3 represent the proportion of these three kinds of data in Reward.
We mainly choose the stock market and the manufacturing cost of experiment data, which is to pass the Agent to adjust action (plus and minus) to adapt to the environment to ensure the most value. Deep RL is used in a variety of production areas to help make it data-driven (Panzer and Bender Citation2022). We will apply big data to the design of the incentive mechanism. First, we analyse the stock market and the manufacturing enterprise cost data of three dimension data acquisitions.
The stock market is the problem of buying and selling according to the stock portfolio to obtain the maximum rate of return (Koratamaddi et al. Citation2021), while the cotton matching problem in the manufacturing industry is the problem of obtaining the minimum cost to meet the yarn conditions according to different cotton portfolios. In the final analysis, this is the optimal value problem of combinatorial optimisation. With the increasing popularity of stock market trading, powerful and fast computing technology has become a rich field worth exploring (Carta et al. Citation2021). Many algorithms use RL to improve stock returns (Koratamaddi et al. Citation2021; Wu et al. Citation2020; Xiong et al. Citation2018). This paper uses a big-data-driven matching model based on deep RL to study the stock return rate, and an adjusted reward is used to adjust the return rate. We select the public data set of stocks as transaction data, the latest stock prices of Oriental Fortune enterprises on The Website of Oriental Fortune as interaction data, and the Shanghai Stock Index on the website of Oriental Fortune as measurement data. Take the three types of big data and redesign the rewards. Using the expansion of the dimension of reward value data to correct the deviation of stock returns. We consider the current share price and the share price market to make the optimisation more realistic.
Analogies through fractal theory (Castillo and Melin Citation2020) apply a big-data-driven matching model based on deep RL to cotton blending models, both of which have transaction data as input. At the same time, it is a combination of different variables to optimise the problem so that the final revenue reaches the maximum value. The stock market has the highest returns, and cotton has the lowest combined cost price. According to the return value of a stock, the return value of the cotton blending model is designed by analogy. The paper data of textile enterprises are used as the transaction data, including the cotton supporting plans of textile enterprises in the past two years, from which the proportion of each cotton is calculated. We selected yarn prices on the official website of Aicaigou as interaction data; The cotton price given by the official website of China Cotton Textile Association and the cotton futures index given by Zhengzhou Cotton Trading market is used as the measurement data. We considered the influence of cotton price, cotton futures, and cotton yarn price on the cotton blending scheme. The Reward value of the cotton blending model was shown in Formula (2):
(2)
(2) where price represents the price of cotton; n represents the type of cotton; P represents the proportion of each cotton; Price represents the price of yarn, Index represents the futures Index of cotton; α1, α2, and α3 represent the proportion of these three data in the reward.
3.2. RL model design
3.2.1. Neural network
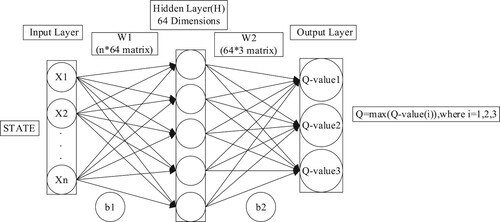
When using Q-learning, the Q table represents the Q value of the behaviour of each state, but if there are too many states, the table storage needs a lot of storage space. To reduce the use of storage space, a neural network is used to represent the Q table, high dimensional state input, and low dimensional action output. N-dimensional data is processed during input, after two full connection layers, the final output is the Q value containing each action, and the largest choice for action is selected.
The loss function of Q network training is the square of the difference between the real value and the estimated value, as shown in Formula (3):
(3)
(3) where Reward is the reward value, γ is the discount coefficient, S is the current state, a is the action in the current state, s′ is the next state, a′ is the action in the next state, ω is the network weight of the current Q, ω− is the network weight of the target Q. The estimate is Q (s, a; ω), which is the neural network’s output, as shown in Figure . Since neural network modelling is prone to overfitting, we set the probability of a 50% dropout for each neural network layer. At the same time, we also add a penalty term to the Loss function to realise L1 regularisation and reduce the overfitting of the neural network. The Loss function of the model is shown in Formula (4).
(4)
(4) L1 regularisation term refers to the sum of the absolute values of each element in the weight vector w, denoted as
.
Figure 1. Neural network.
3.2.2. DQN RL
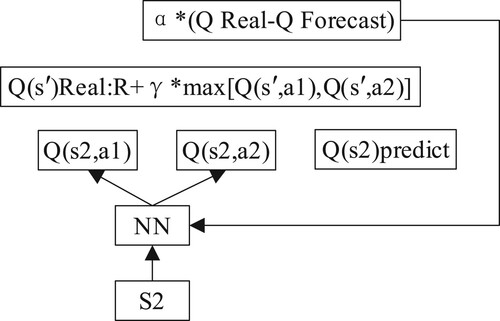
Offline strategy is a feature of Q-learning, which has also been extended in DQN. The true and estimated values calculated by Q-learning are the same. That’s using the same neural network. When the neural network is updated, the target value is also updated, which can easily lead to the divergence of parameters. In supervised learning, labels are fixed. It does not change as the parameters are updated. Another feature of the offline learning strategy is to build a memory bank for learning past experiences. It can learn from current experiences, past experiences, and even other people’s experiences. So when DQN is updated, we can all randomly select previous experiences to learn from. Random extraction disturbs the correlation between experiences and makes neural network updating more effective.
From a mathematical point of view, RL is usually implemented in the form of MDP, which models the decision process based on a set of states, actions, and rewards. MDP assumes that an agent’s next state and reward depends only on its current state and action (Oliff et al. Citation2020). RL follows an MDP to find the optimal policy that maximises the cumulative value. RL is usually applied when there is no exact mathematical model of MDP, and it is mainly a model-free method. There are five main elements in an MDP (Barde, Yacout, and Shin Citation2019): the state space of the system; a state-based set of actions; the transition probability of the system; the maximum reward function for performing an action in a state; the discount factor that determines the compromise between current and future rewards.
Therefore, DQN introduces a target Q network based on the original Q network, which is used to calculate the target network. As with the Q network structure, the initial weights are the same. But the Q network is updated on each repeat, while the target Q network is updated at regular intervals. The target function of DQN is Rewardt+1 + γmax′aQ(St+1, a′; ω−). The neural network uses the weight of the ω− table Q network, which updates more slowly than ω, as shown in Figure .
Figure 2. DQN model.
3.2.3. Algorithm process
In a big-data-driven matching model based on deep RL, the algorithm steps of the cotton blending optimisation model are shown in Table .
Table 1. DQN algorithm flow table.
3.3. Big-data-driven research framework and model
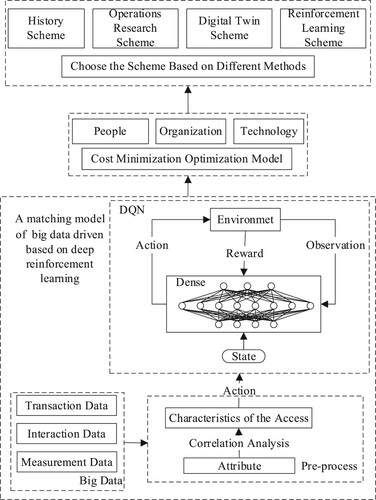
This paper considers the research framework from two perspectives of data-driven. Data-driven is based on massive data, including all structured and unstructured information, with high quantity, high speed, high diversity, and high accuracy (Majeed et al. Citation2021). Big data mainly includes transaction data and interaction data (Wu et al. Citation2013). The authors also selected measurement data to increase the dimension of big data. In this paper, the research framework of a big data model is proposed. The authors use the combination of big data-driven to optimise the model.
This paper analyses the NP-hard problem in cotton blending by processing the data of a textile enterprise in Wuhan, Hubei Province. Firstly, the raw material and data of cotton matching are obtained, the data is marked with attributes, and then principal component analysis (PCA) is carried out on the data. Each input is then passed to the agent, who passes the state to the environment, which gives the next state and returns a reward. The DQN algorithm of RL is adopted. Each input state outputs the value of each behaviour through the full connection layer of a neural network, and the largest Q value is passed to the agent as the output to find the cotton matching scheme with the lowest cost. This paper analyses the minimum cost optimisation scheme from three aspects of human organisation and technology under the premise of quality assurance. Finally, by comparing other cotton blending methods, we verify whether a matching model of big-data-driven based on deep RL can optimise the intelligent manufacturing cost and choose a suitable scheme for enterprises to make decisions. In this paper, the intelligent manufacturing optimisation model designed by the authors and based on a big-data-driven matching model based on deep RL is shown in Figure .
Figure 3. Intelligent manufacturing cotton blending optimisation of a big-data-driven matching model based on deep RL.
3.4. Evaluation index
In RL, average score and average Q value are usually used to evaluate RL algorithms. (1) Average score. When testing performance, the agent performs a certain number of steps, records all the reward values obtained by the agent, and averages them; (2) Average Q. We determine a certain number of state actions before testing performance. The Q values of the identified state-action pairs are averaged during testing, as shown in Formula. We can judge the merits and demerits of the algorithm model according to the smoothness of the score corresponding to the iteration episode changing with the number of episodes.
(4)
(4) The average score can well express the performance change of the algorithm in the training process due to the better performance evaluation of the algorithm, but the fluctuation is large. The average Q value method is proved to be more stable, but the performance expression of the algorithm is limited in the running process. Therefore, this paper adopts the average score method.
4. Experiment and model validation
This section will verify the effectiveness of a big-data-driven matching model based on deep RL through public data. By comparing with other methods, the cotton matching experiment with a big-data-driven matching model based on deep RL is verified. The code is written in Python and implemented based on the PyTorch framework. The operating environment is windows10 operating system, Intel(R) Core(TM) i7-10510u 1.80ghzcpu and NVIDIA GeForce MX330 GPU.
4.1. Data
The data of this paper come from the survey of textile enterprises in Wuhan, Hubei Province, and the China Cotton Information Association (https://www.china-cotton.org/). Through the interview and field visit with the leaders of textile enterprises, the process of spinning from raw material, flower cleaning, double twist, cotton carding, combing, strip rolling, pre-tail, roving, spinning, and winding was understood. Through cooperation with textile enterprises, obtain the paper version data of the “Material Exchange Notice” for cotton blending. Each cotton blending scheme included cotton blending time, spinning type, batch, type, and packaging quantity used. Using manual input, we electronically collated 16 months of data from March 2020 to June 2021, obtaining a total of 9,649 records. In the process of electrification of paper version data, the form of two partners with one person input and one person check is maintained, eliminating data errors caused by manual recording.
Second, we deal with the price of cotton. Since textile companies mainly use two types of cotton, long-staple and fine staple, the benchmark prices are used for each. Long-staple cotton mainly uses Xinjiang cotton; fine staple cotton includes Xinjiang cotton, American cotton, and Australian cotton. According to the cotton price data in January 2021 provided by the China Cotton Association, we concluded that Xinjiang cotton is about 6700 yuan/ton, American cotton is about 11062 yuan/ton, and Australian cotton is about 11891 yuan/ton. The benchmark price of US cotton is 1, that of Xinjiang cotton is 0.61, that of Australian cotton is 1.07, and that of long-staple cotton is 1.2. Table shows the variables of 60 and 80 yarns and the mean value of cotton before and after adjustment. In the yarn production process, according to the enterprise past cotton assorting process of former and later see, normally chosen is the same batches of the same cotton, very little is to use the same cotton of different batches Cotton price fluctuations in the process of cotton assorting the before and after adjustment negligible, thus this study does not consider before and after adjustment in the course of cotton assorting cotton price fluctuations. The proportion of each cotton requirement was calculated by the number of bales required for each blend, based on the top 25% of quality requirements in the Uster News Bulletin published in 2005. We selected 60 yarns as an example to experiment with in this paper to obtain the lowest-cost cotton blending scheme. There are altogether 426 cotton matching schemes. We removed the repeated cotton matching schemes and the cotton matching schemes using only one kind of cotton, leaving 177 cotton matching schemes in total.
Table 2. 60 and 80 yarns before and after adjustment variables and average cotton usage (After adjustment and Before adjustment).
4.2. Pre-processed and hyper-parameter selection
Firstly, the data is pre-processed. Due to data redundancy, the output results are easy to be over-fitted when a large amount of data is input, leading to inaccurate optimisation. We use correlation analysis to analyse the correlation of variables. Finally, the data after principal component factor analysis is the state of the input. In the process of the experiment, we partitioned the dataset with a ratio of 7:2:1 into:
40 yarn. Training Set = 31, Validation set = 80 and Testing set = 46, Total = 45
60 yarn. Training Set = 80, Validation set = 22 and Testing set = 12, Total 114
80 yarn. Training Set = 46, Validation set = 13 and Testing set = 7, Total 66
To ensure the reliability of later evaluation, the training set, validation set, and test set were divided into the form of random scattering, eliminating the dependence between data.
For deep learning models, hyper-parameters of the network model determine the complexity and learning ability of the model, which has a great impact on the performance of the model. Choosing appropriate hyper-parameters can make the loss function converge faster, and the prediction model with higher generalisation performance can be obtained more easily. Therefore, adjusting the hyper-parameters of the network is one of the important steps to make the deep learning model achieve this goal. In this paper, the grid search strategy is adopted. Firstly, the search space of hyper-parameters is set, and then the model is trained and verified for each group of possible hyper-parameter combinations. Finally, the optimal hyper-parameter configuration is obtained through performance evaluation. Table shows the range of hyper-parameters and the final selection of model parameters.
Table 3. Parameters used in the experiment.
4.3. Model validation of stock returns
4.3.1. Data set and parameter introduction
We selected the historical data of Guotai, a trading platform, to obtain the data from December 14, 2016, to August 30, 2018. The data set mainly includes 19 columns, including the opening price, closing price, highest price, lowest price, trading volume, advanced 5-day moving average, 10-day moving average, and other data to optimise the stock price. The input uses the average of the opening price, closing price, high price, and low price to ignore the effect of the stock’s movements.
4.3.2. Experimental results and analysis
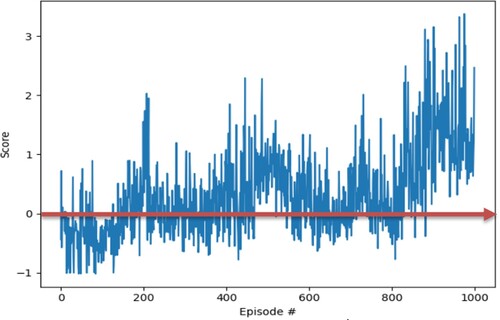
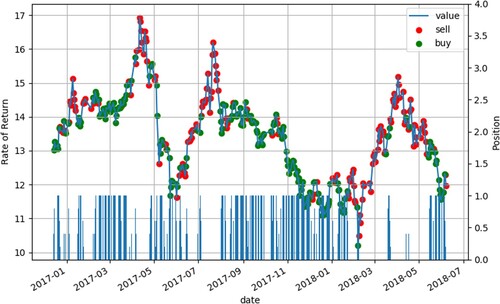
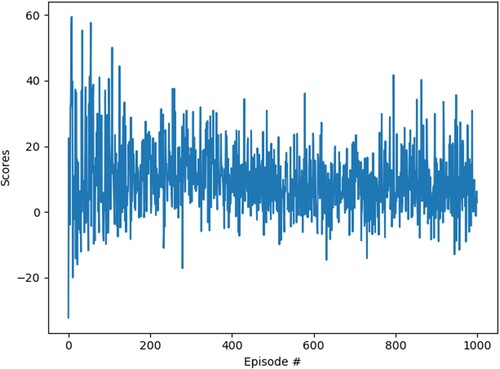
We analysed the results to verify the effectiveness of a big-data-driven matching model based on deep RL, as shown in Figure . After one thousand iterations, our research results show that taking the average of the last ten returns, the average annual return (defined as return function: R = BP is the buy price, SP is the selling price) is 33.87%. We conducted experiments based on the principle of 20% low entry and 20% high offer, and the actual stock purchase was based on the principle of buying low and selling high. We find that in the first 800 iterations, the revenue state is not very stable, with losses and profits co-existing. Having broken even after 800 trips, the robot agent has learned the principle of buying low and selling high.
Figure 4. Stock return prediction results.
According to the principle of buying low and selling high, the basic principle of buying low and selling high has been mastered using the matplotlib library for visualisation, as shown in Figure . Agent buys stocks when the price is low and sells them when the price is high, using the difference to make profits. We found that the stock price around March 2017 was low relative to the price in February and April, so we entered the position and sold at the high price in April to make a profit. In this paper, a big-data-driven matching model based on deep RL simulates human manipulation of stocks by learning the characteristics of stocks completely and conducting autonomous learning.
By using the smoothness of each iteration, the training effect accords with the characteristics of RL. Due to the continuous expansion of Replay Buffer and the existence of an e-exploration strategy, it does not converge strictly like traditional supervised learning but shows a convergence trend of oscillation, as shown in Figure .
Figure 5. Stock buying and selling chart.
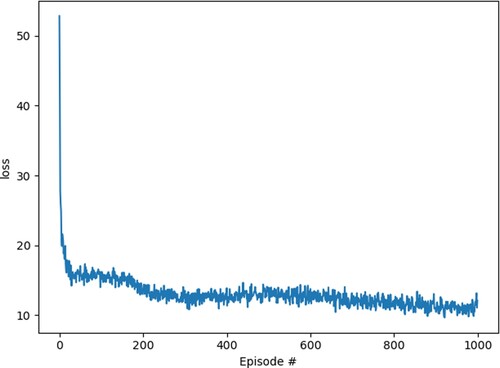
Next, we study the Q neural network model in RL, and we find that the Q neural network gets good convergence, as shown in Figure . Through gradient descent and other methods, the parameters of the network are updated so that the mean square error(MSE) loss becomes smaller and smaller until it converges. Our learning task is improving, the distance between the predicted value and the actual value is balanced, and the results of the RL model proposed by us also reach the optimal solution.
Figure 6. The smoothness of the stock data set.
We compared the final returns with other recent papers, as shown in Table . We found that our model had the highest annual returns when we used a big-data-driven matching model based on deep RL for stock trading. At the same time, we compared the annual stock recovery rate of the design without a big data-driven incentive mechanism, which was about 4.075% lower than that of the design with a big data-driven incentive mechanism. This verifies the effectiveness of big data-driven optimisation RL.
Table 4. Returns compared with other recent papers.
4.3.3. Robustness test
To analyse our model, we conducted a re-experiment with the historical transaction data of Yongyi Shares using the NetEase Financial Network (http://quotes.money.163.com/trade/lsjysj_603600.html?year=2021&season=4).
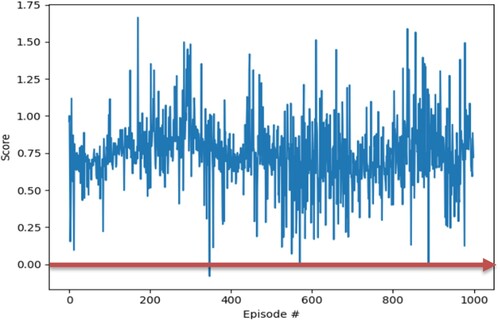
Figure shows the transaction data selected between November 4, 2020, to November 4, 2021. The results are as follows: We find an average annual return of 74.69%. On the premise that there is no big fluctuation in the data, the return rate of prediction using our model will be higher.
Figure 7. The loss values of the stock data set.
4.4. Example simulation and analysis
4.4.1. Principal component factor analysis
We take the 60 yarns of this textile enterprise as an example to carry out cotton blending and find the cotton blending scheme with the lowest price. We use correlation analysis to analyse the correlation of variables. Finally, the number of variables before and after tuning is reduced from 7 to 4. The original agricultural division of the eighth agricultural division, the sixth agricultural division, and the seventh Xinjiang cotton unified into Xinjiang cotton.
4.4.2. Analysis of simulation experiment results
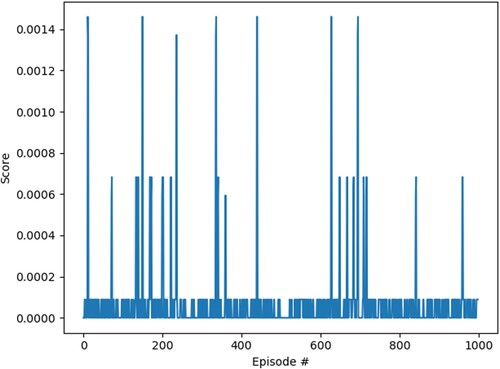
One thousand iterations of the data were carried out, and the experimental results are shown in Figure . At the end of each experiment, an optimal cotton blending scheme is given. But in the process of iteration, there will also be some prominent protruding phenomena. However, in the iterative process, cotton costs between 1.86225 and 1.86275 per two units of yarn required, which does not vary much. This shows that among 177 cotton blending schemes, the lowest cost cotton blending scheme suitable for 60 yarns without changing the quality is found.
Figure 8. Robust test of stock return prediction results.
According to the results of one thousand sets of iterations, we find that the optimal cotton blending method of 60 yarns in this enterprise is shown in Table 6 On the premise that the quality remains unchanged, we will use cotton with a low price for cotton blending, mainly Xinjiang cotton and American cotton. We find that Xinjiang cotton is used as the main cotton in this textile factory, and Australian cotton, American cotton, and long-staple cotton are used as auxiliary cotton for cotton blending. Secondly, in the process of cotton matching, if you want to improve the quality of yarn, it is necessary to increase the proportion of auxiliary cotton and reduce the proportion of the main cotton. For example, high-grade clothing products have higher requirements for yarn, and auxiliary cotton needs a higher ratio. Table shows that compared with 80 and 60 yarns, the average use of Xinjiang cotton decreases while the average use of Australian cotton, American cotton, and long-staple cotton increases in the cotton blending process. For low yarns, only Xinjiang cotton or Xinjiang cotton plus auxiliary cotton is used in the cotton blending process. At the same time, when intelligent manufacturing textile factories adopt this mode for cotton blending, they should also consider the inventory and type of cotton. Finally, the enterprise used the model we proposed to find the proportion of cotton matching that could not be observed by the cotton matching engineer in the actual operation. Based on the historical data of cotton dispensers in the past two years, we have found a cotton blending scheme that is lower than the original cost and 0.0049 per unit lower than the original manual cotton blending scheme by adjusting the ratio of cotton reasonably without changing the quality. Our quality assurance is the basic feature of RL, considering the resource allocation problem, and finally, the yarn quality can reach the top 25% standard of Uster News Bulletin (Lakhan et al. Citation2022; Yu et al. Citation2021). Since there is a certain gap between ideal data and actual operation, the lowest-cost cotton matching scheme is used to conduct experiments in textile enterprises, and the experimental results are verified.
4.4.3. Performance analysis of simulation experiment
According to the evaluation index of RL, we find that the smoothness between each iteration is between 0 and 0.012 (smoothness less than 0.3 indicates that the model is good). It shows a convergent trend of oscillation convergence, which shows that the model conforms to the characteristics of RL and has good learning ability. This model has the characteristics of a better RL model, and its smoothness is lower than that of an excellent model, as shown in Figure .
Figure 9. Cotton blending experiment results.
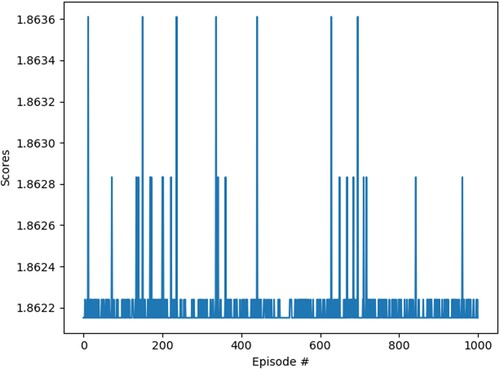
Figure 10. Performance evaluation of cotton blending model.
We compared the scheme with the highest price in cotton blending and the scheme with the lowest price in our model, and the result is shown in Table .
Table 5. Optimal cotton blending scheme and price comparison of different cotton blending schemes before and after adjustment.
Without considering the loss, we assume that an enterprise needs to order 60 yarns per ton. In the case of a high-cost cotton blending scheme, we need 1785.5 yuan of cotton; in the case of a low-cost cotton blending scheme, we need 1231 yuan, with a difference of 554.5 yuan. If more weight of yarn is needed, there will be greater profits. Cost reduction can ensure the quality and improve the level of intelligent manufacturing of enterprises and promote the development of enterprises towards automation and digitalisation. We consider the change of the lowest-cost cotton blending scheme under the influence of the futures index and yarn index.
5. Conclusions
This paper starts from textile enterprises of intelligent manufacturing and uses the method of RL to reduce the yarn cost without changing the quality and find the cotton blending scheme with the lowest cost of each yarn (adjust the proportion of each cotton added).
5.1. Theoretical contribution
This paper overcomes the subjectivity of manual reading and manual labelling in supervised learning and the large clustering error of unsupervised learning. RL algorithm is used to analyse the data, which is more objective and convenient. Based on quality assurance, a big-data-driven matching model is designed to optimise deep RL. The deep RL model driven by the big data model is used to optimise the intelligent manufacturing cost (Chen, He, and Shi Citation2014; Song and Li Citation2016). This model adopts a DQN algorithm combining RL and deep learning, which differs from the supervised and unsupervised methods in the previous deep learning. The agent constantly interacts with the environment through the reward mechanism to find the lowest price cotton blending scheme. This expands the field of application of RL (Tao et al. Citation2021). The offline strategy is designed to construct a memory bank and neural network, and the incentive mechanism of RL is used to iterate the optimal yarn matching scheme to achieve the goal of intelligent cotton matching. Using a big-data-driven matching model based on RL is beneficial to solve the problem of cotton blending and puts forward a new model for the intelligent manufacturing industry in China. This model provides a new technical research direction for the development of intelligent manufacturing in China and promotes the development of China’s manufacturing industry (Li et al., 2021).
From the perspective of big data and RL, we designed a Reward value combining transaction data interaction data, and measurement data and combining the Reward mechanism and Markov decision (Arora and Doshi Citation2021). This paper constructed an optimisation model of cotton blending intelligent manufacturing based on a big-data-driven matching model (Liang, He, and Xu Citation2020). Given the combination of different raw materials in an intelligent textile factory, how to reduce the cost of manufacturing enterprises to ensure product quality is proposed to apply big-data-driven deep RL to solve the problem.
5.2. Practical contribution
First of all, the textile enterprises are investigated on the spot, and a large number of obtained data are manually screened, sorted, and cleaned. The correlation analysis of data is carried out through Python code to remove redundant attributes and reduce the number to have a minimal impact on the final optimisation accuracy. Secondly, the DQN algorithm in RL is used for iteration. Under the premise of not changing the quality, we look for the lowest cost cotton matching scheme for each kind of yarn and find that both main cotton and auxiliary cotton play an important role in the matching. For the country, it is necessary to promote the development of the country towards industry 4.0 (Wang, Wu, and Chen Citation2020) to integrate with the international community. For textile enterprises, using this model can reduce the production cost of textile products and the labour cost of cotton distribution engineers and realise intelligent textile enterprises. It is beneficial for textile enterprises to develop toward intelligent manufacturing and promote the digital transformation of enterprises. For the employees of textile enterprises, applying this model in textile enterprises will reduce the number of workers so that some workers are forced to be laid off and unemployed, and the employment pressure in the country increases. However, the on-duty employees can use the model to guide the cotton blending scheme, improve their working environment, reduce the inaccurate cotton blending problem caused by subjective errors, reduce workload and improve efficiency. For consumers, reducing the cost of textile enterprises may reduce the goods purchased by consumers and their purchasing pressure.
5.3. Limitations and future research directions
This paper uses a big-data-driven matching model based on deep RL to build an optimisation model of cotton blending. Under the same quality condition, the lowest cost cotton blending scheme of each yarn is found. However, the model only has a new method in each yarn’s lowest-cost cotton blending scheme, and the accuracy needs to be improved. At the same time, this model also needs to consider the storage problems of the warehouse. Future research can explore the application of RL in cotton blending and provide research methods for the intelligent development of textile enterprises.
Data availability statement
The authors confirm that the data supporting the findings of this study are available within the article and its supplementary materials.
Disclosure statement
No potential conflict of interest was reported by the author(s).
Additional information
Funding
Notes on contributors

Huosong Xia
Xia Huosong is a professor in the school of management at Wuhan Textile University. He graduated from Huazhong University of Science and Technology of China and was a visiting scholar at Eller College of Management of the University of Arizona, USA, from 2006 to 2007. His main research interests are: knowledge management, data mining, e-commerce and logistics information systems, and Fintech. He has published over 100 papers in refereed journals, book chapters, and conferences, such as Journal of Knowledge Management, Decision Support Systems, International Journal of Knowledge Management, Knowledge Management Research & Practice, Electronic Commerce Research, Electronic Markets, Journal of Computer Information Systems, Enterprise Information Systems, Production Planning & Control, Annals of Operations Research, Socio-Economic Planning Sciences, Expert Systems With Applications, International Journal of Ad Hoc and Ubiquitous Computing, International Journal of Innovation Science, Information Discovery and Delivery, International Journal of Management, Journal of Systems Science and Information, Technology Analysis & Strategic Management, Journal of Grey System, Financial Innovation, etc. He has obtained research funding for five projects, including those from National Social Science Foundation of China and National Science Foundation of China. E-mail: [email protected]

Yuan Wang
Yuan Wang is a graduate student in the school of management at Wuhan Textile University. She holds a Bachelor's degree in Computer Science and Technology. Her main research interests are Fintech, knowledge management, data mining, and e-Commerce. Email: [email protected]

Sajjad Jasimuddin
Sajjad M. Jasimuddin is Professor (Professeur senior) at the Kedge Business School, France, and is visiting Professor at Center for Advanced Studies in Management and Economics (Portugal), Renmin University of China, and Dalian University of Foreign Language (China). Previously, he taught at Aberystwyth University (UK), Southampton University (UK), King Abdulaziz University (Saudi Arabia), and University of Dhaka (Bangladesh). He received MCom from Dhaka University, MPhil from Judge Business School at Cambridge University (Trinity College), and PhD from Southampton University. He is Associate Editor of the Journal of Global Information Management, an Sajjad has authored a textbook, fifteen chapters, and 110 articles- appeared in European Journal of Operational Research, International Business Review, Information Systems Journal, Technological Forecasting & Social Change, Annals of Operational Research, Production Planning & Control, Electronic Markets, Journal of Operational Research Society, European Management Journal, Journal of Innovation & Knowledge, Annals of Regional Science, Thunderbird International Business Review, Information Systems Management, Supply Chain Forum: An International Journal, Management Decision, Journal of Business & Industrial Marketing, International Journal of Technology and Human Interaction, International Journal of Organizational Analysis, International Journal of Information Management, Journal of Global Information Management Industrial Management & Data Systems, Journal of Information & Knowledge Management, Journal of Knowledge Management, VINE, Knowledge & Process Management, Knowledge Management Research & Practice. Email: [email protected]

Justin Zuopeng Zhang
Justin Zhang is a faculty member in the Department of Management at University of North Florida. He received his Ph.D. in Business Administration with a concentration on Management Science and Information Systems from Pennsylvania State University, University Park. His research interests include economics of information systems, knowledge management, electronic business, business process management, information security, and social networking. He is the editor-in-chief of the Journal of Global Information Management, an ABET programme evaluator, and an IEEE senior member. Email: [email protected].

Andrew Thomas
Andrew Thomas is a Professor of Engineering Management and Head of Aberystwyth Business School. He entered academia in 2002 having followed an industrial career initially with the Royal Air Force and then later with BE Aerospace where he undertook roles in aerospace, manufacturing and production engineering. He has held positions at a number of levels in Higher education including; Lecturer/Senior Lecturer and Research Fellow and management positions as Associate Dean, Dean, Head of School and Director. As Head of School he is responsible for the effective delivery of teaching, learning, research and technology/knowledge transfer activities in the School. His main research interests include; forensic engineering, maintenance management, engineering management, manufacturing strategy and operations management and has published over 200 research articles, journal papers and delivered a number of key note speeches in these areas. He has supervised and led over twenty KTP projects and managed a number of ERDF, EPSRC and EU FP7 projects. He is currently Chair of the Consortium of Manufacturing and Engineering (COMEH) http://epc.ac.uk/comeh-committee/ and a member of the Engineering Professors Council (EPC UK). Hes is also Editor In Chief of the: International Journal of Collaborative Engineering https://www.inderscience.com/jhome.php?jcode=ijce and also a member of the Editorial Board of: MDPI Sustainability https://www.mdpi.com/journal/sustainability, and for Standards Standards (mdpi.com).
References
- Akter, S., Y. K. Dwivedi, K. Biswas, K. Michael, R. J. Bandara, and S. Sajib. 2021. “Addressing Algorithmic Bias in AI-Driven Customer Management.” Journal of Global Information Management (JGIM) 29 (6): 1–27. https://doi.org/10.4018/JGIM.20211101.oa3.
- Amanullah, M. A., R. A. A. Habeeb, F. H. Nasaruddin, A. Gani, E. Ahmed, A. S. M. Nainar, N. M. Akim, and M. Imran. 2020. “Deep Learning and Big Data Technologies for IoT Security.” Computer Communications 151: 495–517.
- Arora, S., and P. Doshi. 2021. “A Survey of Inverse Reinforcement Learning: Challenges, Methods and Progress.” Artificial Intelligence 103500. https://doi.org/10.1016/j.artint.2021.103500.
- Attia, N. F., and M. S. Morsy. 2016. “Facile Synthesis of Novel Nanocomposite as Antibacterial and Flame Retardant Material for Textile Fabrics.” Materials Chemistry and Physics 180: 364–372.
- Bahreini, T., H. Badri, and D. Grosu. 2021. “Mechanisms for Resource Allocation and Pricing in Mobile Edge Computing Systems.” IEEE Transactions on Parallel and Distributed Systems 33 (3): 667–682.
- Barde, S. R., S. Yacout, and H. Shin. 2019. “Optimal Preventive Maintenance Policy Based on Reinforcement Learning of a Fleet of Military Trucks.” Journal of Intelligent Manufacturing 30 (1): 147–161.
- Bennett, J. E., A. Philippides, and T. Nowotny. 2021. “Learning with Reinforcement Prediction Errors in a Model of the Drosophila Mushroom Body.” Nature Communications 12 (1): 1–14.
- Carta, S., A. Corriga, A. Ferreira, A. S. Podda, and D. R. Recupero. 2021. “A Multi-Layer and Multi-Ensemble Stock Trader Using Deep Learning and Deep Reinforcement Learning.” Applied Intelligence 51 (2): 889–905.
- Castillo, O., and P. Melin. 2020. “Forecasting of COVID-19 Time Series for Countries in the World Based on a Hybrid Approach Combining the Fractal Dimension and Fuzzy Logic.” Chaos, Solitons & Fractals 140: 110242. https://doi.org/10.1016/j.chaos.2020.110242.
- Chen, H., R. He, and G. Shi. 2014. “Optimization Design of Automatic Cotton Blending Process Parameters Based on Improved PSO Algorithm.” Journal of Textile Research 35 (06): 142–147.
- Chen, S. Q., L. Zhang, H. L. Shi, and Y. M. Wang. 2021. “Two-sided Matching Model for Assigning Volunteer Teams to Relief Tasks in the Absence of Sufficient Information.” Knowledge-Based Systems 232: 107495. https://doi.org/10.1016/j.knosys.2021.107495.
- Cheng, L., H. Hu, and C. Wu. 2021. “Spammer Group Detection Using Machine Learning Technology for Observation of New Spammer Behavioral Features.” Journal of Global Information Management (JGIM) 29 (2): 61–76. https://doi.org/10.4018/JGIM.2021030104.
- Chengwei, S., W. Gang, J. Lingxiao, and Z. Tonghua. 2021. “Research of Cotton Consumption Per Ton Yarn Accurate Calculation System in Cotton Spinning Enterprise.” Cotton Textile Technology 49 (597): 38–42.
- Cui, P., and Y. Xue. 2021. “An Intelligent Weavable Dyeing Method for the Environmentally-Friendly Dyeing of Fabric.” Alexandria Engineering Journal 60 (5): 4639–4649.
- Fung, Y.-I., T.-M. Choi, and R. Liu. 2020. “Sustainable Planning Strategies in Supply Chain Systems: Proposal and Applications with a Real Case Study in Fashion.” Production Planning & Control 31 (11-12): 883–902. https://doi.org/10.1080/09537287.2019.1695913.
- Gama, R., and H. L. Fernandes. 2021. “A Reinforcement Learning Approach to the Orienteering Problem with Time Windows.” Computers & Operations Research 133 (1): 105357. https://doi.org/10.1016/j.cor.2021.105357.
- Gao, D., X. Li, Y. Li, B. Lyu, J. Ren, and J. Ma. 2021. “Long-acting Antibacterial Activity on the Cotton Fabric.” Cellulose 28: 1221–1240.
- Gholami, R., R. Nishant, and A. Emrouznejad. 2021. “Modeling Residential Energy Consumption: An Application of IT-Based Solutions and Big Data Analytics for Sustainability.” Journal of Global Information Management (JGIM) 29 (2): 166–193. https://doi.org/10.4018/JGIM.2021030109.
- He, B., and K. J. Bai. 2021. “Digital Twin-Based Sustainable Intelligent Manufacturing: A Review.” Advances in Manufacturing 9 (1): 1–21.
- Helo, P., and Y. Hao. 2021. “Artificial Intelligence in Operations Management and Supply Chain Management: An Exploratory Case Study.” Production Planning & Control 33: 1573–1590. https://doi.org/10.1080/09537287.2021.1882690.
- Hendraningrat, L., I. H. B. A. Salam, N. Mohsin, T. S. Wah, M. Rinadi, and M. Sedaralit. 2020. “Enhancing and Accelerating Reservoir Modelling and History Matching of an Offshore Mature Oilfield with Geological and Production System Complexity Using Data-Driven Approach.” International petroleum technology conference, January. https://doi-org.uottawa.80599.net/10.2523IPTC-20109-Abstract
- Hong, L., H. Yu, Y. Yu, P. Liang, and J. Xu. 2021. “The Role of Customer-Task Fit between Service Interaction and Value Co-Creation: Evidence from China.” Journal of Global Information Management (JGIM) 29 (6): 1–15. https://doi.org/10.4018/JGIM.20211101.oa44.
- Hu, Z., Q. Zhao, and J. Wang. 2018. “The Prediction Model of Cotton Yarn Intensity Based on the CNN-BP Neural Network.” Wireless Personal Communications 102 (2): 1905–1916.
- Hu, Z., Q. Zhao, and J. Wang. 2020. “The Prediction Model of Cotton Yarn Quality Based on Artificial Recurrent Neural Network.” In International Conference on Applications and Techniques in Cyber Intelligence ATCI 2019. ATCI 2019. Advances in Intelligent Systems and Computing, edited by J. Abawajy, K. K. Choo, R. Islam, Z. Xu, and M. Atiquzzaman, Vol. 1017, 857–866. Cham: Springer. https://doi.org/10.1007/978-3-030-25128-4_105.
- Huang, C., T. Chou, and S. Wu. 2021. “Towards Convergence of AI and IoT for Smart Policing: A Case of a Mobile Edge Computing-Based Context-Aware System.” Journal of Global Information Management (JGIM) 29 (6): 1–21. https://doi.org/10.4018/JGIM.296260.
- Hwang, S., K. Lee, H. Jeon, and D. Kum. 2022. “Autonomous Vehicle Cut-In Algorithm for Lane-Merging Scenarios Via Policy-Based Reinforcement Learning Nested Within Finite-State Machine.” IEEE Transactions on Intelligent Transportation Systems 23: 1–13. https://doi.org/10.1109/TITS.2022.3153848.
- Ibarz, J., J. Tan, C. Finn, M. Kalakrishnan, P. Pastor, and S. Levine. 2021. “How to Train Your Robot with Deep Reinforcement Learning: Lessons We Have Learned.” The International Journal of Robotics Research 40 (4-5): 698–721.
- Jung, W. K., H. Kim, Y. C. Park, J. W. Lee, and E. S. Suh. 2020. “Real-time Data-Driven Discrete-Event Simulation for Garment Production Lines.” Production Planning and Control 33 (5): 1–12. https://doi.org/10.1080/09537287.2020.1830194.
- Karimi-Mamaghan, M., M. Mohammadi, P. Meyer, A. M. Karimi-Mamaghan, and E. G. Talbi. 2021. “Machine Learning at the Service of Meta-Heuristics for Solving Combinatorial Optimization Problems: A State-of-the-art.” European Journal of Operational Research 296 (2): 393–422.
- Khaled, A., A. M. T. Elsir, and Y. Shen. 2022. “TFGAN: Traffic Forecasting Using Generative Adversarial Network with Multi-Graph Convolutional Network.” Knowledge-Based Systems 249, 108990. https://doi.org/10.1016/j.knosys.2022.108990.
- Konovalenko, I., and A. Ludwig. 2021. “Comparison of Machine Learning Classifiers: A Case Study of Temperature Alarms in a Pharmaceutical Supply Chain.” Information Systems 100: 101759. https://doi.org/10.1016/j.is.2021.101759.
- Koratamaddi, P., K. Wadhwani, M. Gupta, and S. G. Sanjeevi. 2021. “Market Sentiment-Aware Deep Reinforcement Learning Approach for Stock Portfolio Allocation.” Engineering Science and Technology, an International Journal 24 (4): 848–859.
- Kuhnle, A., M. C. May, L. Schaefer, and G. Lanza. 2021. “Explainable Reinforcement Learning in Production Control of Job Shop Manufacturing System.” International Journal of Production Research 5812–5834. https://doi.org/10.1080/00207543.2021.1972179.
- Lakhan, A., M. A. Mohammed, O. I. Obaid, C. Chakraborty, K. H. Abdulkareem, and S. Kadry. 2022. “Efficient Deep-Reinforcement Learning Aware Resource Allocation in SDN-Enabled Fog Paradigm.” Automated Software Engineering 29 (1): 1–25.
- Lam, H. Y., Y. P. Tsang, C. H. Wu, and C. Y. Chan. 2021. “Intelligent E-Vendor Relationship Management for Enhancing Global B2C E-Commerce Ecosystems.” Journal of Global Information Management (JGIM) 29 (3): 1–25. https://doi.org/10.4018/JGIM.2021050101.
- Law, K. M., A. K. Lau, and A. W. Ip. 2021. “The Impacts of Knowledge Management Practices on Innovation Activities in High- and Low-Tech Firms.” Journal of Global Information Management (JGIM) 29 (6): 1–25. https://doi.org/10.4018/JGIM.20211101.oa41.
- Li, C., Y. Chen, and Y. Shang. 2021a. “A Review of Industrial big Data for Decision Making in Intelligent Manufacturing.” Engineering Science and Technology, an International Journal. https://doi.org/10.1016/j.jestch.2021.06.001.
- Li, F., W. Liu, and K. Bi. 2021b. “Exploring and Visualizing Spatial-Temporal Evolution of Patent Collaboration Networks: A Case of China’s Intelligent Manufacturing Equipment Industry.” Technology in Society 64: 101483. https://doi.org/10.1016/j.techsoc.2020.101483.
- Li, G., J. Tan, and S. S. Chaudhry. 2019. “Industry 4.0 and Big Data Innovations.” Enterprise Information Systems 13 (2): 145–147.
- Li, B., Y. Yang, J. Su, Z. Liang, and S. Wang. 2020. “Two-sided Matching Decision-Making Model with Hesitant Fuzzy Preference Information for Configuring Cloud Manufacturing Tasks and Resources.” Journal of Intelligent Manufacturing 31 (8): 2033–2047.
- Li, C., Y. Zhang, X. Gao, and Y. Luo. 2022. “Energy-Latency Tradeoffs for Edge Caching and Dynamic Service Migration Based on DQN in Mobile Edge Computing.” Journal of Parallel and Distributed Computing 166: 15–31.
- Liang, D., X. He, and Z. Xu. 2020. “Multi-attribute Dynamic Two-Sided Matching Method of Talent Sharing Market in Incomplete Preference Ordinal Environment.” Applied Soft Computing 93: 106427. https://doi.org/10.1016/j.asoc.2020.106427.
- Liu, B., M. Ding, S. Shaham, W. Rahayu, F. Farokhi, and Z. Lin. 2021. “When Machine Learning Meets Privacy: A Survey and Outlook.” ACM Computing Surveys 54 (2): 1–36.
- Liu, C., H. Ji, and J. Wei. 2021. “Smart Supply Chain Risk Assessment in Intelligent Manufacturing.” Journal of Computer Information Systems 62: 1–13.
- Majeed, A., Y. Zhang, S. Ren, J. Lv, T. Peng, S. Waqar, and E. Yin. 2021. “A Big Data-Driven Framework for Sustainable and Smart Additive Manufacturing.” Robotics and Computer-Integrated Manufacturing 67: 102026. https://doi.org/10.1016/j.rcim.2020.102026.
- Müller, J. M., O. Buliga, and K. I. Voigt. 2018. “Fortune Favors the Prepared: How SMEs Approach Business Model Innovations in Industry 4.0.” Technological Forecasting and Social Change 132: 2–17.
- Nussenbaum, K., M. Scheuplein, C. V. Phaneuf, M. D. Evans, and C. A. Hartley. 2020. “Moving Developmental Research Online: Comparing in-lab and Web-Based Studies of Model-Based Reinforcement Learning.” Collabra: Psychology 6 (1). https://doi.org/10.1525/collabra.17213.
- Oliff, H., Y. Liu, M. Kumar, M. Williams, and M. Ryan. 2020. “Reinforcement Learning for Facilitating Human-Robot-Interaction in Manufacturing.” Journal of Manufacturing Systems 56: 326–340.
- Pang, S., J. Wang, and L. Xia. 2022. “Information Matching Model and Multi-Angle Tracking Algorithm for Loan Loss-Linking Customers Based on the Family Mobile Social-Contact Big Data Network.” Information Processing & Management 59 (1): 102742. https://doi.org/10.1016/j.ipm.2021.102742.
- Panzer, M., and Bender B. 2022. “Deep Reinforcement Learning in Production Systems: A Systematic Literature Review.” International Journal of Production Research 60 (13): 4316–4341.
- Patel, S., Y. Chiu, M. S. Khan, J. Bernard, and T. A. Ekandjo. 2021. “Conversational Agents in Organisations: Strategic Applications and Implementation Considerations.” Journal of Global Information Management (JGIM) 29 (6): 1–25. https://doi.org/10.4018/JGIM.20211101.oa53.
- Perrusquía, A., and W. Yu. 2021. “Identification and Optimal Control of Nonlinear Systems Using Recurrent Neural Networks and Reinforcement Learning: An Overview.” Neurocomputing 438: 145–154.
- Qi, R., J. Q. Li, J. Wang, H. Jin, and Y. Y. Han. 2022. “QMOEA: A Q-Learning-Based Multiobjective Evolutionary Algorithm for Solving Time-Dependent Green Vehicle Routing Problems with Time Windows.” Information Sciences 608: 178–201.
- Rehman, I. H., A. Ahmad, F. Akhter, and A. Aljarallah. 2021. “A Dual-Stage SEM-ANN Analysis to Explore Consumer Adoption of Smart Wearable Healthcare Devices.” Journal of Global Information Management (JGIM) 29 (6): 1–30. https://doi.org/10.4018/JGIM.294123.
- Roden, S., A. Nucciarelli, F. Li, and G. Graham. 2017. “Big Data and the Transformation of Operations Models: A Framework and a new Research Agenda.” Production Planning & Control 28 (11-12): 929–944. https://doi.org/10.1080/09537287.2017.1336792.
- Song, C., and S. Li. 2016. “Optimization and Application of Automatic Cotton Blending Model Based on Improved Genetic Algorithm.” Journal of Textile Research 37 (09): 151–155.
- Srivastava, P. R., and P. Eachempati. 2021. “Intelligent Employee Retention System for Attrition Rate Analysis and Churn Prediction: An Ensemble Machine Learning and Multi-Criteria Decision-Making Approach.” Journal of Global Information Management (JGIM) 29 (6): 1–29. https://doi.org/10.4018/JGIM.20211101.oa23.
- Sultana, S., S. Akter, E. Kyriazis, and S. F. Wamba. 2021. “Architecting and Developing Big Data-Driven Innovation (DDI) in the Digital Economy.” Journal of Global Information Management (JGIM) 29 (3): 165–187. https://doi.org/10.4018/JGIM.2021050107.
- Tao, S., R. Qiu, Y. Ping, and H. Ma. 2021. “Multi-modal Knowledge-Aware Reinforcement Learning Network for Explainable Recommendation.” Knowledge-Based Systems 227: 107217. https://doi.org/10.1016/j.knosys.2021.107217.
- Tian, J., J. Vanderstraeten, P. Matthyssens, and L. Shen. 2021. “Developing and Leveraging Platforms in a Traditional Industry: An Orchestration and co-Creation Perspective.” Industrial Marketing Management 92: 14–33.
- Tong, Z., H. Chen, X. Deng, K. Li, and K. Li. 2020. “A Scheduling Scheme in the Cloud Computing Environment Using Deep Q-Learning.” Information Sciences 512: 1170–1191.
- Uniyal, S., S. K. Mangla, P. R. Sarma, M. Tseng, and P. Patil. 2021. “ICT as “Knowledge Management” for Assessing Sustainable Consumption and Production in Supply Chains.” Journal of Global Information Management (JGIM) 29 (1): 164–198. https://doi.org/10.4018/JGIM.2021010109.
- Varsha, P. S., S. Akter, A. Kumar, S. Gochhait, and B. Patagundi. 2021. “The Impact of Artificial Intelligence on Branding: A Bibliometric Analysis (1982-2019).” Journal of Global Information Management (JGIM) 29 (4): 221–246. https://doi.org/10.4018/JGIM.20210701.oa10.
- Wang, B., F. Tao, X. Fang, C. Liu, Y. Liu, and T. Freiheit. 2021. “Smart Manufacturing and Intelligent Manufacturing: A Comparative Review.” Engineering 7 (6): 738–757.
- Wang, J., H. Wu, and Y. Chen. 2020. “Made in China 2025 and Manufacturing Strategy Decisions with Reverse QFD.” International Journal of Production Economics 224: 107539. https://doi.org/10.1016/j.ijpe.2019.107539.
- Wang, H., Q. Yan, and S. Zhang. 2021. “Integrated Scheduling and Flexible Maintenance in Deteriorating Multi-State Single Machine System Using a Reinforcement Learning Approach.” Advanced Engineering Informatics 49: 101339. https://doi.org/10.1016/j.aei.2021.101339.
- Wang, J., D. Yang, K. Chen, and X. Sun. 2021. “Cruise Dynamic Pricing Based on SARSA Algorithm.” Maritime Policy & Management 48 (2): 259–282.
- Wu, X., H. Chen, J. Wang, L. Troiano, V. Loia, and H. Fujita. 2020. “Adaptive Stock Trading Strategies with Deep Reinforcement Learning Methods.” Information Sciences 538: 142–158.
- Wu, Q. E., Y. G. Gao, H. Chen, Y. H. Guo, and C. S. Fan. 2019. “An Algorithm for Establishing A Model of Optimal Cotton Blending.” Procedia Computer Science 154: 154–160.
- Wu, X., X. Zhu, G. Q. Wu, and W. Ding. 2013. “Data Mining with Big Data.” IEEE Transactions on Knowledge and Data Engineering 26 (1): 97–107.
- Xanthidis, D., and O. K. Xanthidou. 2021. “A Proposed Framework for Developing an Electronic Medical Record System.” Journal of Global Information Management (JGIM) 29 (4): 78–92. https://doi.org/10.4018/JGIM.20210701.oa4.
- Xia, H., W. An, Z. Zhang, and G. Liu. 2021. “Managing Production Systems with Machine Learning: A Case Analysis of Suzhou GCL Photovoltaic Technology.” Production Planning & Control 33: 1–14.
- Xiao, Q., R. Wang, S. Zhang, D. Li, H. Sun, and L. Wang. 2020. “Prediction of Pilling of Polyester–Cotton Blended Woven Fabric Using Artificial Neural Network Models.” Journal of Engineered Fibers and Fabrics 15: 1–8.
- Xiong, Z., X. Y. Liu, S. Zhong, H. Yang, and A. Walid. 2018. “Practical Deep Reinforcement Learning Approach for Stock Trading.” arXiv preprint arXiv:1811.07522. https://doi.org/10.48550/arXiv.1811.07522.
- Xu, L. D., and L. Duan. 2019. “Big Data for Cyber Physical Systems in Industry 4.0: A Survey.” Enterprise Information Systems 13 (2): 148–169.
- Yang, S., and Y. Yi. 2021. “Effect of Technological Innovation Inputs on Global Value Chains Status.” Journal of Global Information Management (JGIM) 29 (5): 37–54. https://doi.org/10.4018/JGIM.20210901.oa3.
- Ye, Z., Y. Wu, S. Wang, Y. Zhang, Y. Chen, W. Ke, and H. Sheng. 2020. “A Dual Scale Matching Model for Long-Term Association.” In Wireless Algorithms, Systems, and Applications. WASA 2020. Lecture Notes in Computer Science, edited by D. Yu, F. Dressler, and J. Yu, Vol. 12384, 653–665. Cham: Springer. https://doi.org/10.1007/978-3-030-59016-1_54
- Yoo, H., B. Kim, J. W. Kim, and J. H. Lee. 2021. “Reinforcement Learning Based Optimal Control of Batch Processes Using Monte-Carlo Deep Deterministic Policy Gradient with Phase Segmentation.” Computers & Chemical Engineering 144: 107133. https://doi.org/10.1016/j.compchemeng.2020.107133.
- Yoo, D., and J. J. Roh. 2021. “Value Chain Creation in Business Analytics.” Journal of Global Information Management (JGIM) 29 (4): 131–147. https://doi.org/10.4018/JGIM.20210701.oa6.
- Yu, L., C. Zhang, J. Jiang, H. Yang, and H. Shang. 2021. “Reinforcement Learning Approach for Resource Allocation in Humanitarian Logistics.” Expert Systems with Applications 173: 114663. https://doi.org/10.1016/j.eswa.2021.114663.
- Zhang, W., Q. Chen, J. Yan, S. Zhang, and J. Xu. 2021a. “A Novel Asynchronous Deep Reinforcement Learning Model with Adaptive Early Forecasting Method and Reward Incentive Mechanism for Short-Term Load Forecasting.” Energy 236: 121492. https://doi.org/10.1016/j.energy.2021.121492.
- Zhang, Z., J. Gao, Y. Gao, and W. Yu. 2021b. “Two-sided Matching Decision Making with Multi-Granular Hesitant Fuzzy Linguistic Term Sets and Incomplete Criteria Weight Information.” Expert Systems with Applications 168: 114311. https://doi.org/10.1016/j.eswa.2020.114311.
- Zhang, H., Q. Peng, J. Zhang, and P. Gu. 2021c. “Planning for Automatic Product Assembly Using Reinforcement Learning.” Computers in Industry 130: 103471. https://doi.org/10.1016/j.compind.2021.103471.
- Zhou, B., J. Bao, J. Li, Y. Lu, T. Liu, and Q. Zhang. 2021. “A Novel Knowledge Graph-Based Optimization Approach for Resource Allocation in Discrete Manufacturing Workshops.” Robotics and Computer-Integrated Manufacturing 71: 102160. https://doi.org/10.1016/j.rcim.2021.102160.
- Zhou, J., P. Li, Y. Zhou, B. Wang, J. Zang, and L. Meng. 2018. “Toward New-Generation Intelligent Manufacturing.” Engineering 4 (1): 11–20.