
 ?Mathematical formulae have been encoded as MathML and are displayed in this HTML version using MathJax in order to improve their display. Uncheck the box to turn MathJax off. This feature requires Javascript. Click on a formula to zoom.
Abstract
The use of Artificial Intelligence (AI) for predicting supply chain risk has gained popularity. However, proposed approaches are based on the premise that organisations act alone, rather than a collective when predicting risk, despite the interconnected nature of supply chains. This yields a problem: organisations that have inadequate datasets cannot predict risk. While data-sharing has been proposed to evaluate risk, in practice this does not happen due to privacy concerns. We propose a federated learning approach for collective risk prediction without the risk of data exposure. We ask: Can organisations who have inadequate datasets tap into collective knowledge? This raises a second question: Under what circumstances would collective risk prediction be beneficial? We present an empirical case study where buyers predict order delays from their shared suppliers before and after Covid-19. Results show that federated learning can indeed help supply chain members predict risk effectively, especially for buyers with limited datasets. Training data-imbalance, disruptions, and algorithm choice are significant factors in the efficacy of this approach. Interestingly, data-sharing or collective risk prediction is not always the best choice for buyers with disproportionately larger order-books. We thus call for further research on on local and collective learning paradigms in supply chains.
1. Introduction
Complex, international supply chains underpin the survival of much of our economy, supporting critical sectors such as food, defence, aerospace and automotive. Both high-impact-low-frequency and low-impact-high-frequency events that cause supply chain disruption are on the rise due to increased complexity and interdependence.Supply chain disruptions have been identified as a top business risk factor in a variety of industrial sectors and have been prioritised by numerous governments (Edward Citation2022). Recent studies highlight that efficiency oriented management paradigms are no longer applicable as they fundamentally assume continuous availability of resources, and question whether new paradigms are needed to function in an environment with long term resource shortages (Ivanov and Dolgui Citation2022a).
The field of supply chain risk management (SCRM) studies risk management techniques that aim to reduce risk exposure in supply chains. Proactive strategies are mainly targeted at risk mitigation and include actions such as increased safety stock, multi-sourcing, information sharing, collaboration, and contingent rerouting. Most of these studies mainly focus on trade offs between enhanced resilience and the costs of adding redundancies or flexibility in supply sources or in-house production. Reactive strategies are deployed after a disruption occurs, and include strategies such as dynamic pricing to counter demand, supply chain reconfiguration, operational rerouting (Ghadge, Dani, and Kalawsky Citation2012). However, a priori prediction of risk in supply chains remains an unsolved problem that has received little attention.
To that effect, while certain types of risk are impossible to predetermine (e.g. Covid-19), recently, researchers proposed the use of machine learning (ML) methods to predict supply chain risk in contexts where historical data is available (Brintrup et al. Citation2020). Other proposals included the deployment of ‘digital supply chain risk surveillance (DSCRS)’, where automated algorithms aid in improving supply chain visibility and the extraction of unwanted dependencies (Kosasih and Brintrup Citation2022; Brintrup et al. Citation2022), and monitoring news sources (Chae Citation2015). Applications of ML have thus far included the prediction of late deliveries, delivery windows, and delivery failures mainly using data from enterprise resource planning (ERP) systems (Brintrup et al. Citation2020). While not as high impact as a one-off, unexpected black swan event, delivery delays have slow and steady impact on business value, by aggregating at the supply chain level.
Extant research has shown that the use of supplier delivery data can achieve performances ranging between 70% and 80% accuracy in use cases that spanned automotive, aerospace, and defence (Brintrup et al. Citation2020). In all these cases however, risk prediction is conducted on data available to a single company, despite the supply chain being a network of interdependent organisations each of which only have partial visibility of the whole system (Christopher and Peck Citation2004). It is thus, not unreasonable to postulate increased data visibility could yield better risk prediction. While academics working in the field of SCRM have long argued that data-sharing would help make better forecasts and reduce the risk of stock outs or overproduction, organisations typically do not share data due to the fear of data being misused to gain a competitive advantage by others in the network (Ghosh and Fedorowicz Citation2008).
As the popularity of ML approaches in supply chain risk management grows, we postulate that a new approach from the field of artificial intelligence (AI) may help mitigate this concern, potentially opening up a new and promising avenue for predicting a priori risk and advancing the field of SCRM. This new approach, named federated learning (FL), was initially proposed by the Google AI team (McMahan and Brendan Citation2017), and aims to enable edge devices or data servers to collaboratively learn a shared model while keeping training data private. This approach solves the problem of data privacy and security by decoupling the ability of traditional ML from the need to pool all local datasets together in a device or a server. It also reduces communication costs as only model parameters are transmitted rather than raw data.
FL, having originated as a privacy preserving machine learning method in the field of mobile devices, offers methods that can enable collective learning in supply chains. FL enables nodes, in our case buying and selling companies, to share relevant predictive model parameters or intermediate training results to create locally useful sub-models, without the risk of organisational data being exposed and used opportunistically. FL is a new field in computer science, with applications in diverse fields such as healthcare and mobile devices, which achieved differing success rates, however has not yet been applied to supply chain risk prediction. Application of FL into supply chain risk prediction is non-trivial as its conceptualisation necessitates structured problem formulation, and an understanding of when it is better for supply chain members to predict risk alone, and when to do so collectively.
In this paper we aim to explore (i) whether federated learning approaches can be deployed on digital supply chain data effectively to address some of the supply chain risk prediction needs of organisations, and ((ii) when it is better for organisations to predict alone, and when would they benefit from a federated approach. We do so through a case study based approach where empirical datasets from three buyers in the engineering sector are used to predict delivery delays. The case study conducted is in the maritime engineering sector where, on average, buyers share 46% of their suppliers, on whom they would like to develop common risk models. We cross compare FL approaches to local-learning, where buyers develop models using their own data, and to centralised-learning, where buyers pool their data together. We explore how the performance of federated learning is moderated by local dataset size, amount of disruptions faced by a given company during Covid19, and the types of machine learning algorithm used. Our results show that the performance of the FL approach is close to local and centralised learning. However in comparison to centralised learning, FL offers the distinct advantage of data privacy preservation. In comparison to local learning, FL may offer better performance in cases where local datasets are not sufficient. We also find that supply chain members with large and balanced datasets can provide significant help to those members with small and imbalanced datasets through sharing predictive model parameters. Another interesting finding is that contrary to previous studies on supply chain data-sharing, the pooling of datasets is not always beneficial for all network members. For companies with large historical datasets, i.e. a long standing relationship with suppliers, data sharing adds noise to the local learning process, and specialised supplier information is lost, making inferences less accurate. On the other hand, they would still benefit from joining in a federated approach, when there are changes in the supply chain, such as the procurement of a new product from an existing supplier. In such cases, federated approaches may offer a balanced trade off where local and federated models are flexibly swapped, or heterogenously weighted when needed.
2. Background
2.1. Artificial intelligence for supply chain risk management and the role of data
As the field of Supply Chain Risk Management has gained increased attention due to recent world events, so did research that proposes AI based solutions to risk management (Dolgui and Ivanov Citation2021; Ivanov Citation2022a; Baryannis et al. Citation2019; Brintrup Citation2020; Ganesh and Kalpana Citation2022). Although in its infancy, extant proposals offer promise in addressing a number of long-standing risk concerns, such as improving visibility through automated supply chain mapping (Wichmann et al. Citation2020), prediction of disruptions (Brintrup et al. Citation2020), the use of digital surveillance (Kosasih and Brintrup Citation2022), bots that negotiate and reconfigure supply chains automatically in the face of disruptions (Xu, Mak, and Brintrup Citation2021), coupling intelligent event detection with supply chain stress testing (Ivanov and Dolgui Citation2022b).
Our contribution is primarily positioned within the context of AI in SCRM. Extant approaches within AI-based risk prediction have focussed on the use of datasets available to a singular company, primarily to predict disruptions. These include works of Brintrup et al. (Citation2020) who used ERP data from an aerospace manufacturer to predict order delays with a variety of classification algorithms such as Support Vector Machines, Logistic Regression, and Naïve Bayes. Li and Zeng (Citation2016) deployed Bayesian Network models for failure mode analysis. Rodgers and Singham (Citation2020) constructed a Bayesian Network to predict disruption impacts in a supply network. Badakhshan and Ball (Citation2022) used the CART algorithm to predict payment disruptions and identify the inventory and cash replenishment policies that minimise their impact. Barros et al. (Citation2022) developed a Random Forest based approach to estimate supply lead times for improved Safety Stock keeping.
Initial reports from this body of work are promising and point to increased SCRM capability for predicting disruptions through the use of AI technology. However these advances typically focus on building predictive models based on data from a singular company. As AI driven approaches necessitate the use of large datasets, the use of these advances become inevitably restricted to companies who have enough data to pursue disruption prediction. Companies may not be able to utilise these when they are at the initial stages of a relationship with their supplier, or when there are subtle changes in the relationship such as the procurement of a new product, or ordering from a new location, such that existing datasets become less relevant for new ordering patterns.
In such cases, a naïve proposal may be that companies share their data to enable better resilience. A large body of literature supports the notion of data-sharing in the context of supply chain disruptions (please see Duong and Chong Citation2020 for a recent review). While original studies on supply chain data sharing date back to bullwhip effect (Lee, Padmanabhan, and Whang Citation1997) and shortage gaming problems (Cachon and Lariviere Citation1999), the premise of data sharing has recently been highlighted as an important activity in building supply chain resilience (Pettit, Croxton, and Fiksel Citation2019).
In the context of SCRM, data sharing has the goal of facilitating learning from previous disruption events, and help assess risk common to all parties (Chen et al. Citation2019). Through a variety of empirical and simulation based studies, researchers showed that data sharing increases the system's abilities to deal with disruptions (Soni, Jain, and Kumar Citation2014; Chen and Huang Citation2021) by monitoring performance and identifying potential problems in supply chains (Macdonald et al. Citation2018). Having surveyed 157 papers in the last 20 years, Duong et al (2020) found that technological and information sharing practices may become a key factor in enhancing resilience, however, they highlight that technological mechanisms are often costly, and the main reason for not sharing information is underlying trust issues (Duong and Chong Citation2020). Lotfi et al. (Citation2013) further highlight that despite the reported advantages of data sharing, most practical approaches yielded limited success, because of the desire to maintain competitive advantage, concerns about confidentiality and opportunism, and questions about the reliability and accuracy of available data. Duong and Chong (Citation2020) call for innovations that reduce information sharing costs and help protect the privacy of information could lead to equal benefits for all supply chain partners.
A number of researchers studied how trust can be improved through technological innovations. Most recently, Chen and Huang (Citation2021) suggest the use of digital twins for members of a supply chain to feed data into one another (Chen and Huang Citation2021), suggesting that trust would emerge if companies observe the benefit of sharing of fast-streamed operational data. Hellwig et al. (Citation2022) proposed the use of blockchain technology to facilitate the sharing of ‘trustless’ information by ensuring anonymity of supply chain partners. Blockchain allows for tamper-proof permanent recording of encrypted data on a decentralised ledger, where records cannot be altered, and participants can remain anonymous. They test their proposals by building DISASTER, a game information sharing platform among competing retailers. A virtual market for trading tokens is then created, which represent claims on suppliers' capacities among (competing) retailers. By trading capacity on the virtual market, distribution of inventory is optimised prior to physical shipments, thereby facilitating more efficient operations may be achieved as compared with traditional transshipments. Reenacting the shortage game, Hellwig et al. (Citation2022) allow competing retailers to access historical information on average orders on their shared supplier. They find that decision makers act more strategically and closely to Nash equilibrium as a result. They also note a downside: increased data sharing leads to order inflation and have adverse consequences, resulting in inefficient planning.
Our contribution is complementary to this emerging strand of thinking. However, contrary to existing efforts, we ask: ‘What if we did not share data at all, but use a common prediction model, updated by competing members on the supply chain?’. The reasoning behind this question is the generalised premise that data-sharing may improve information asymmetric problems in SCRM, and the recent observation that perhaps more data does not create an efficient system after all (Hellwig et al. Citation2022).
We define information being shared as the common interpretation on supply chain system state. Information sharing allows each member's data to remain private, whilst ensuring that those members who engage in new transactions can benefit from each others' interpretation on supply chain system states. To illustrate this principle, we focus on delivery delays, where each buyer has access to a model on predicted supply delay, based on each members' unique relationship with the supplier so that predictions on risk can be collectively developed.
2.2. Federated learning
Initially proposed by the Google AI team, the key problem federated learning (FL) addressed was that when a centralised model is trained based on data originating from sources such as mobile phones or sensors, the training data typically remains distributed over the clients (McMahan and Brendan Citation2017). However sending personal data to a central server is problematic for confidentiality reasons. In FL, a mobile device downloads the current model from the cloud and improves it by learning from its own data. The improved model is then sent to the cloud, using encrypted communication, to be averaged with other mobile device updates for the shared model improvement. Thus FL enables collective learning without sharing raw data by decentralising the training of common predictive models. After being initially proposed for mobile keyboard input prediction in Android phones, Smith et al. (Citation2017) proposed to further leverage the relationship between clients, and cast the problem as an instance of multi-task learning (MTL) to derive local client models benefiting from similar ones. A popular follow on application area has been the Internet of Things (IoT) for sensor based predictive analytics (Lu et al. Citation2019; Savazzi, Nicoli, and Rampa Citation2020; Kwon et al. Citation2020; Yuan, Ge, and Xing Citation2020). In both mobile devices and IoT, local learning process benefits from an existing common model to start with.
Since its inception in 2017, the number of articles on FL research grew exponentially, to more than 5500 articles today. Researchers focused on trade offs between central and local training, prevention of data reconstruction by malicious attackers, reducing vulnerability to inference attacks (Choudhury et al. Citation2019), expansion of FL to other machine learning tasks. Non-mobile device applications included cross-institutional medical diagnosis (Sheller et al. Citation2020), forecasting hospitalisations in the USA (Brisimi et al. Citation2018; Dayan et al. Citation2021), credit risk (Kawa et al. Citation2019), fraud detection (Yang et al. Citation2019; Li et al. Citation2019), energy demand forecasting (Briggs, Fan, and Andras Citation2021; Tun et al. Citation2021), and pharmaceuticals discovery (Choudhury et al. Citation2019).
In this paper, we aim to explore how and to what extent an FL based approach can facilitate supply chain risk prediction, by cross-comparing scenarios where: buyers predict delays using their own data, buyers pool their data together to make predictions on supplier delays, and an FL approach where buyers train a common prediction model.
3. Federated learning for collective supply chain risk prediction
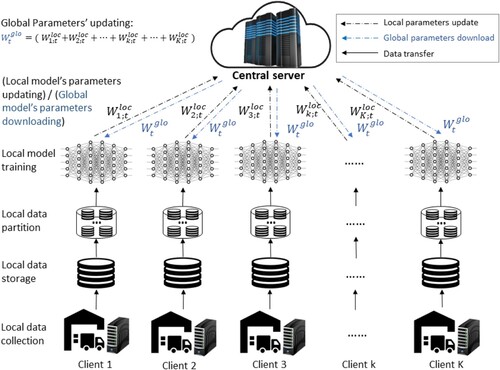
This section outlines the FL based approach for collective supply chain risk learning (Figure ). Our problem setting involves a number of buyers each of which have a historical dataset constituting previous transactions with their suppliers. Buyers have exclusive suppliers as well as suppliers they share with one or more other buyers (further detailed in Section 4). In this setting FL is used to create a common prediction model to estimate whether a given order will arrive later than planned, yielding what is known as a ‘classification’ problem (Brintrup et al. Citation2020). Delay prediction can be carried out using several machine learning problem formulations, which would determine the algorithmic approach that needs to be taken. For example, one could estimate the amount of delay that a given order may incur, the probability with which a delay might occur, or simply whether an order will be delayed or not. In order to contextualise our work within the widest literature possible, we opted to formulate delay prediction as a binary classification problem where a classifier algorithm classifies data into two non-overlapping classes. Hence we need to identify between delayed orders and on-time orders.
Figure 1. The framework of Federated Learning. Graphical illustration of the working principle of federated learning, consisting of a central server with a global model and k local servers with each having a local model and a local dataset. It starts from central server initialising global model's parameters to be downloaded by local servers as their local models' parameters, and then local models are trained on their own datasets before being used to update the global model.
As ordering patterns are heterogeneous, some buyers will have more information on a shared supplier's performance than others. The overarching question is thus, whether buyers who have less information can tap into a common predictive model to make better estimates, and if so, when is it better to use a common model and when to rely on local information, i.e. a predictive model trained by an individual buyer's data only. Thus we seek to explore whether and under what circumstances an FL based approach to order delay prediction yields beneficial results.
More formally, consider a global model stored in a central server and K local models, that are constructed from K buyers using their local datasets, (Figure ).
In this setting, each buyer contributes to global model updates, where describes local dataset k collected from the corresponding buyer k.
Each local dataset is further partitioned into M subdatasets with N samples, so as to ensure that each local model is trained on a different subdataset and at every update new data that is generated can be effectively utilised. i.e. is partitioned into
.
The global model training phase then commences, where:
The global model's parameters,
, are initialised on the central server.
Each buyer downloads the initialised global model's parameters, mapping them onto their first local model's parameters at t = 0. Each buyer then uses their own dataset to train this local model. Following training, the updated local model parameters are sent to the global model at
After being trained at
After the formulation of the above general approach to the application of FL in a supply chain setting, the next steps include the selection of a suitable machine learning algorithm, appropriate optimiser and loss function. As mentioned previously, a number of machine learning algorithms have been experimented with in FL research (Zhang et al. Citation2021) with differing success rates. Not all algorithms are suitable for FL. For example, tree-based methods create data leakage issues and need additional encryption, which increases computational cost. Algorithms need to be parameter based. We thus opt to use artificial neural networks (ANN) and convolutional neural networks with one dimensional kernels (CNN1D) due to their reported performance in recent FL studies, and logistic regression (LogReg) and multi-layer perceptron (MLP) as further benchmarks. Table shows the structures of four ML models under the framework of FL. As mentioned previously, we shall utilise these in a classification setting.
Table 1. Machine learning parameters used for developing FL.
ANN consists of three linear layers with 100 neurons each followed by the activation function of ‘ReLU’ (ReLU layer) and a batch normalisation layer (BatchNorm1D). ‘ReLU’ is used for accelerating the training process and avoiding the vanishing gradient problem (Nwankpa et al. Citation2021) while a BatchNorm1D is used for normalising the output from the ReLu layer and ensuring that the training process is stable. Extracted features are sent to a fully-connected layer followed by a ‘Sigmoid’ function for the final prediction. We set the number of neurons as 100 based on the best experimental result achieved from 50 to 500 neurons.
CNN1D is composed of a linear layer and two convolutional layers (CNN-1D) followed by the activation function of ‘ReLU’, a ‘AvgPooling’ layer (Pooling layer) and a batch normalisation layer each. The pooling layer aims to reduce the dimension of extracted features from ‘ReLU’ layer. Similar to ANN, a FC layer followed by ‘Sigmoid’ function is used for the final prediction. Considering the computational cost, we only use 32 kernels with kernel size as 7 for the first CNN-1D layer and 64 kernels with kernel size as 7 for the second CNN-1D layer. Due to defining our task as a binary classification, the FC layer for both ANN and CNN1D has 2 neurons.
LogReg contains two linear layers, one with 200 neurons and the other one with 2 neurons, to analyse the relationship between output and input features, followed by a logistic function, ‘Sigmoid’, at the end to squeeze the output of the second linear layer between 0 and 1, aiming to solve binary classification problems. The output in LogReg is a probability between 0 and 1 and can be used for classification problems while linear regression can work well for regression problems but is not suitable for classification problems.
MLP commonly consists of three layers: an input layer, a hidden layer and an output layer. In our case, we consider two linear layers with 100 neurons each as the input layer and hidden layer and a linear layer with 2 neurons as the output layer. Each linear layer is followed by a ‘ReLU’ layer. At the end, it is a ‘Sigmoid’ layer for final prediction.
For optimising local models, we follow (McMahan et al. Citation2017) and select the stochastic gradient decent (SGD) which has been popularly used in deep learning research (Taheri, Rastgarpour, and Koochari Citation2021). We use Cross Entropy Loss (Zhang and Sabuncu Citation2018) as the loss function for local model training while the loss for the global model is updated by averaging losses of all participant local models.
The training process is challenged by training imbalance, which refers to contexts where datasets are heterogeneously distributed across members of the FL. In imbalanced contexts, the classifier has access to more data from one node (ie. company), which may bias the learning process. Considering scenarios in the real world, we opt to train our FL approach in both balanced and imbalanced settings for cross-comparison. For balanced training, all local datasets and corresponding partitioned subdatasets are uniformly sizes. This means that both M and N are fixed, which ensures that each local model is updated equally by being trained on a randomly sampled subdataset of the same size at each round. For imbalanced training, all local datasets and corresponding partitioned subdatasets are heterogeneously sized. This means both M and N are dynamic, which enable each local model to be updated unequally after a given round. Next, we detail our case study.
4. Case study
Our case study originates from the maritime sector where complex engineering assets are produced. Three buyers share 70 suppliers, which constitute 47.54%, 39.04%, and 53.13% of their overall individual supply chains, as shown in Table . Each buyer would like to create a predictive model for estimating the delays associated with orders to aid production and inventory planning as well as conducting what-if scenarios. Although each buyer may develop a local predictive model using historical data that is available to them, they would like to explore whether a common predictive model on shared suppliers could improve predictive performance.
Table 2. Common statistical analysis of used datasets.
The data used spans orders delivered between 2015 and 2022. Considering the challenges brought by the Covid19 pandemic to global supply chains (Guan et al. Citation2020), we split each buyer's data into two phases, post-Covid19 and pre-Covid19, in order to explore how the results obtained by the FL approach are moderated by this large-scale disruption.
All buyers are located in United Kingdom where the first national lockdown started from March of 2020. Therefore, we define the duration of 12 March 2015 and 01 March 2020 as pre-Covid19 period and the duration of 02 March 2020 and 01 March 2022 as post-Covid19 period, and split data accordingly. As there are three buyers in total, six datasets are generated and used: three post-Covid19 datasets are labelled as C-Buyer1, C-Buyer2 and C-Buyer3 and three pre-Covid19 datasets are labelled as NC-Buyer1, NC-Buyer2 and NC-Buyer3, respectively.
4.1. Data preprocessing
First, a number of data-preprocessing steps have been applied to remove incomplete, inconsistent, redundant and noisy data. Specifically, this included the removal of orders without actual delivery dates, features with identical values, and duplicated orders. Suppliers with less than 10 orders have been removed from the dataset in order to reduce information diversity and thus dimensionality of encoded features.
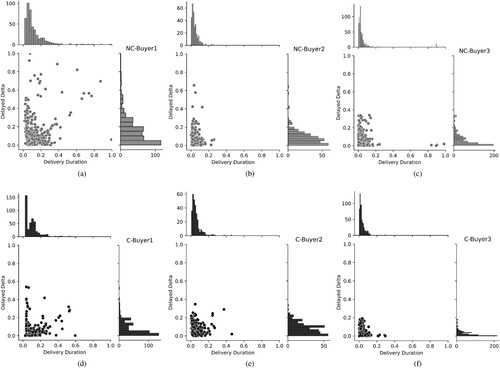
‘Delay Delta’, labelled as , was then calculated by subtracting contracted lead time from the actual delivery lead time. To explore the delivery performance differences pre and post Covid19, we visualise distributions of delay delta and contractual lead time in Figure . For visualisation purposes we randomly select a supplier for each buyer during pre-Covid19 (Figure (a–c)) and post-Covid19 (Figure (d–f)). A non-linear relationship can be observed between contractual lead time and delay delta. Delay delta does not obviously increase due to Covid19. For example, delayed deltas from C-Buyer1 (d), C-Buyer2 (e) and C-Buyer3 (f) are not larger than that in NC-Buyer1 (a), NC-Buyer2 (b), and NC-Buyer3 (c). However, the distributions of both delivery delta and contractual lead time are very different. For instance, the number of delayed orders decrease with longer contractual lead times, and decreases with larger delay delta. Hence it is reasonable to carry out the FL approach in separate time periods, leading to six datasets.
Figure 2. The distributions of delayed orders alighted with its contracted delivery duration and delayed delta. A plot that consists of six joint correlation subplots corresponding to six datasets showing the relationship of contracted delivery duration and delayed delta, the distribution of contracted delivery duration, and the distribution of delayed delta.
Statistical information pertaining the number of orders, suppliers and shared suppliers, delayed order rate, on-time order rate, values of maximum, mean and standard deviation of delays, are displayed on Table . It can be observed that the data size of buyer 3 is smaller than buyers 1 and 2, however its average delay rate during both periods is larger than the other two.
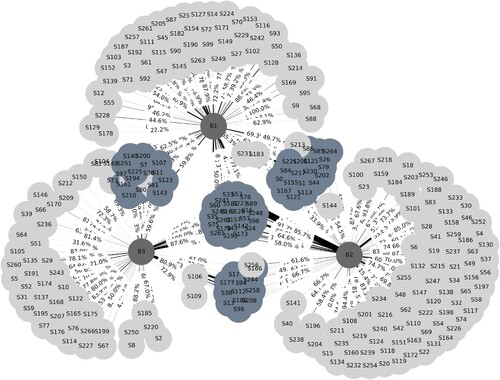
The intersecting supply chains of the buyers are shown in Figure . Buyers are depicted in dark grey, sole suppliers that serve to a given buyer only are depicted in light grey and shared suppliers are depicted in blue. Edges between suppliers and buyers represent their relationships, weighted by the proportion of orders between a given supplier and buyer, over all orders a buyer gives. The label on each edge represents the ratio of delays a given buyer-supplier relationship endures over all of a given buyer's orders.
Figure 3. The visualisation of the network-wide relationships between suppliers and buyers. A supplier-buyer network plot showing buyers (dark grey nodes), sole suppliers (light grey nodes), shared suppliers (blue nodes), and the ratio of delays for a given buyer-supplier relationship over all of a given buyer's orders labelled on the edge.
The next step in our analysis is the selection of features that will yield a predictive outcome, namely whether an order will be delayed or on-time. Feature selection in an FL setting is constrained to features that are accessible by all suppliers. Heterogeneity (non-IID data) across the feature space in FL is currently not well-established and presents a constraint for a collective learning approaches (Zhang et al. Citation2021). Common features include those presented in Table .
Table 3. The descriptions of selected features.
One-hot encoding technique is a widely used encoding technique (Potdar, Pardawala, and Pai Citation2017) for feature embedding whereby each unique variable is encoded to a new binary variable. One-hot encoding can help machine learning algorithms avoid the problem of bias across differently scaled features (Ul Haq et al. Citation2018). We specifically choose one-hot encoding over other methods such as Ordinal, Polynomial or Binary encoding, as it has been shown to outperform these encoding methods when input data does not have ranking, as is in our case (Potdar, Pardawala, and Pai Citation2017).
Due to the large number of unique variables in datasets, input data becomes high dimensional after one-hot encoding, which in turn increases the demand for computational resources. To address this problem, principle component analysis (PCA) was used for dimensionality reduction, which involves calculating the eigenvectors of the covariance matrix of the original inputs and then extracting those eigenvectors corresponding to large eigenvalues (Reddy et al. Citation2020).
4.2. Performance metrics
Common metrics used to evaluate the performance of a classification approach are Accuracy, Precision, Recall and F-Score, calculated by confusion matrix (Kulkarni, Chong, and Batarseh Citation2020). Table describes confusion matrix. Samples that are recognised correctly are defined as TP and TN. Otherwise, they are defined as FP and FN. In our case, TP represents the number of orders that have been correctly classified as delayed deliveries while TN describes the number of orders that have been correctly classified as on-time deliveries. FP refers to the number of orders that have been wrongly recognised as delayed orders while FN means the number of orders that are incorrectly recognised as on-time deliveries.
Table 4. Confusion Matrix.
Based on the confusion matrix, Accuracy, Precision, Recall and F-Score are calculated as follows:
Accuracy is represented as the ratio of accurate predictions to the total number of orders, .
Precision is defined as the ratio of accurate predictions of real delays to the total number of predicted delays, .
Recall describes the ratio of accurate predictions of real delays to the total number of real delays, .
F-Score represents the equilibrium between the precision and the recall, .
For imbalanced datasets, Accuracy is not a reasonable metric to measure the performance of a classification algorithm because the class with few number of samples have a little impact on Accuracy compared to the class with large number of samples (Hamad et al. Citation2021). Considering that both balanced and imbalanced datasets are tested in our case, an additional metric, named weighted F-Score (-Score), is additionally used to evaluate our proposed approach.
-Score is defined as
(2)
(2) where
is the proportion of orders for class c and is equal to
. N is the total number of orders while
is the number of orders in class c.
4.3. Establishing benchmarks
In order to test the efficacy of a federated approach to risk prediction, two benchmarks were created. First of these is ‘local learning’ where buyers use historical data available only to them to predict the deliver state of an order (i.e. delayed or on-time) if given to a particular supplying agent. This would help answer the question whether and under what circumstances would a federated approach be more beneficial to a company, than simply using their own data. One might expect that availability of sufficient data on a given supplier or material being procured would be a differentiating factor here. If a buyer has recently started a relationship with a supplier,or has recently started outsourcing a particular type of product, they would have little past data available and thus a federated approach to access market based-prediction may be more beneficial. On the other hand, as a buyer's own experience with a supplier grows, it might be better off developing predictive models using its own data, which would inevitably be tailored to its own relationship with a supplier and may capture nuances that are specific to their unique, dyadic relationship. Our inquiry thus becomes centred around the extraction of this trade off.
Another benchmark is that of ‘centralised learning’ where an algorithm is trained on the entire dataset of all three buyers. Clearly this is unrealistic, as the starting premise of a federated learning approach is that buyers will not share their data. However such a benchmark could inform us whether centralised learning is indeed ‘optimal’, and if so, how far from an ‘optimal’ performance a federated approach can be expected to perform, which may be useful in companies determining whether effort spent on building a federated approach is worthwhile. We will further discuss these considerations in the following sections.
4.4. Experimental settings
Experimental settings include those concerning data sampling and algorithmic parameter settings during the training phase.
As the datasets among companies show a degree of imbalance Table , we conduct an experiment that involves balancing the datasets by undersampling data to train FL. This undersampling data operation here aims to balance data size among companies not as common research works for balancing samples of different classes in a dataset. After undersampling, the dataset in each company has same size with others. In a round, each local model is updated on the same sample size and contributes to the global model equally. Hereafter, we name this balanced training where every local model used to update the global model is trained on the same sample size.
In contrast, we define Imbalanced training where every local model unequally contributes to the global model by having been trained on a different sample size. Imbalanced training is then implemented in two ways, the first of which involves training every local model on the same sized local sub-sample in a round, however the number of these in each local model are different (let us call this mode of training Type-1). In Type-2, the number of subsamples for each local dataset are the same, however the number of orders in each subsample is different. Type-1 thus aims to investigate how heterogeneity in the size of datasets used to train local models affect the performance of the global model, while Type-2 explores how local models that are trained on imbalanced datasets impact the performance of the global model.
The parameter values that are used to implement balanced training and imbalanced training are displayed in Table . For example, for balanced training on pre-Covid19 datasets, we undersample NC-Buyer1 and NC-Buyer2 so they have the same sample size as NC-Buyer3, who has the smallest. Here each buyer has 8989 orders. We then partition each dataset to several subsamples with 600 orders of each based on McMahan et al. (Citation2017). Therefore, each dataset has M=14 (≈8,989/600) subsamples. This ensures that every local model used to update the global model is trained on the same sized dataset. For orders given during Covid19, C-Buyer1 and C-Buyer3 are undersampled to have 5,951 orders, which is the same as C-Buyer2, and each dataset has M=9 (≈5951/600). For imbalanced training, all orders in each dataset join in the corresponding local model training. By Type-1, N is set as 600 and M varies with the size of different datasets; while by Type-2, M is set as 25 and 14 for pre-Covid19 and post-Covid19 datasets, respectively. These settings depend on two conditions. One is to make sure each subsample in the smallest dataset has more than 300 orders so as to avoid being unable to train a local model due to there not being enough orders. The other condition is that the subsample from the largest dataset is balanced from the smallest dataset.
Algorithmic parameters that need to be set during the training phase include the number of epochs, E, batch size, B, and learning rate, r, the number of components, , and the number of rounds, R. We set B as 16 after considering the small size of partitioned subsamples for local model training. r is defined as 0.001 following guidelines given in Senior et al. (Citation2013) so as to compromise between large learning rates that result in over-fitting and small learning rates that result in long computational run times. R, is variable and further discussed on Section 4.5.2. In both local learning and centralised learning we use the
strategy to optimise the number of epochs, E, and avoid over-fitting. Using stop−early means that the training process is stopped when the training loss decreases in 10 consecutive epochs while the validation loss increases. This similar experimental environment setting aims to ensure the uniformity of experiments.
Table 5. Data settings for both balanced training and imbalanced training by Type-1 and Type-2.
Following convention (e.g. see Zheng Citation2021), we use 70%, 10% and 20% of each dataset for training, validating and testing, respectively. All experiments are implemented on a machine equipped with a GeForce RTX 2080 Ti GPU card with 11 GB physical memory and PyTorch is used to build and train all models.
4.5. Experimental results and discussion
4.5.1. Trade offs between local learning and centralised data sharing
Table shows values of four performance metrics, including Accuracy, Precision, Recall and F-Score , achieved by local training, centralised training and FL. Table presents F-Score of each class. -Score of benchmarks and FL obtained on all datasets are presented in Figure . Based on Tables , and Figure , our findings are as follows.
Figure 4. Achieved -Score by all models on all datasets. A bar chart showing one of performance metrics,
-Score, achieved on eight datasets used for experiments.
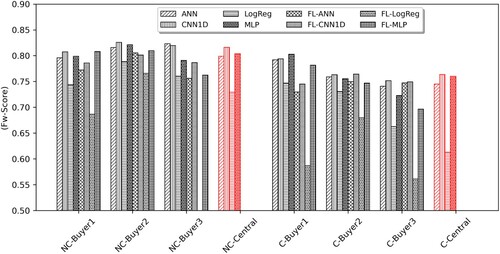
Table 6. Accuracy, Precision, Recall and F-score of local learning, centralised learning and the proposed FL.
Table 7. F-score of delayed and on-time orders from local learning, centralised learning and the proposed FL.
Convolutional Neural Network with one dimensional kernels (CNN1D) consistently outperforms other three models for all buyers and in all cases. CNN1D can achieve more accurate results because CNN1D is a kernel based model which can extract a variety of features by multiple kernels with different parameters in each kernel. On the other hand, LogReg is the worst for all buyers and in all cases.
All models perform better on pre-Covid19 datasets than post-Covid19 datasets. This is expected as post-Covid19 ordering patterns are more irregular making it difficult to derive consistent inference during this period, as shown in Figure (d–f).
All models, in all cases, are able to predict delayed orders with more success than on-time orders (see Table ). Consider NC-Buyer3, where the F-score for delayed orders is over 0.87, while the F-score for on-time orders is lower than 0.56. This is because there is a class imbalance towards delayed orders, which is most prominent in the case of NC-Buyer3, with 78% of its orders being delayed. Most notably during centralised learning, the F-score s are 0.81 for delayed orders and lower than 0.75 for on-time orders pre-Covid19, while they are 0.78 and 0.72 post-Covid19, except results achieved by LogReg.
Comparing centralised and local learning is not straightforward as performance is impacted by multiple factors. However, important lessons emerge.
During the more stable, pre-Covid19 period, centralised learning for buyers 1 and 3 performs better than these buyers learning using their own local dataset, whereas the opposite is true for buyer 2. However, note that in this case, datasets from buyers 1 and 3 are smaller and more imbalanced than buyer 2. Hence companies with small and imbalanced datasets benefit from pooling data together than using their own datasets. Companies that already have a longer order book with a supplier, seem to be better off using their own predictions.
Interestingly, the same observation holds post-Covid19 datasets, where centralised learning is better than local learning for buyers 2 and 3, both of whom have smaller and imbalanced datasets, but buyer 1 is better off using its own larger dataset.
In both of these cases, the dataset of one buyer is more ‘specialised’ in the specific ordering relationship with its own suppliers, and additional data from other buyers add noise, making its predictions worse. This points to a potential ‘sweet spot’ where the amount of data samples and data imbalance will determine whether a company is better off using its own dataset for predictive analysis or pool its data together with others.
In the next section we study the results of the FL approach.
4.5.2. Federated learning achieves comparable results
Expectedly, the FL approach is slightly worse than local learning for all buyers but surpasses centralised training under certain conditions. This finding has been reported by many existing works (McMahan et al. Citation2017; Yu, Bagdasaryan, and Shmatikov Citation2020), who advocated FL to cater to those use cases where local training data is not sufficient, and centralised training is not possible due to data sharing concerns. One must thus explore how FL performance can be maximised in these cases. Our results offer similar insights.
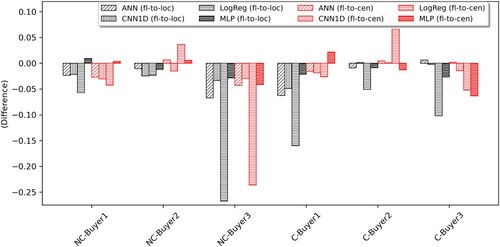
Although FL is not the highest performing approach, its performance approaches remarkably close to that of local and centralised learning (except Logistic Regression based FL). The maximum difference between FL and local learning; and between FL and centralised learning are 0.0670 and 0.0634, respectively, while their averaged differences are 0.0212 and 0.0148 Figure . In Figure the dark bars illustrate the differences between FL and local learning and the red bars illustrate the differences between FL and centralised learning, where positive values indicate that FL is better than local learning or/and centralised learning, and vice versa.
Figure 5. The differences of achieved -Score between FL and local learning and between FL and centralised learning for all datasets. A bar chart showing the performance differences of FL and local learning and of FL and centralised learning on all eight datasets.
Performance evaluation of FL conducted using Artificial Neural Networks (FL-ANN), Convolutional Neural Networks (FL-CNN1D), Logistic Regression (FL-LogReg), and Multi-Layer Perceptron (FL-MLP) during balanced training are shown in Figure where the x-axis represents the number of rounds, R, and the y-axis represents -Score . Here, all models provide more accurate predictions on pre-Covid19 datasets (i.e. NC-Buyer1, NC-Buyer2 and NC-Buyer3) consistently arriving or exceeding
-Score scores near 0.80.
Figure 6. Results of the FL approach achieved by the balanced training. A line-based plot that consists of three subplots corresponding to three buyers showing the performances of different machine learning algorithm-based FL approaches achieved by the balanced training.
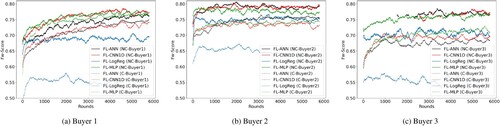
The difference between pre-Covid19 and post-Covid19 datasets is smaller for buyer 1 while they are larger for buyers 2 and 3. The reason for this is more scattered distribution of delayed deltas from buyer 1 shown in Figure (a) and (d) compared to buyers 2 and 3.
One can observe how FL based models improve in performance, as the results of inter-buyer information sharing begins to take effect. This is quite noticeable when FL is undertaken on imbalanced datasets. Here, both FL-ANN and FL-CNN1D take longer to converge (Figure ). Consider the more imbalanced pre-Covid19 dataset of buyer 3, where convergence takes longer than on the less imbalanced post-Covid19 dataset of buyer 3. This performance degradation is most probably caused by orders in the sample being predicted to the over-represented class. For instance, if there are no delayed orders being correctly predicted as delayed orders, TP would be equal to 0; resulting in and
being 0. If Precision and Recall were both 0, the F-Score would be infinite. However, interestingly, both FL-ANN1 and FL-CNN1D recover after 2000 rounds as they begin to learn more information from other datasets, providing evidence on how an imperfect model starts to improve due to FL based training.
Exploring algorithmic approaches, consistent with centralised and local learning, FL-CNN1D performs better than FL-ANN in most cases. FL-CNN1D achieves 0.775 and 0.700 -Score while FL-ANN obtains 0.760 and 0.685
-Score on NC-Buyer1 and C-Buyer3, respectively. For a small number of datasets (i.e. C-Buyer2 and NC-Buyer3), FL-ANN and FL-CNN1D achieve similar results. Among FL-CNN1D and FL-MLP, the former performs better on small datasets (i.e. C-Buyer2 and NC-Buyer3) while the later achieves higher
-Score on large NC-Buyer1 and NC-Buyer2. FL-LogReg is the worst algorithm in all cases.
For FL-ANN and FL-CNN1D in imbalanced training, recall that two types were pursued: one where the number of model results on localised individual samples that were sent to the central server sequentially varied in size but individual sample sizes were heterogeneous (Type-1), and one where both numbers of model results and individual sample sizes varied (Type-2). Results are shown in Figure . In Figure , red and black lines represent results achieved by FL-CNN1D and FL-ANN respectively while blue and green lines represent FL-LogReg and FL-MLP. Solid lines represent models trained by imbalanced Type-2 and dashed lines are models trained by imbalanced Type-1.
Figure 7. Results of the FL approach achieved by the imbalanced training. Noting that (c) does not show the results achieved by FL-LogReg due to being Nan (Table ). A line-based plot that composes of six subplots corresponding to six datasets showing the performances of different machine learning algorithm-based FL approaches achieved by the imbalanced training.
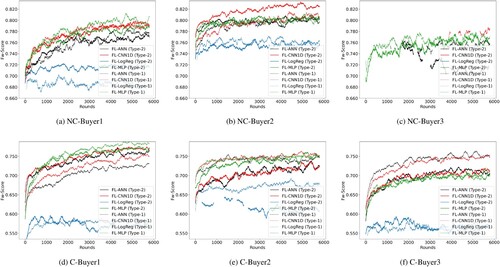
For the two imbalanced training types, it appears all models trained by Type-1 are more stable. For example, on all three post-Covid19 datasets, achieved -Score s by Type-1 are all around 0.750 while, for Type-2, differ from buyer to buyer. Hence one can conclude that heterogeneity in the size of datasets used to train local models has less negative impact on the performance of the global model, than training local models on imbalanced datasets.
Overall, imbalanced training helps all models provide slightly better predictions, compared to balanced training. For example, the highest -Score achieved by balanced training on C-Buyer1, C-Buyer2 and C-Buyer3 are around 0.750, 0.750, 0.700 while by imbalanced training are approximately 0.770, 0.750 and 0.750, respectively. This is good news, as this mode of training also facilitates real world scenario where datasets and their balance levels differ from company to company.
5. Conclusions and managerial implications
An increasingly volatile global economy has made researchers question the long-standing efficiency focus in supply chains, and considered how supply chains that are frequently exposed to shortages can be made viable (Ivanov and Dolgui Citation2022a). Recent conceptualisations of supply chain viability go beyond the notion of resilience, and propose a holistic framework encompassing preparedness, anticipation, recovery and sustainability (Ivanov and Dolgui Citation2020). Our work directly contributes to these efforts by providing a privacy preserving, data-driven risk prediction method to enable organisations anticipate supply disruptions collectively.
Extant research in data-driven supply chain risk prediction focused on siloed approaches in which companies attempt to examine risk alone, despite the supply chain being an interdependent system. Although data-sharing has long been proposed as a means to collectively assess supply chain risk, practical approaches to do so have not been successful, largely due to concerns about confidentiality. In this paper, we formulated new approach to collective risk prediction based on a new development from the field of Artificial Intelligence called Federated Learning. FL can enable information sharing without sharing raw data itself, where each supply chain member shares their predictive model parameters instead. The approach was tested using an empirical case study in the maritime engineering sector, in which buyers who shared a number of their suppliers developed delivery delay prediction models.
Recognising that companies will have heterogeneous ordering patterns, different levels of exposure to risk, and specialised relationships with their suppliers, we then asked the question ‘When is it better for companies to learn from their own historical data, and when should they undertake a federated learning approach?’ To explore this question, two benchmarks were created: local learning during which each member uses its own data, and centralised learning during which a common model is created from all members' data.
Our results indicate the following:
The performance difference between a federated approach and benchmarks are minimal, hinting that FL is a viable approach for supply chain data-sharing in contexts where privacy preservation hinders collective learning.
FL enables supply chain members with small and imbalanced datasets to tap into collective information, and improves their predictive performance. On the other hand, members with large datasets are better off developing their own models. However, for the greater good of the supply chain, they should bear responsibility in participation in collective learning.
Expectedly, federated approaches worked better during the pre-Covid19 period, when variance in delivery delays were smaller than during the post Covid19 period. However, interestingly, what matters more to the success of federated learning is dataset size and dataset imbalance.
Algorithm choice is a small yet significant factor in delay prediction.Among the four machine learning algorithms, used, namely Artificial Neural Network (ANN), Convolutional Neural Network with one dimensional kernels (CNN1D), Logistic Regression (LogReg), and Multi-Layer Perceptron (MLP), CNN1D on average performed 0.34%, 1.04% and 16.90% better than MLP, ANN and LogReg across all cases.
Our research has limitations, which in turn pose avenues for future research. The case study based nature of the study restricts our findings to the domain of inquiry, hence more research needs to be conducted to explore the efficacy of FL in other industrial domains. In particular, trials on supply chains with different underlying dynamics, and frequencies of disruptions need to be studied. Exploration of different model update mechanisms such as weighted averages could be explored. This in turn would bring on questions of model bias by those members of the supply chain who have disproportionately more data on certain supply chain members.
While we have concluded that collective risk prediction is better for companies that suffer from small dataset sizes and data imbalance, the exact trade offs between self-learning and collective learning still needs to be investigated. Thus, an important question that remains is how can companies know when to tap into the collective knowledge, and when to trust their own datasets?. It is also worth noting that large complex supply chains will involve frequent supplier changes, hence, although a buyer might not immediately benefit from collective learning approaches by joining in the FL approach, it might do so in the future. One means of persuading buyers with already existing large datasets to join in a federated approach may include payment based incentivisation. More research needs to be conducted in how companies may be incentivised to take part in collective learning.
Moreover, while we have applied FL in a use case on supply chain delivery delays, in principle FL may present opportunities for addressing other collective supply chain learning problems, which in turn would help improve coordination and planning. These include but are not limited to demand forecasting, and inventory prediction, as well as potentially finding remedies for long standing challenges such as demand amplification and shortage gaming.
Lastly, we also see an opportunity for this work to inform supply network reliability optimisation (e.g. Brintrup and Puchkova Citation2018; Ivanov Citation2022b) as the methods presented herein allow a collectively informed means to quantify network risk.
Disclosure statement
No potential conflict of interest was reported by the authors.
Data Availability Statement
Due to the commercially sensitive nature of this research, supporting data is not available.
Additional information
Funding
Notes on contributors

Ge Zheng
Dr. Ge Zheng currently is a Research Associate in the Supply Chain AI Lab at the Institute forManufacturing (IfM), Department of Engineering, University of Cambridge, UK. She received her PhD degree with full PhD scholarship in the Department of Computing and Informatics at the University of Bournemouth, UK, and MSc degree with Academic Excellence International Masters Scholarship in Electronic Engineering from the School of Computer Science and Electronic Engineering at the University of Essex. Her interested areas involve supply chain risk prediction, pattern recognition and/or classification, intelligent transportation systems, and healthcare applications.

Lingxuan Kong
Lingxuan (Leo) Kong is a PhD student from the Supply Chain AI LAB (SCAIL) Group in Institute of Manufacturing at Department of Engineering, University of Cambridge. His current research area is learning-based risk prediction methods for supply chain financing. Lingxuan join the SCAIL Group in 2021. He received his Bachelor of Engineering (Honours) degree from Australian National University. He majored in mechatronics system in his bachelor's degree. His previous research projects during bachelor study mainly focus on the distributed clustering algorithm and graph partitioning methods. These algorithms can be applied to multi-robot system and data processing problems. He published these proposed algorithms in International Conference on Intelligent Robotics and Systems (IROS).

Alexandra Brintrup
Prof. Alexandra Brintrup is Professor of Digital Manufacturing and head of the Supply Chain AI Lab at the Institute for Manufacturing (IfM), Department of Engineering, University of Cambridge, UK. She has a PhD in Artificial Intelligence, MSc in Applied Maths and Computing and a BEng in Manufacturing Engineering. She specialises in distributed negotiation, machine learning, autonomous systems, and nature-inspired optimisation in complex supply networks.
References
- Badakhshan, E., and P Ball. 2022. “Applying Digital Twins for Inventory and Cash Management in Supply Chains Under Physical and Financial Disruptions.” International Journal of Production Research 1–23. doi:10.1080/00207543.2022.2093682.
- Barros, J., J. N. Gonçalves, P. Cortez, and M. S. Carvalho. 2022. “A machine learning strategy for estimating supply lead times towards improved safety stock dimensioning.” Available at SSRN 4118108.
- Baryannis, G., S. Validi, S. Dani, and G. Antoniou. 2019. “Supply Chain Risk Management and Artificial Intelligence: State of the Art and Future Research Directions.” International Journal of Production Research 57 (7): 2179–2202. doi:10.1080/00207543.2018.1530476.
- Briggs, C., Z. Fan, and P. Andras. 2021. “Federated learning for short-term residential energy demand forecasting.” arXiv preprint arXiv:2105.13325.
- Brintrup, A. 2020. “Artificial intelligence in the supply chain.” The Oxford Handbook of Supply Chain Management.
- Brintrup, A., E. E. Kosasih, B. L. MacCarthy, and G. Demirel. 2022. “Digital supply chain surveillance: concepts, challenges, and frameworks.” The Digital Supply Chain, 379–396. Elsevier.
- Brintrup, A., J. Pak, D. Ratiney, T. Pearce, P. Wichmann, P. Woodall, and D. McFarlane. 2020. “Supply Chain Data Analytics for Predicting Supplier Disruptions: a Case Study in Complex Asset Manufacturing.” International Journal of Production Research 58 (11): 3330–3341. doi:10.1080/00207543.2019.1685705.
- Brintrup, A., and A. Puchkova. 2018. “Multi-objective Optimisation of Reliable Product-plant Network Configuration.” Applied Network Science 3 (1): 1–19. doi:10.1007/s41109-017-0058-8.
- Brisimi, T. S., R. Chen, T. Mela, A. Olshevsky, I. C. Paschalidis, and W. Shi. 2018. “Federated Learning of Predictive Models From Federated Electronic Health Records.” International Journal of Medical Informatics 112: 59–67. doi:10.1016/j.ijmedinf.2018.01.007.
- Cachon, G. P., and M. A. Lariviere. 1999. “Capacity Choice and Allocation: Strategic Behavior and Supply Chain Performance.” Management Science 45 (8): 1091–1108. doi:10.1287/mnsc.45.8.1091.
- Chae, B. K. 2015. “Insights From Hashtag# Supplychain and Twitter Analytics: Considering Twitter and Twitter Data for Supply Chain Practice and Research.” International Journal of Production Economics 165: 247–259. doi:10.1016/j.ijpe.2014.12.037.
- Chen, C., T. Gu, Y. Cai, and Y. Yang. 2019. “Impact of Supply Chain Information Sharing on Performance of Fashion Enterprises: An Empirical Study Using Sem.” Journal of Enterprise Information Management 32 (6): 913–935. doi:10.1108/JEIM-04-2019-0104.
- Chen, Z., and L. Huang. 2021. “Digital Twins for Information-sharing in Remanufacturing Supply Chain: A Review.” Energy 220: 119712. doi:10.1016/j.energy.2020.119712.
- Choudhury, O., A. Gkoulalas-Divanis, T. Salonidis, I. Sylla, Y. Park, G. Hsu, and A. Das. 2019. “Differential privacy-enabled federated learning for sensitive health data.” The 33rd Conference on Neural Information Processing Systems (NeurIPS).
- Choudhury, O., Y. Park, T. Salonidis, A. Gkoulalas-Divanis, and I. Sylla. 2019. “Predicting adverse drug reactions on distributed health data using federated learning.” AMIA Annual symposium proceedings, Vol. 2019, 313. American Medical Informatics Association.
- Christopher, M., and H. Peck. 2004. “Building the Resilient Supply Chain.” The International Journal of Logistics Management 15 (2): 1–14. doi:10.1108/09574090410700275.
- Dayan, I., H. R. Roth, A. Zhong, A. Harouni, A. Gentili, A. Z. Abidin, and A. Liu, et al. 2021. “Federated Learning for Predicting Clinical Outcomes in Patients with Covid-19.” Nature Medicine 27 (10): 1735–1743. doi:10.1038/s41591-021-01506-3.
- Dolgui, A., and D. Ivanov. 2021. “Ripple Effect and Supply Chain Disruption Management: New Trends and Research Directions.” International Journal of Production Research 59 (1): 102–109. doi:10.1080/00207543.2021.1840148.
- Duong, L. N. K., and J. Chong. 2020. “Supply Chain Collaboration in the Presence of Disruptions: a Literature Review.” International Journal of Production Research 58 (11): 3488–3507. doi:10.1080/00207543.2020.1712491.
- Edward, S. 2022. “The big challenges for supply chains in 2022.” accessed: 09.11.2022.
- Ganesh, A. D., and P. Kalpana. 2022. “Future of Artificial Intelligence and Its Influence on Supply Chain Risk Management–a Systematic Review.” Computers & Industrial Engineering 169: 108206. doi:10.1016/j.cie.2022.108206.
- Ghadge, A., S. Dani, and R. Kalawsky. 2012. “Supply Chain Risk Management: Present and Future Scope.” International Journal of Logistics Management 23 (3): 313–339.
- Ghosh, A., and J. Fedorowicz. 2008. “The Role of Trust in Supply Chain Governance.” Business Process Management Journal 14 (4): 453–470. doi:10.1108/14637150810888019.
- Guan, D., D. Wang, S. Hallegatte, S. J. Davis, J. Huo, S. Li, and Y. Bai, et al. 2020. “Global Supply-chain Effects of Covid-19 Control Measures.” Nature Human Behaviour 4 (6): 577–587. doi:10.1038/s41562-020-0896-8.
- Hamad, R. A., M. Kimura, L. Yang, W. L. Woo, and B. Wei. 2021. “Dilated Causal Convolution with Multi-head Self Attention for Sensor Human Activity Recognition.” Neural Computing and Applications 33( 20): 13705–13722. doi:10.1007/s00521-021-06007-5.
- Hellwig, D., K. Wendt, V. Babich, and A. Huchzermeier. 2022. “Playing with disaster: A blockchain-enabled supply chain simulation platform for studying shortages and the competition for scarce resources.” Creating Values with Operations & Analytics, Springer Series in Supply Chain Management, forthcoming.
- Ivanov, D. 2022a. “The Industry 5.0 Framework: Viability-based Integration of the Resilience, Sustainability, and Human-centricity Perspectives.” International Journal of Production Research 1–13. doi:10.1080/00207543.2022.2118892.
- Ivanov, D. 2022b. “Probability, Adaptability and Time: Some Research-practice Paradoxes in Supply Chain Resilience and Viability Modelling.” International Journal of Integrated Supply Management 15 (4): 454–465. doi:10.1504/IJISM.2022.125995.
- Ivanov, D., and A. Dolgui. 2020. “Viability of Intertwined Supply Networks: Extending the Supply Chain Resilience Angles Towards Survivability. a Position Paper Motivated by Covid-19 Outbreak.” International Journal of Production Research 58 (10): 2904–2915. doi:10.1080/00207543.2020.1750727.
- Ivanov, D., and A. Dolgui. 2022a. “The Shortage Economy and Its Implications for Supply Chain and Operations Management.” International Journal of Production Research 1–13. doi:10.1080/00207543.2022.2118892.
- Ivanov, D., and A. Dolgui. 2022b. “Stress Testing Supply Chains and Creating Viable Ecosystems.” Operations Management Research 15 (1-2): 475–486. doi:10.1007/s12063-021-00194-z.
- Kawa, D., S. Punyani, P. Nayak, A. Karkera, and V. Jyotinagar. 2019. “Credit Risk Assessment From Combined Bank Records Using Federated Learning.” International Research Journal of Engineering and Technology (IRJET) 6 (4): 1355–1358.
- Kosasih, E., and A. Brintrup. 2022. “Towards Digital Supply Chain Risk Surveillance.” IFAC-PapersOnLine 55 (10): 2499–2504. doi:10.1016/j.ifacol.2022.10.084.
- Kulkarni, A., D. Chong, and F. A. Batarseh. 2020. “Foundations of data imbalance and solutions for a data democracy.” data democracy, 83–106. Elsevier.
- Kwon, D., J. Jeon, S. Park, J. Kim, and S. Cho. 2020. “Multiagent Ddpg-based Deep Learning for Smart Ocean Federated Learning Iot Networks.” IEEE Internet of Things Journal 7 (10): 9895–9903. doi:10.1109/JIoT.6488907.
- Lee, H. L., V. Padmanabhan, and S. Whang. 1997. “The Bullwhip Effect in Supply Chains.” Sloan Management Review 38: 93–102.
- Li, S., Y. Cheng, Y. Liu, W. Wang, and T. Chen. 2019. “Abnormal client behavior detection in federated learning.” 2nd International Workshop on Federated Learning for Data Privacy and Confidentiality, in Conjunction with NeurIPS 2019 (FL-NeurIPS 19).
- Li, S., and W. Zeng. 2016. “Risk Analysis for the Supplier Selection Problem Using Failure Modes and Effects Analysis (fmea).” Journal of Intelligent Manufacturing 27 (6): 1309–1321. doi:10.1007/s10845-014-0953-0.
- Lotfi, Z., M. Mukhtar, S. Sahran, and A. T. Zadeh. 2013. “Information Sharing in Supply Chain Management.” Procedia Technology 11: 298–304. doi:10.1016/j.protcy.2013.12.194.
- Lu, Y., X. Huang, Y. Dai, S. Maharjan, and Y. Zhang. 2019. “Differentially Private Asynchronous Federated Learning for Mobile Edge Computing in Urban Informatics.” IEEE Transactions on Industrial Informatics 16 (3): 2134–2143. doi:10.1109/TII.9424.
- Macdonald, J. R., C. W. Zobel, S. A. Melnyk, and S. E. Griffis. 2018. “Supply Chain Risk and Resilience: Theory Building Through Structured Experiments and Simulation.” International Journal of Production Research 56 (12): 4337–4355. doi:10.1080/00207543.2017.1421787.
- McMahan, R., and D. Brendan. 2017. “Federated learning: Collaborative machine learning without centralized training data.” Accessed: 10.11.2022.
- McMahan, B., E. Moore, D. Ramage, S. Hampson, and B. A. y Arcas. 2017. “Communication-efficient learning of deep networks from decentralized data.” Artificial intelligence and statistics, 1273–1282. PMLR.
- Nwankpa, C. E., W. Ijomah, A. Gachagan, and S. Marshall. 2021. “Activation functions: comparison of trends in practice and research for deep learning.” 2nd International Conference on Computational Sciences and Technology, 124–133.
- Pettit, T. J., K. L. Croxton, and J. Fiksel. 2019. “The Evolution of Resilience in Supply Chain Management: a Retrospective on Ensuring Supply Chain Resilience.” Journal of Business Logistics 40 (1): 56–65. doi:10.1111/jbl.2019.40.issue-1.
- Potdar, K., T. S. Pardawala, and C. D. Pai. 2017. “A Comparative Study of Categorical Variable Encoding Techniques for Neural Network Classifiers.” International Journal of Computer Applications 175 (4): 7–9. doi:10.5120/ijca2017915495.
- Reddy, G. T., M. P. K. Reddy, K. Lakshmanna, R. Kaluri, D. S. Rajput, G. Srivastava, and T. Baker. 2020. “Analysis of Dimensionality Reduction Techniques on Big Data.” IEEE Access 8: 54776–54788. doi:10.1109/Access.6287639.
- Rodgers, M., and D. Singham. 2020. “A Framework for Assessing Disruptions in a Clinical Supply Chain Using Bayesian Belief Networks.” Journal of Pharmaceutical Innovation 15 (3): 467–481. doi:10.1007/s12247-019-09396-2.
- Savazzi, S., M. Nicoli, and V. Rampa. 2020. “Federated Learning with Cooperating Devices: A Consensus Approach for Massive Iot Networks.” IEEE Internet of Things Journal 7 (5): 4641–4654. doi:10.1109/JIoT.6488907.
- Senior, A., G. Heigold, M. Ranzato, and K. Yang. 2013. “An empirical study of learning rates in deep neural networks for speech recognition.” 2013 IEEE international conference on acoustics, speech and signal processing, 6724–6728. IEEE.
- Sheller, M. J., B. Edwards, G. A. Reina, J. Martin, S. Pati, A. Kotrotsou, and M. Milchenko, et al. 2020. “Federated Learning in Medicine: Facilitating Multi-institutional Collaborations Without Sharing Patient Data.” Scientific Reports 10 (1): 1–12. doi:10.1038/s41598-020-69250-1.
- Smith, V., C.-K. Chiang, M. Sanjabi, and A. S. Talwalkar. 2017. “Federated Multi-task Learning.” Advances in Neural Information Processing Systems 30.
- Soni, U., V. Jain, and S. Kumar. 2014. “Measuring Supply Chain Resilience Using a Deterministic Modeling Approach.” Computers & Industrial Engineering 74: 11–25. doi:10.1016/j.cie.2014.04.019.
- Taheri, M., M. Rastgarpour, and A. Koochari. 2021. “A Novel Method for Medical Image Segmentation Based on Convolutional Neural Networks with Sgd Optimization.” Journal of Electrical and Computer Engineering Innovations (JECEI) 9 (1): 37–46.
- Tun, Y. L., K. Thar, C. M. Thwal, and C. S. Hong. 2021. “Federated learning based energy demand prediction with clustered aggregation.” 2021 IEEE International Conference on Big Data and Smart Computing (BigComp), 164–167. IEEE.
- Ul Haq, I., I. Gondal, P. Vamplew, and S. Brown. 2018. “Categorical features transformation with compact one-hot encoder for fraud detection in distributed environment.” Australasian Conference on Data Mining, 69–80. Springer.
- Wichmann, P., A. Brintrup, S. Baker, P. Woodall, and D. McFarlane. 2020. “Extracting Supply Chain Maps From News Articles Using Deep Neural Networks.” International Journal of Production Research 58 (17): 5320–5336. doi:10.1080/00207543.2020.1720925.
- Xu, L., S. Mak, and A. Brintrup. 2021. “Will Bots Take Over the Supply Chain? Revisiting Agent-based Supply Chain Automation.” International Journal of Production Economics 241: 108279. doi:10.1016/j.ijpe.2021.108279.
- Yang, W., Y. Zhang, K. Ye, L. Li, and C.-Z. Xu. 2019. “Ffd: A federated learning based method for credit card fraud detection.” International conference on big data, 18–32. Springer.
- Yu, T., E. Bagdasaryan, and V. Shmatikov. 2020. “Salvaging federated learning by local adaptation.” arXiv preprint arXiv:2002.04758.
- Yuan, B., S. Ge, and W. Xing. 2020. “A federated learning framework for healthcare iot devices.” arXiv preprint arXiv:2005.05083.
- Zhang, Z., and M. Sabuncu. 2018. “Generalized Cross Entropy Loss for Training Deep Neural Networks with Noisy Labels.” Advances in Neural Information Processing Systems 31.
- Zhang, C., Y. Xie, H. Bai, B. Yu, W. Li, and Y. Gao. 2021. “A Survey on Federated Learning.” Knowledge-Based Systems 216: 106775. doi:10.1016/j.knosys.2021.106775.
- Zheng, G. 2021. “A Novel Attention-based Convolution Neural Network for Human Activity Recognition.” IEEE Sensors Journal 21 (23): 27015–27025. doi:10.1109/JSEN.2021.3122258.