
 ?Mathematical formulae have been encoded as MathML and are displayed in this HTML version using MathJax in order to improve their display. Uncheck the box to turn MathJax off. This feature requires Javascript. Click on a formula to zoom.
Abstract
Catastrophe-related insurance (e.g. business interruption insurance) is an effective financing tool for global corporations to reduce economic losses caused by high impact events. Flexible operational planning is an often-used tool enabling rapid adjustment of operational plans for reducing catastrophe-related damage costs. The interaction between catastrophe insurance and flexible operations planning has rarely been studied. In this paper, we develop a stochastic programming model for a multi-echelon global supply chain network that we solve to investigate the impact of purchasing catastrophe insurance on supply chain operational planning in a catastrophe-prone environment. Computational simulations are developed for evaluating solution quality and measuring catastrophe-related damage costs. We find that it may be optimal for supply chains to scrap redundant products in catastrophes when customer demand falls below the expected level. Purchasing catastrophe insurance may encourage supply chains to scrap more products, which results in more catastrophe-related damages. From analysing supply chain costs, catastrophe-related damage costs, and operational plans, we find that a higher compensation rate of catastrophe insurance triggers more production activities being planned at the vulnerable node just before the vulnerable time period, especially for low residual value products. Finally, we give managerial insights to help reduce unnecessary damages in catastrophes.
1. Introduction
The global economy can be devastated by natural disasters such as the Fukushima accident and the Thailand floods in 2011 (Hayashi and Hughes Citation2013; Haraguchi and Lall Citation2015), and man-made incidents, such as the Tianjin explosions in 2015 and the Hanjin Shipping bankruptcy in 2016 (Mihalascu Citation2015; Braden Citation2016), not to mention the ongoing pandemic of COVID-19. Disruption risk mitigation strategies have attracted increasing attention from decision makers. Financial and operational mitigation strategies are important tools for global supply chains (SCs) to cope with disruption risks.
When facing forthcoming uncertainties, SCs often adapt their operational strategy by adjusting production activities, e.g. production and transportation plans, to reduce possible financial losses. By making a detour or using a different transportation mode, SCs can avoid passing through high risk areas in transportation (Fan et al. Citation2017a; Fan, Schwartz, and Voß Citation2017). Delaying or advancing production activities help to reduce possible economic losses during vulnerable time periods. In contrast to these operational strategies, purchasing catastrophe-related insurance (e.g. business interruption insurance) is an important financial strategy for mitigating disruption risks (Zhao et al. Citation2020; Nebolsina Citation2021). In our paper, catastrophe insurance indicates business interruption insurance for catastrophe-related disruption risks. By covering damage costs caused by a prescribed catastrophe, catastrophe insurance is a way for SCs to share the risk with, and obtain financial support from, insurance companies (Eggert, Fan, and Voß Citation2016).
Although purchasing catastrophe insurance and adjusting operational plans are effective in reducing SC economic losses in case of a catastrophe when adopted separately, the interaction between the two has not been thoroughly studied. When multiple strategies are available, the implementation of one strategy may influence the implementation of the other. More specifically, the protection of catastrophe insurance may reduce decision makers' cautiousness. It may also drive decision makers to pursue insurance compensation through deliberately creating high damage costs. In that case, purchasing catastrophe insurance may result in higher expected costs for companies and/or insurers.
In this paper, we aim to develop a systematic and quantitative analysis of the impact of catastrophe insurance on SC operational planning. To achieve this goal, a series of challenges should be overcome in modelling: (a) this problem should be studied at global SC scale, because the impact of catastrophes may affect multiple partner companies. However, (b) the nature of multi-echelon (with multiple companies in each echelon) and multi-products of global SCs increases the difficulty in modelling and computing. Meanwhile, (c) the long recovery time requires the model to include a considerable number of planning periods which also leads to (d) a considerable number of decision variables to be included in the model (Dunke et al. Citation2018). Moreover, (e) demand fluctuations often come along with catastrophes.
To overcome these challenges, we build a stochastic programming model for a multi-echelon, multi-node, global SC that provides multiple products to globally distributed customers in a catastrophe-prone environment. We analyse and simulate the impacts of catastrophe insurance on global SC operational planning by using real-world data. We assume that the probability of catastrophe occurrence during a period of time can be estimated using historical records and real-time information. Given the low probability of catastrophes, we include no more than one catastrophe in the time horizon considered. Recovery time after a catastrophe and the catastrophe's occurrence time point are assumed to be distributed exponentially and uniformly, respectively. In addition, uncertain demand is considered in our model. To make it possible to analyse operations decisions involving purchasing, production, and transportation plans, we use overall SC costs to measure the performance of operations plans and damage costs to indicate the negative impact from catastrophes. The model provides optimised purchasing, production, and transportation plans. We use a simulation study to evaluate the quality of solutions. Managerial implications and conclusions are made based on analysing solutions for insured and uninsured SCs.
The paper is organized as follows. Section 2 shows a systematic literature review on SC risks and risk management/mitigation strategies. Background and assumptions are explained in Section 3. A stochastic model for a multi-echelon global SC is developed in Section 4. A computational simulation is introduced in Section 5. Finally, we summarise managerial insights and outline further research directions in Section 6.
2. Systematic literature review
In this section, we will review literature in the related domain. We first refer to various typologies of SC risks. Then, we summarise conceptual research and empirical research in SC risk mitigation, as recently emerging many articles in this domain. Next, we review research in financial and operational mitigation strategies, as well as research on the interaction between the two, since these are the main focus of this research. Stochastic programming is used in our research, so we will review articles on applying stochastic programming for SC risk management. A summary of research gaps is provided at the end of this section.
2.1. Categories of supply chain risks
Disaster management has been receiving increasing attention in SC research (Gupta et al. Citation2016) and risk management is an important component. SC risk can be categorised into internal and external environmental risk, social risk, financial risk, and operational risk (Jüttner, Peck, and Christopher Citation2003; Christopher and Gaudenzi Citation2015). In general, operational and disruption risks refer to different impact levels (Tang Citation2006). Operational risk refers to uncertainties that have local impacts and takes place on a daily base. Disruption risk refers to natural or man-made disasters and may have global impacts. Catastrophic risk refers to disruptions that cause major damage to infrastructure and local services of many partner companies (Dlugolecki and Hoekstra Citation2006). According to the role of the disrupted company, disruption risks can be categorised as production disruptions, supply disruptions, and transportation disruptions (Ivanov et al. Citation2017). Wicaksana et al. (Citation2022) proposed a new SC risk typology, which categorises SC risks according to the characteristics (internal/external, intentional/unintentional), the location (SC stages and flows), and the impact (economics, social, environmental) of risks. In this paper, we focus on catastrophic risk which has low frequency, high impact.
2.2. Conceptual research and empirical research in SC risk mitigation
The COVID-19 pandemic has been disrupting global SCs seriously. SC risk management related concepts, such as SC readiness, sustainability, flexibility, resilience, viability and reconfigurability become more important than ever before (Al Naimi et al. Citation2022). Empirical studies show that SC performance is significantly influenced by SC resilience, robustness and dynamic capability (Belhadi et al. Citation2021; Ruel and El Baz Citation2021). Belhadi et al. (Citation2021) concluded that SC adaptive capability and collaborations positively influence SC resilience. Llaguno, Mula, and Campuzano-Bolarin (Citation2022) reviewed the ripple effect of low-frequency/high-impact disruption risks and proposed a conceptual framework for resilient SC. Mohammed, Jabbour, and Diabat (Citation2021) strengthen the importance of possessing dynamic capabilities, which include capability of sensing, readiness, response, recovery and growth. Similar conceptual frameworks are proposed for resilient SC in Kähkönen et al. (Citation2021) and Llaguno, Mula, and Campuzano-Bolarin (Citation2022). Reconfigurability was studied as a capability that enables SCs to rapidly adapt themselves in facing internal and external changes (Dolgui, Ivanov, and Sokolov Citation2020). Ruel and El Baz (Citation2021) concluded that SC readiness has significant positive correlations with both SC resilience and SC robustness. Ivanov (Citation2021) proposed a framework of merging four strategies, named intertwining, scalability, substitution and re-purposing, for maintaining SC viability in facing disruptions. An emerging concept of digital twins for SCs aims to visualise the impact of risks along the whole global SC, it worthies further research in the near future (Wicaksana et al. Citation2022).
Though many concepts and conceptual frameworks have been proposed in existing research, further research should be conducted in implementing these concepts/frameworks to guide practitioners' decisions. In solving real world problems, decision support in production planning, transportation planning, as well as financial decisions are needed. In this paper, we focus on the impact of using financial mitigation strategies and operational mitigation strategies on SC production plans and transportation plans.
2.3. Financial mitigation strategies
Purchasing a business insurance is an option for reducing damage costs in case of natural/man-made disruptions, economic crisis, customer demand fluctuations, or technological/regulatory changes (Shi Citation2004; Stecke and Kumar Citation2009). With advanced risk-management tools, such as catastrophe bonds, insurers can pool global catastrophe risks and are able to provide financial assistance to vulnerable firms after disruptions (Dlugolecki and Hoekstra Citation2006; Schultz Citation2022).
The coverage of catastrophe-related insurance depends on insurance policy between the insurer and the insured. It may only cover direct economic losses (caused by damage of insured properties in interruptions), or also cover indirect economic losses (lost profits and/or extra costs caused by catastrophic events at partner companies) (Jaffee and Russell Citation1997; Surminski and Eldridge Citation2015). For example, business interruption insurance is a type of catastrophe-related insurance which covers both property damages in a disruption and revenue losses arising from those property damages (Dong, Tang, and Tomlin Citation2018). The coverage varies depending on the contract between the insured and the insurer. In our paper, we focus on a catastrophe-related insurance that fully or partially cover product damages caused by a catastrophe. In the rest of this paper, the term ‘catastrophe insurance’ indicates this type of insurance.
2.4. Operational mitigation strategies
SC risk prediction opens a way of efficiently managing SC risks with operational mitigation strategies. More accurate prediction became possible using big data analytics and artificial intelligence (Baryannis, Dani, and Antoniou Citation2019; Sanders and Ganeshan Citation2018; Choi, Wallace, and Wang Citation2018; Fan, Heilig, and Voß Citation2015). Blockchain technology is a new tool for detecting SC risks and building trust between partner companies (Min Citation2019; Smith and Dhillon Citation2019). Existing research on operational mitigation strategies aim at minimising system costs or time or maximising system profits in an environment with uncertain demand (Yang, Cai, and Chen Citation2018; Chen, Shum, and Simchi-Levi Citation2014; Ma et al. Citation2022; Sazvar et al. Citation2021), uncertain supply (Hamdan and Diabat Citation2019), uncertain costs (Farrokh et al. Citation2018), or hybrid uncertainties (Hamdan and Diabat Citation2019; Farrokh et al. Citation2018). More research should be conducted on decision support in facing conflicting or complementary goals in mitigating negative impacts of SC disruptions.
Simultaneously analysing the impacts of SC disruptions and demand uncertainties is a big challenge due to the complexity of SC models (Badakhshan and Ball Citation2022). Hybrid optimisation-based simulation techniques make it possible to analyse the impacts of hybrid disruptions and uncertainties on the performance of complex SC networks (Ivanov et al. Citation2017). Operational mitigation strategies for disruption risk (catastrophic events), such as reduced capacity in production (Bhuiyan, Medal, and Harun Citation2020; Snoeck, Udenio, and Fransoo Citation2019; Dong, Tang, and Tomlin Citation2018; Li and Zhang Citation2018) or storage (Fattahi and Govindan Citation2018) and disrupted transportation routes (Hamdan and Diabat Citation2020) or suppliers (Sawik Citation2019; Sabouhi, Pishvaee, and Jabalameli Citation2018), have been attracting more research interest recently. In quantitative analyses of disruption risks, customer demand is often assumed to be deterministic (Christopher and Gaudenzi Citation2015; Dong and Tomlin Citation2012; Tomlin Citation2006), even though customer demand fluctuation often comes along with catastrophic events (Snyder et al. Citation2016). Customer demand fluctuations may or may not be caused by catastrophic events, as demand fluctuations are not rare in real-world businesses. More quantitative research should be conducted in analysing operational strategies in facing hybrid uncertainties.
2.5. Interactions between financial strategies and operational strategies
Dong and Tomlin (Citation2012) propose that financial and operational mitigation measures can be complements under certain conditions, whereas proper catastrophe insurance policies are required to mitigate free-riding problems within an SC (Serpa and Krishnan Citation2017). Dong, Tang, and Tomlin (Citation2018) analyse the interaction among storing inventory, taking preparedness, and purchasing an insurance in a two-stage production chain with deterministic customer demand. In their model, disruptions only influence production and disruption-related lost sales costs are reimbursed if an insurance is purchased. However, the impact of a catastrophic event ripples through each echelon of a global SC. Different concurrent risk mitigation strategies can positively or negatively affect each other (Kumar and Park Citation2019). It is essential to study the effect of simultaneously adopting financial and operational mitigation measures for SCs in facing disruptive events (Dolgui and Ivanov Citation2021; Badakhshan and Ball Citation2022). Badakhshan and Ball (Citation2022) proposed a digital twin framework for simulating both inventory control and cash replenishment policies in a low-frequency-high-impact disruptive environment and simulated three disruptive scenarios with deterministic parameters. More effort should be contributed to investigating the combined effects of multiple risk mitigation strategies. A paper by Zhen et al. (Citation2016) looks at interactions between business interruption insurance and backup transportation plans using a model where a single distribution centre delivers a quantity of a product to multiple customers. Most of their analysis concerns backup transportation strategies, and they conclude that insurance and backup transportation can be seen as substitutes.
From existing research in financial and operational mitigation strategies, we see that it is necessary to synchronise multiple strategies to mitigate impacts from low-frequency-high-impact disruptions. So far, there is a lack of research in quantitative methods in measuring the performance of disruption mitigation strategies and interaction effects between different strategies.
2.6. Stochastic programming for SC risk management
Quantitative analyses of SC disruption risks have been developed considerably during the recent years. Catastrophic events are characterised by three parameters: the point in time of the occurrence, the duration of negative impacts to the SC, and the probability of its occurrence in Fan et al. (Citation2017a). Stochastic optimisation, robust optimisation, and dynamic optimisation are used for supporting decisions on supplier selection, production planning, transportation planning, and distribution planning in an uncertain environment (Ermoliev et al. Citation2000; Govindan and Cheng Citation2018; Gao et al. Citation2017). The impacts of disruption risk are also analysed in case studies (Haraguchi and Lall Citation2015).
A two-stage stochastic program (SP) is sometimes used for SC disruption risk management. See, e.g. King and Wallace (Citation2012) for a general introduction to stochastic programming. Fattahi, Govindan, and Maihami (Citation2020) build a two-stage stochastic model for an SC to optimise location, allocation, capacity, inventory, and order-size decisions at the first-stage, and adjust allocation, inventory and order-size decisions once a distribution centre disruption event is disclosed. Jabbarzadeh, Haughton, and Khosrojerdi (Citation2018) propose a two-stage SP model for a closed-loop SC network in an environment with uncertain demand and disruption risks. Their model aims at minimising overall costs through production facility location and relocation (first-stage decision) and production planning (second-stage decision). Facility disruption problems are also studied in Bhuiyan, Medal, and Harun (Citation2020). In their model, allocation decisions are made in the first stage and post-disruption transportation flows are planned in the second stage. This is similar to an SC model for blood proposed in Hamdan and Diabat (Citation2020).
Stochastic programming is used for building a flexible SC in facing disruptions (Fan et al. Citation2017a; Fan, Schwartz, and Voß Citation2017; Fan et al. Citation2017b). SC flexibility refers to the capability of a manufacturer to produce different types of products in Jordan and Graves (Citation1995). Flexible SCs can better protect themselves from disruptions (Simchi-Levi, Wang, and Wei Citation2018). According to results in Fan et al. (Citation2017a) and Fan, Schwartz, and Voß (Citation2017), flexible SCs experience less negative impacts in case of a disruption event. Based on a systematic review of SCRM related references of the last decade, Wicaksana et al. (Citation2022) strengthen the importance of SC flexibility and call for researchers to dive into flexibility-oriented strategies.
In the present paper, flexibility is twofold: (1) each factory produces different types of products and each type of product can be produced at different factories, (2) each transportation link has different transportation modes that can be used as needed. These two conditions enable flexible operational planning by postponing or bringing forward production and/or transportation activities to reduce economic losses from a possible catastrophe in the near future.
2.7. Summary of literature review
In this section, we reviewed literature on SC risk and concepts, methods and strategies for managing SC risks. Based on existing research, we see research gaps in SC disruption management:
decision support in facing conflicting or complementary goals in mitigating negative impacts of SC disruptions;
developing methods and tools for transforming concepts and conceptual frameworks in existing research into clear guidance for practitioners, for example, tools for mapping/visualising the spread of disruptions' impacts along global SCs;
analysing the impact of hybrid uncertainties/disruptions to global SC networks' production and transportation operations;
quantitative methods in measuring performance of SC disruption mitigation strategies/policies, especially when multiple mitigation strategies are simultaneously used.
This paper mainly contributes to research areas (iii) and (iv). First, we model daily production and transportation plans of a global SC network over a long time period in a disruptive environment with a two-stage stochastic programming model. Second, given the complexity of global SC networks, varies materials/parts/products that are involved, the time span of transportation (especially intercontinental transportation) and production, traditional optimisation or simulation methods are insufficient for analysing the impacts of hybrid uncertainties on global SCs. The combination of optimisation and simulation methods enables us to measure the impact of disruptions and the impact of insurance policies on SC performance. We simulate situations when catastrophe-related insurances are taken/not taken by SC executives and optimise SC production and transportation plans (by solving the stochastic programming model) in these situations. Third, we analyse solutions (production plans) and results (costs and damage costs) in different situations and summarise managerial insights from our analyses.
3. Background and assumptions
In this section, we will introduce the disruptive environment global SCs in this research are facing and predictability of possible disruptions. To present the disruptive environment of our case, we classify disruptions into three categories according to predictability, for instance, prediction leading time and predictable details. Catastrophe related damages and compensation methods in insurance policies will be introduced afterwards. The structure of the global SC network including geographical locations of the main factories, distribution centres, and transfer stations/ports will also be explained in this section.
3.1. Disruption predictability
This paper focuses on stochastically predictable disruptions (see Appendix A of the supplementary material for detailed classification and explanation) that cause product damage and production interruptions. It means that probability information of possible impacts caused by disruptions are known in advance. More accurate predictions of these impacts become available accompanying with updated information.
3.2. Catastrophes and insurance policies
In general, catastrophes may take place at a production site of an SC, a port, or during transportation. In this paper, we focus on catastrophes at a factory (an assembly centre). We assume that once a factory is disrupted, production activities would have to be suspended for a period of time (e.g. a few days or weeks). All the finished goods in the warehouse and work in progress are destroyed at the moment of a catastrophe. Hence, a catastrophe at a location is represented by its probability of occurrence, the recovery time (duration) and the point in time of occurrence (start time). Our model focuses on damage costs, which are related to the value of products and parts that are destroyed at a factory in case of a catastrophe.
Based on the prediction of a disaster, decision makers can deploy flexible operational planning by postponing or bringing forward production and transportation activities to reduce/avoid damage costs once the disaster breaks out. Using stochastic programming for SC operational planning helps to achieve lower economic losses in case of a disruption event in a catastrophe-prone environment. Beyond that, purchasing insurance with respect to a possible disaster can be used as a strategy.
When catastrophe insurance is considered, an insurance policy is taken out based on the negotiation between an insurer and an insured SC. In this paper, we aim to analyse SC production and transportation planning. The question of how to design an optimal insurance policy is beyond the scope of this research.
In our model, the resulting insurance premium is paid per unit time at a fixed price that does not vary with production plans. In this research, we focus on variable costs, so we do not include fixed costs, including insurance cost. A part of the damage costs of insured SCs due to destroyed products in a catastrophe at a specific location will be indemnified by the insurer according to the compensation rate specified in the insurance contract. Note that indirect economic losses (e.g. stockout costs) are not covered by the insurance in this research.
3.3. SC structure
We focus on a global SC consisting of suppliers, assembly centres, sellers, final customers, and multiple transfer stations on long distance (international) transportation links. The global SC network is given in Figures and .
Figure 1. SC structure.
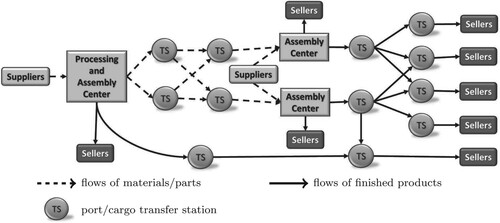
Figure 2. The global SC network.
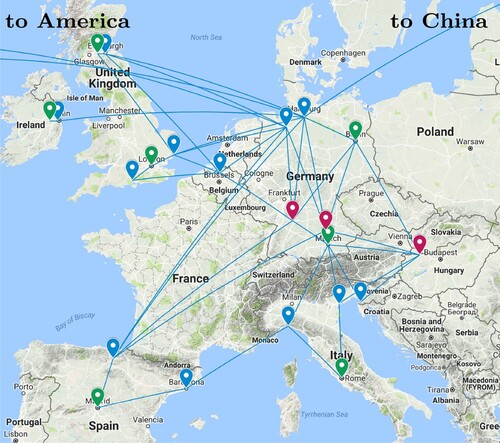
Figure shows product flows. In Figure , parts and semi-products are provided by suppliers and transported to assembly centres for finalising the final products. Final products will be then transported to retailers (sellers). In general, parts can be supplied by multiple suppliers, while each supplier has limited capacity. Multiple transportation modes with various speeds and costs are available for each transportation link and faster transportation modes are more costly. Items have to be sent to a local port or transferring centre nearby at first. From there, these items are transported to other ports or transfer centres close to the destination before arriving at final destination. Each seller provides finished products to customers of the same region. Selling finished products to cross-region customers is not allowed in our model. SC activities include assembling, transportation, and processing at a port or a transferring centre. Processing and assembling activities can take multiple time periods. Transportation time depends on distances and transportation mode.
Figure shows locations of SC partners and the scale of the global SC. In Figure , the European section of the global SC is the focus of our research; sellers in North and South America as well as China are not included in this figure due to limited space. Purple pinpoints in Figure show locations of factories/assembly centres. For example, the factory in Hungary is the main supplier for valuable components and parts as well as one of the main factories for the final products. Green pinpoints show locations of sales centres/retailers, blue pinpoints specify transfer stations/ports. Figure shows material flows and Figure shows only transportation links. Four SC echelons can be related in an international transportation link. For example, products transported from an assembly centre in Germany to a seller in China are transferred at a port in Europe (e.g. Bremen, Hamburg, or Rotterdam) and a port in China (e.g. Shanghai, Tianjin, or Guangzhou). The same happens for other international transportation links. Taking into account all relevant ports and transfer stations, the global SC in our experiments consists of multiple echelons (more than seven echelons, see Figure ).
4. Model
In this section, we develop a two-stage stochastic programming model for operational planning of a multi-echelon multi-product global SC in a catastrophe-prone environment with stochastically predictable disruptions.
4.1. The two stages of the stochastic programming model
We develop a two-stage stochastic programming model for the global SC with the aim of obtaining a first-stage decision (production and transportation plans for the time period in Figure ) that optimises the summation of the value (or cost) of first-stage decisions and the expected value of second-stage decisions (production and transportation plans for the time period
in Figure ). By considering operational plans into two stages, we leave uncertainties (including possible disruptions and demand fluctuations) in the second-stage. We assume that the occurrence time of a catastrophic event is stochastically predictable. That is, the domain of the occurrence time
(see Figure , i indicates the vulnerable SC node and ω indicates a possible realisation of the second stage) and the probability of such an event would take place are predictable. We minimise the first-stage cost plus the expected value of uncertain second-stage costs.
is a warm-up stage. In our model, the first-stage decisions specify an SC operational plan (including plans of purchasing, production and transportation activities) for the forthcoming plan cycle. The second-stage decisions are making alternative operational plans for possible realisations for a certain period of time following the forthcoming plan cycle.
Figure 3. Stages and timeline.

In this model, uncertainties are only related to the second-stage decisions. Parameters that are related to the first-stage decision are assumed to be deterministic. In making the first-stage decisions, uncertainties in the second stage should be also considered as well, including the possibility that the damage cost caused by a catastrophe in the second stage can be fully or partially refunded if catastrophe insurance is purchased. The first stage decisions must be non-anticipative, which means that they cannot depend on the realised scenario.
4.2. Specification of SC operational plans
Our main focus is the impact of insurance on operational planning for global SCs. However, operational plans (which include purchasing, production and transportation plans) of a large-size, multi-product, multi-echelon, multi-node global SC in multiple time periods contain massive information which makes it unrealistic to directly analyse operational plans in every detail (Figure ). In our model, we consider daily updated operational plans of a global SC over a time period of four months. It is not convenient to report the huge amount of individual variables' values in this paper. Therefore, we use two main indicators for each operational plan: the overall SC costs, and damage costs in case of a catastrophe. As an insuree, an SC's main concern is the overall SC cost. As an insurer, damage cost in case of a disruption determines the amount of cost incurred. We mainly focus on SC costs and damage costs in our computational experiments. We now proceed to describe the elements of the model using sets defined in Table , input parameters defined in Table , and variables defined in Table .
Table 1. Sets.
Table 2. Parameters.
Table 3. Variables.
4.3. Objective function
Our stochastic programming model represents overall costs for a two-stage multi-echelon global SC. The objective of the model is to identify a first-stage decision that minimises first-stage SC cost and the expected cost of the second-stage decision. First-stage SC cost is scenario-independent so in the objective function given in (Equation1(1)
(1) ) the values for
do not vary with ω for
(1)
(1) SC cost per time period includes material/parts purchasing cost, labour/processing cost, transportation cost, storage cost and capital holding cost for products in inventory, stockout cost, and capital holding cost for products in transit and under progress. Residual value of products at SC nodes at the end of the considered time horizon is computed and deducted from SC cost. For an SC with catastrophe insurance, damage cost caused by the pre-defined catastrophe is partially or fully indemnified by the insurer. SC cost is computed according to (Equation2
(2)
(2) ).
(2)
(2) The objective function (Equation1
(1)
(1) ) attempts to find operations plans that minimise SC costs. These operations plans should also maximise SC profits which can be written as
.
4.4. Constraints
We introduce a constraint for balancing product flows at each SC node. Each purchase order at an assembly centre triggers shipment of parts/components from an upstream supplier (see Figure ). Parts/Components that arrive at the same time may be from different suppliers, departed in different time periods, and/or transported with different transportation modes. Once parts/components arrive at a warehouse, they may be stored at the warehouse or directly sent for further processing. The constraints defining inventory of a component/part at an assembly centre follows:
(3)
(3) Note that we use two different constraints for parts/components at each SC node. Equation (Equation3
(3)
(3) ) is for items before being processed at an SC node. We introduce the next constraint (Equation (Equation4
(4)
(4) )) for the inventory of items after being processed at an SC node.
Processing of components/parts at an assembly centre takes a certain period of time. After being finalised at an assembly centre, finished products will be transported to a downstream SC node. The product flow at an assembly centre is the same as other SC nodes, except for sellers. Therefore, we use a general constraint for the inventory of components/parts/products after being processed at SC nodes (except for sellers):
(4)
(4) We use Equation (Equation5
(5)
(5) ) for the inventory of products at sellers. Finished products at sellers can be stored in warehouses or sold to customers:
(5)
(5) Transportation times are assumed to be deterministic (because uncertainty in transportation is not the focus of this research). The time of arrival depends on the time of departure (see (Equation6
(6)
(6) )). Once a batch of products arrives at a port or transfer station, they receive a customs check and/or handling activities (loading, unloading) which takes a certain period of time.
(6)
(6) Due to uncertainties of customer demand and SC operational processes, stockout is possible (when the value of
in (Equation5
(5)
(5) ) is negative). We define two auxiliary variables to differentiate between the inventory level (constraint (Equation7
(7)
(7) )) and the stockout level (constraint (Equation8
(8)
(8) )) of products at sellers. Note that the objective of the stochastic programming model is to minimise SC cost and we use the two auxiliary variables in computing the SC cost with values that are established by constraints (Equation7
(7)
(7) ) and (Equation8
(8)
(8) ).
(7)
(7)
(8)
(8) The capacity of production/processing activities at an SC node is limited. It can be constrained by the labour force, the capacity of facilities, or other resources. We use the following constraints for the production capacity at suppliers and assembly centres:
(9)
(9) Except for at sellers, the inventory levels (in (Equation3
(3)
(3) ), (Equation4
(4)
(4) ), and (Equation7
(7)
(7) )) should be non-negative, as should stockout levels (in (Equation8
(8)
(8) )).
Because of the non-anticipativity of the first-stage variables, constraints are enforced for production/processing plans:
(10)
(10) and for transportation plans:
(11)
(11)
4.5. Catastrophe related constraints and costs
In case of a catastrophe at a supplier or an assembly centre, production processes are interrupted during the time periods of the catastrophe:
(12)
(12) Meanwhile, all the inventories are destroyed, too. The affected parts/components/products cannot be sold:
(13)
(13) We deliver the damage cost of inventory to an auxiliary variable through the following constraints:
(14)
(14) Work in progress at this node will be damaged, too. The damage cost in case of a catastrophe is calculated according to (Equation15
(15)
(15) ):
(15)
(15) In this paper, we do not focus on decision maker behaviour or company behaviour. We analyse how insurance policy influences costs, especially catastrophe-related damage cost, of an entire global SC system over multiple time periods in a catastrophe-prone environment with uncertain customer demand. In addition, we study whether the impact of insurance policy differs for products with different residual value rate and whether this impact is related to the predictability of catastrophic events and customer demand.
5. Simulation experiment
5.1. Experiment setting
To make our research more realistic, we refer to an automotive company's global SC network and use real data from its annual report. Products in the investigation are characterised by high values and long production lead-times. Demand is assumed to be normally distributed. Mean (μ) and variance (σ) of the demand are assumed to be stochastically predictable based on historical sales records.
Figure shows the structure of the global SC network on which we implement our stochastic programming model. To draw a clear picture of insurance policy's impact on such a complex global SC system, we run a list of computational experiments that assume different types of information regarding catastrophes and customer demand. We present the first experiment in this section. In this experiment, we use different approaches for solving the model to validate our solution approach. We develop four additional computational experiments for sensitivity analyses and production plan analyses in the supplementary material (see Appendixes B-E in the supplementary material).
5.2. Parameters
In this experiment, we investigate SC operations planning in an environment with possible catastrophic events and fluctuating customer demand. Once a catastrophic event takes place, the main factory is disrupted for a period of time; products in inventory and in production are destroyed; production activities have to be suspended for a certain time period. Meanwhile, the catastrophe would bring large fluctuations in customer demand. An example is that thousands of cars were destroyed in Tianjin Port explosions in 2015. Several automobile production lines temporarily suspended due to the disruption.Footnote1 Meanwhile, there was an unexpected jump in automobile demand, e.g. sales of electric and hybrid cars were up by 52%.Footnote2
As we consider a catastrophe-prone environment, we aim to draw an operational plan for 49 days (first-stage of seven weeks) while considering possible catastrophes during the second stage from day 50 to day 53. The negative effect could last for multiple time periods after a catastrophe, we consider second-stage of eight weeks (from day 50 to day 115). Meanwhile, we consider a warm-up stage of 14 days prior to the first stage. The total considered time horizon of this experiment is 129 days. We assume a catastrophe may take place at an assembly centre during certain time periods with a probability of 80%. The outbreak time of a catastrophe is evenly distributed within the first 4 days of the second stage. The duration of production suspension is exponentially distributed over a period of 5 to 14 days. Customer demand for each product is normally distributed between −40% and 40% of the expected level. We simulate cases when the compensation rate increases from 0 to 0.8. The compensation rate of 0 indicates the SC is uninsured. We consider products with different residual value levels (0 and 0.8) in this experiment.
The objective is to draw an operational plan for the forthcoming planning horizon to minimise the total cost for the forthcoming horizon and the expected cost of the next horizon. Each solution represents an operational plan over a number of time periods.
5.3. Solution approaches
Due to the natural features of stochastic programming models, it is unrealistic to get a theoretically optimal solution by integrating over a continuous distribution. A realistic approach is to solve the model with a relatively small number of representative scenarios (in-sample scenarios) and simulating the solution with a large number of out-of-sample scenarios to further verify the quality of the solution. We run PySP (Watson and Woodruff Citation2011; Veliz et al. Citation2015; Gade et al. Citation2016; Fan et al. Citation2017a; Fan, Schwartz, and Voß Citation2017) and Gurobi on a compute cluster with 20 Intel Xeon E5-2630V3 CPUs and 8 NVIDIA K-80 GPUs.
To validate our solutions, we solve the model with different approaches, named extensive form solutions, expected value solutions and highest cost scenario solutions. Wait-and-see solutions are also presented as benchmarks for all other solutions.
Extensive Form (EF) solution: We randomly generated scenario samples following probability distribution functions of stochastic parameters to represent stochasticities from possible catastrophes and customer demand fluctuations in the near future (the second stage). We obtain the first-stage optimal solution by solving the extensive form based on all representative scenarios of a randomly generated scenario sample.
SC operational plans are based on the first-stage solutions after solving extensive forms of the SC model. SC operational plans are updated in a rolling horizon manner in practice. In our computational experiments, we simulate SC operational plans for the first stage and compute the expected cost of the second stage.
Expected Value Scenario (EVS) solution: The solution based on the expected value scenario is achieved by solving the deterministic model with all stochastic parameters (occurrence time and duration of a catastrophe, time series demand of products) at the expected values.
Highest Cost Scenario (HCS) solution: We randomly generated a scenario set (with 100 scenarios in our computational experiments) following probability distribution functions of stochastic parameters and solve all the individual scenario instances. The first-stage solution of the scenario which results in the highest SC costs is called the highest-cost scenario solution in this paper.
Wait-and-See (WS) solution: To provide a benchmark and show the value of information, we compute wait-and-see solutions that provide operational plans in cases when perfect information of both a catastrophe and customer demand are available. Wait-and-see solutions are not feasible solutions of our stochastic model, but are solutions when values of all stochastic parameters are known (Madansky Citation1960). Wait-and-see solutions can be used as benchmarks to indicate the quality of stochastic programming solutions.
5.4. Out-of-sample evaluation
To test the quality of our solutions, we use out-of-sample tests with 1000 randomly generated scenarios for simulating realisations of the second stage. SC costs and damage costs are computed accordingly. The expected SC cost of a first-stage solution over the 1000-scenario set shows the quality of a solution. We simulate first-stage solutions from the three different approaches (EF, EVS and HCS). WS solutions are calculated as a benchmark.
5.5. Results
In Table , we show simulation results of EF, EVS and HCS solutions, which are solved with different approaches. For each solution approach, we simulate cases when SC models with different parameters (compensation rate and residual value rate
). We present two groups of extensive form solutions by solving stochastic models with 100 representative scenarios (EF-100) and 40 representative scenarios (EF-40), respectively. We present expected values of wait-and-see solutions (WS) over the 1000-scenario set as benchmarks for other solutions. Note that WS solutions are not feasible solutions of the stochastic model. We only use the average costs of WS solutions as benchmarks for other solutions.
Table 4. Experiment results.
For each solution, we report the expected SC cost (), the first-stage cost (
) and the expected second-stage cost (
). The expected SC cost indicates the quality of the first-stage solution. The first-stage cost reflects preparation before a possible catastrophe takes place. Note that a lower first-stage cost does not result in a lower expected SC cost. We report the expected damage cost (
) and the percentage of expected damage cost in the expected SC cost (
) to show how damage cost is influenced by SC model parameters (compensation rate and residual value rate). For each solution, we also present the gaps to benchmark solutions in terms of SC cost (
) and first-stage cost (
). Moreover, CPU time of generating/computing the solution and wall-clock time (the actual time (in seconds) taken when multiple threads are used) are given to show the efficiency in obtaining the solution.
From results in Table , we see that EF solutions (EF-100 and EF-40) perform better (with lower SC costs) than EVS solutions and highest-cost scenario solutions. The quality of extensive form solutions can be improved by increasing the number of representative scenarios, whereas including more representative scenarios requires more computing time. Among all the solutions in Table , better quality solutions have higher first-stage costs. It implies that more sufficient preparation before a possible catastrophe (higher first-stage costs) helps to reduce the expected cost of possible future realisations (second-stage costs).
Among the best quality solutions (EF-100), higher compensation rates result in slightly lower (reduced by 541 or less) expected SC cost, but also induce much higher expected damage costs (increased by 4638 or more). The same tendency can be seen among EF-40 solutions. It indicates that companies have limited benefits from higher compensation rates for damages in case of stochastic catastrophes, but higher compensation rates significantly trigger higher damage costs. Though compensation rates do not influence EVS and HCS solutions, these solutions are less likely to be accepted by decision makers because of the inferior quality (higher ).
Higher residual value rates are associated with higher first-stage costs (increase by 29841 or less) and, meanwhile, much lower expected second-stage costs (reduce by 97056 or more) among EF-100 solutions. The same tendency can be seen among other solutions. Note that second-stage costs can be negative values when is 80%. The reason is that residual values of products in warehouses/production/transit are counted as revenue (negative costs) at the end of the second-stage.
It seems that a higher residual value rate may induce higher damage costs, because more redundant products are hold at SC nodes before catastrophes (in the first stage) which makes it possible to scrap more products in case of a catastrophe. This observation is consistent with results of EF solutions in Table . However, whether a higher residual value rate results in more damages worthies further research. Experiments in Appendixes B and C of the supplementary material will develop further analyses on the relationship between residual value rates and damage costs. As an aside we note that of the methods tested that can be used in practice, the EF solutions offer substantially lower costs than EVS or HCS and that using 100 scenarios of course gives better solutions than 40. The average savings for EF100 are 2% compared to EF40, 46% compared to EVS and 32% compared to HCS.
5.6. Sensitivity analyses and production plan analyses
To validate findings in this experiment, we include four additional experiments for sensitivity analyses in Appendixes (see the supplementary material). We analyse sensitivity of results to stochastic timing of the catastrophe and the insurance compensation ratio in Appendixes B and C, respectively. Results show that a higher compensation ratio always comes along with a higher damage cost in case of a catastrophe and this pattern does not depend on the timing of the catastrophe (Tables B1 and B2). The higher damage cost is induced by a higher in-processing volume at the vulnerable SC node at in case of a higher compensation ratio (Table C2).
To analyse costs in different realisations (individual scenarios), we run experiments in ideal situations with a small number of representative scenarios in Appendixes D and E of the supplementary material. Results in Appendix D show that scenarios with lower customer demand have higher damage costs in case of a catastrophe. The main reason is that given the first-stage solution, a lower customer demand results in a higher inventory level (including products in processing and products in-transit) and scrapping redundant products reduces the (inventory/holding) cost in this situation. Results in Appendix E show that scenarios with an earlier occurrence time of a catastrophe are extremely vulnerable in case of a higher compensation ratio. These scenarios are often associated with extremely high damages in case of a catastrophe.
6. Conclusions and managerial insights
In this paper, we described a global SC model and a computational experiment to analyse the impact of insurance policy on SC operational planning. Based on the results of our computational experiments, five main findings are summarised for global SCs in a catastrophe-prone environment. First, catastrophe insurance influences SC operational planning, which further affects product damages in case of a catastrophic event. Second, a higher compensation rate triggers a higher volume of processing products towards the vulnerable time period at the vulnerable SC node which induces higher catastrophe-related damages. Third, an insurance policy imposes stronger effects on catastrophe-related damages of products with a low residual value rate than products with a high-residual value rate. Fourth, catastrophe-related damages are higher when facing lower customer demand than expected. Fifth, an insurance policy does not affect SC operational planning if customer demand and the catastrophic event are accurately predictable. Moreover, the qualitative conclusions are irrespective of whether the timing of the catastrophe is stochastic. A much more extensive study of the detailed effects of uncertainty in timing is left for future research.
This paper contributes to the field of SC disruption risk management by focussing on operational planning. The impact of a catastrophic event ripples through multiple echelons of a global SC, including final customers and production and transportation activities. This brings challenges in quantitatively analysing the impact of a catastrophic event to global SC operational planning. So far, research on operational planning strategies for both disruption risk and uncertain customer demand of a global SC has rarely been carried out. To the best of the authors' knowledge, this is the first paper conducting research on operational planning strategies for a multi-echelon global SC facing both disruption risks and uncertain customer demand. This contributes to closing the research gap associated with analysing the impact of hybrid disruptions and uncertainties on global SCs and providing decision support on production plans and transportation plans of global SCs in such a disruptive environment. By simulating production activities for each product of each SC node within each time period when facing catastrophic disruptions and customer demand fluctuations when different insurance policies are applied, we were able to systematically analyse the impact of an insurance policy on operational planning of a global SC, which fills in the research gap of quantitative methods for analysing the impacts of simultaneously implementing multiple mitigation strategies.
Valuable insights for insurance policy design are summarised from our computational simulation results. They alert insurance policy makers that in facing customer demand fluctuations, a global SC may scrap redundant products to reduce inventory costs and the volume of damages can be higher when the SC is insured against the catastrophe. The main reason is that bringing in catastrophe insurance changes SC operational planning in an uncertain environment. We suggest insurance policy makers be mindful of the impact of insurance policy on global SCs' operational planning. A high compensation rate may have a mixed effect on global SCs and the insurer. SCs with more redundant products likely have higher catastrophe-related damages. Insurance policy makers should take into account potential risks of policy holders scrapping redundant products, especially low-residual value products, when making insurance policies.
To eliminate the impact of insurance policy on SC operational planning, a possible solution is to enhance collaborations among global SCs. Our research results suggest manufacturers should collaborate with each other on sharing redundant materials and parts. Partner companies can benefit from making use of each other's redundant products and, meanwhile, reduce the probability of scrapping redundant products. In addition, governments could issue rules to regulate company behaviour to avoid scrapping redundant products. Another solution is that, instead of compensating catastrophe-related damages, insurers may compensate the costs of adjusting operational plans if this portion of the cost can be fairly identified. Governments could issue policies/rules for managing low-residual value products in a disruptive environment. For example, building an e-platform for manufacturers to share information about redundant materials or parts would be helpful.
Further research should be conducted to evaluate whether these solutions are viable in practice and how to effectively deploy these solutions to global SCs. In this paper, we assumed that decision makers would take the decision generated with our model, whereas decision maker behaviour is influenced by many other factors, e.g. the decision maker's personal characteristics and preferences. It may be meaningful to incorporate decision makers' behaviour into consideration for the next step in research.
Supplemental Material
Download PDF (236.5 KB)Disclosure statement
No potential conflict of interest was reported by the author(s).
Data availability statement
The data that support the findings of this article are available from the corresponding author, Y. Fan. upon reasonable request.
Additional information
Notes on contributors

Yingjie Fan
Yingjie Fan is an assistant professor at the Leiden Institute of Advanced Computer Science (LIACS), Leiden University. Yingjie Fan received her Ph.D. from the University of Hamburg. Her research focus is on supply chain management and logistics in an uncertain environment. She works on applying stochastic optimisation, robust optimisation, and multi-objective optimisation for production and transportation planning of large-scale supply chain networks. Her research interests also include behavioural operations research and learning-based optimisation in last-mile logistics.

Frank Schwartz
Frank Schwartz is a lecturer at the Institute of Information Systems at the University of Hamburg. He studied industrial engineering at the University of Hamburg, the Technical University of Hamburg and the University of Applied Sciences in Hamburg (Germany). In 2004, he received his Ph.D. from the University of Hamburg. With the focus on stochastic optimisation, he published several research papers in the context of disruption management in production systems as well as papers regarding postponement strategies in logistics systems.

Stefan Voß
Stefan Voß is professor and director of the Institute of Information Systems at the University of Hamburg. Moreover, he recently served as dean of the Hamburg Business School (School of Business Administration) until the end of 2022. Previous positions include full professor and head of the department of Business Administration, Information Systems and Information Management at the University of Technology Braunschweig (Germany) from 1995 up to 2002. He holds degrees in Mathematics (diploma) and Economics from the University of Hamburg and a Ph.D. and the habilitation from the University of Technology Darmstadt. His current research interests are in quantitative/information systems approaches to supply chain management and logistics including public mass transit and telecommunications. He is author and co-author of several books and several hundred papers in various journals. In the German Handelsblatt and Wirtschaftswoche rankings he is continuously within the top 10 professors in business administration within the German speaking countries. Stefan Voß serves on the editorial board of some journals including being Editor of Public Transport. He is frequently organising workshops and conferences. Furthermore, he is consulting with several companies.

David L. Woodruff
David Woodruff is a professor of Management at the Graduate School of Management, UC Davis. He earned his Ph.D. in industrial engineering and management sciences from Northwestern University. His current research primarily concerns computational aspects of optimisation under uncertainty. His research includes solution algorithms, problem representation and modelling language support. He has worked on applications in operations, logistics, science, and has been involved recently in several applications in electrical energy planning and scheduling. He was one of the developers of Pyomo, (www.pyomo.org) that won the INFORMS Computing Society prize in 2019 and an R&D 100 award in 2016.
Notes
References
- Al Naimi, Maryam, Mohd Nishat Faisal, Rana Sobh, and Lamay Bin Sabir. 2022. “A Systematic Mapping Review Exploring 10 Years of Research on Supply Chain Resilience and Reconfiguration.” International Journal of Logistics Research and Applications 25 (8): 1191–1218. doi:10.1080/13675567.2021.1893288.
- Badakhshan, Ehsan, and Peter Ball. 2022. “Applying Digital Twins for Inventory and Cash Management in Supply Chains under Physical and Financial Disruptions.” International Journal of Production Research 1–23, ahead-of-print. doi:10.1080/00207543.2022.2093682.
- Baryannis, George, Samir Dani, and Grigoris Antoniou. 2019. “Predicting Supply Chain Risks Using Machine Learning: The Trade-Off Between Performance and Interpretability.” Future Generation Computer Systems 101: 993–1004. doi:10.1016/j.future.2019.07.059.
- Belhadi, Amine, Venkatesh Mani, Sachin S. Kamble, Syed Abdul Rehman Khan, and Surabhi Verma. 2021. “Artificial Intelligence-Driven Innovation for Enhancing Supply Chain Resilience and Performance under the Effect of Supply Chain Dynamism: An Empirical Investigation.” Annals of Operations Research, 1–26, ahead-of-print. doi:10.1007/s10479-021-03956-x.
- Bhuiyan, Tanveer Hossain, Hugh R. Medal, and Sarah Harun. 2020. “A Stochastic Programming Model with Endogenous and Exogenous Uncertainty for Reliable Network Design under Random Disruption.” European Journal of Operational Research 285 (2): 670–694. doi:10.1016/j.ejor.2020.02.016.
- Braden, Dustin. 2016. “Hanjin Shipping Bankruptcy.” http://www.joc.com/special-topics/hanjin-shipping-bankruptcy.
- Chen, Xin, Stephen Shum, and David Simchi-Levi. 2014. “Stable and Coordinating Contracts for a Supply Chain with Multiple Risk-Averse Suppliers.” Production and Operations Management 23 (3): 379–392. doi:10.1111/poms.12073.
- Choi, Tsan-Ming, Stein W. Wallace, and Yulan Wang. 2018. “Big Data Analytics in Operations Management.” Production and Operations Management 27 (10): 1868–1883. doi:10.1111/poms.12838.
- Christopher, Martin, and Barbara Gaudenzi. 2015. “Managing Risks in Sustainable Supply Chains.” Sinergie Italian Journal of Management 33 (96): 57–74. doi:10.7433/s96.2015.04.
- Dlugolecki, Andrew, and Erik Hoekstra. 2006. “The Role of the Private Market in Catastrophe Insurance.” Climate Policy 6 (6): 648–657. doi:10.1080/14693062.2006.9685630.
- Dolgui, Alexandre, and Dmitry Ivanov. 2021. “Ripple Effect and Supply Chain Disruption Management: New Trends and Research Directions.” International Journal of Production Research 59 (1): 102–109. doi:10.1080/00207543.2021.1840148.
- Dolgui, Alexandre, Dmitry Ivanov, and Boris Sokolov. 2020. “Reconfigurable Supply Chain: The X-Network.” International Journal of Production Research58 (13): 4138–4163. doi:10.1080/00207543.2020.1774679.
- Dong, Lingxiu, Sammi Yu Tang, and Brian Tomlin. 2018. “Production Chain Disruptions: Inventory, Preparedness, and Insurance.” Production and Operations Management 27 (7): 1251–1270. doi:10.1111/poms.12866.
- Dong, Lingxiu, and Brian Tomlin. 2012. “Managing Disruption Risk: The Interplay Between Operations and Insurance.” Management Science 58 (10): 1898–1915. doi:10.1287/mnsc.1120.1524.
- Dunke, Fabian, Iris Heckmann, Stefan Nickel, and Francisco Saldanha-da Gama. 2018. “Time Traps in Supply Chains: Is Optimal Still Good Enough?.” European Journal of Operational Research 264 (3): 813–829. doi:10.1016/j.ejor.2016.07.016.
- Eggert, Linda, Yingjie Fan, and Stefan Voß. 2016. “Data-Intensive Analytics for Cat Bonds by Considering Supply Chain Risks.” Lecture Notes in Computer Science 9748: 136–147. doi:10.1007/978-3-319-40406-6.
- Ermoliev, Yuri M., T. Yu Ermolieva, Gordon J. MacDonald, and Vladimir I. Norkin. 2000. “Stochastic Optimization of Insurance Portfolios for Managing Exposure to Catastrophic Risks.” Annals of Operations Research 99 (1-4): 207–225. doi:10.1023/A:1019244405392.
- Fan, Yingjie, Leonard Heilig, and Stefan Voß. 2015. “Supply Chain Risk Management in the Era of Big Data.” Lecture Notes in Computer Science 9186: 283–294. doi:10.1007/978-3-319-20886-2.
- Fan, Yingjie, Frank Schwartz, and Stefan Voß. 2017. “Flexible Supply Chain Planning Based on Variable Transportation Modes.” International Journal of Production Economics 183: 654–666. doi:10.1016/j.ijpe.2016.08.020.
- Fan, Yingjie, Frank Schwartz, Stefan Voß, and David L. Woodruff. 2017a. “Stochastic Programming for Flexible Global Supply Chain Planning.” Flexible Services and Manufacturing Journal 29 (3–4): 601–633. doi:10.1007/s10696-016-9261-7.
- Fan, Yingjie, Frank Schwartz, Stefan Voß, and David L. Woodruff. 2017b. “Stochastic Programming for Global Supply Chain Planning under Uncertainty: An Outline.” Lecture Notes in Computer Science10572: 437–451. doi:10.1007/978-3-319-68496-3.
- Farrokh, Mojtaba, Adel Azar, Gholamreza Jandaghi, and Ehsan Ahmadi. 2018. “A Novel Robust Fuzzy Stochastic Programming for Closed Loop Supply Chain Network Design under Hybrid Uncertainty.” Fuzzy Sets and Systems 341: 69–91. doi:10.1016/j.fss.2017.03.019.
- Fattahi, Mohammad, and Kannan Govindan. 2018. “A Multi-Stage Stochastic Program for the Sustainable Design of Biofuel Supply Chain Networks under Biomass Supply Uncertainty and Disruption Risk: A Real-Life Case Study.” Transportation Research Part E: Logistics and Transportation Review 118: 534–567. doi:10.1016/j.tre.2018.08.008.
- Fattahi, Mohammad, Kannan Govindan, and Reza Maihami. 2020. “Stochastic Optimization of Disruption-Driven Supply Chain Network Design with a New Resilience Metric.” International Journal of Production Economics 230: Article ID 107755. doi:10.1016/j.ijpe.2020.107755.
- Gade, Dinakar, Gabriel Hackebeil, Sarah M. Ryan, Jean-Paul Watson, Roger J.-B. Wets, and David L. Woodruff. 2016. “Obtaining Lower Bounds from the Progressive Hedging Algorithm for Stochastic Mixed-Integer Programs.” Mathematical Programming 157 (1): 47–67. doi:10.1007/s10107-016-1000-z.
- Gao, Long, Nan Yang, Renyu Zhang, and Ting Luo. 2017. “Dynamic Supply Risk Management with Signal-Based Forecast, Multi-Sourcing, and Discretionary Selling.” Production and Operations Management 26 (7): 1399–1415. doi:10.1111/poms.12695.
- Govindan, Kannan, and T. C. E. Cheng. 2018. “Advances in Stochastic Programming and Robust Optimization for Supply Chain Planning.” Computers & Operations Research 100: 262–269. doi:10.1016/j.cor.2018.07.027.
- Gupta, Sushil, Martin K. Starr, Reza Zanjirani Farahani, and Niki Matinrad. 2016. “Disaster Management from a POM Perspective: Mapping a New Domain.” Production and Operations Management 25 (10): 1611–1637. doi:10.1111/poms.12591.
- Hamdan, Bayan, and Ali Diabat. 2019. “A Two-Stage Multi-Echelon Stochastic Blood Supply Chain Problem.” Computers & Operations Research 101: 130–143. doi:10.1016/j.cor.2018.09.001.
- Hamdan, Bayan, and Ali Diabat. 2020. “Robust Design of Blood Supply Chains under Risk of Disruptions Using Lagrangian Relaxation.” Transportation Research Part E: Logistics and Transportation Review134: Article ID 101764. doi:10.1016/j.tre.2019.08.005.
- Haraguchi, Masahiko, and Upmanu Lall. 2015. “Flood Risks and Impacts: A Case Study of Thailand's Floods in 2011 and Research Questions for Supply Chain Decision Making.” International Journal of Disaster Risk Reduction 14: 256–272. doi:10.1016/j.ijdrr.2014.09.005.
- Hayashi, Masatsugu, and Larry Hughes. 2013. “The Fukushima Nuclear Accident and Its Effect on Global Energy Security.” Energy Policy 59: 102–111. doi:10.1016/j.enpol.2012.11.046.
- Ivanov, Dmitry. 2021. “Supply Chain Viability and the COVID-19 Pandemic: A Conceptual and Formal Generalisation of Four Major Adaptation Strategies.” International Journal of Production Research 59 (12): 3535–3552. doi:10.1080/00207543.2021.1890852.
- Ivanov, Dmitry, Alexandre Dolgui, Boris Sokolov, and Marina Ivanova. 2017. “Literature Review on Disruption Recovery in the Supply Chain.” International Journal of Production Research 55 (20): 6158–6174. doi:10.1080/00207543.2017.1330572.
- Jabbarzadeh, Armin, Michael Haughton, and Amir Khosrojerdi. 2018. “Closed-Loop Supply Chain Network Design Under Disruption Risks: A Robust Approach with Real World Application.” Computers & Industrial Engineering 116: 178–191. doi:10.1016/j.cie.2017.12.025.
- Jaffee, Dwight M., and Thomas Russell. 1997. “Catastrophe Insurance, Capital Markets, and Uninsurable Risks.” Journal of Risk and Insurance 64: 205–230. doi:10.2307/253729.
- Jordan, William C., and Stephen C. Graves. 1995. “Principles on the Benefits of Manufacturing Process Flexibility.” Management Science 41 (4): 577–594. doi:10.1287/mnsc.41.4.577.
- Jüttner, Uta, Helen Peck, and Martin Christopher. 2003. “Supply Chain Risk Management: Outlining an Agenda for Future Research.” International Journal of Logistics: Research and Applications 6 (4): 197–210. doi:10.1080/13675560310001627016.
- Kähkönen, Anni-Kaisa, Pietro Evangelista, Jukka Hallikas, Mika Immonen, and Katrina Lintukangas. 2021. “COVID-19 as a Trigger for Dynamic Capability Development and Supply Chain Resilience Improvement.” International Journal of Production Research, 1–20, ahead-of-print. doi:10.1080/00207543.2021.2009588.
- King, Alan, and Stein Wallace. 2012. Modeling With Stochastic Programming. New York, NY: Springer New York. doi:10.1007/978-0-387-87817-1.
- Kumar, Ram L., and Sungjune Park. 2019. “A Portfolio Approach to Supply Chain Risk Management.” Decision Sciences 50 (2): 210–244. doi:10.1111/deci.12332.
- Li, Xueping, and Kaike Zhang. 2018. “A Sample Average Approximation Approach for Supply Chain Network Design with Facility Disruptions.” Computers & Industrial Engineering 126: 243–251. doi:10.1016/j.cie.2018.09.039.
- Llaguno, Arrate, Josefa Mula, and Francisco Campuzano-Bolarin. 2022. “State of the Art, Conceptual Framework and Simulation Analysis of the Ripple Effect on Supply Chains.” International Journal of Production Research 60 (6): 2044–2066. doi:10.1080/00207543.2021.1877842.
- Ma, Peng, Yue Meng, Yeming Gong, and Mingdu Li. 2022. “Optimal Models for Sustainable Supply Chain Finance: Evidence from Electric Vehicle Industry.” International Journal of Production Research, 1–19, ahead-of-print. doi:10.1080/00207543.2022.2093142.
- Madansky, Albert. 1960. “Inequalities for Stochastic Linear Programming Problems.” Management Science 6 (2): 197–204. doi:10.1287/mnsc.6.2.197.
- Mihalascu, Dan. 2015. “At Least 8000 Vehicles Destroyed by Apocalyptic Explosions at China's Tianjin Port.” http://www.carscoops.com/2015/08/at-least-8000-vehicles-destroyed-by.html.
- Min, Hokey. 2019. “Blockchain Technology for Enhancing Supply Chain Resilience.” Business Horizons62 (1): 35–45. doi:10.1016/j.bushor.2018.08.012.
- Mohammed, Ahmed, Ana Beatriz Lopes de Sousa Jabbour, and Ali Diabat. 2021. “COVID-19 Pandemic Disruption: A Matter of Building Companies' Internal and External Resilience.” International Journal of Production Research, 1–22, ahead-of-print. doi:10.1080/00207543.2021.1970848.
- Nebolsina, Elena. 2021. “The Impact of the Covid-19 Pandemic on the Business Interruption Insurance Demand in the United States.” Heliyon 7 (11): e08357. doi:10.1016/j.heliyon.2021.e08357.
- Ruel, Salomée, and Jamal El Baz. 2021. “Disaster Readiness' Influence on the Impact of Supply Chain Resilience and Robustness on Firms' Financial Performance: A COVID-19 Empirical Investigation.” International Journal of Production Research, 1–19, ahead-of-print. doi:10.1080/00207543.2021.1962559.
- Sabouhi, Fatemeh, Mir Saman Pishvaee, and Mohammad Saeed Jabalameli. 2018. “Resilient Supply Chain Design under Operational and Disruption Risks Considering Quantity Discount: A Case Study of Pharmaceutical Supply Chain.” Computers & Industrial Engineering 126: 657–672. doi:10.1016/j.cie.2018.10.001.
- Sanders, Nada R., and Ram Ganeshan. 2018. “Big Data in Supply Chain Management.” Production and Operations Management 27 (10): 1745–1748. doi:10.1111/poms.12892.
- Sawik, Tadeusz. 2019. “Disruption Mitigation and Recovery in Supply Chains Using Portfolio Approach.” Omega 84: 232–248. doi:10.1016/j.omega.2018.05.006.
- Sazvar, Zeinab, Mahsa Zokaee, Reza Tavakkoli-Moghaddam, Samira Al-sadat Salari, and Sina Nayeri. 2021. “Designing a Sustainable Closed-Loop Pharmaceutical Supply Chain in a Competitive Market Considering Demand Uncertainty, Manufacturer's Brand and Waste Management.” Annals of Operations Research 315, 2057–2088. doi:10.1007/s10479-021-03961-0.
- Schultz, Paul. 2022. “Aon Securities' Annual Insurance-Linked Securities (ILS) Report.” Accessed 1 December 2022. https://www.aon.com/reinsurance/thoughtleadership/default/ils-annual-report-2022.
- Serpa, Juan Camilo, and Harish Krishnan. 2017. “The Strategic Role of Business Insurance.” Management Science 63 (2): 384–404. doi:10.1287/mnsc.2015.2348.
- Shi, Dailun. 2004. “A Review of Enterprise Supply Chain Risk Management.” Journal of Systems Science and Systems Engineering 13 (2): 219–244. doi:10.1007/s11518-006-0162-2.
- Simchi-Levi, David, He Wang, and Yehua Wei. 2018. “Increasing Supply Chain Robustness Through Process Flexibility and Inventory.” Production and Operations Management 27 (8): 1476–1491. doi:10.1111/poms.12887.
- Smith, Kane J, and Gurpreet Dhillon. 2019. “Supply Chain Virtualization: Facilitating Agent Trust Utilizing Blockchain Technology.” In Revisiting Supply Chain Risk, 299–311. Springer.
- Snoeck, André, Maximiliano Udenio, and Jan C. Fransoo. 2019. “A Stochastic Program to Evaluate Disruption Mitigation Investments in the Supply Chain.” European Journal of Operational Research274 (2): 516–530. doi:10.1016/j.ejor.2018.10.005.
- Snyder, Lawrence V., Zümbül Atan, Peng Peng, Ying Rong, Amanda J. Schmitt, and Burcu Sinsoysal. 2016. “OR/MS Models for Supply Chain Disruptions: A Review.” IIE Transactions 48 (2): 89–109. doi:10.1080/0740817X.2015.1067735.
- Stecke, Kathryn E., and Sanjay Kumar. 2009. “Sources of Supply Chain Disruptions, Factors that Breed Vulnerability, and Mitigating Strategies.” Journal of Marketing Channels 16 (3): 193–226. doi:10.1080/10466690902932551.
- Surminski, Swenja, and Jillian Eldridge. 2015. “Flood Insurance in England: An Assessment of the Current and Newly Proposed Insurance Scheme in the Context of Rising Flood Risk”.
- Tang, Christopher S. 2006. “Perspectives in Supply Chain Risk Management.” International Journal of Production Economics 103 (2): 451–488. doi:10.1016/j.ijpe.2005.12.006.
- Tomlin, Brian. 2006. “On the Value of Mitigation and Contingency Strategies for Managing Supply Chain Disruption Risks.” Management Science 52 (5): 639–657. doi:10.1287/mnsc.1060.0515.
- Veliz, Fernando Badilla, Jean-Paul Watson, Andres Weintraub, Roger J.-B. Wets, and David L. Woodruff. 2015. “Stochastic Optimization Models in Forest Planning: A Progressive Hedging Solution Approach.” Annals of Operations Research 232 (1): 259–274. doi:10.1007/s10479-014-1608-4.
- Watson, Jean-Paul, and David L. Woodruff. 2011. “Progressive Hedging Innovations for a Class of Stochastic Mixed-Integer Resource Allocation Problems.” Computational Management Science 8 (4): 355–370. doi:10.1007/s10287-010-0125-4.
- Wicaksana, Agus, William Ho, Srinivas Talluri, and Alexandre Dolgui. 2022. “A Decade of Progress in Supply Chain Risk Management: Risk Typology, Emerging Topics, and Research Collaborators.” International Journal of Production Research 60 (24): 7155–7177. doi:10.1080/00207543.2022.2077672.
- Yang, Lei, Gangshu Cai, and Jian Chen. 2018. “Push, Pull, and Supply Chain Risk-Averse Attitude.” Production and Operations Management 27 (8): 1534–1552. doi:10.1111/poms.12881.
- Zhao, Jie, Ji Yun Lee, Yue Li, and Yue-Jun Yin. 2020. “Effect of Catastrophe Insurance on Disaster-Impacted Community: Quantitative Framework and Case Studies.” International Journal of Disaster Risk Reduction 43, Article ID 101387. doi:10.1016/j.ijdrr.2019.101387.
- Zhen, Xueping, Yongjian Li, Gangshu George Cai, and Dan Shi. 2016. “Transportation Disruption Risk Management: Business Interruption Insurance and Backup Transportation.” Transportation Research Part E: Logistics and Transportation Review 90: 51–68. doi:10.1016/j.tre.2016.01.005.