
 ?Mathematical formulae have been encoded as MathML and are displayed in this HTML version using MathJax in order to improve their display. Uncheck the box to turn MathJax off. This feature requires Javascript. Click on a formula to zoom.
Abstract
Operations management researchers and practitioners have shown increasing interest in incorporating sustainability into supply chain (SC) design models. This means that sustainability must be considered in all aspects of the SC, including location, inventory and transportation (LIT) decisions. Hence the aim of this article is to propose an optimisation model that incorporates: (i) LIT decisions in an integrated manner; (ii) the three sustainability (3S) aspects, i.e. economic, environmental and social, into each named decisions; and (iii) a closed-loop supply chain (CLSC) structure. The proposed formulation is a multi-objective mixed integer non-linear programming (MO-MINLP) model whose objectives consider minimisation of economic and social costs (economic aspect) and carbon emissions (environmental aspect), and maximisation of the social impact of SC operations (social aspect). A transformation technique is applied to one of the objective functions, which results in an MO-MILP model solved by the lexicographic method. This article focuses on commodity industries where only one finished product is manufactured. Hence the 3S-LIT model is validated with a randomly generated dataset and against a recently published alternative model applied to the copper mining industry.
Introduction
Sustainable supply chain management (SSCM) is defined as the management of material, information and capital flows, and cooperation among companies along the supply chain (SC). It also takes into account goals from all three sustainable (3S) aspects (i.e. economic, environmental and social), which derive from customer and stakeholder requirements (Seuring and Müller Citation2008). Reducing emissions is a global challenge for organisations to improve their strategies and plans in production by incorporating sustainable practices (Tiwari, Daryanto, and Wee Citation2018). As organisations are becoming more aware that their activity has environmental and social impacts, they seek to set up sustainable practices that are imposed mainly by stakeholders (Bubicz, Barbosa-Póvoa, and Carvalho Citation2019). True sustainability is closely interrelated. Socio-environmental practices and economic performance can be simultaneously pursued (Govindan, Shaw, and Majumdar Citation2021; Krug, Guillaume, and Battaïa Citation2021). A classification for the SC structure and its relation to sustainable inventory management (SIM) is extended and analysed by Becerra, Mula, and Sanchis (Citation2021). It includes closed-loop SCs (CLSCs), which consist of integrating forward logistics and reverse logistics (RL), and such action is a key component of CLSCs. This system contains a series of activities, such as collection, cleaning, disassembly, testing and sorting, storage, transportation and recovery operations, and employs traditional SC structures (Bostel, Dejax, and Lu Citation2005). Here circular economy (CE) strategies are proposed to support SCs because these SC designs contribute to economic, environmental and social competitiveness (Carrasco-Gallego Citation2010; Geisendorf and Pietrulla Citation2018; Rentizelas et al. Citation2022). CE aims to prevent the depletion of resources, close energy and materials loops, and to facilitate sustainable development by implementing it into enterprises, consumers, economic agents and governments (Prieto-Sandoval, Jaca, and Ormazabal Citation2018). In line with this, Mishra, Hopkinson, and Tidridge (Citation2018) argue that value creation from CLSCs driven by CE is possible. It is noteworthy that not all the systems that incorporate circular flows are intrinsically more sustainable. The reason for this is that CE practices focus mostly on the environment and ignore the socio-economic aspects of sustainability (Alarcón et al. Citation2020). According to MahmoumGonbadi, Genovese, and Sgalambro (Citation2021), there is a gap in the literature between SC design and the founding principles of CE based on simplistic methods for measuring sustainability by considering only economic and environmental aspects, but not social implications. Here optimisation models can help to support decision making in SC designs; i.e. decisions about facility, warehouse and collection centre locations, selection of suppliers and distributors, and optimal routes to transport products in CLSCs, by considering forward logistics and RL. The complexity of designing SCs according to CE and sustainability principles lies in a trade-off among the three elements of the triple bottom line of sustainability in SC operations to find the optimal solution for them all (Tang, Ji, and Jiang Citation2016).
Of the previous approaches that address location, inventory and transportation (LIT) decisions in the SC context, we highlight that our proposal is oriented to the commodity industry. It optimises a sustainable economic order quantity (EOQ) inventory policy with a mathematical programming model (Battini, Persona, and Sgarbossa Citation2014) by planning facility locations and product transportation to minimise costs and CO2 emissions, and to maximise social impacts. Here employing EOQ models agrees with a trend that has not stopped growing (Alfares and Ghaithan Citation2019; Khan et al. Citation2011) since it appeared. These models are widely used in industry sectors, such as mining (Teplická and Čulkov�� Citation2020), glass (Ngadono and Ikatrinasari Citation2020) vending machines (Puchades and Mula Citation2004), among others. Recently, Akbari-Kasgari et al. (Citation2022) proposed an SC design model for the copper mining industry with location and routing decisions. It focuses on SC resilience by considering the 3S. However, those authors did not consider inventory decisions in the SC.
The main contributions of this paper are to:
Provide a new multi-objective mixed integer non-linear programming (MO-MINLP) model to incorporate the 3S into a LIT optimisation problem, dubbed as 3S-LIT, in a CLSC context.
Generate a multi-objective mixed integer linear programming (MO-MILP) model by applying a linearisation technique.
Authenticate the usefulness and computational efficiency of our proposal with different sized datasets based on the cooper mining industry, which is a representative and relevant commodity industry. In this way, a copper deficit is estimated given an increase in the demand for metal to supply electromobility, and the scarce supply of mined and explored ore required to meet demand (Moors and Keen Citation2022).
Compare the proposed model’s performance to an alternative proposal by Akbari-Kasgari et al. (Citation2022)which was also applied to the copper mining industry.
Hence according to the context-intervention-mechanism-outcome (CIMO) structure for the research questions proposed by (Denyer, Tranfield, and van Aken Citation2008), we propose that the main focal research question of this paper looks at developing a new optimisation model for sustainable LIT decisions in a CLSC. Here the context is related to CLSCs, the intervention refers to LIT decisions, the mechanism is oriented to mathematical programming models, and outcome considers SC design and performance. To do so, we provide a tool capable of sustainably managing inventories in an integrated manner with location and transportation decisions by contemplating the 3S; i.e. minimising costs and environmental emissions; maximising the positive social impact of LIT decisions. To the best of our knowledge, this is the first time that all the 3S objectives are addressed in an integrated manner for all three decisions of the LIT problem as our 3S-LIT proposal.
The remainder of this paper is organised as follows. Section 2 presents the literature review. Section 3 sets out the problem statement, describes the 3S-LIT model formulation and introduces the solution methodology. Section 4 describes the computational results, validates the 3S-LIT and compares it to an alternative model in the published literature. Section 5 provides the main managerial insights and practical implications. Finally, Section 6 indicates the conclusions and further research lines.
Literature review
Becerra, Mula, and Sanchis (Citation2021, Citation2022) previously conducted an extensive literature review on SIM quantitative models in a green SC. Its main findings conclude that a SIM model in a green SC should be modelled with mathematical programming by incorporating the 3S, and by considering facility location factors, inventory management aspects and transportation routes as a whole to improve the system’s performance. Table shows a review of the scientific literature available in the Scopus and Web of Science databases about sustainable SC design with an integrated formulation of LIT decisions by mathematical programming models using a time window from 2015. This was when the European Commission adopted its first CE action plan, which included measures such as fostering global competitiveness, sustainable economic and employment growth.
Table 1. Review of the articles about sustainable SC designs for modelling LIT problems by mathematical programming.
Modelling approach
Most of the reviewed articles (75%) develop a multi-objective model that allows some sustainability aspects to be incorporated as an objective of the proposed models. Metaheuristics as a solution approach is widely used as follows: non-dominated sorting genetic algorithm (GA) II (Asadi et al. Citation2018; Mogale, Cheikhrouhou, and Tiwari Citation2020; Mogale, De, et al. Citation2022; Moslemi et al. Citation2017) multiple objective particle swarm optimisation (PSO) (Asadi et al. Citation2018; Goodarzian et al. Citation2022; Mogale, Cheikhrouhou, and Tiwari Citation2020); GA (Aloui, Hamani, and Delahoche Citation2021; Goodarzian et al. Citation2022); teaching-learning-based optimisation (Goodarzian et al. Citation2022); multi-objective global, local and neighboured PSO (Chan et al. Citation2020; Mogale, Ghadge, et al. Citation2022) self-adaptive GA (Zhalechian et al. Citation2016). Furthermore, the use of exact methods to solve models is based mainly on weighted (Akbari-Kasgari et al. Citation2022; Ali et al. Citation2020; Jabarzadeh et al. Citation2020), e-constrained (Akbari-Kasgari et al. Citation2022), augmented e-constrained (Moslehi, Sahebi, and Teymouri Citation2021), fuzzy theory (Tavana et al. Citation2021) and hierarchical (Lv and Sun Citation2022) methods.
Sustainability aspects
It is transversal to any study that seeks SC sustainability to contemplate the economic factor, whose main inputs for optimisation models are costs, revenues, prices and capital. The studies that take only the economic factor as an objective function are incorporated into the analysis because their formulation considers environmental aspects like RL-related costs (Akbari-Kasgari et al. Citation2020; Guo et al. Citation2018; Y. Li, Guo, and Zhang Citation2018) and minimisation of carbon emissions by using less fuel (Tavana et al. Citation2021). Regarding the environmental factor, the most recurrent impact is related to CO2 emissions from energy use (Saif and Elhedhli Citation2016). This is relevant because SC activities are often responsible for more than 75% of greenhouse gas (GHG) emissions (Huang, Weber, and Matthews Citation2009). The literature review indicates that minimising carbon emissions is the most widely applied objective (Ali et al. Citation2020; Aloui, Hamani, and Delahoche Citation2021; Chan et al. Citation2020; Goodarzian et al. Citation2022; Jabarzadeh et al. Citation2020; Jemai and Sarkar Citation2019; Lv and Sun Citation2022; Mogale, Cheikhrouhou, and Tiwari Citation2020; Mogale, De, et al. Citation2022; Mogale, Ghadge, et al. Citation2022; Mogale, Kumar, and Tiwari Citation2020; Moslemi et al. Citation2017). Another way to incorporate the environmental aspect is by quantifying the advantage generated by recovering and recycling discarded products (Moslehi, Sahebi, and Teymouri Citation2021). There is an unbalanced situation towards the 3S pillars that results in research gaps appearing in the social sustainability topic (Becerra, Mula, and Sanchis Citation2021; Cañas, Mula, and Campuzano-Bolarín Citation2020; Popovic et al. Citation2017). In this way, Alayón, Säfsten, and Johansson (Citation2017) propose manufacturing practices related to social sustainability production principles. This practice should be contemplated in the whole SC by incorporating aspects like all employees’ health, safety and well-being. Another consideration is that the local communities around workplaces must be respected and enhanced economically, socially, culturally and physically. Developing community-company partnerships that provide local people with jobs is a social criterion with a social sustainability aim that can be incorporated into a quantitative model with the number of direct and indirect jobs created in communities (Ganev et al. Citation2020; Ivanov and Dzhelil Citation2021). Injuries are a major social impact of operations, which are caused by both ordering and warehousing operations. They can be measured and modelled with the injury cost (Bouchery et al. Citation2012). Of the reviewed studies, only five incorporate the social aspect into their objectives. Zhalechian et al. (Citation2016) incorporates maximisation of social impacts, such as job creation and the balance of economic development for location decisions. Aloui, Hamani, and Delahoche (Citation2021) incorporate the social dimension by means of the risk rate related to road accidents. Mogale, Ghadge, et al. (Citation2022) and Goodarzian et al. (Citation2022) incorporate social sustainability by including the number of created employment opportunities and balanced economic development in the locations where their facilities are found. Akbari-Kasgari et al. (Citation2022) consider pollution emissions and water use in the environmental aspect, and seek to maximise the social utility of facilities. Finally, very few models design a CLSC and incorporate the social dimension of sustainability (Akbari-Kasgari et al. Citation2022; Zhalechian et al. Citation2016), and social aspects are considered only in the location decision, which excludes inventory and transportation decisions. Other SC structures are identified according to the classification proposed by Becerra, Mula, and Sanchis (Citation2021) and George and Madhusudanan Pillai (Citation2019).
Inventory approach
When developing a 3S-LIT model, it is necessary to highlight the significance of collaborative strategies in a competitive and environmentally conscious global economy. For instance, considering an extension of the classic EOQ policy to a sustainable economic order quantity is possible (Battini, Persona, and Sgarbossa Citation2014) by contemplating the parameters related to not only environmental and social sustainability, but also to warehousing, ordering and obsolescence; e.g. carbon emissions are generated during the distribution process and in the inventory stage (i.e. warehousing and storing deteriorating items). Warehouse emissions depend on both the total inventory and warehouse energy use per unit item. Emissions from the deteriorating item are related to its disposal (L. Li, Yang, and Qin Citation2019; Tiwari, Daryanto, and Wee Citation2018). In the reviewed articles, the most widespread inventory approach is the EOQ, which is the approach adopted herein, followed by material requirement planning (MRP) models. Zhalechian et al. (Citation2016) and Guo et al. (Citation2018) incorporate an inventory policy (s, Q), while Asadi et al. (Citation2018) apply an inventory policy (S-1, S). Those studies that incorporate the environmental impact mainly incorporate the emissions generated by stored products (Aloui, Hamani, and Delahoche Citation2021; Asadi et al. Citation2018; Goodarzian et al. Citation2022; Jabarzadeh et al. Citation2020; Mogale, Cheikhrouhou, and Tiwari Citation2020; Mogale, Ghadge, et al. Citation2022).
Research gaps
Our proposal aims to bridge the research gaps left by previous research works in sustainable LIT problems by, for example, addressing the 3S aspects in the three decisions of LIT problems. This can be done by firstly incorporating into location decisions about facilities’ carbon emission costs and the social impact they have where they are located. Then a sustainable EOQ inventory policy is considered in inventory management terms, which contemplates the carbon emissions generated by any held inventory, stored obsolete products and the negative social impact of accidents due to inventory activities. Finally, transportation decisions are associated with their respective costs, carbon emissions and the incorporation of road hazards. Here a practical application is developed in a copper mining CLSC.
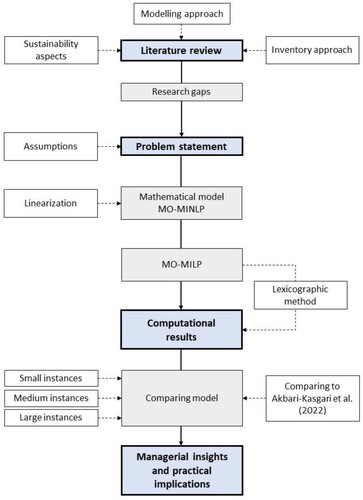
According to the literature review and the identified research gaps, our proposal follows the steps shown in Figure .
Figure 1. Methodology for the 3S-LIT proposal.
Problem statement
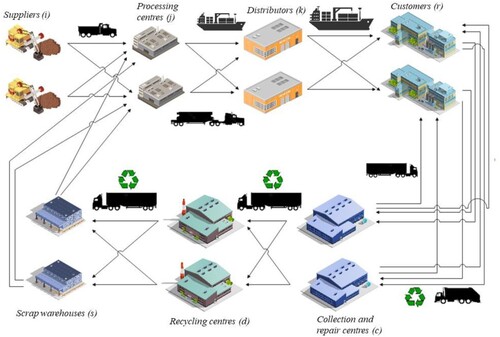
The problem under study is to design an optimal CLSC by selecting which supplier, distributor, customer, collection and repair centre, recycling centre and scrap warehouse will form part of the network during the defined planning horizon (t = 1, … , T). Another intention is to identify the optimal amount of raw material, finished product, waste and scrap that should flow along the SC. There is a set of potential entities in each echelon to form part of the SC. Firstly on forward logistics, a production plant with several processing centres and their respective processing capacities is considered for each raw material type. These centres are supplied from several suppliers with a limited production capacity per raw material type. Finished products are sent to distributors, whose tasks are to store finished products and then deliver them to different customers. Distributers’ capacity is limited, but there is the possibility of increasing that capacity. Distributors meet customer demands. However, if they fail to meet the desired quantity, shortages are generated due to unmet demand. Secondly, RL begins with potential collection and repair centres, which receive waste from customers and the local communities near these centres. Here waste is treated, which is repaired and sent back to customers. Any unrepaired waste is sent to one of the recycling centres. The unrepaired scrap received at these centres is partly recycled as scrap and the rest is disposed of as waste. Scrap is sent to one of the scrap warehouses to be stored before being transported to one of the processing centres in the production facility. Figure is an overview of the structure of the proposed CLSC.
Figure 2. 3S-LIT CLSC design.
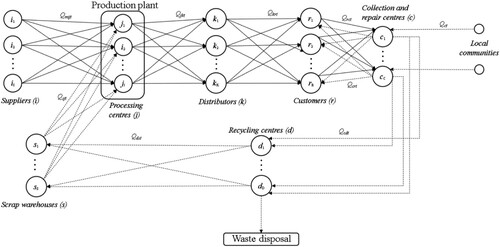
3S-LIT is also represented as a graph G = (V, A) in Figure , where V denotes the set of nodes, including: the set of suppliers i = 1, … , I; the set of processing centres j = 1, … , J; the set of distributors k = 1, … , K; the set of customers r = 1, … , R; the set of collection and repair centres c = 1, … ,C; the set of recycling centres r = 1, … ,R; the set of scrap warehouses s = 1, … ,S. A = a,b: a,b ε V, a ≠ b is the set of delivery arcs.
Figure 3. Graph of the CLSC structure proposal.
Like most SC design problems, this is considered a strategical-tactical decision level, but unlike most previously developed models, it contemplates LIT decisions in an integrated manner. Sustainability is also incorporated into the model by not only its closed-loop structure, which allows waste to be repaired and recycled, but also by minimising CO2 emissions in the environmental aspect. Regarding the social factor, the negative and positive social impacts generated by the SC are considered. It is important to highlight that our approach considers the 3S in the LIT decision types of the LIT problem under study.
For this problem, a push inventory system is considered, where production is done to generate inventory to meet demand. Moreover, forecasted demand is taken into account, and the inventory is minimised to reduce its related costs. This policy is advantageous because it avoids stock-out situations by ensuring sufficient supply. A sustainable EOQ inventory policy is also contemplated. Thus the 3S elements are contemplated in the logistics cost function, which is incorporated into the objectives of the proposed model (Table ).
Table 2. Notation.
Assumptions
A single production plant
Only one finished product
Only one waste type
Only one scrap type to be determined, which comes from the collection and repair centre, is generated at the recycling centre and goes to the scrap warehouse
The route hazard factor in terms of the potential number of people affected by possible transport accidents on different routes
The disposal of any final waste that may be generated at the recycling centre is not contemplated
Processing centres producing at maximum capacity
Shipment sizes are previously established. Fixed lot sizes are often defined in commodity contracts traded on exchanges like the London Metal Exchange (Citation2022)
A penalty for auxiliary storage to cover the cost of running an established warehouse
Auxiliary capacity, but only if all the distributors have been used
Shortages are taken as lost demand. Backorder demands are not allowed
Mathematical model
An MO-MINLP model is proposed to solve the CLSC design problem when considering a 3S-LIT problem. The incorporation of the inventory cost function is based on the proposal of Battini, Persona, and Sgarbossa (Citation2014) for a sustainable EOQ. Equation (1) presents inventory costs, IC, by considering the ordering, Co, holding inventory, Ch, emissions from any held inventory, Ce, emissions from obsolete inventory, Cob, and costs associated with potential accidents in warehousing activities, Cinj.
(1)
(1) The ordering cost, Co, is incorporated into our model’s economic objective as the fixed cost of processing an order of distributors and the scrap warehouses. For distributors, Cok corresponds to the total ordering cost, Qkrt is the demanded quantity, nkt is the size of the shipped order, which is considered a parameter of the model (Lu Citation1995; Sarkar et al. Citation2017), and ork is the order cost per lot (Equation 2). In Equation (3), Cos corresponds to the total ordering cost, Qsjt is the transported quantity, nst is the size of the shipped order for the scrap warehouses and ors is the order cost per lot.
(2)
(2)
(3)
(3) Here Ch, the holding cost, is calculated as the multiplication of the average inventory and the holding costs per inventory unit, h. Equation (4) describes the inventory holding cost for distributors. For scrap warehouses, the inventory holding cost is presented in Equation (5). Then Ce, the carbon emission cost, is calculated by multiplying the average inventory by emission costs ec for activities inherent to the facility. Equation (6) describes the CO2 emissions cost for distributors. For scrap warehouses, the emissions cost is presented in Equation (7). The holding costs (Ch) of distributors and scrap warehouses are incorporated into the economic objective. The emission costs (Ce) of distributors and scrap warehouses are included in the proposed model’s environmental objective.
(4)
(4)
(5)
(5)
(6)
(6)
(7)
(7)
The inventory stored in the storage facility incurs an obsolescence risk at the end of the time period, expressed by average obsolescence rate β. The obsolescence costs in distributors and scrap warehouses are described in Equation (8) and Equation (9), respectively. They are defined as the product of β, the average inventory and the emission cost by obsolescence per held unit, cob.
(8)
(8)
(9)
(9) Equation (10) and Equation (11) describe the injury cost (Cinj) for distributors and scrap warehouses. ir corresponds to the injury cost per unit of held inventory. The injury costs (Cinj) of distributors and scrap warehouses are incorporated into the social objective.
(10)
(10)
(11)
(11) In Equation (12), ir is calculated as the multiplication of the probability of accident p, the cost of holding inventory h and an injury cost factor (inj) based on the model by Bouchery et al. (Citation2012), which is established with the value 1.19:
(12)
(12) The proposed model considers the input parameters related to environmental and social aspects, which are described in detail as follows. Firstly, the ec parameter corresponds to a penalty cost of the CO2 emissions per unit of material treated in each facility. The formulation of this parameter is expressed in Equation (13). In it, the first term is related to the cost per tonne of CO2 equivalent (σ) according to the European Commission (Citation2009); the second term denotes the amount of CO2 emissions per unit of processed or held material (τ), and is calculated as follows:
(13)
(13) Here et parameters consist in a penalty cost of the CO2 emissions per unit of transported material. In Equation (14): the first term is the cost per tonne of CO2 equivalent; the second term is the CO2 emissions per unit of volume of fuel (efuel); the third term is the fuel consumption per unit of travelled distance (LKm); the fourth term corresponds to the transportation capacity (tcap); the last term is the distance (d) between nodes:
(14)
(14) Secondly regarding the social aspect, there is a positive impact associated with creating direct and indirect jobs according to the corresponding facility’s operation. In the model, this is defined as economic development (ed) and corresponds to the number of people positively affected by the creation of direct and indirect jobs. The model also considers the negative impacts associated with route hazard (hc). To measure this, we rely on the study of Ouertani, Ben-Romdhane, and Krichen (Citation2022). We propose that this risk factor is measured as the number of affected people while transporting material between certain nodes. It is calculated from the possibility q of an accident occurring en route, the density
of people per distance unit around the road between nodes, and the distance between them. This can be quantified as follows:
(15)
(15) This risk factor is measured on every network route and is included in the model’s social objective.
The MO-MINLP model, dubbed 3S-LIT, considers four objective functions. The first objective function (16) seeks to minimise the SC’s total costs. The first term of the equation corresponds to the sum of the fixed costs of processing centres. The second, third, fourth and fifth terms respectively correspond to the setup costs of distributors, collection and repair centres, recycling centres and scrap warehouses. The sixth and seventh terms respectively calculate the inventory costs of distributors and scrap warehouses. The following terms express the transportation costs from suppliers to processing centres, from processing centres to distributors, from distributors to customers, between customers and collection and repair centres, from collection and repair centres to recycling centres, from recycling centres and scrap warehouses and, finally, from scrap warehouses and processing centres.
(16)
(16) The second objective function (17) minimises the penalty costs for the GHG emissions emitted along the SC. The first and second terms of this equation respectively determine the emission costs at suppliers and processing centres. The third and fourth terms respectively express emissions costs due to the operation of collection and repair centres and recycling centres. The fifth and sixth terms respectively correspond to the emissions costs of the maintained and obsolete inventory at scrap dealers and scrap warehouses. The following terms determine the emissions costs for transportation according to the routes mentioned in the previous objective function.
(17)
(17)
The third objective function (18) corresponds to the costs associated with accidents in inventory activities at distributors and scrap warehouses.
(18)
(18) The fourth objective function (19) seeks to maximise positive social impacts and reduce negative ones. The first five terms express the impact on economic development through the creation of direct and indirect jobs in the localities where suppliers, distributors, collection and repair centres, recycling centres and scrap warehouses are installed, respectively. The remaining terms refer to hazard, which is measured in terms of the number of people potentially affected on previously defined routes.
(19)
(19) The model is subject to the following constraints:
(20)
(20)
(21)
(21)
(22)
(22)
(23)
(23)
(24)
(24)
(25)
(25)
(26)
(26)
(27)
(27)
(28)
(28)
(29)
(29)
(30)
(30)
(31)
(31)
(32)
(32)
(33)
(33)
(34)
(34)
(35)
(35)
(36)
(36)
(37)
(37)
(38)
(38)
(39)
(39)
(40)
(40)
(41)
(41)
(42)
(42)
(43)
(43)
(44)
(44)
(45)
(45)
(46)
(46)
(47)
(47)
(48)
(48)
(49)
(49)
(50)
(50)
(51)
(51)
(52)
(52)
(53)
(53)
(54)
(54)
Constraints (20) and (21) ensure the finished product inventory balance at distributors. Constraints (22) and (23) assure the scrap inventory balance in scrap warehouses. Constraint (24) guarantees that the amount of finished product processed at each processing centre equals its capacity. Constraint (25) ensures that the amount of finished product entering each distributor does not exceed its capacity. Constraint (26) guarantees that the amount of scrap entering each scrap warehouse does not exceed its capacity. Constraint (27) assures that the amount of raw material transported from the supplier to the processing centre does not exceed the supplier’s production capacity for that raw material. Constraint (28) limits the additional capacity at each distributor to no more than the selected distributor’s capacity by restricting additional storage to no more than double the distributor’s capacity. Constraint (29) strikes the balance between the quantity demanded per customer, including unmet demand, and the quantity delivered by distributors and collection and repair centres. Constraint (30) defines the balance between the input of raw material and scrap and the output of finished product at each processing centre. Constraint (31) determines the amount of waste product sent to the collection and repair centres from customers. Constraint (32) strikes a balance between the amount of repaired product repaired at collection and repair centres, and the amount of waste from customers and the communities near these centres. Constraint (33) ensures amounts of both the waste entering collection and repair centres and the unrepaired waste sent to recycling centres. Constraint (34) strikes a balance between the amount of unrepaired scrap entering recycling centres and the amount of scrap sent from these centres to scrap warehouses. Constraints (35–50) ensure the quantities flowing to or from a given entity flow to an operating entity. Constraint (51) guarantees that inventory shortages are associated with an operating distributor. Constraint (52) states that additional capacity is considered only if all the distributors are contemplated. Constraints (53) and (54) define the domains of the decision variables.
Linearisation of constraints
In order to increase computational efficiency, the MO-MINLP is converted into an MO-MILP model by the following transformations. In the fourth objective function, specifically for the terms related to route hazard, we find some non-linear terms from the multiplication of the binary variables. According to Asghari et al. (Citation2022), auxiliary binary variables are proposed to linearise these terms. Appendix 2 includes the linearisation technique.
Multi-objective solution technique
The predominant concept for solving multi-objective optimisation problems is Pareto optimality, where: ‘a point x* in the feasible design space is called Pareto optimal if there is no other point x in the set that reduces at least one objective function without increasing another one’ (Pareto Citation1906). For our problem, we apply the lexicographic method (Arora Citation2017; Gunantara Citation2018; Marler and Arora Citation2004). Here the objective functions are ordered according to their importance or significance. Then each subproblem in that order is sequentially solved by considering only one objective at a time. The optimal value obtained in the first subproblem, the biggest significance, is used as a reference for the constraint of the next subproblem, and so on. In the numerical example, we consider objective functions (16) and (17), and (18) as a single function (FO1) because they are a function of cost, and we seek to minimise these values. Objective function (55) is measured as the number of people positively and negatively impacted. Its objective is to maximise this value based on the optimal value of FO1. Having obtained the optimal FO1 value (), it is incorporated as a constraint of the optimisation problem to maximise FO2 as follows:
subject to:
Constraints (20) to (77).
In the example, are the already ordered and prioritised objective functions, and
is the set of decision variables. Then
is the optimal value obtained in the first subproblem, when
was optimised as a minimisation problem, and
is the set of optimal values of the decision variables.
This method is useful for our case because it does not require the objective functions being normalised. It allows decision makers to define preferences and it always provides a Pareto optimal solution.
Results
This section is about the implementation and experimental results of the proposed 3S-LIT model. Validation was performed using a set of numerical examples with random parameters, which fell within a range defined by the research team. The performance assessments were over instances’ size and the CPU time. We also describe the results of the case study that motivated this research work.
Computational experimentation was done on a computational server with 256 Gb RAM and two AMD EPYC 7402 24-Core Processor processors, 2.80 GHz frequency, and a Windows Server 2022 standard operating system. The mathematical model was modelled using Pyomo in the Python language and solved by commercial solver Gurobi 9.5.2.
Computational results
Inspired real copper mining industry problems and copper cathodes as the finished product were adopted as the basis of our work to test the model. The extractive nature of these company types has direct environmental impacts and leads to conflicts with local communities. The selection of suppliers could consider the choice of those with minimal CO2 generation. In inventory management terms, copper mining companies make their inventory decisions in conjunction with location and transportation decisions mostly for cost reasons. The main inventory management objectives are to maintain low stock levels, increase recycled materials and full load trucks, among others. More recently, companies have attempted to align strategic indicators with sustainable development goals (SDG); for example, indicators of occupational health and safety, responsible use of resources, reducing emissions and waste, energy efficiency, among others. In addition, suppliers and local sourcing are prioritised over global sourcing by moving towards CE development. In inventory management terms, companies have policies to produce so as to maintain the inventory, i.e. a push inventory system. Thus different sized random instances that represent the real considered problems were generated: four small (S1, S2, S3, S4), four medium (M1, M2, M3, M4) and four large (L1, L2, L3, L4). Computational performance and the results for each size group are described. A Python code to generate these random instances was developed. This code is based on the scenarios generator proposal by Mula et al. (Citation2021). The herein developed code generates a.dat file that can be loaded using Pyomo.
We firstly describe the input parameters for testing different sized problems, which were inspired by a copper mining industry. Table presents the number of elements in each set of the proposed model for every problem size. The small dataset corresponding to the minimum-sized problem implies the minimum quantity of data to obtain a coherent result to be solved. The medium-sized dataset is inspired by real-world problems in the copper mining industry. The large-sized dataset doubles the size of the data in relation to the medium-sized dataset. Table shows the size of each problem according to the number of variables and constraints.
Table 3. Number of SC elements per problem size.
Table 4. Number of variables and constraints per problem size.
As previously mentioned, parameters are randomly generated within a range defined in a uniform distribution function. For example, Table presents the random distribution of inventory costs for distributors and scrap warehouses based on real scenarios. Hence a shortage cost equalling twice the product price is considered; in our case, a price of 8250 euros per tonne of product is taken according to the contemplated current market price. In the same way, values are generated for parameters, e.g. storage capacity, production capacity, transportation costs, emissions costs, social costs, social impact indicators, among others (see Appendix 1). Values are also generated for each customer demand during every time period for all the problem sizes (see Table ).
Table 5. Random distribution of inventory costs.
Table 6. Total demand (tonne of product) per time period in each instance.
Table offers the results obtained by applying the lexicographic method to the MO-MILP model. Here the values of objective function 1 (FO1) in relation to costs, and of objective function 2 (FO2) that corresponds to the social impact, plus the computational times, are shown. Disaggregated results (see Table ) present the contribution of location, inventory and routing decisions to economic, emissions and social costs and social impacts.
Table 7. Objective function values and runtime per instance.
Table 8. Results per problem size.
As expected, costs tend to rise as the problem size increases. The average inventory level at the distributors in each instance displays a slight upward trend, but tends to stabilise (see Figure ). This is the result of constant production and variable demands that do not suffice in some scenarios to stabilise the inventory level. This results in a build-up of inventory over periods. Scrap inventory displays oscillating, but trendless behaviour (see Figure ). With the small- and medium-sized problems, the social impact is positive because more people benefit than those potentially affected. However, the impact is negative for the large-sized problems (see Table ). To describe the trade-offs between sustainability aspects, we consider a medium-sized instance to observe the relation between economic and emission costs. Here two objective functions and the non-dominated solution are described in a Pareto optimal frontier, as shown in Figure . It shows that both economic and environmental costs are more sensitive to changes in the other when they are further away from the trade-off point.
Figure 4. (a) Average inventory level at distributors per instance. (b) Average inventory level at scrap warehouses per instance.
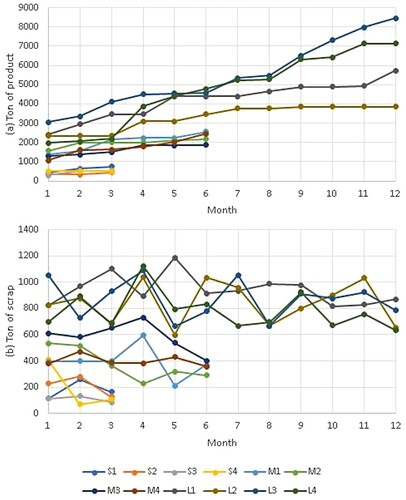
Figure 5. Pareto optimal frontier of the economic and environmental objectives.
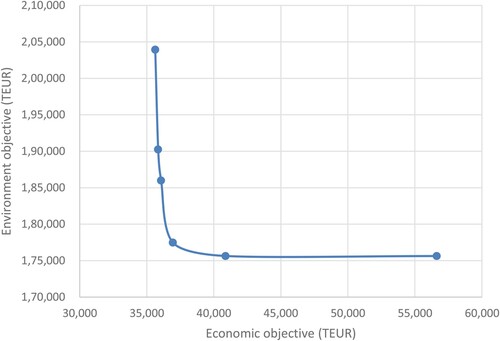
Table presents the average profits of the model per dataset size. Here the economic profits for all the dataset sizes are economically sustainable, but the incorporation of environmental and social costs only has positive profits for large datasets. This may be due to the economies of scale that happen with large datasets as regards economic incomes, which compensate environmental and social costs.
The computational times obtained for all the problem sizes used to test the model are consistent and reasonable. The results of the numerical examples confirm that the model is computationally feasible as a potential application for real commodity production systems.
Comparing model
The 3S-LIT model was validated and compared to other similar models identified in the published literature (Akbari-Kasgari et al. Citation2020, Citation2022). It is important to highlight that the main differences in both models are that 3S-LIT is a multiperiod model but, in this case, a single period of time is established; 3S-LIT contemplates inventory costs. (Akbari-Kasgari et al. Citation2022) instead consider production costs, and also contemplate disruption scenarios with backup suppliers, which are not taken into account in this comparison. After replicating the model by Akbari-Kasgari et al. (Citation2022), the summary results provide lower costs for our model and similar environmental and social impacts. Computational times are also similar. So the 3S-LIT proposal is validated using a randomly generated benchmark instance. Table summarises the main indices considered in both models and the corresponding obtained outputs and computational times.
Table 9. Summary of the validation and comparison of 3S-LIT to an alternative model.
Discussion
As far as we know, this is a novel model that considers each sustainability aspect in every LIT decision in an integrated manner. The computational results offer reasonable times to solve the model with different dataset sizes. As expected, the behaviour of the results is logical insofar as the larger the size, the higher the costs and the stronger the impacts. The results indicate that the model is feasible as a potential application for real commodity production systems; e.g. mining, glass, agri-food industries, among others.
The social impact is positive for small- and medium-sized problems. However, the impact is negative for large problems. We believe that a larger number of routes in the large-sized dataset could have a negative impact given the higher risk of accidents, which is not positively counterbalanced by the number of jobs created by having more facilities.
In addition, 3S-LIT is validated and compared to an alternative model by Akbari-Kasgari et al. (Citation2022), based also on the copper mining industry with a similar CLSC and using the same benchmark instance.
The model assumes that the social impact is positive when more people benefit than those potentially affected. The results raise ethical and equity issues that need to be discussed and considered in future research.
Managerial insights and practical implications
Managerial insights and practical implications are related to providing SC decision makers with analytical tools to allow them to incorporate not only economic, but also environmental and social aspects with an impact throughout the SC. The main novelty of this proposal lies in the aforementioned aspects being incorporated into every decision of the 3S-LIT model (i.e. in location, inventory and routing decisions). Our proposal can help managers to address sustainability challenges, such as extending materials’ life cycle, reducing energy use and GHG emissions, which positively impact the communities where organisations operate and contribute to SDG. Furthermore, as the model requires input data, decision makers should make the necessary efforts to collect all the required data before running the model. This means that fragmentation of decision making is a key problem in SCM that should be considered by practitioners. Here the proposed model can act as the basis for developing new software or information systems to coordinate different organisations with little or no synchronisation, which will enable comprehensive decision making.
Conclusions and future research
By focusing on the commodity industry, and only one finished product (e.g. copper, glass, agri-food, among others), this article presents an MO-MINLP model, coined 3S-LIT, to address LIT by a multi-objective approach by considering economic, environmental and social sustainability in the objective functions. The formulated model considers four objectives: (i) minimising the economic cost; (ii) minimising the CO2 emissions cost; (iii) minimising the social cost; (iv) maximising the social impact. The model is transformed into an MO-MILP model and the multi-objective problem is solved by the lexicographic method. This is tested with numerical examples using different dataset sizes, which were generated randomly and inspired by the copper mining industry.
The main results of our 3S-LIT proposal are oriented to:
Provide a novel MO-MINLP structure for modelling and solving CLSCs based on commodity products and contemplating the 3S aspects in each LIT decision in an integrated manner and according to a push inventory strategy.
Validate the model using datasets of three different sizes (small, medium, large) to obtain an expected behaviour of the total costs, which increase as the size of the problem grows. The inventory levels of both products and scrap tend to stabilise over time. The social impact tends to be positive for small- and medium-sized instances, but may be negative for large ones due to the increase in route hazards versus the possible positive effects of the created direct and indirect jobs.
Validate and compare the model to an alternative work by Akbari-Kasgari et al. (Citation2022) to find that computational times and environmental and social impacts are similar, although the total costs are lower with the cost function of the 3S-LIT model. So it is important to note that the 3S-LIT considers inventory decisions with constant production in relation to the comparative model, which contemplates production planning decisions without inventory considerations.
The main limitations of our proposal are described as follows. An extension of the model could consider several production plants in different locations, the manufacture of several products in each plant, several waste types treated in every collation centre, as well as MRP inventory approaches and production planning. The model can be extended by contemplating lead times in processing, collection and recycling centres. The inventory approach in the proposed model considers a push inventory system. This is a limitation that does not allow the application of a pull inventory system. Finally, non-fixed lot sizes can be considered to be decision variables.
Future research could incorporate uncertainty into the product price, and the demand and price of raw materials into the model by, for instance, robust programming (Lotfi et al. Citation2022; Lotfi, Sheikhi, et al. Citation2021). Forthcoming research should include the parameters related to environmental impacts, such as; water use, hazardous waste management, long-term waste management like tailings, renewable energy use (Lotfi, Kargar, et al. Citation2021), among others. Other potential social parameters could be incorporated, such as inequality levels, global economic development indicators and/or security, the impact of facility closure on workers, among others. In addition, the social impact should be measured by considering all those who have been negatively and positively impacted without measuring this in a compensatory way. Thus one challenge for future 3S-LIT models is to incorporate core Industry 5.0 principles from a human-centric, resilience and sustainability perspective. Hence the impact of SC resilience and possible disruptions (Akbari-Kasgari et al. Citation2022) can be contemplated. A pull inventory strategy can also be approached as a variant of the proposed model. Finally, a forthcoming work aims to apply the 3S-LIT model to a real-world copper mining SC at all the SC levels by generating a simulation optimisation model to act as basis for a digital twin of the SC processes under study.
Data availability statement
The authors confirm that the data supporting the findings of this study are available in the article and in the Appendix.
Disclosure statement
No potential conflict of interest was reported by the author(s).
Additional information
Funding
Notes on contributors

Pablo Becerra
Pablo Becerra graduated in Industrial Civil Engineering at the Universidad de Atacama (UDA) in 2015 and he also graduated in the Master’s degree in Industrial Engineering at the Universidad Andrés Bello (UNAB) in 2018. He is Instructor Professor in the Department of Industry and Business of the Universidad de Atacama. He is member of the network of Industrial Engineers of Northern Chile, experience as Congress Director of INDUNOR 2017, in projects such as Circular Economy Center Macrozone North Chile and New Engineering 2030. His research areas of interest are supply chains optimisation and simulation, production engineering, circular economy and sustainable development. He is currently finishing a PhD in Industrial Engineering and Production at the Universitat Politècnica de Valencia in the Research Centre on Production Management and Engineering (CIGIP).

Josefa Mula
Josefa Mula is Professor in the Department of Business Management of the Universitat Politècnica de València (UPV), Spain. She is a member of the Research Centre on Production Management and Engineering (CIGIP) of the UPV. Her teaching and principal research interests concern production management and engineering, operations research and supply chain simulation. She is editor in chief of the International Journal of Production Management and Engineering. She regularly acts as associate editor, guest editor and member of scientific boards of international journals and conferences, and as referee for more than 50 scientific journals. She is author of more than 120 papers mostly published in international books and high-quality journals, among which International Journal of Production Research, Fuzzy Sets and Systems, Production Planning and Control, International Journal of Production Economics, European Journal of Operational Research, Computers and Industrial Engineering, Journal of Manufacturing Systems and Journal of Cleaner Production.

Raquel Sanchis
Raquel Sanchis holds a PhD in Industrial Engineering and Production from the Universitat Politècnica de València (UPV), Spain and a Diploma of Advanced Studies in the PhD Programme of Advanced Models for Operations Management and Supply Chain Management. Currently, she is Associate Professor at the Department of Business Management. She is also member of the Research Centre on Production Management and Engineering (CIGIP) of the UPV. She has participated in numerous research projects, mainly European, as well as agreements with companies in the field of eterprise resilience, sustainability and operations research. She has been Project Manager of the European Project: Resilient Multi-Plant Networks (EU FP7 Project 229333, REMPLANET: 2009-2012), Technical Agent in the European Project: Cloud Collaborative Manufacturing Networks (EU H2020 Project 636909, C2NET: 2015-2018) and she is currently the Quality Control Manager of the European Project: Industrial Data Services for Quality Control in Smart Manufacturing (EU H2020 Project 958205, i4Q: 2021-2023). She is author of more than 35 articles in prestigious journals, 11 book chapters and editor of 3 books with ISBN.
References
- Akbari-Kasgari, M., H. Khademi-Zare, M. B. Fakhrzad, M. Hajiaghaei-Keshteli, and M. Honarvar. 2020. “A Closed-Loop Supply Chain Network Design Problem in Copper Industry.” International Journal of Engineering 33 (10): 2008–2015. doi:10.5829/IJE.2020.33.10A.19.
- Akbari-Kasgari, M., H. Khademi-Zare, M. B. Fakhrzad, M. Hajiaghaei-Keshteli, and M. Honarvar. 2022. “Designing a Resilient and Sustainable Closed-Loop Supply Chain Network in Copper Industry.” Clean Technologies and Environmental Policy. doi:10.1007/s10098-021-02266-x.
- Alarcón, F., P. Cortés-Pellicer, D. Pérez-Perales, and R. Sanchis. 2020. “Sustainability vs. Circular Economy from a Disposition Decision Perspective: A Proposal of a Methodology and an Applied Example in SMEs.” Sustainability 12 (23): 10109. doi:10.3390/su122310109.
- Alayón, C., K. Säfsten, and G. Johansson. 2017. “Conceptual Sustainable Production Principles in Practice: Do They Reflect What Companies Do?” Journal of Cleaner Production 141: 693–701. doi:10.1016/j.jclepro.2016.09.079.
- Alfares, H. K., and A. M. Ghaithan. 2019. “EOQ and EPQ Production-Inventory Models with Variable Holding Cost: State-of-the-Art Review.” Arabian Journal for Science and Engineering 44 (3): 1737–1755. doi:10.1007/s13369-018-3593-4.
- Ali, S. S., T. Paksoy, B. Torğul, and R. Kaur. 2020. “Reverse Logistics Optimization of an Industrial Air Conditioner Manufacturing Company for Designing Sustainable Supply Chain: A Fuzzy Hybrid Multi-Criteria Decision-Making Approach.” Wireless Networks 26 (8): 5759–5782. doi:10.1007/s11276-019-02246-6.
- Aloui, A., N. Hamani, and L. Delahoche. 2021. “An Integrated Optimization Approach Using a Collaborative Strategy for Sustainable Cities Freight Transportation: A Case Study.” Sustainable Cities and Society 75: 103331. doi:10.1016/j.scs.2021.103331.
- Arora, J. S. 2017. “Multi-objective Optimum Design Concepts and Methods.” In Introduction to Optimum Design, 771–794. Elsevier. doi:10.1016/b978-0-12-800806-5.00018-4.
- Asadi, E., F. Habibi, S. Nickel, and H. Sahebi. 2018. “A Bi-Objective Stochastic Location-Inventory-Routing Model for Microalgae-Based Biofuel Supply Chain.” Applied Energy 228: 2235–2261. doi:10.1016/j.apenergy.2018.07.067.
- Asghari, M., A. M. Fathollahi-Fard, S. M. J. Mirzapour Al-E-Hashem, and M. A. Dulebenets. 2022. “Transformation and Linearization Techniques in Optimization: A State-of-the-Art Survey.” Mathematics 10 (2): 283. doi:10.3390/math10020283.
- Battini, D., A. Persona, and F. Sgarbossa. 2014. “A Sustainable EOQ Model: Theoretical Formulation and Applications.” International Journal of Production Economics 149: 145–153. doi:10.1016/j.ijpe.2013.06.026.
- Becerra, P., J. Mula, and R. Sanchis. 2022. “Sustainable Inventory Management in Supply Chains: Trends and Further Research.” Sustainability 14 (5): 2613. doi:10.3390/su14052613.
- Becerra, P., J. Mula, and R. Sanchis. 2021. “Green Supply Chain Quantitative Models for Sustainable Inventory Management: A Review.” Journal of Cleaner Production 328: 129544. doi:10.1016/j.jclepro.2021.129544.
- Bostel, N., P. Dejax, and Z. Lu. 2005. “The Design, Planning, and Optimization of Reverse Logistics Networks.” In Logistics Systems: Design and Optimization, 171–212. Springer. doi:10.1007/0-387-24977-X_6.
- Bouchery, Y., A. Ghaffari, Z. Jemai, and Y. Dallery. 2012. “Including Sustainability Criteria into Inventory Models.” European Journal of Operational Research 222 (2): 229–240. doi:10.1016/j.ejor.2012.05.004.
- Bubicz, M. E., A. P. F. D. Barbosa-Póvoa, and A. Carvalho. 2019. “Incorporating Social Aspects in Sustainable Supply Chains: Trends and Future Directions.” Journal of Cleaner Production 237: 117500. doi:10.1016/j.jclepro.2019.06.331.
- Cañas, H., J. Mula, and F. Campuzano-Bolarín. 2020. “A General Outline of a Sustainable Supply Chain 4.0.” Sustainability 12 (19): 7978. doi:10.3390/su12197978.
- Carrasco-Gallego, R. 2010. A Management Model for Closed-Loop Supply Chains of Reusable Articles. Doctoral. Universidad Politécnica de Madrid.
- Chan, F. T. S., Z. X. Wang, A. Goswami, A. Singhania, and M. K. Tiwari. 2020. “Multi-Objective Particle Swarm Optimisation Based Integrated Production Inventory Routing Planning for Efficient Perishable Food Logistics Operations.” International Journal of Production Research 58 (17): 5155–5174. doi:10.1080/00207543.2019.1701209.
- Denyer, D., D. Tranfield, and J. E. van Aken. 2008. “Developing Design Propositions through Research Synthesis.” Organization Studies 29 (3): 393–413. doi:10.1177/0170840607088020.
- European Comission. 2009. EU Emissions Trading System (EU ETS). https://ec.europa.eu/clima/eu-action/eu-emissions-trading-system-eu-ets_en.
- Ganev, E. I., Y. R. Dzhelil, B. B. Ivanov, N. G. Vaklieva-Bancheva, and E. G. Kirilova. 2020. “Optimal Design of a Sustainable Integrated Biodiesel/Diesel Supply Chain Using First and Second Generations Bioresources.” Chemical Engineering Transactions 81: 67–72. doi:10.3303/CET2081012.
- Geisendorf, S., and F. Pietrulla. 2018. “The Circular Economy and Circular Economic Concepts—A Literature Analysis and Redefinition.” Thunderbird International Business Review 60 (5): 771–782. doi:10.1002/tie.21924.
- George, J., and V. Madhusudanan Pillai. 2019. “A Study of Factors Affecting Supply Chain Performance.” Journal of Physics: Conference Series 1355 (1): 012018. doi:10.1088/1742-6596/1355/1/012018.
- Goodarzian, F., P. Ghasemi, A. Gunasekaren, A. A. Taleizadeh, and A. Abraham. 2022. “A Sustainable-Resilience Healthcare Network for Handling COVID-19 Pandemic.” Annals of Operations Research 312 (2): 761–825. doi:10.1007/s10479-021-04238-2.
- Govindan, K., M. Shaw, and A. Majumdar. 2021. “Social Sustainability Tensions in Multi-Tier Supply Chain: A Systematic Literature Review towards Conceptual Framework Development.” Journal of Cleaner Production 279: 123075. doi:10.1016/j.jclepro.2020.123075.
- Gunantara, N. 2018. “A Review of Multi-Objective Optimization: Methods and Its Applications.” Cogent Engineering 5 (1): 1502242. doi:10.1080/23311916.2018.1502242.
- Guo, H., C. Li, Y. Zhang, C. Zhang, and M. Lu. 2018. “A Location-Inventory Problem in a Closed-Loop Supply Chain with Secondary Market Consideration.” Sustainability 10 (6): 1891. doi:10.3390/su10061891.
- Huang, Y. A., C. L. Weber, and H. S. Matthews. 2009. “Categorization of Scope 3 Emissions for Streamlined Enterprise Carbon Footprinting.” Environmental Science & Technology 43 (22): 8509–8515. doi:10.1021/es901643a.
- Ivanov, B. B., and Yunzile R. Dzhelil. 2021. “Multi-Period Deterministic Model of Sustainable Integrated of Hybrid First and Second Generation Bioethanol Supply Chains for Synthesis and Renovation.” In Modeling and Simulation in Chemical Engineering. Heat and Mass Transfer, edited by Christo Boyadjiev. Cham: Springer.
- Jabarzadeh, Y., H. Reyhani Yamchi, V. Kumar, and N. Ghaffarinasab. 2020. “A Multi-Objective Mixed-Integer Linear Model for Sustainable Fruit Closed-Loop Supply Chain Network.” Management of Environmental Quality: An International Journal 31 (5): 1351–1373. doi:10.1108/MEQ-12-2019-0276.
- Jemai, J., and B. Sarkar. 2019. “Optimum Design of a Transportation Scheme for Healthcare Supply Chain Management: The Effect of Energy Consumption.” Energies 12 (14): 2789. doi:10.3390/en12142789.
- Khan, M., M. Y. Jaber, A. L. Guiffrida, and S. Zolfaghari. 2011. “A Review of the Extensions of a Modified EOQ Model for Imperfect Quality Items.” International Journal of Production Economics 132 (1): 1–12. doi:10.1016/j.ijpe.2011.03.009.
- Krug, Z., R. Guillaume, and O. Battaïa. 2021. “Design of Reverse Supply Chains under Uncertainty: The Lexicographic R * Criterion for Exploring Opportunities.” International Journal of Production Research 59 (11): 3221–3236. doi:10.1080/00207543.2020.1866782.
- Li, Y., H. Guo, and Y. Zhang. 2018. “An Integrated Location-Inventory Problem in a Closed-Loop Supply Chain with Third-Party Logistics.” International Journal of Production Research 56 (10): 3462–3481. doi:10.1080/00207543.2017.1338781.
- Li, L., Y. Yang, and G. Qin. 2019. “Optimization of Integrated Inventory Routing Problem for Cold Chain Logistics Considering Carbon Footprint and Carbon Regulations.” Sustainability 11 (17): 4628. doi:10.3390/su11174628.
- London Metal Exchange. 2022. London Metal Exchange. September 30. Contract Specifications. https://www.lme.com/en/metals/non-ferrous/lme-copper/contract-specifications.
- Lotfi, R., B. Kargar, S. H. Hoseini, S. Nazari, S. Safavi, and G. Weber. 2021. “Resilience and Sustainable Supply Chain Network Design by Considering Renewable Energy.” International Journal of Energy Research 45 (12): 17749–17766. doi:10.1002/er.6943.
- Lotfi, R., H. Nazarpour, A. Gharehbaghi, S. M. H. Sarkhosh, and A. Khanbaba. 2022. “Viable Closed-Loop Supply Chain Network by Considering Robustness and Risk as a Circular Economy.” Environmental Science and Pollution Research 29 (46): 70285–70304. doi:10.1007/s11356-022-20713-0.
- Lotfi, R., Z. Sheikhi, M. Amra, M. AliBakhshi, and G.-W. Weber. 2021. “Robust Optimization of Risk-Aware, Resilient and Sustainable Closed-Loop Supply Chain Network Design with Lagrange Relaxation and Fix-and-Optimize.” International Journal of Logistics Research and Applications, 1–41. doi:10.1080/13675567.2021.2017418.
- Lu, L. 1995. “A One-Vendor Multi-Buyer Integrated Inventory Model.” European Journal of Operational Research 81: 312–323. doi:10.1016/0377-2217(93)E0253-T.
- Lv, A., and B. Sun. 2022. “Multi-Objective Robust Optimization for the Sustainable Location-Inventory-Routing Problem of Auto Parts Supply Logistics.” Mathematics 10 (16): 2942. doi:10.3390/math10162942.
- MahmoumGonbadi, A., A. Genovese, and A. Sgalambro. 2021. “Closed-Loop Supply Chain Design for the Transition towards a Circular Economy: A Systematic Literature Review of Methods, Applications and Current Gaps.” Journal of Cleaner Production 323: 129101. doi:10.1016/j.jclepro.2021.129101.
- Marler, R. T., and J. S. Arora. 2004. “Survey of Multi-Objective Optimization Methods for Engineering.” Structural and Multidisciplinary Optimization 26 (6): 369–395. doi:10.1007/s00158-003-0368-6.
- Mishra, J. L., P. G. Hopkinson, and G. Tidridge. 2018. “Value Creation from Circular Economy-Led Closed Loop Supply Chains: A Case Study of Fast-Moving Consumer Goods.” Production Planning & Control 29 (6): 509–521. doi:10.1080/09537287.2018.1449245.
- Mogale, D. G., N. Cheikhrouhou, and M. K. Tiwari. 2020. “Modelling of Sustainable Food Grain Supply Chain Distribution System: A Bi-Objective Approach.” International Journal of Production Research 58 (18): 5521–5544. doi:10.1080/00207543.2019.1669840.
- Mogale, D. G., A. De, A. Ghadge, and E. Aktas. 2022. “Multi-Objective Modelling of Sustainable Closed-Loop Supply Chain Network with Price-Sensitive Demand and Consumer’s Incentives.” Computers & Industrial Engineering 168: 108105. doi:10.1016/j.cie.2022.108105.
- Mogale, D. G., A. Ghadge, N. Cheikhrouhou, and M. K. Tiwari. 2022. “Designing a Food Supply Chain for Enhanced Social Sustainability in Developing Countries.” International Journal of Production Research, 1–21. doi:10.1080/00207543.2022.2078746.
- Mogale, D. G., S. K. Kumar, and M. K. Tiwari. 2020. “Green Food Supply Chain Design Considering Risk and Post-Harvest Losses: A Case Study.” Annals of Operations Research 295 (1): 257–284. doi:10.1007/s10479-020-03664-y.
- Moors, C., and K. Keen. 2022. Looming Copper Shortage Shifts Attention to Alternative Supply Solutions. September 7. S&P Global Market Intelligence. https://www.spglobal.com/marketintelligence/en/news-insights/latest-news-headlines/looming-copper-shortage-shifts-attention-to-alternative-supply-solutions-71920158.
- Moslehi, M. S., H. Sahebi, and A. Teymouri. 2021. “A Multi-Objective Stochastic Model for a Reverse Logistics Supply Chain Design with Environmental Considerations.” Journal of Ambient Intelligence and Humanized Computing 12: 8017–8040. doi:10.1007/s12652-020-02538-2.
- Moslemi, S., M. H. Zavvar Sabegh, A. Mirzazadeh, Y. Ozturkoglu, and E. Maass. 2017. “A Multi-Objective Model for Multi-Production and Multi-Echelon Closed-Loop Pharmaceutical Supply Chain Considering Quality Concepts: NSGAII Approach.” International Journal of System Assurance Engineering and Management 8: 1717–1733. doi:10.1007/s13198-017-0650-4.
- Mula, J., M. Díaz-Madroñero, B. Andres, R. Poler, and R. Sanchis. 2021. “A Capacitated Lot-Sizing Model with Sequence-Dependent Setups, Parallel Machines and Bi-Part Injection Moulding.” Applied Mathematical Modelling 100: 805–820. doi:10.1016/j.apm.2021.07.028.
- Ngadono, T. S., and Z. F. Ikatrinasari. 2020. “Raw Materials Inventory Planning in Automotive Industries by EOQ Method Consider with the Contract Agreement.” IOP Conference Series: Materials Science and Engineering 847 (1): 012049. doi:10.1088/1757-899X/847/1/012049.
- Ouertani, N., H. Ben-Romdhane, and S. Krichen. 2022. “A Decision Support System for the Dynamic Hazardous Materials Vehicle Routing Problem.” Operational Research 22 (1): 551–576. doi:10.1007/s12351-020-00562-w.
- Pareto, V. 1906. Manuale di economica politica, edited by A. M. Kelley and A. N. Page. New York: Kelley; Translation, 1971.
- Popovic, T., A. Kraslawski, A. Barbosa-Póvoa, and A. Carvalho. 2017. “Quantitative Indicators for Social Sustainability Assessment of Society and Product Responsibility Aspects in Supply Chains.” Journal of International Studies 10 (4): 9–36. doi:10.14254/2071-8330.2017/10-4/1.
- Prieto-Sandoval, V., C. Jaca, and M. Ormazabal. 2018. “Towards a Consensus on the Circular Economy.” Journal of Cleaner Production 179: 605–615. doi:10.1016/j.jclepro.2017.12.224.
- Puchades, L., and J. Mula. 2004. “Aplicación de Métodos Cuantitativos para la Gestión de Stocks en la Empresa Semacaf, S.L.” VIII Congreso de Ingeniería de Organización.
- Rentizelas, A., N. Trivyza, S. Oswald, and S. Siegl. 2022. “Reverse Supply Network Design for Circular Economy Pathways of Wind Turbine Blades in Europe.” International Journal of Production Research 60 (6): 1795–1814. doi:10.1080/00207543.2020.1870016.
- Saif, A., and S. Elhedhli. 2016. “Cold Supply Chain Design with Environmental Considerations: A Simulation-Optimization Approach.” European Journal of Operational Research 251 (1): 274–287. doi:10.1016/j.ejor.2015.10.056.
- Sarkar, B., B. K. Shaw, T. Kim, M. Sarkar, and D. Shin. 2017. “An integrated Inventory Model with Variable Transportation Cost, Two-Stage Inspection, and Defective Items.” Journal of Industrial and Management Optimization 13 (4): 1975–1990. doi:10.3934/jimo.2017027.
- Seuring, S., and M. Müller. 2008. “From a Literature Review to a Conceptual Framework for Sustainable Supply Chain Management.” Journal of Cleaner Production 16 (15): 1699–1710. doi:10.1016/j.jclepro.2008.04.020.
- Tang, J., S. Ji, and L. Jiang. 2016. “The Design of a Sustainable Location-Routing-Inventory Model Considering Consumer Environmental Behavior.” Sustainability 8 (3): 211. doi:10.3390/su8030211.
- Tavana, M., H. Tohidi, M. Alimohammadi, and R. Lesansalmasi. 2021. “A Location-Inventory-Routing Model for Green Supply Chains with Low-Carbon Emissions under Uncertainty.” Environmental Science and Pollution Research 28: 50636–50648. doi:10.1007/s11356-021-13815-8.
- Teplická, K., and K. Čulková. 2020. “Using of Optimizing Methods in Inventory Management of the Company.” Acta Logistica 7 (1): 9–16. doi:10.22306/al.v7i1.150.
- Tiwari, S., Y. Daryanto, and H. M. Wee. 2018. “Sustainable Inventory Management with Deteriorating and Imperfect Quality Items Considering Carbon Emission.” Journal of Cleaner Production 192: 281–292. doi:10.1016/j.jclepro.2018.04.261.
- Zhalechian, M., R. Tavakkoli-Moghaddam, B. Zahiri, and M. Mohammadi. 2016. “Sustainable Design of a Closed-Loop Location-Routing-Inventory Supply Chain Network Under Mixed Uncertainty.” Transportation Research Part E: Logistics and Transportation Review 89: 182–214. doi:10.1016/j.tre.2016.02.011.
Appendices
Appendix 2.
Linearisation of constraints
(55)
(55) Now the model is linearised by including the restrictions that relate the variables of the model and the auxiliary variables as follows:
(56)
(56)
(57)
(57)
(58)
(58)
(59)
(59)
(60)
(60)
(61)
(61)
(62)
(62)
(63)
(63)
(64)
(64)
(65)
(65)
(66)
(66)
(67)
(67)
(68)
(68)
(69)
(69)
(70)
(70)
(71)
(71)
(72)
(72)
(73)
(73)
(74)
(74)
(75)
(75)
(76)
(76)
(77)
(77)