
 ?Mathematical formulae have been encoded as MathML and are displayed in this HTML version using MathJax in order to improve their display. Uncheck the box to turn MathJax off. This feature requires Javascript. Click on a formula to zoom.
Abstract
Configuring supply chains (SCs) is critical to spare parts retailers’ success, entailing two key aspects: stock deployment into distribution centres (DCs) (i.e. inventory centralisation or decentralisation) and stock supply in each DC (how many spare parts to supply and how often). Given the unpredictability of spare parts demand, stock deployment and supply policies should be regularly reviewed, adapting to fluctuations in customer needs. A viable way to do this is to adopt a multi-criteria ABC criticality classification. However, the multi-criteria ABC criticality classification has often been used to plan stock supply policies in a single DC, but only once to plan spare parts deployment. Nevertheless, the available literature methodology presents major limitations, being not applicable in real companies. Therefore, this paper provides a novel methodology, called SP-LACE, which first reviews the configuration of spare parts SCs based on a multi-criteria criticality classification. Then, allows, for the first time, to evaluate the economic benefits of the reviewed SC configuration. SP-LACE was tested on two case studies and compared with the literature methodology. The results indicate that it provides economic benefits (in terms of total SC cost), overcoming the limitations of the literature methodology and ensuring high service levels.
1. Introduction
Spare parts retailers have identified as ever-growing crucial aspects for their success the adoption of a customer-centric perspective and the proper management of customer needs in supply chains (SCs) (Esmaeili, Teimoury, and Pourmohammadi Citation2021; Giannikas, McFarlane, and Strachan Citation2019). As Stoll et al. (Citation2015) stated, a good way to increase spare parts retailers’ serviceability is to optimally configure SCs, ensuring alignment between stocks in distribution centres (DCs) and spare parts demand. However, configuring spare parts SCs is not an easy task because a typical challenge is to minimise inventory costs while facing demand volatility and guaranteeing high service levels (Jiang, Shi, and Shen Citation2019). Given this challenging context, spare parts retailers should embrace structured methodologies for configuring SCs (Cantini et al. Citation2022; Ahmed, Heese, and Kay Citation2023).
Based on Manikas, Sundarakani, and Iakimenko (Citation2019) and Gregersen and Hansen (Citation2018), a sound SC configuration methodology should focus on defining two aspects of primary importance: the optimal stock deployment and the optimal stock supply policy to be adopted for individual stock keeping units (SKUs). Concerning optimal stock deployment (first decision of SC configuration), the SC configuration methodology should determine in which DCs to locate each SKU, thereby establishing how to serve customers with DCs. Two antithetical stock deployment policies can be distinguished from which the SC configuration methodology has to choose, namely centralisation and decentralisation. A decentralised stock deployment implies storing SKUs in multiple DCs, each meeting the demand of local customers. As a result, SC flexibility, SC responsiveness, and low outbound transportation costs are ensured (Milewski Citation2020), but also eliciting high holding costs since many DCs are managed, each needing to guarantee high service levels. Conversely, a centralised stock deployment involves storing SKUs in a single DC that serves all customers. As a result, holding and ordering costs are reduced (due to the ‘risk-pooling’ effect), but to the detriment of SC flexibility, SC responsiveness, and transportation costs (Schmitt et al. Citation2015; Li et al. Citation2019). Instead, concerning stock supply policies (second decision of SC configuration), the SC configuration methodology should indicate in each DC which SKUs to keep in stock and which to order on-demand, as well as how many stocks to supply and how often (Yazdekhasti, Sharifzadeh, and Ma Citation2022).
Due to the volatility of spare parts demand, spare parts SCs should not be configured only once (when the business is founded), but rather periodically (Del Prete and Primo Citation2021; Van der Auweraer and Boute Citation2019). Indeed, regularly reviewing the SC configuration over time allows for adapting stock deployment and supply policies to changes in spare parts demand. Accordingly, DCs’ inventory levels are optimised by minimising holding and ordering costs, while ensuring high service levels, fewer stock-outs, and reduced backorder costs (Eldem, Kluczek, and Bagiński Citation2022; Alfieri, Pastore, and Zotteri Citation2017). The practical relevance of reviewing the SC configuration was confirmed by two real companies, whose consultation prompted this research study. Company A is a retailer of bus spare parts from southern Europe, while Company B is a retailer of spare parts for trams, subways, and their infrastructure (e.g. railways) from northern Europe. Both companies, operating in the transportation sector, emphasised that, by keeping the SC configuration unchanged over time, spare parts retailers experience many side effects on both total SC costs and customer service level. Any change in customer demand (due to changes in market conditions, new trends, or developments in technologies and assets on which spare parts are installed) may result in two undesirable impacts. First, if customer demand grows but stock deployment and supply policies are not reviewed, the wrong allocation of spare parts in DCs and the wrong inventory levels lead to spare parts unavailability. Therefore, the provided service level drops, causing increased backorder costs, loss of customers, and reduced SC profitability. Second, if customer demand decreases, inventory levels may turn excessive, resulting in unnecessary ordering and holding costs, which translate into opportunity costs related to capital invested in DCs that is not remunerated.
Despite the need to review SC configurations, the extant literature proposes SC configuration methodologies that are conceived and applied to configure spare parts SCs when they are founded. Conversely, as Cantini et al. (Citation2021) and Cohen, Agrawal, and Agrawal (Citation2006) confirmed, the problem of reviewing the configuration of existing SCs over time (based on spare parts demand fluctuations) has rarely been addressed, preventing spare parts retailers from understanding the benefits of conducting this review. For this reason, as Hu et al. (Citation2018) reported, many spare parts retailers are far from implementing methodologies to review their starting SC configuration, and quite often, instead, the SC configuration is chosen only once and never questioned. Therefore, stock deployment and supply policies continue to be static, arbitrary, and based on experience, while a quick and easy-to-use methodology for reviewing the SC configuration is greatly needed to increase spare parts retailers’ serviceability and performance, thus ensuring customer satisfaction over time (Basto et al. Citation2019).
According to several authors (Sheikhar and Matai Citation2022; Teunter, Babai, and Syntetos Citation2010), a valuable way to address this gap is to define heuristic methodologies for reviewing SC configurations based on spare parts criticality classification techniques. Indeed, spare parts criticality classification techniques are particularly suitable for this purpose for two reasons. First, Basto et al. (Citation2019) and Zhang, Hopp, and Supatgiat (Citation2001) reported that criticality classification techniques require little investment in computational resources and advanced technologies, which are still lacking in many enterprises. Second, Manikas, Sundarakani, and Iakimenko (Citation2019) and Amirkolaii et al. (Citation2017) stated that spare parts SCs are typically characterised by a wide variety of SKUs, but the computational costs and complexity associated with optimising the SC configuration for each individual SKU through exact optimisation techniques are practically not feasible. Hence, spare parts criticality classification techniques are preferable since they suggest similar stock deployment and supply policies for all SKUs belonging to the same criticality class, without performing individual SKU analyses (Braglia, Grassi, and Montanari Citation2004). In this context, due to its simplicity and popularity, Amirkolaii et al. (Citation2017) and Persson and Saccani (Citation2007) recommended multi-criteria ABC criticality classification as a successful solution for reviewing spare parts SC configurations. In a multi-criteria ABC criticality classification, spare parts criticality is differentiated based on several possible criteria (e.g. demand, unitary cost, etc.) and relying on Pareto’s principle (Teunter, Babai, and Syntetos Citation2010; Van Wingerden, Tan, and Van Houtum Citation2016). Then, spare parts are classified into three criticality classes, where A includes critical SKUs, B comprises the moderately critical ones, and C includes the non-critical ones. As described by May, Atkinson, and Ferrer (Citation2017), ABC classification assumes different names depending on the criticality criterion considered to rank SKUs. For example, by choosing average unitary cost as the classification basis, ABC takes the name of ‘HML analysis’ (Jadhav and Jaybhaye Citation2020), in which SKUs are divided into High, Medium, or Low-cost spare parts. Alternatively, when the ABC classifies spare parts based on demand-related criteria (e.g. average demand, coefficient of variation of demand, or number of withdrawals in DCs), we meet the ‘XYZ classification’ (Stoll et al. Citation2015), where X are critical SKUs, Y the moderately critical ones, and Z the non-critical ones. Finally, when the ABC is carried out using criteria related to impacts from spare part unavailability on a system’s functioning, it is called ‘VED classification’ (Gupta et al. Citation2007) and classifies SKUs as V – vital, E – essential, and D – desirable.
Although many studies have investigated multi-criteria ABC criticality classifications of spare parts, few provide clear indications on how to use classification results to review the configuration of spare parts SCs. In particular, Mehdizadeh (Citation2020) and Roda et al. (Citation2014) showed that across studies proposing multi-criteria ABC criticality classifications of spare parts, most of them explain how to use classification results to optimise stock supply policies within a single DC, planning reorder levels and quantities of different SKUs according to their respective criticality classes. Contrarily, multi-criteria ABC criticality classifications of spare parts have barely been used to plan stock deployment policies in multiple DCs, thereby determining whether to centralise or decentralise individual SKUs according to their criticality. To the best of the authors’ knowledge, the study by Stoll et al. (Citation2015) is the only one that has proposed a methodology based on a multi-criteria ABC criticality classification for planning both stock deployment and supply policies in the DCs of a spare parts retail company. However, as Stoll et al. (Citation2015) stated, their methodology is characterised by some limitations that hinder not only its applicability in real cases, but also its suitability for regularly reviewing SC configurations (which is necessary in spare parts SCs). Therefore, a quick and easy-to-use methodology to review both stock deployment and supply policies (i.e. SC configuration) based on a multi-criteria ABC criticality classification is currently missing, undermining spare parts retailers’ ability to keep their performance optimised against changes in customer needs. Moreover, Stoll et al. (Citation2015) lack an economic analysis of the benefits achieved (in terms of holding, ordering, and backorder costs) by reviewing spare parts SC configurations. Consequently, this methodology’s effectiveness has not been demonstrated, nor has the importance of reviewing spare parts SC configurations.
To summarise the identified literature gaps: (i) the literature has neglected quick and easy-to-use methodologies to regularly review spare parts SC configurations. This shortcoming prevents spare parts retailers from keeping stock deployment and supply policies aligned with customer needs, undermining the optimisation of their economic and service performance. (ii) Methodologies based on multi-criteria ABC criticality classifications of spare parts show potential for addressing this shortcoming. However, although the literature proposes many multi-criteria ABC criticality classifications of spare parts, only one study has indicated how to use classification results to simultaneously review stock deployment and supply policies in spare parts SCs. (iii) This literature methodology suffers from limitations being not applicable in real contexts. Furthermore, its effectiveness has not been proven due to the lack of methodologies to evaluate the economic benefits of reviewing an SC configuration (instead of keeping it unchanged over time). As a result, spare parts retailers who experience significant changes in customer demand claim a quick and easy-to-use methodology based on a multi-criteria ABC criticality classification of spare parts, that can be regularly applied over time to accomplish two tasks. First, to keep stock deployment and supply policies aligned with customer needs. Second, to demonstrate the economic benefits of reviewing the SC configuration.
To fill these gaps, the present study aims to propose a novel methodology (henceforth referred to as ‘SP-LACE – Spare Parts suppLy chAin Configuration rEview’), which will answer the following research questions (RQs):
RQ1: How can a multi-criteria ABC criticality classification of spare parts be used to review the configuration of spare parts SCs, aligning both stock deployment and supply policies with changes in customer needs?
RQ2: How can the economic benefits of reviewing an SC configuration be evaluated?
SP-LACE represents the main contribution of this study, being the first data-driven methodology based on a multi-criteria ABC criticality classification of spare parts, which is suitable for regularly reviewing the configuration of spare parts SCs in a quick and easy-to-use way. SP-LACE comprises two stages. In stage 1, optimal stock deployment and supply policies are suggested for each SKU, answering RQ1 and supporting spare parts retailers in achieving high service levels and a trade-off between holding, ordering, and backorder costs in DCs. Then, in stage 2, for the first time in the literature, the economic benefits of the reviewed spare parts SC configuration are evaluated, answering RQ2 by comparing the achieved total SC cost (which includes holding, ordering, backorder costs, as well as the costs incurred to perform the review process) with the same cost in the starting SC configuration (before the review process).
The remainder of this paper proceeds as follows. Section 2 provides the study’s background, investigating the extant literature on the use of multi-criteria ABC criticality classifications to review spare parts SC configurations. In Section 3, SP-LACE is presented. In Section 4, SP-LACE is tested on two case studies (companies A and B), showing how the reviewed SC configuration improves spare parts retailers’ performance compared with the starting SC configuration. Furthermore, SP-LACE is also compared with the existing literature methodology by Stoll et al. (Citation2015) to show how it overcomes the latter’s limitations. Finally, Section 5 offers some conclusions.
2. Research background
According to Ding and Kaminsky (Citation2020) and Mangiaracina, Song, and Perego (Citation2015), the methodologies for reviewing the configuration of spare parts SCs fall under three categories: exact optimisation, heuristic optimisation, and simulation methodologies. As discussed earlier, when looking for a quick and easy-to-use methodology for reviewing spare parts SC configurations, the literature suggests adopting heuristic methodologies, particularly those based on spare parts criticality classification techniques (Gregersen and Hansen Citation2018; Cohen et al. Citation1990). More in detail, among existing spare parts criticality classification techniques, Amirkolaii et al. (Citation2017) and Persson and Saccani (Citation2007) suggested adopting a multi-criteria ABC criticality classification, which, due to its user-friendliness, remains the most employed technique in real companies (Gong et al. Citation2022). Building on this research domain, the present section examines the literature on multi-criteria ABC criticality classifications of spare parts, focusing on how previous studies suggested using the classification results in industrial applications, and discussing those that provided indications for reviewing an SC configuration.
According to Van Wingerden, Tan, and Van Houtum (Citation2016) and Persson and Saccani (Citation2007), a methodology to review the configuration of spare parts SCs based on a multi-criteria ABC criticality classification should consist of two steps. The first is to create spare parts classification classes (A – critical SKUs, B – moderately critical, and C – noncritical) by differentiating SKUs’ criticality based on predefined criticality criteria and relying on Pareto’s principle. Concerning this, Kauremaa and Holmström (Citation2017) reported that, due to the heterogeneous nature of spare parts, a multi-criteria ABC criticality classification should be preferred to a mono-criterion one, and the spare parts demand should be included among the considered criticality criteria (correlating it to the importance of stocking specific SKUs in DCs). The second step is to use class membership for guiding rule-based SC configuration decisions, thus defining appropriate stock deployment and supply policies for each class, such as complex control methods for the most critical SKUs and simpler procedures for the remaining ones (Chen Citation2011; Chen et al. Citation2008). By repeating this procedure during the business lifetime, the SC configuration can be reviewed, aligning it with customer needs, rationalising the use of economic resources, and avoiding investments in noncritical spare parts (Cohen, Zheng, and Wang Citation1999).
Despite the potential effectiveness of a quick and easy-to-use methodology for reviewing spare parts SC configurations based on a multi-criteria ABC criticality classification, the literature in this field is not exhaustive. Few studies have provided structured methodologies to exploit the results of an ABC classification to review spare parts SC configurations (thereby planning both stock deployment and supply policies in multiple DCs). Specifically, albeit multiple studies have investigated multi-criteria ABC criticality classifications of spare parts, most of them belong to two research streams (Millstein, Yang, and Li Citation2014). The first research stream comprises studies proposing brand-new ABC classifications or improvements to existing classifications (Lolli, Ishizaka, and Gamberini Citation2014). These studies usually consider a single DC, in which they explain how to rank spare parts’ criticality, discussing how different criticality criteria and splitting rules impact the achieved classification. Examples of studies belonging to this research stream include those by Gajpal, Ganesh, and Rajendran (Citation1994), Wang (Citation2019), and Sheikh-Zadeh, Rossetti, and Scott (Citation2021). However, these studies are not relevant to the present research since they only debate how to classify SKUs, without providing indications on how to exploit the classification results for industrial applications (Babai, Ladhari, and Lajili Citation2015). Therefore, they do not support spare parts retailers in reviewing their SC configurations.
The second research stream includes studies showing how to use the results of an ABC criticality classification to manage spare parts inventories within a single DC, focusing on optimising stock supply policies and, thus, determining when to reorder each SKU and in what quantity (Muthalib et al. Citation2022). Mehdizadeh (Citation2020) and Roda et al. (Citation2014) confirmed this research stream, showing that the multi-criteria ABC criticality classification has been mainly used for planning stock supply policies in a single DC (first decision of SC configuration), without suggesting any stock deployment policy (second decision of SC configuration). Relevant examples of studies belonging to this second research stream are mentioned below. Flores and Whybark (Citation1986) introduced the first multi-criteria ABC criticality classification, which entails performing three steps to plan stock supply policies in a single DC. The first step involves developing two mono-criterion ABC criticality classifications (using the SKUs’ unitary cost and procurement lead time as criticality criteria). The second step involves combining the results of the two classifications to generate a ‘joint-criteria matrix’, classifying SKUs into nine criticality classes. Finally, the third step involves associating optimal stock supply policies with the SKUs belonging to each class, where noncritical SKUs are ordered on-demand, while critical and moderately critical SKUs are kept in stock. After Flores and Whybark, many other authors proposed approaches to plan the stock supply policies in a single DC based on a multi-criteria ABC criticality classification, e.g. Petrović and Petrović (Citation1992), Celebi, Bayraktar, and Ozturkcan (Citation2008), Lukinskiy, Lukinskiy, and Sokolov (Citation2020), and Sheikhar and Matai (Citation2022). In this context, not only approaches to plan stock supply policies based on the sole use of ABC analyses were suggested, but also approaches based on the combined use of multi-criteria ABC criticality classifications with other criticality classification techniques, such as the Analytic Hierarchy Process (AHP) (Stoll et al. Citation2015), Artificial Neural Networks (ANNs) (Partovi and Anandarajan Citation2002), genetic algorithms (Durán et al. Citation2019; Yu Citation2011), failure mode effect and criticality analysis (FMECA) (Gong et al. Citation2022), fuzzy classifications (Luluah, Baidowi, and Jauhari Citation2020; Chu, Liang, and Liao Citation2008), and Data Envelopment Analysis (DEA) (Ramanathan Citation2006). Recently, the joint-use of ABC criticality classifications and machine learning algorithms has been frequently proposed to plan stock supply policies in a DC (Lolli et al. Citation2019; Svoboda and Minner Citation2022). Moreover, strong attention has been paid to analysing the impact of ABC criticality classifications and the consequent stock deployment policies on the costs of a DC (Odedairo Citation2021). Finally, along with planning stock supply policies, multi-criteria ABC criticality classifications have also been proposed to locate SKUs on the shelves of a DC, thus optimising logistic flows and turnover rates (Islam, Pulungan, and Rochim Citation2019; Hanafi et al. Citation2019).
While stock supply policies have frequently been planned based on multi-criteria ABC criticality classifications, few studies have discussed how to use classification results to plan stock deployment policies in multiple DCs. Cantini et al. (Citation2021) and Huiskonen (Citation2001) confirmed this lack, asserting that existing methodologies based on multi-criteria ABC criticality classifications focus on optimising stock supply policies in a single DC while overlooking stock deployment policies. To reiterate this gap, Manikas, Sundarakani, and Iakimenko (Citation2019) and Mangiaracina, Song, and Perego (Citation2015) stated that, although spare parts deployment policies are key drivers of a company’s profitability, the problem of choosing between centralisation and decentralisation of SKUs in multiple DCs is not yet sufficiently explored and practical solutions to address it are scant.
To the best of the authors’ knowledge, only one heuristic methodology based on a multi-criteria ABC criticality classification has been proposed for planning both stock deployment and supply policies in multiple DCs (Stoll et al. Citation2015), thus addressing the entire SC configuration review. Such a methodology relies on developing a three-criteria criticality classification of spare parts. Two criticality criteria (unitary cost and coefficient of variation of demand) are used to estimate SKUs’ value and their expected demand (by performing an HML and an XYZ analysis, respectively). The third criticality criterion is used to classify SKUs based on the impact of spare parts’ unavailability on the system’s maintenance and production performance (using a VED analysis, a decision tree, and an AHP). However, Stoll et al. (Citation2015) pointed out that their methodology is characterised by two major limitations, that hamper its applicability in real companies and its suitability for regularly reviewing spare parts SC configurations. First, a large amount of data must be collected, some of which are hardly available in company databases. Second, maintenance experts must be consulted, making the methodology application time-consuming and its SC configuration results not entirely data-driven, but rather affected by subjectivity. In addition, Stoll et al. (Citation2015) lack an economic analysis with which to evaluate the benefits achievable by reviewing the SC configuration. In fact, no comparison is provided between holding, ordering, and backorder costs in the reviewed SC configuration and the same costs in the starting SC configuration (before the review process). Besides, the costs incurred to review the SC configuration are completely neglected. Consequently, the effectiveness of the methodology by Stoll et al. (Citation2015) is not demonstrated, nor is the importance of reviewing the spare parts SC configuration.
Overall, spare parts retailers lack a quick and easy-to-use methodology based on a multi-criteria ABC criticality classification for reviewing spare parts SC configurations. To fill this gap, SP-LACE was developed, which is described in the next section.
3. SP-LACE methodology
SP-LACE aims to optimise stock deployment and supply policies associated with individual SKUs within existing two-echelon SCs, where spare parts retailers already own DCs (Cantini et al. Citation2022). Two-echelon SCs are considered since the multi-echelon ones have been reported to be uncommon in the field of spare parts retail (Cantini et al. Citation2021; Botter and Fortuin Citation2000). However, SP-LACE can also be applied in multi-echelon SCs by splitting them into a series of two-echelon SCs.
SP-LACE is composed of two stages. In stage 1, the SKUs’ criticality classification is performed according to two criticality criteria: the SKUs’ value and their historical number of withdrawals in DCs, which are assessed through an HML and an XYZ analysis, respectively. Based on the achieved classification, each criticality class is associated with optimal stock deployment and supply policies, obtaining (as the outcome of stage 1) detailed information on which and how many SKUs to reorder in each DC and how often to supply them. In this way, the SC configuration is reviewed (answering RQ1), and spare parts retailers are allowed to keep stock deployment and supply policies of multiple SKUs in multiple DCs aligned with spare parts demand. The reviewed SC configuration improves both the economic and service performance of spare parts retailers. High service performance is ensured by imposing pre-established service levels for SKUs in DCs, then defining stock supply policies to limit the number of backorders. Moreover, high service performance is enabled by associating appropriate SKUs with a decentralised stock deployment policy, which ensures SC flexibility and responsiveness (as already introduced in Section 1). Meanwhile, economic performance is improved by reducing the total SC cost. Specifically, a trade-off between holding, ordering, and backorder costs is found by associating appropriate SKUs with a centralised stock deployment policy (benefiting from risk-pooling, as mentioned in Section 1), and adopting optimal stock supply policies to control inventory levels in DCs, the number of supply orders, and the number of backorders.
In stage 2, once the SC configuration is reviewed, its total cost (including holding, ordering, and backorder costs, as well as the cost incurred to carry out the review process) is compared with the one of the starting SC (before the review process). The comparison provides (as the outcome of stage 2) an evaluation of both the achieved economic benefits and the importance of reviewing the SC configuration (answering RQ2). The achieved benefits are evaluated only in economic terms since service performance is ensured by imposing the desired service levels as input parameters for SP-LACE. Regarding the benefits related to SC flexibility and responsiveness, these are not quantitatively measured in this work.
Figure provides a high-level schematic representation of SP-LACE, depicting its constituent stages, their functioning, input parameters and expected outcomes, and ultimately highlighting how SP-LACE contributes to the extant literature by answering RQ1 and RQ2. Figure is built considering the notation on which SP-LACE relies, which is summarised in Tables and . Table reports the indexes and input parameters, while Table lists the decision variables and cost items considered to evaluate the economic benefits of the reviewed SC. Overall, SP-LACE constitutes a data-driven methodology that relies entirely on the analysis of objective data usually available in companies, without needing to consult maintenance experts or perform qualitative analyses (e.g. VED analysis or AHP). Consequently, SP-LACE overcomes the limitations of the methodology by Stoll et al. (Citation2015) since three beneficial side effects are obtained. First, SP-LACE provides results unaffected by subjectivity. Second, the application of SP-LACE is not time-consuming, allowing to manage thousands of SKUs and enabling, for the first time, regular reviews of the SC configuration. Finally, SP-LACE, unlike the methodology by Stoll et al. (Citation2015), includes an economic evaluation of the performance of the reviewed SC configuration.
Figure 1. Schematic representation of SP-LACE.
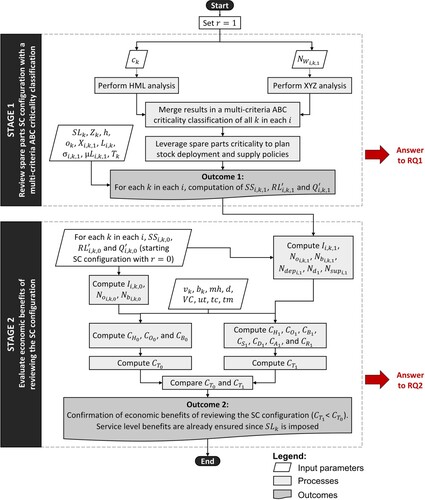
Table 1. Indexes and parameters adopted in SP-LACE.
Table 2. Decision variables and cost items considered in SP-LACE.
Before describing SP-LACE, the assumptions on which it relies are listed, reporting the scientific contributions on which they are based:
DCs are assumed to have an unlimited capacity (Tapia-Ubeda et al. Citation2020).
No costs related to the purchase or rental of DCs are considered because spare parts retailers already own DCs (Cantini et al. Citation2022).
No inbound or outbound transportation costs are considered, being negligible compared with other SC costs (Cohen, Kleindorfer, and Lee Citation1988).
No issues related to spare parts sustainability and closed-loop SCs are considered (Zijm, Knofius, and van der Heijden Citation2019).
Lateral transhipments are treated as described in Appendix A.
Spare parts procurement lead times are assumed to be deterministic (Lolli et al. Citation2022; Kouki and Larsen Citation2021), while spare parts demand is assumed to be stochastic (Liu et al. Citation2014). Specifically, based on Syntetos and Boylan (Citation2006) and the Italian National Standard (Italian Technical Commission for Maintenance Citation2017), SP-LACE considers a normal distribution for SKUs with an average demand during the procurement lead time greater than 15 units, while considering a Poisson distribution for the other SKUs. In this sense, SP-LACE improves the methodology by Stoll et al. (Citation2015), which imposes a normally distributed demand for all SKUs.
Below SP-LACE is presented, showing, in Section 3.1, how to apply the methodology for reviewing the spare parts SC configuration (stage 1), then, in Section 3.2, how to evaluate the economic benefits of the reviewed SC configuration (stage 2).
3.1. Stage 1: reviewing the spare parts SC configuration
To review the spare parts SC configuration, SP-LACE entails performing in each company DC a two-criteria criticality classification of SKUs, which is achieved through an HML and an XYZ analysis, as follows.
The HML analysis is carried out to assess the SKUs’ value by ranking them based on their unitary cost (, which, in spare parts retail companies, is the cost of purchasing spare parts from suppliers). To this end, each SKU’s cost is normalised with respect to the total cost of the SKUs’ spectrum, and the cumulative frequency curve is developed. Then, according to the tangent method (Ultsch and Lötsch Citation2015; Van Wingerden, Tan, and Van Houtum Citation2016), the cumulative frequency curve is divided into three criticality classes (H, M, and L), thus associating each SKU with a specific class.
The XYZ analysis is performed to evaluate spare parts’ criticality based on their historical number of withdrawals executed during the period of analysis in each DC. Therefore, SKUs are ranked according to , which depends on how often customers demand spare parts. As in the HML analysis, the X, Y, and Z classes are identified based on the tangent method and the cumulative frequency curve. Regarding the XYZ analysis, two considerations are worth mentioning. First, for some reasons (e.g. planned renewal of assortments or maintenance campaigns), spare parts retailers may know in advance that their future number of withdrawals in DCs will differ from the expected one (evaluated by looking at the historical value of
). To deal with this issue, they can adjust demand projections by increasing or decreasing
according to the known information, then following the XYZ analysis as usual. Second, the XYZ analysis is intentionally not performed by considering the coefficient of variation of spare parts demand (as in the methodology by Stoll et al. [Citation2015]) nor the historical total demand (
). Rather, the historical number of withdrawals is considered for three reasons. First, the deviation and expected value of spare parts demand are already taken into account when defining the supply policy in DCs (e.g. when calculating SKUs’ reorder levels). Therefore, it is not necessary to consider them twice. Second, the standard deviation and expected value are parameters that typically describe a normal distribution, but the demand for many SKUs follows a Poisson distribution. Finally, classifying spare parts according to their total demand (without examining withdrawal frequencies) would make critical those SKUs requested by customers in high quantities but once in a while and never again, making spare parts retailers unnecessarily increase inventory levels. Conversely, this classification would make noncritical the SKUs frequently requested in small quantities, suggesting spare parts retailers to keep no stocks in DCs, and leading to frequent service level disruptions.
Once the HML and XYZ analyses are performed, their results are combined in a 3 × 3 matrix, whose quadrants can be reclassified into three main criticality classes (α – critical, β – moderately critical, and γ – noncritical), achieving the mono-criterion matrix in Figure (Flores and Whybark Citation1987; Frandsen et al. Citation2020). Specifically, SKUs belonging to HX, HY, and MX quadrants are moved into class α. Indeed, an SKU that is critical in at least one of the two classifications (HML and XYZ analyses) should be critical also in the final mono-criterion classification. For similar reasons, SKUs belonging to LY, MZ, and LZ quadrants are placed into class γ. Finally, the remaining SKUs are grouped into class β.
Figure 2. Transformation of the multi-criteria classification matrix (before) into a mono-criterion one (after).
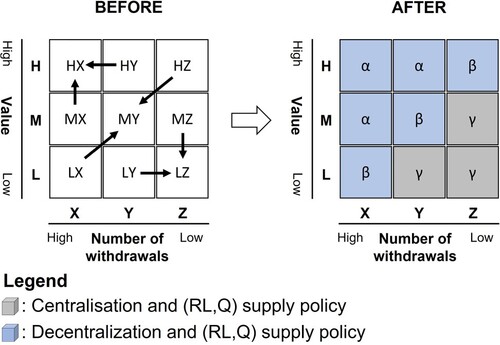
At this point, positioning of SKUs into criticality classes (α, β, and γ) is used to review the SC configuration of each SKU in each DC, defining both optimal stock deployment and supply policies. The SC configuration of each SKU is selected – achieving a trade-off between holding, ordering, and backorder costs – as follows. A decentralised stock deployment is suggested for SKUs in α and β classes. Indeed, storage near peripheral customers is suggested for critical and moderately critical SKUs to reduce delivery times, thus ensuring SC flexibility and SC responsiveness (Van Wingerden, Tan, and Van Houtum Citation2016). Besides, according to Ivanov (Citation2021), in each DC, a continuous () supply policy is indicated for SKUs in α and β classes, where,
is the reorder level calculated to prevent stock-outs of critical and moderately critical SKUs (reducing backorder costs), while
is the optimal order quantity, which allows for keeping optimal inventory levels and finding a trade-off between holding and ordering costs.
Conversely, centralisation in a single DCFootnote1 is indicated for SKUs in the γ class since they are noncritical and rarely required. Hence, their stock deployment and supply efforts should be simplified as much as possible, while benefiting from the risk-pooling effect (Mohammaditabar, Ghodsypour, and O’Brien Citation2012). For γ SKUs, no stock is kept in decentralised DCs, while the central DC should keep stocks based on an () policy, facing the demand of all customers (i.e. cumulated local and peripheral requests).
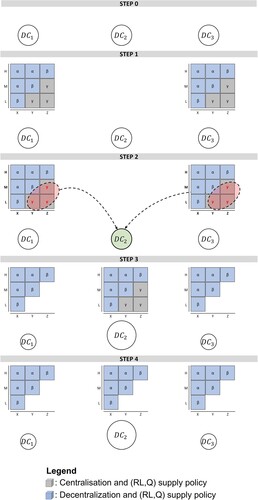
The application of stage 1 of SP-LACE is schematically summarised in Figure , which refers, as an example, to a company with three DCs (,
, and
; see Step 0 in Figure ), where
is assumed as the central DC. As depicted in Figure , to review the SC configuration, the following steps are performed:
In Step 1, the multi-criteria criticality classification of spare parts (HML and XYZ analyses) is accomplished in peripheral DCs (
and
In Step 2, stock deployment policies are defined, indicating to centralise noncritical γ SKUs while keeping the α and β SKUs decentralised.
In Step 3, demand for γ SKUs is cumulated with demand already faced by the central DC. The multi-criteria criticality classification of spare parts is carried out in
Finally, in Step 4, stock supply policies are defined in each DC. No stock is kept for γ SKUs in
Figure 3. Example application of stage 1 of SP-LACE. A detailed description of the steps composing this figure is provided in the text.
To calculate the optimal supply policy associated with each SKU (
) in each DC (
) in the considered SC configuration (
), first, the values of reorder level (
) and optimal order quantity (
) are initialised using Equations 1 and 2, respectively.
(1)
(1)
(2)
(2) where
are the safety stocks (Equation 3) calculated to compensate for demand fluctuations of each SKU (
) in each DC (
) with the desired service level.
(3)
(3) Next, the
and
values are transformed into
and
, respectively, to control the stocks in each DC and prevent excessive inventory levels or unnecessary supply orders from being issued for expensive and slow-moving SKUs. Specifically, two constraints are introduced based on Alvarez and van der Heijden (Citation2014) and Cantini et al. (Citation2021) to achieve the final (
) supply policy. The first constraint (Equation 4) updates the optimal order quantity (
) of SKUs by imposing not to reorder more than twice the units required in the period of analysis (
). The second constraint (Equation 5) updates the reorder level (
), so that no stock is held for low-turnover, high-cost SKUs.
(4)
(4)
(5)
(5)
3.2. Stage 2: evaluating the economic benefits of the reviewed SC configuration
Once the spare parts SC configuration has been reviewed (stage 1), an economic evaluation has to be performed to check the achieved cost benefits and verify the importance of reviewing the SC configuration. To this end, stage 2 is carried out, which provides, for the first time, a mathematical model for comparing the total cost of the reviewed SC with the one of the starting SC (before the review process). Specifically, total SC costs are determined using Equation 6 and based on the notation reported in Tables and . Then, the reviewed SC configuration () is considered economically beneficial with respect to the starting one (
) if it has a lower total cost, according to Equation 7.
(6)
(6)
(7)
(7) where:
4. Results and discussion
SP-LACE was applied to two case studies (companies A and B) with two purposes. First, to test its applicability in real companies. Indeed, by selecting as case studies two spare parts retailers located in different geographical areas, with different territorial expansions, handling different types of spare parts, and serving customers with different features, the general applicability of SP-LACE and its consistency are ensured. Second, to gauge the effectiveness of SP-LACE (also confirming the considerations reported in Section 3.2) by comparing its performance with both the starting (historical) performance of the case study companies and the methodology by Stoll et al. (Citation2015).
For applying SP-LACE (and the methodology by Stoll et al. [Citation2015]), the following input data were collected, whose variable names and descriptions have already been provided in Table .
Input data required to apply both SP-LACE and the methodology by Stoll et al. (Citation2015):
Average
Daily inventory withdrawals performed in each DC during the period of analysis, gathering, for each withdrawal, the following information: identifier of the specific SKU withdrawn (
Characteristics (
Input data required only to apply the methodology by Stoll et al. (Citation2015):
Evaluation of each SKU in terms of the six VED criticality criteria performed by maintenance experts.
Pairwise comparison of the VED evaluations, following a standard AHP procedure (Feng, Hu, and Orji Citation2021).
Moreover, to compare SP-LACE’s results with the historical performance of the case studies, more input data were collected relating to the historical daily orders issued by the company to supply each SKU in each DC during the period of analysis. Specifically, for each supply order, the following information was gathered: identifier of the specific SKU ordered (), SKU description, date of order issue, identification of the DC where the order took place, and quantity ordered to replenish the DC.
In examining the input data needed to apply SP-LACE, its main advantage immediately emerges regardless of the specific case study analysed. SP-LACE (unlike Stoll et al. [Citation2015]) does not require subjective information (obtained from time-consuming expert consultations) to be applied. As a matter of fact, SP-LACE is a data-driven methodology based on objective data usually available in company databases. As such, SP-LACE is applicable in any real-world context, resulting in a reliable, quick, and easy-to-use methodology suitable for regularly reviewing spare parts SC configurations. This advantage is confirmed through the following case studies, where other key performance indicators (KPIs) are also used to discuss SP-LACE’s effectiveness: cost and time required to review the SC configuration, average inventory levels determined in DCs by the suggested stock deployment and supply policies, number of supply orders, number of backorders, resulting holding, ordering, and backorder costs in DCs, and the achieved total SC cost.
Below, Section 4.1 describes case study A, while Section 4.2 presents case study B.
4.1. Case study A
A bus spare parts retailer from southern Europe was chosen for case study A, which manages more than 3000 SKUs. The company purchases spare parts from a single supplier (official partner), stores the stocks into five DCs (, managed independently without admitting lateral transhipments), and serves both external and internal customers. Indeed, on the one hand, company A offers after-sales and warranty services to external customers, to whom it sells spare parts for maintenance activities. On the other hand, company A installs spare parts on its internal vehicles, owning a fleet of over 600 buses. In each DC, stock deployment and supply policies are selected by warehouse managers, who plan the SC configuration based on experience, without adopting systematic approaches.
In this context, SP-LACE and the methodology by Stoll et al. (Citation2015) were applied to review the SC configuration of company A. In agreement with company A, DC1 was selected as the central DC, being the facility with the largest size and central location with respect to customers ( is around 15 km). Furthermore, the input data (mentioned at the beginning of Section 4) were collected, considering 2019 as the period of analysis. Specifically,
desired for each SKU in each DC was defined by consulting company managers, who asked for it to be 95% for all SKUs. Data related to inventory withdrawals and supply orders carried out in 2019 in each DC were extracted from company databases, as well as the information on
,
in 2019,
,
(which resulted in 26.1 €/order for all SKUs), and
(which resulted in 9.87% according to a company evaluation). Concerning
, based on the contract between company A and its supplier, the procurement lead time depends only on the DC (
), not on the SKU (
), being equal to 10 days for SKUs stored in
,
and
, and 4 days for SKUs in
and
. In addition to this data, to apply only the methodology by Stoll et al. (Citation2015), ten meetings were organised with a panel of company maintenance experts (each lasting approximately four hours), where they were asked to evaluate SKUs based on VED criticality criteria, then performing the AHP.
The results achieved by reviewing the SC configuration through stage 1 of SP-LACE and the methodology by Stoll et al. (Citation2015) are provided in Table , considering a sample of ten SKUs in and suggesting their criticality classification (
), stock deployment policies (
), and stock supply policies (
), where the latter are calculated with Equations 4–5 (
) in the case of SP-LACE, while being calculated with Equations 1–2 (
) in the methodology by Stoll et al. (Citation2015). In addition to this information, Table reports the identifier (
) and description of each SKU, its total demand (
) in 2019 in
, the unitary cost (
), the coefficient of variation of demand (
), and the number of withdrawals (
) performed in 2019 in
.
Table 3. Comparison of the criticality classification (), stock deployment policies (
), and supply policies (
) suggested by stage 1 of SP-LACE and the literature methodology (literat., [Stoll et al. Citation2015]) for a sample of ten SKUs in DC2 (
). The symbol ‘-’ suggests keeping no stock for the considered SKUs (i.e. on-demand supply).
Table shows how SP-LACE leads to a different criticality classification () of spare parts than the methodology by Stoll et al. (Citation2015), resulting in the same stock deployment and supply policies in only four out of ten SKUs. Regarding stock deployment policies, SP-LACE keeps all SKUs decentralised except one, promoting decentralisation for more SKUs than Stoll et al. (Citation2015). Concerning stock supply policies, SP-LACE favours higher reorder levels and optimal order quantities, preferring large supply batches and sporadic supply orders, while the methodology by Stoll et al. (Citation2015) often recommends the opposite (one-unit lots and frequent supply orders). The aforementioned considerations are confirmed in Figure , which provides an aggregated view of the results obtained for all SKUs (not just a sample of ten) in all DCs (not just
), comparing the performance of SP-LACE (orange), the methodology by Stoll et al. (Citation2015) (blue), and company A’s historical situation in 2019 (grey).
Figure 4. Total average inventory levels (a), number of orders (b), and number of backorders (c) that occurred in each DC historically in 2019 (grey) by applying stage 1 of SP-LACE (orange) and the methodology by Stoll et al. (Citation2015) (blue), respectively.
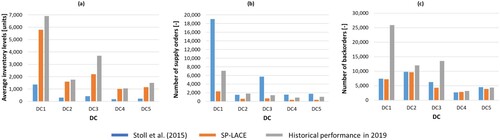
Specifically, Figure .a shows the sum of the average inventory levels () of all SKUs in each DC, highlighting that SP-LACE decentralises stocks more than the methodology by Stoll et al. (Citation2015). Indeed, by comparing the orange and blue histograms in Figure (a), it appears that the methodology by Stoll et al. (Citation2015) stores 55% of the total stocks in the central DC while holding only small amounts of spare parts in peripheral DCs (12% in
, 17% in
, 7% in
, and 9% in
). Instead, SP-LACE centralises fewer spare parts (47% of total stocks are in
), while holding in the other DCs 14%, 19%, 9%, and 11% of stocks, respectively.
Figure (a) illustrates that, in terms of average inventory levels, both SP-LACE and the methodology by Stoll et al. (Citation2015) perform better than company A’s historical situation, indicating that the review of the SC configuration reduces DCs’ filling while ensuring high service levels. SP-LACE results in higher average inventory levels than the methodology by Stoll et al. (Citation2015) due to a stronger tendency towards decentralisation and the adoption of higher reorder levels and optimal order quantities for many SKUs. Therefore, from the perspective of inventory levels, SP-LACE may seem less effective than the methodology by Stoll et al. (Citation2015). However, SP-LACE’s effectiveness can be discussed by examining the number of replenishment orders and the number of backorders in DCs. Figure (b) depicts the sum of the number of supply orders () issued to replenish all SKUs in each DC. As Figure (b) shows, SP-LACE strongly reduces the number of supply orders by suggesting large replenishment batches and sporadic supply orders. On the contrary, the methodology by Stoll et al. (Citation2015) worsens the historical situation, recommending frequent supplies of one-unit lots. Therefore, SP-LACE appears to be a better trade-off between average inventory levels in DCs and the number of supply orders, improving the company’s performance under both these KPIs. Finally, Figure (c) reports the sum of the number of annual backorders that occurred for all SKUs in each DC (
). Taking into account Figure (c), it appears that both SP-LACE and the methodology by Stoll et al. (Citation2015) reduce the number of backorders with respect to company A’s historical situation. However, SP-LACE achieves fewer backorders since it is a data-driven methodology. Indeed, SP-LACE classifies the criticality of SKUs based on the analysis of objective data (not on the consultation of maintenance experts). Therefore, no subjectivity affects the criticality classification results, and mistakes are avoided (unlike in the methodology by Stoll et al. [Citation2015]), in which critical SKUs are identified as noncritical, suggesting keeping few items in stock. Finally, by keeping higher inventory levels (instead of one-unit lots), SP-LACE makes the stocks in DCs more resilient compared with the methodology by Stoll et al. (Citation2015). Indeed, SP-LACE allows company A to better cope with unexpected demand fluctuations (typical of spare parts), preventing future stock-outs and backorder costs in the case of demand variations. Overall, unlike Stoll et al. (Citation2015), SP-LACE improves the company’s historical situation bringing concomitant benefits under all these KPIs: inventory levels in DCs, number of supply orders, and number of backorders. Consequently, SP-LACE improves both company service performance (reducing backorders and ensuring pre-established service levels) and the economic performance (as confirmed below).
Following stage 2 of SP-LACE, the economic impact of reviewing company A’s SC configuration was evaluated in terms of total SC cost (, Equation 6). Hence, the economic performance of the reviewed SC configuration (
) was compared with the starting (historical) one (
). Figure depicts the achieved results in terms of holding (
, Equation 8), ordering (
, Equation 10), and backorder costs (
, Equation 12), which are expressed in kilo-euros (k€) and obtained by applying SP-LACE, the methodology by Stoll et al. (Citation2015), and the company’s historical performance (starting SC configuration), respectively. Moreover, Figure shows the cost incurred to review the SC configuration (
, Equation 14), where trucks with a capacity of 13 m3 (
) and a cost of 0.6 €/km (
) were considered to perform spare parts displacements. To illustrate the benefits of a regular review of company A’s SC configuration, the review was not carried out only once, but twice. As shown in Figure (a), an initial review was conducted to move from the starting (historical) SC configuration to a reviewed one, which was more aligned with the spare parts demand of 2019. After one year, as depicted in Figure (b), a second review was performed by repeating the application of SP-LACE in 2020 and moving to another SC configuration aligned with the demand of 2020. Both Figure (a,b) depict the economic evaluation of the reviewed SC configuration (
in 2019 and 2020, respectively), comparing it with the economic performance that company A would have had by not reviewing the SC configuration (i.e. maintaining the starting SC configuration,
).
Figure 5. Economic assessment of total SC cost () achieved without performing SC configuration reviews (
) or by performing a first (a, in 2019) and a second (b, in 2020) review (
) through SP-LACE and the methodology by Stoll et al. (Citation2015), respectively.
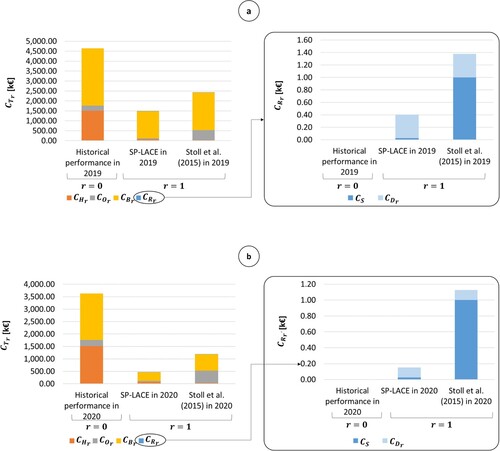
Figure proves that both the first (Figure (a)) and second (Figure (b)) reviews () of the SC configuration were economically convenient for company A with respect to keeping the starting SC configuration unchanged over time (
). Indeed, company A never performed a structured SC configuration review before 2019. Therefore, major holding, ordering, and backorder cost savings were achieved by aligning the SC configuration with spare parts demand, leading to a drastic reduction in
with both SP-LACE and the methodology by Stoll et al. (Citation2015).
Specifically, SP-LACE appeared to be more economically advantageous, resulting in lower total SC cost compared with both Stoll et al. (Citation2015) (−39% in 2019 and −61% in 2020) and the historical situation (−68% in 2019 and −87% in 2020). According to Figure , in both reviews, SP-LACE’s effectiveness and the reduced values of were achieved because SP-LACE strongly decreased ordering and backorder costs, albeit implying higher holding costs compared with Stoll et al. (Citation2015). Lower ordering costs and higher holding costs were obtained since SP-LACE prefers larger supply batches and sporadic supply orders compared with the methodology by Stoll et al. (Citation2015). Instead, lower backorder costs were obtained because SP-LACE is a data-driven methodology, reiterating the importance of classifying the criticality of SKUs based on objective input data. On the contrary, the methodology by Stoll et al. (Citation2015) implies consulting maintenance experts, leading to SC configuration reviews affected by subjectivity, thus causing backorders when critical SKUs are wrongly classified as moderately critical or noncritical (suggesting for them wrong stock deployment and supply policies).
Finally, Figure shows that reviewing the SC configuration implied experiencing a review cost (), which was higher in the first review of the SC configuration (since the stock deployment and supply policies of 99.2% of SKUs were changed), while being lower in the second one (since only small adjustments of stock deployment and supply policies were suggested, updating the management of 31% of SKUs). Specifically,
was lower in SP-LACE than in the methodology by Stoll et al. (Citation2015). This economic benefit was mainly related to time consumption (
) required to collect input data and perform the SC configuration review. In fact, in SP-LACE, the input data related to the 3000 SKUs were collected by executing a single search query on company databases, which provided results in less than an hour. Consequently, the reviewed SC configuration was achieved in one hour (
), leading to a review cost equal to 403 € in the first review of the SC configuration and 151 € in the second one. In contrast, collecting input data for the methodology by Stoll et al. (Citation2015) not only required performing the same search query in the company databases, but also consulting maintenance experts to develop the VED analysis and the AHP. This, as aforementioned, involved organising ten meetings of around four hours each, obtaining the results of stock deployment and supply policies only after forty working hours, and leading to a review cost of 1378 € in the first review and 1126 € in the second one. The lower time consumption (and review costs) of SP-LACE resulted in greater applicability of this methodology in company A, encouraging regular reviews of the spare parts SC configuration and showing additional advantages over Stoll et al. (Citation2015).
SP-LACE’s cost benefits were confirmed by performing a sensitivity analysis, whose outcomes are reported in Table (referring to the year 2019). The input parameters ,
, and
were varied, one at a time, assuming realistic values and deviating from the baseline (red in Table ) to cover wide ranges. Therefore, costs’ sensitivity to changes in
,
, and
was assessed, reporting in Table the following information: the values of
,
,
,
, and
achieved in SP-LACE and the methodology by Stoll et al. (Citation2015); the percentage deviation of
from the baseline achieved in SP-LACE (
) and Stoll et al. (Citation2015) (
); the percentage difference between
in SP-LACE and Stoll et al. (Citation2015) (
); and the percentage difference between
in SP-LACE and the historical performance of Figure (a) (
). The results confirmed that the benefits provided by SP-LACE were not related to a specific circumstance, but rather generalisable. In particular, in all scenarios analysed, SP-LACE elicited a cost reduction compared with both Stoll et al. (Citation2015) and the historical situation (i.e.
and
are negative).
Table 4. Sensitivity analysis on case study A’s results. The costs are expressed in k€, and the abbreviation ‘literat.’ refers to the literature methodology by Stoll et al. (Citation2015).
4.2. Case study B
A spare parts retailer from northern Europe was selected for case study B, which manages almost 8000 SKUs falling into three categories: spare parts for trams (24% out of the total 8000 SKUs), spare parts for subways (64%), and spare parts for repairing or replacing railway and subway infrastructure (the remaining 12%). The company purchases spare parts from several suppliers, stocking them into eight DCs () based on the experience of warehouse staff. Finally, spare parts are installed on the company’s internal vehicles and infrastructures.
Both SP-LACE and the methodology by Stoll et al. (Citation2015) were applied in company B, where the input data mentioned at the beginning of Section 4 were gathered as follows. The required for each SKU in each DC was defined by consulting company managers. As in case study A, 95% was requested for all SKUs. Then, considering 2021 as the period of analysis, the data related to inventory withdrawals and supply orders carried out in 2021 in each DC were extracted from company databases, as well as information on
,
in 2021,
,
(resulting in 5 €/order for all SKUs), and
(resulting in 10% according to a company evaluation). In addition to these data, to apply the methodology by Stoll et al. (Citation2015), fifteen online meetings (each lasting three hours) were organised, where a panel of maintenance experts was asked to evaluate SKUs based on VED criticality criteria, then performing the AHP.
Notably, three aspects distinguished data extraction and SP-LACE application in case study B from case study A. First, in case study B, a specific average procurement lead time () was collected for each SKU (
) in each DC (
), not being the same for all SKUs, but varying according to suppliers, DCs, and the specific SKU ordered. Second, in case study B, the DC chosen as central varied depending on the spare parts typology (while, in case study A, a single central DC –
– was identified for the SC configuration related to all SKUs). In particular, company B chose
as the central DC for the management of tram SKUs,
for subway SKUs, and
for infrastructure SKUs. Finally, in terms of daily quantities withdrawn from DCs, lateral transhipments were allowed and treated as indicated in Appendix A. The case study results are provided below. Table compares the criticality classification (
), stock deployment policies (
), and stock supply policies (
) suggested by stage 1 of SP-LACE and the methodology by Stoll et al. (Citation2015) for a sample of ten SKUs in
, reporting the average procurement lead time (
, expressed in days) and the SKUs’ typology together with the same information already discussed in Table .
Table 5. Comparison of the criticality classification (), stock deployment policies (
), and supply policies (
) suggested by the stage 1 of SP-LACE and the literature methodology (literat., [Stoll et al. Citation2015]) for a sample of ten SKUs in DC1 (
). The symbol ‘-’ suggests keeping no stock for the considered SKU (i.e. on-demand supply).
Table confirms the considerations reported for case study A (Table ), showing that SP-LACE suggested the same stock deployment and supply policies as Stoll et al. (Citation2015) in only two out of ten SKUs. In the remaining cases, concerning stock deployment policies, SP-LACE preferred decentralisation for a higher number of SKUs. Concerning stock supply policies, a visible inclination of SP-LACE towards more sporadic and voluminous reordering batches was seen, while the methodology by Stoll et al. (Citation2015) preferred one-unit lots. In addition, Table shows the importance of considering not only normal demand distributions, but also Poisson distributions for spare parts, thus validating SP-LACE results. Indeed, all SKUs except 821302 and 215112 registered an average demand lower than 15 units during the procurement lead time, demonstrating that not all SKUs have a normally distributed demand, but instead some follow a Poisson distribution. Therefore, the coefficient of variation of demand () is not an adequate parameter with which to delineate SKUs’ criticality, while it is preferable to rely on
.
Like in case study A, the aforementioned considerations were confirmed in Figure , showing that similar results of criticality classification (), stock deployment (
), and supply policies (
) were obtained in the other DCs (not only in
) while considering all SKUs (not just a sample). Figure depicts, for each DC and SKU typology (namely, tram, subway, and infrastructure SKUs), the same information already described in Figure , comparing SP-LACE (orange), the methodology by Stoll et al. (Citation2015) (blue), and company B’s historical performance in 2021 (grey).
Figure 6. Total average inventory levels (a), number of orders (b), and number of backorders (c) occurred in each DC historically in 2021 (grey), by applying stage 1 of SP-LACE (orange), or the methodology by Stoll et al. (Citation2015) (blue), and considering tram (top), subway (middle), and infrastructure (bottom) SKUs.
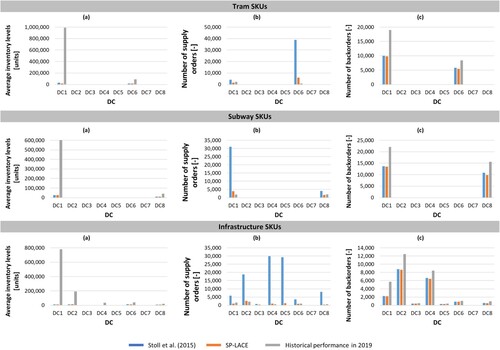
Figure shows the advantages of using SP-LACE to review the configuration of spare parts SCs. Like in company A, the stock deployment and supply policies suggested by SP-LACE produced in company B a significant decrease in average inventory levels (Figure (a)), number of supply orders (Figure (b)), and number of backorders (Figure (c)), resulting in better economic investments in resources. Figure confirmed the results of case study A (Figure ), showing that all aforementioned KPIs were simultaneously improved compared with the historical situation. Based on this, Figure corroborated the effectiveness of SP-LACE compared with the methodology by Stoll et al. (Citation2015), where the latter reduced inventory levels in DCs, but at the expense of the other KPIs (even worsening the number of supply orders compared with the historical situation).
The advantages of SP-LACE over the methodology by Stoll et al. (Citation2015) were not only perceived in the trade-off among the three KPIs of Figure , but also in the absolute values of two of them. In fact, despite leading to a smaller reduction in average inventory levels, SP-LACE strongly reduced the number of supply orders due to higher values of reorder levels and optimal order quantities. Moreover, SP-LACE reduced the number of backorders since, unlike in Stoll et al. (Citation2015), a data-driven criticality classification of SKUs was performed. Whereas, due to consultation with maintenance experts, the methodology by Stoll et al. (Citation2015) produced subjective results of SC configuration review, sometimes associating SKUs with the wrong criticality class, and adopting sub-optimal stock deployment and supply policies.
Like in case study A, SP-LACE improved both company service performance (reducing backorders and ensuring pre-established service levels) and economic performance. The economic impact of stage 1 of SP-LACE on company B was evaluated in terms of total SC cost (, Equation 6). To this end, stage 2 of SP-LACE was applied, comparing holding (
, Equation 8), ordering (
, Equation 10), backorder (
, Equation 12), and review costs (
, Equation 14) of the reviewed SC configuration (
) with the ones of the starting (historical) SC configuration (
). Figure depicts the results achieved through SP-LACE, the methodology by Stoll et al. (Citation2015), and the company’s historical performance in 2021, respectively. Since the SC configuration review was performed at the same time for tram, subway, and infrastructure SKUs (applying SP-LACE to all SKUs), the cost values in Figure are provided in an aggregated form.
was calculated by considering (for SKUs’ displacement) vehicles with a capacity of 16 m3 (
) and a cost of 0.7 €/km (
).
Figure 7. Economic assessment of total SC cost () achieved historically (in 2021, without performing reviews of the SC,
) or by reviewing the SC configuration (
) through SP-LACE and the methodology by Stoll et al. (Citation2015), respectively.
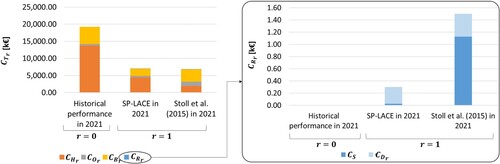
Figure shows that reviewing the SC configuration was economically convenient for company B with respect to the starting SC configuration. Indeed, a reduction in was achieved both with SP-LACE and the methodology by Stoll et al. (Citation2015).
Like in case study A, SP-LACE incurred fewer ordering and backorder costs than Stoll et al. (Citation2015), while implying higher holding costs. However, in case study B, unlike case study A, SP-LACE led to a higher total SC cost (+3%) than Stoll et al. (Citation2015) and this result was due to the reduced cost of issuing one supply order in company B (, different from 26.10 €/order of company A). Given the reduced value of
, the small number of supply orders achieved in SP-LACE (Figure ) did not compensate for the increase in holding costs compared with the methodology by Stoll et al. (Citation2015). This result seems to undermine SP-LACE’s effectiveness against the methodology by Stoll et al. (Citation2015). However, it is worth mentioning that SP-LACE would have become cost-effective compared with Stoll et al. (Citation2015) if the cost of issuing an order would have been 10 €/order (instead of 5 €/order), downplaying the advantage of the methodology by Stoll et al. (Citation2015) over SP-LACE. This consideration was confirmed by performing a sensitivity analysis like the one already proposed in Table . Table summarises the achieved results, pointing out the following aspects. First, by increasing
, SP-LACE appears to be more convenient than Stoll et al. (Citation2015), showing an inflexion point in the value of
between
and
, and enabling negative values of
. Second,
variations produce greater impacts on costs than
. In fact, by increasing
(while maintaining
), cost items vary, but with smaller percentages than those obtained by changing
. This is due to the reduced value of
, which favours frequent supply orders in DCs while suggesting in all the investigated scenarios to keep low inventory levels. Third, variations in
determine greater changes in
with SP-LACE rather than with Stoll et al. (Citation2015). This is because Stoll et al. (Citation2015) frequently suggest keeping one-unit lots in stock. Therefore, smaller values of
are achieved, but increasing the number of backorders (higher
), thus negatively impacting company B’s service performance. Finally, SP-LACE can be considered effective since it reduces
compared with company’s historical performance (i.e. negative
).
Table 6. Sensitivity analysis on case study B’s results. The costs are expressed in k€, with abbreviation ‘literat.’ referring to the literature methodology by Stoll et al. (Citation2015).
Moreover, according to Figure and Table , SP-LACE still conserves strong advantages over Stoll et al. (Citation2015) in terms of time-savings and review cost, being a data-driven methodology. Indeed, to apply SP-LACE, only one search query was performed in company databases, collecting input data related to 8000 SKUs and reviewing the SC configuration in approximately one hour (), with a
of 300 €. Instead, to apply the methodology by Stoll et al. (Citation2015), aside from consulting company databases, fifteen meetings were required to consult maintenance experts and conduct the VED analysis and AHP. Therefore, the input data and the results of stock deployment and supply policies were obtained in forty-five working hours (with a
of 1499 €). Based on this, despite the higher total SC cost, SP-LACE appeared to be more convenient than Stoll et al. (Citation2015) when applied in real companies, being both less time-consuming and allowing regular reviews of the spare parts SC configuration. Last and most important, by not needing to consult company maintenance experts and requiring less input data (usually available in company databases), SP-LACE showed not only higher applicability in real companies, but also higher reliability than the methodology by Stoll et al. (Citation2015), providing results unaffected by subjectivity, and ensuring that promised improvements in both economic and service performance are reached.
Since the review of the SC configuration was performed only once in company B (in 2021), a second review of the SC configuration will be performed at the end of 2022 to further confirm the previous considerations and the importance of reviewing the SC configuration.
5. Conclusions
This paper proposes SP-LACE, the first data-driven methodology to review the configuration of spare parts SCs based on a multi-criteria ABC criticality classification. SP-LACE is quick and easy-to-use and constitutes the main contribution of this work. Its novelty lies in showing how to exploit the results of a criticality classification to align both stock deployment and supply policies of thousands of SKUs in multiple DCs with ever-changing customer needs. Before SP-LACE, only one methodology (Stoll et al. Citation2015) accomplished the same task. However, SP-LACE overcomes the limitations of this literature methodology by being based on objective input data usually available in companies, not requiring expert consultation, and providing an analysis of the benefits achieved by reviewing the SC configuration (thus verifying its effectiveness).
SP-LACE is composed of two stages. In stage 1, a multi-criteria criticality classification of spare parts is performed, and its results are used to plan stock deployment and supply policies of SKUs in DCs, ensuring pre-established service levels and a trade-off between holding, ordering, and backorder costs. In stage 2, a mathematical model evaluates the economic benefits of the reviewed SC configuration (in terms of total SC cost) with respect to the starting one (before the review process). SP-LACE was tested on two case studies, comparing its results with the company’s historical performance and the methodology by Stoll et al. (Citation2015). The case studies underlined the importance of adopting a structured methodology to review the configuration of spare parts SCs. Indeed, SP-LACE significantly improved the economic situation of companies, indicating that stock deployment and supply policies associated so far with SKUs were not aligned with customer needs. Moreover, the results highlighted SP-LACE’s advantages over Stoll et al. (Citation2015). Particularly, SP-LACE produced lower ordering and backorder costs, reducing the total SC cost despite higher holding costs (especially when the unitary cost of issuing one supply order – – was high, or the unitary cost of inventory –
– was low). These advantages were achieved because SP-LACE decentralises stocks more than Stoll et al. (Citation2015), also suggesting replenishing DCs through large batches and sporadic supply orders. Finally, SP-LACE appeared to be reliable, time-saving, and suitable for regular applications in companies. In fact, by being data-driven, SP-LACE only required one hour and low review costs (
) to be applied, producing objective results.
Both researchers and practitioners could be interested in this work. Indeed, for the first time, SP-LACE allows adopting (in real companies) a multi-criteria ABC criticality classification of spare parts not only for planning stock supply policies in a single DC, but also stock deployment policies in multiple DCs (i.e. reviewing SC configurations). Moreover, for the first time, SP-LACE shows the benefits of regularly reviewing an SC configuration. Thus, this work could encourage spare parts retailers to update their starting SC configurations, leading to greater customer satisfaction (due to a better ability to follow demand fluctuations), as well as reduced total SC costs.
However, SP-LACE’s contribution does not come without limitations. First, SP-LACE estimates spare parts’ criticality based on the historical number of withdrawals in DCs (XYZ analysis). This implies evaluating expected demand for spare parts as in a historical regression. Therefore, expected demand is better estimated when a short period of analysis is chosen, making SP-LACE more effective when spare parts retailers frequently review their SC configuration. Second, SP-LACE assumes spare parts with a normal or Poisson distribution. SP-LACE would not lose generality by considering other demand distributions (e.g. compound Poisson). However, investigating different demand distributions lied beyond the scope of this study. Finally, given its heuristic nature, SP-LACE does not guarantee finding an SC configuration characterised by minimum (absolute optimum) total SC cost. Rather, SP-LACE could accept a local optimum. However, this limitation is tolerated since SP-LACE’s heuristic nature makes it quick and easy-to-use. Therefore, spare parts retailers are provided with a methodology for reviewing SC configurations in any industrial context, even where computational resources and advanced technologies are missing.
The authors envision several future developments of this study. First, some simplifying assumptions in SP-LACE should be removed, for example, including transportation costs in the investigation or considering stochastic lead times instead of deterministic ones. Second, the optimal time interval for reviewing the SC configuration should be determined, finding a trade-off between review costs and holding, ordering, and backorder costs. Third, the impact of choosing a different stock supply policy could also be analysed. For instance, we might not consider reordering SKUs based on fixed quantities () but rather follow an ‘order up to level’ policy, where stocks are replenished by an amount that brings inventory back to a predetermined target level. Fourth, SP-LACE’s effectiveness should be quantitatively tested not only in terms of total SC cost and service level, but also in terms of SC flexibility, responsiveness, and resilience to risks such as supply disruptions, abrupt fluctuations in customer demand, or fluctuations in spare parts unitary costs. Finally, the application of SP-LACE could be expanded to sectors beyond spare parts, for example, by optimising the configuration of distribution networks for food, pharmaceuticals, or other products.
Disclosure statement
No potential conflict of interest was reported by the author(s).
Data availability statement
The authors confirm that the data supporting the findings of this study are available within the article [and/or] its supplementary material.
Additional information
Notes on contributors

Alessandra Cantini
Alessandra Cantini is a Ph.D. student both at the University of Florence (UNIFI, Italy), and the Norwegian University of science and technologies (NTNU, Norway). Currently, she is studying topics related to spare parts management and logistics. Her research areas of interest include warehouse management, supply chain management, spare parts inventory management, warehouse safety assessment, and lean manufacturing.

Mirco Peron
Mirco Peron is Associate Professor of Design and Planning of Digital Production Systems at the Department of Mechanical and Industrial Engineering (MTP) at NTNU (Norway). His research interests are multi-disciplinary, and he is currently focusing on the impact of digitalisation and Industry 4.0 technologies on production and logistics systems. He is author and co-author of more than 50 publications in international congress and journals.

Filippo De Carlo
Filippo De Carlo is Associate Professor of Industrial Systems at the Department of Industrial Engineering (DIEF) at UNIFI (Italy) from 2006. He has been and he is involved in several European and National Projects. He is author and co-author of more than 60 publications on international congresses and journals. He is Associated Editor of an international journal. His research topics include industrial plant engineering, maintenance, industrial safety and risk, and energy management.

Fabio Sgarbossa
Fabio Sgarbossa is Full Professor of Industrial Logistics at the Department of Mechanical and Industrial Engineering (MTP) at NTNU (Norway) from October 2018. He was Associate Professor at University of Padova (Italy) where he also received his PhD in Industrial Engineering in 2010. He is leader of the Production Management Group at MTP, and he is responsible of the Logistics 4.0 Lab at NTNU. He has been and he is involved in several European and National Projects. He is author and co-author of more than 150 publications in relevant international journals, about industrial logistics, material handling, materials management, supply chain. He is member of Organising and Scientific Committees of several International Conferences, and he is member of editorial boards in relevant International Journals.
Notes
1 Among the DCs that the company owns, the most suitable one for centralisation purposes (central DC) can be selected in many ways. However, investigating these methods lies beyond the scope of this study. Hence, we only mention that the central DC can be selected by applying techniques, e.g. those by Farahani et al. (Citation2015) and Fathi et al. (Citation2021), or simply by identifying the facility with the largest size and centrality to customers.
References
- Ahmed, R., H. S. Heese, and M. Kay. 2023. “Designing a Manufacturing Network with Additive Manufacturing Using Stochastic Optimisation.” International Journal of Production Research 61: 2267–2287. doi:10.1080/00207543.2022.2056723.
- Alfieri, A., E. Pastore, and G. Zotteri. 2017. “Dynamic Inventory Rationing: How to Allocate Stock According to Managerial Priorities. An Empirical Study.” International Journal of Production Economics 189: 14–29. doi:10.1016/j.ijpe.2017.04.004.
- Alvarez, E., and M. Van Der Heijden. 2014. “On Two-Echelon Inventory Systems with Poisson Demand and Lost Sales.” European Journal of Operational Research 235 (1): 334–338. doi:10.1016/j.ejor.2013.12.031.
- Amirkolaii, K. N., A. Baboli, M. K. Shahzad, and R. Tonadre. 2017. “Demand Forecasting for Irregular Demands in Business Aircraft Spare Parts Supply Chains by Using Artificial Intelligence (AI).” IFAC-PapersOnLine 50: 15221–15226. doi:10.1016/j.ifacol.2017.08.2371.
- Babai, M. Z., T. Ladhari, and I. Lajili. 2015. “On the Inventory Performance of Multi-Criteria Classification Methods: Empirical Investigation.” International Journal of Production Research 53: 279–290. doi:10.1080/00207543.2014.952791.
- Basto, J., J. S. Ferreira, S. G. Alcalá, E. Frazzon, and S. Moniz. 2019. “Optimal Design of Additive Manufacturing Supply Chains.” In Proceedings of the International Conference on Industrial Engineering and Operations Management. Presented at the International Conference on Idustrial Engineering and Operations Management (IEOM), Pilsen, Czech Republic.
- Botter, R., and L. Fortuin. 2000. “Stocking Strategy for Service Parts – A Case Study.” International Journal of Operations & Production Management 20: 656–674. doi:10.1108/01443570010321612.
- Braglia, M., A. Grassi, and R. Montanari. 2004. “Multi-Attribute Classification Method for Spare Parts Inventory Management.” Journal of Quality in Maintenance Engineering 10: 55–65. doi:10.1108/13552510410526875.
- Cantini, A., F. De Carlo, L. Leoni, and M. Tucci. 2021. “A Novel Approach for Spare Parts Dynamic Deployment.” In Proceedings of the Summer School Francesco Turco. Presented at the XXVI Summer School “Francesco Turco” – Industrial Systems Engineering, Bergamo, Italy.
- Cantini, A., M. Peron, F. De Carlo, and F. Sgarbossa. 2022. “A Decision Support System for Configuring Spare Parts Supply Chains Considering Different Manufacturing Technologies.” International Journal of Production Research, 1–21. doi:10.1080/00207543.2022.2041757.
- Celebi, D., D. Bayraktar, and S. Ozturkcan. 2008. “Multi Criteria Classification for Spare Parts Inventory.” In 38th Computer and Industrial Engineering Conference. Beijing, China, 1780–1787. doi:10.2139/ssrn.1362575.
- Chen, J.-X. 2011. “Peer-Estimation for Multiple Criteria ABC Inventory Classification.” Computers & Operations Research 38: 1784–1791. doi:10.1016/j.cor.2011.02.015.
- Chen, Y., K. W. Li, D. M. Kilgour, and K. W. Hipel. 2008. “A Case-Based Distance Model for Multiple Criteria ABC Analysis.” Computers & Operations Research 35: 776–796. doi:10.1016/j.cor.2006.03.024.
- Chu, C.-W., G.-S. Liang, and C.-T. Liao. 2008. “Controlling Inventory by Combining ABC Analysis and Fuzzy Classification.” Computers & Industrial Engineering 55: 841–851. doi:10.1016/j.cie.2008.03.006.
- Cohen, M. A., N. Agrawal, and V. Agrawal. 2006. “Achieving Breakthrough Service Delivery Through Dynamic Asset Deployment Strategies.” Interfaces 36: 259–271. doi:10.1287/inte.1060.0212.
- Cohen, M., P. V. Kamesam, P. Kleindorfer, H. Lee, and A. Tekerian. 1990. “Optimizer: IBM’s Multi-Echelon Inventory System for Managing Service Logistics.” Interfaces 20: 65–82. doi:10.1287/inte.20.1.65.
- Cohen, M. A., P. R. Kleindorfer, and H. L. Lee. 1988. “Service Constrained (s,S) Inventory Systems with Priority Demand Classes and Lost Sales.” Management Science 34: 482–499. doi:10.1287/mnsc.34.4.482.
- Cohen, M. A., Y.-S. Zheng, and Y. Wang. 1999. “Identifying Opportunities for Improving Teradyne’s Service-Parts Logistics System.” Interfaces 29: 1–18. doi:10.1287/inte.29.4.1.
- Del Prete, A., and T. Primo. 2021. “Innovative Methodology for the Identification of the Most Suitable Additive Technology Based on Product Characteristics.” Metals 11: 409. doi:10.3390/met11030409.
- Ding, S., and P. M. Kaminsky. 2020. “Centralized and Decentralized Warehouse Logistics Collaboration.” Manufacturing & Service Operations Management 22: 812–831. doi:10.1287/msom.2019.0774.
- Durán, O., A. Carrasco, P. S. Afonso, and P. A. Durán. 2019. “Evolutionary Optimization of Spare Parts Inventory Policies: A Life Cycle Costing Perspective.” In IFAC-PapersOnLine, 13. Presented at the 9th IFAC Conference on Manufacturing Modelling, Management and Control, MIM 2019, Berlin, Germany, 2243–2248. doi:10.1016/j.ifacol.2019.11.539.
- Eldem, B., A. Kluczek, and J. Bagiński. 2022. “The COVID-19 Impact on Supply Chain Operations of Automotive Industry: A Case Study of Sustainability 4.0 Based on Sense–Adapt–Transform Framework.” Sustainability 14: 5855. doi:10.3390/su14105855.
- Esmaeili, N., E. Teimoury, and F. Pourmohammadi. 2021. “A Scenario-Based Optimization Model for Planning and Redesigning the Sale and After-Sales Services Closed-Loop Supply Chain.” RAIRO - Operations Research 55: S2859–S2877. doi:10.1051/ro/2020131.
- Farahani, R. Z., H. Rashidi Bajgan, B. Fahimnia, and M. Kaviani. 2015. “Location Inventory Problem in Supply Chains: A Modelling Review.” International Journal of Production Research 53: 3769–3788. doi:10.1080/00207543.2014.988889.
- Fathi, M., M. Khakifirooz, A. Diabat, and H. Chen. 2021. “An Integrated Queuing-Stochastic Optimization Hybrid Genetic Algorithm for a Location-Inventory Supply Chain Network.” International Journal of Production Economics 237: 108139. doi:10.1016/j.ijpe.2021.108139.
- Feng, B., X. Hu, and I. J. Orji. 2021. “Multi-tier Supply Chain Sustainability in the Pulp and Paper Industry: A Framework and Evaluation Methodology.” International Journal of Production Research, 1–27. doi:10.1080/00207543.2021.1890260.
- Flores, B. E., and D. Clay Whybark. 1986. “Multiple Criteria ABC Analysis.” International Journal of Operations & Production Management 6: 38–46. doi:10.1108/eb054765.
- Flores, B. E., and D. C. Whybark. 1987. “Implementing Multiple Criteria ABC Analysis.” Journal of Operations Management 7: 79–85. doi:10.1016/0272-6963(87)90008-8.
- Frandsen, C. S., M. M. Nielsen, A. Chaudhuri, J. Jayaram, and K. Govindan. 2020. “In Search for Classification and Selection of Spare Parts Suitable for Additive Manufacturing: A Literature Review.” International Journal of Production Research 58: 970–996. doi:10.1080/00207543.2019.1605226.
- Gajpal, P. P., L. S. Ganesh, and C. Rajendran. 1994. “Criticality Analysis of Spare Parts Using the Analytic Hierarchy Process.” International Journal of Production Economics 35: 293–297. doi:10.1016/0925-5273(94)90095-7.
- Giannikas, V., D. McFarlane, and J. Strachan. 2019. “Towards the Deployment of Customer Orientation: A Case Study in Third-Party Logistics.” Computers in Industry 104: 75–87. doi:10.1016/j.compind.2018.10.005.
- Gong, J., Y. Luo, Z. Qiu, and X. Wang. 2022. “Determination of Key Components in Automobile Braking Systems Based on ABC Classification and FMECA.” Journal of Traffic and Transportation Engineering (English Edition) 9: 69–77. doi:10.1016/j.jtte.2019.01.008.
- Gregersen, N. G., and Z. N. L. Hansen. 2018. “Inventory Centralization Decision Framework for Spare Parts.” Production Engineering 12: 353–365. doi:10.1007/s11740-018-0814-3.
- Gupta, R., K. K. Gupta, B. R. Jain, and R. K. Garg. 2007. “ABC and VED Analysis in Medical Stores Inventory Control.” Medical Journal Armed Forces India 63: 325–327. doi:10.1016/S0377-1237(07)80006-2.
- Hanafi, R., F. Mardin, S. Asmal, I. Setiawan, and S. Wijaya. 2019. “Toward a Green Inventory Controlling Using the ABC Classification Analysis: A Case of Motorcycle Spares Parts Shop.” IOP Conference Series: Earth and Environmental Science 343: 012012. doi:10.1088/1755-1315/343/1/012012.
- Hu, Q., J. E. Boylan, H. Chen, and A. Labib. 2018. “OR in Spare Parts Management: A Review.” European Journal of Operational Research 266: 395–414. doi:10.1016/j.ejor.2017.07.058.
- Huiskonen, J. 2001. “Maintenance Spare Parts Logistics: Special Characteristics and Strategic Choices.” International Journal of Production Economics 71: 125–133. doi:10.1016/S0925-5273(00)00112-2.
- Islam, S. S., A. H. Pulungan, and A. Rochim. 2019. “Inventory Management Efficiency Analysis: A Case Study of an SME Company.” Journal of Physics: Conference Series 1402: 022040. doi:10.1088/1742-6596/1402/2/022040.
- Italian Technical Commission for Maintenance. 2017. UNI 10749-3:2017 - Manutenzione - Guida per la gestione dei materiali per la manutenzione - Parte 3: Criteri per la selezione dei materiali da gestire.
- Ivanov, D. 2021. Supply Chain Simulation and Optimization with Anylogistix. 5th ed. Berlin: Berlin School of Economics and Law.
- Jadhav, P., and M. Jaybhaye. 2020. “A Manufacturing Industry Case Study: ABC and HML Analysis for Inventory Management.” International Journal of Research in Engineering, Science and Management 3: 146–149. doi:10.47607/ijresm.2020.315.
- Jiang, Y., C. Shi, and S. Shen. 2019. “Service Level Constrained Inventory Systems.” Production and Operations Management 28: 2365–2389. doi:10.1111/poms.13060.
- Kauremaa, J., and J. Holmström. 2017. “Differences in Adoption of Global Spare Parts Management in Autonomous Service Units.” Journal of Quality in Maintenance Engineering 23: 370–382. doi:10.1108/JQME-12-2012-0045.
- Khajavi, S. H., J. Partanen, and J. Holmström. 2014. “Additive Manufacturing in the Spare Parts Supply Chain.” Computers in Industry 65: 50–63. doi:10.1016/j.compind.2013.07.008.
- Kouki, C., and C. Larsen. 2021. “Rationing Policies in a Spare Parts Inventory System with Customers Differentiation.” International Journal of Production Research 59: 6270–6290. doi:10.1080/00207543.2020.1811418.
- Li, Y., Y. Cheng, Q. Hu, S. Zhou, L. Ma, and M. K. Lim. 2019. “The Influence of Additive Manufacturing on the Configuration of Make-to-Order Spare Parts Supply Chain under Heterogeneous Demand.” International Journal of Production Research 57: 3622–3641. doi:10.1080/00207543.2018.1543975.
- Liu, P., S. H. Huang, A. Mokasdar, H. Zhou, and L. Hou. 2014. “The Impact of Additive Manufacturing in the Aircraft Spare Parts Supply Chain: Supply Chain Operation Reference (Scor) Model Based Analysis.” Production Planning & Control 25: 1169–1181. doi:10.1080/09537287.2013.808835.
- Lolli, F., E. Balugani, A. Ishizaka, R. Gamberini, B. Rimini, and A. Regattieri. 2019. “Machine Learning for Multi-Criteria Inventory Classification Applied to Intermittent Demand.” Production Planning & Control 30: 76–89. doi:10.1080/09537287.2018.1525506.
- Lolli, F., A. M. Coruzzolo, M. Peron, and F. Sgarbossa. 2022. “Age-Based Preventive Maintenance with Multiple Printing Options.” International Journal of Production Economics 243: 108339. doi:10.1016/j.ijpe.2021.108339.
- Lolli, F., A. Ishizaka, and R. Gamberini. 2014. “New AHP-Based Approaches for Multi-Criteria Inventory Classification.” International Journal of Production Economics 156: 62–74. doi:10.1016/j.ijpe.2014.05.015.
- Lukinskiy, V., V. Lukinskiy, and B. Sokolov. 2020. “Control of Inventory Dynamics: A Survey of Special Cases for Products with Low Demand.” Annual Reviews in Control 49: 306–320. doi:10.1016/j.arcontrol.2020.04.005.
- Luluah, L., N. Baidowi, and W. A. Jauhari. 2020. “Inventory Control of Machine Spare Part Using Periodic Review Method: A Case Study in PT Sari Warna Asli Textile.” In AIP Conference Proceedings. Presented at the 5th International Conference on Industrial, Mechanical Electrical, and Chemical Engineering 2019, ICIMECE 2019, Surakarta. doi:10.1063/5.0000687.
- Mangiaracina, R., G. Song, and A. Perego. 2015. “Distribution Network Design: A Literature Review and a Research Agenda.” International Journal of Physical Distribution & Logistics Management 45: 506–531. doi:10.1108/IJPDLM-02-2014-0035.
- Manikas, I., B. Sundarakani, and V. Iakimenko. 2019. “Time-Based Responsive Logistics for a Maintenance Service Network: A Case Study of an Automated Teller Manufacturer.” Journal of Quality in Maintenance Engineering 25: 589–611. doi:10.1108/JQME-01-2018-0002.
- May, B. I., M. P. Atkinson, and G. Ferrer. 2017. “Applying Inventory Classification to a Large Inventory Management System.” Journal of Operations and Supply Chain Management 10: 68–86. doi:10.12660/joscmv10n1p68-86.
- Mehdizadeh, M. 2020. “Integrating ABC Analysis and Rough Set Theory to Control the Inventories of Distributor in the Supply Chain of Auto Spare Parts.” Computers & Industrial Engineering 139: 105673. doi:10.1016/j.cie.2019.01.047.
- Milewski, D. 2020. “Total Costs of Centralized and Decentralized Inventory Strategies—Including External Costs.” Sustainability 12: 9346. doi:10.3390/su12229346.
- Millstein, M. A., L. Yang, and H. Li. 2014. “Optimizing ABC Inventory Grouping Decisions.” International Journal of Production Economics 148: 71–80. doi:10.1016/j.ijpe.2013.11.007.
- Mohammaditabar, D., S. H. Ghodsypour, and C. O’Brien. 2012. “Inventory Control System Design by Integrating Inventory Classification and Policy Selection.” International Journal of Production Economics 140: 655–659. doi:10.1016/j.ijpe.2011.03.012.
- Muthalib, I. S., A. B. Indah, S. Asmal, and G. Z. R. Hamzir. 2022. “Planning of Excavator 320D Spare Part Inventory Used ABC-FSN Analysis and Lot Sizing Method (Case Study: PT Trakindo Utama Makassar).” Presented at the AIP Conference Proceedings. doi:10.1063/5.0095469.
- Odedairo, B. O. 2021. “Managing Spare Parts Inventory by Incorporating Holding Costs and Storage Constraints.” Journal of Engineering, Project, and Production Management 11: 139–144. doi:10.2478/jeppm-2021-0014.
- Partovi, F. Y., and M. Anandarajan. 2002. “Classifying Inventory Using an Artificial Neural Network Approach.” Computers & Industrial Engineering 41: 389–404. doi:10.1016/S0360-8352(01)00064-X.
- Persson, F., and N. Saccani. 2007. “Managing the After Sales Logistic Network— A Simulation Study of a Spare Parts Supply Chain.” In Advances in Production Management Systems, IFIP, edited by J. Olhager, and F. Persson, 313–320. Boston, MA: Springer US. doi:10.1007/978-0-387-74157-4_37.
- Petrović, D., and R. Petrović. 1992. “SPARTA II: Further Development in an Expert System for Advising on Stocks of Spare Parts.” International Journal of Production Economics 24: 291–300. doi:10.1016/0925-5273(92)90141-S.
- Ramanathan, R. 2006. “ABC Inventory Classification with Multiple-Criteria Using Weighted Linear Optimization.” Computers & Operations Research 33: 695–700. doi:10.1016/j.cor.2004.07.014.
- Roda, I., M. Macchi, L. Fumagalli, and P. Viveros. 2014. “A Review of Multi-Criteria Classification of Spare Parts: From Literature Analysis to Industrial Evidences.” Journal of Manufacturing Technology Management 25: 528–549. doi:10.1108/JMTM-04-2013-0038.
- Schmitt, A. J., S. A. Sun, L. V. Snyder, and Z.-J. M. Shen. 2015. “Centralization versus Decentralization: Risk Pooling, Risk Diversification, and Supply Chain Disruptions.” Omega 52: 201–212. doi:10.1016/j.omega.2014.06.002.
- Sheikh-Zadeh, A., M. D. Rossetti, and M. A. Scott. 2021. “Performance-Based Inventory Classification Methods for Large-Scale Multi-Echelon Replenishment Systems.” Omega 101: 102276. doi:10.1016/j.omega.2020.102276.
- Sheikhar, C., and R. Matai. 2022. “The Linkages between Spare-Parts Management and Maintenance Management in Army Supply Chain of Vehicles.” In Lecture Notes in Mechanical Engineering, 45–59. doi:10.1007/978-981-16-5281-3_5.
- Stoll, J., R. Kopf, J. Schneider, and G. Lanza. 2015. “Criticality Analysis of Spare Parts Management: A Multi-Criteria Classification Regarding a Cross-Plant Central Warehouse Strategy.” Production Engineering 9: 225–235. doi:10.1007/s11740-015-0602-2.
- Svoboda, J., and S. Minner. 2022. “Tailoring Inventory Classification to Industry Applications: The Benefits of Understandable Machine Learning.” International Journal of Production Research 60: 388–401. doi:10.1080/00207543.2021.1959078.
- Syntetos, A. A., and J. E. Boylan. 2006. “Smoothing and Adjustments of Demand Forecasts for Inventory Control.” IFAC Proceedings Volumes 39: 173–178. doi:10.3182/20060517-3-FR-2903.00104.
- Tapia-Ubeda, F. J., P. A. Miranda, I. Roda, M. Macchi, and O. Durán. 2020. “Modelling and Solving Spare Parts Supply Chain Network Design Problems.” International Journal of Production Research 58: 5299–5319. doi:10.1080/00207543.2020.1720924.
- Teunter, R. H., M. Z. Babai, and A. A. Syntetos. 2010. “ABC Classification: Service Levels and Inventory Costs.” Production and Operations Management 19: 343–352. doi:10.1111/j.1937-5956.2009.01098.x.
- Ultsch, A., and J. Lötsch. 2015. “Computed ABC Analysis for Rational Selection of Most Informative Variables in Multivariate Data.” PLoS ONE 10: e0129767. doi:10.1371/journal.pone.0129767.
- Van der Auweraer, S., and R. Boute. 2019. “Forecasting Spare Part Demand Using Service Maintenance Information.” International Journal of Production Economics 213: 138–149. doi:10.1016/j.ijpe.2019.03.015.
- Van Wingerden, E., T. Tan, and G. Van Houtum. 2016. “Design of a Near-Optimal Generalized ABC Classification for a Multi-Item Inventory Control Problem.” BETA Working Paper. Eindhoven University of Technology.
- Wang, X. 2019. “Optimization of ABC Classification Method for Automobile Spare Parts Based on DEA.” IOP Conference Series: Earth and Environmental Science 252: 022005. doi:10.1088/1755-1315/252/2/022005.
- Yazdekhasti, A., S. Sharifzadeh, and J. Ma. 2022. “A Two-Echelon Two-Indenture Warranty Distribution Network Development and Optimization under Batch-Ordering Inventory Policy.” International Journal of Production Economics 249: 108508. doi:10.1016/j.ijpe.2022.108508.
- Yu, M.-C. 2011. “Multi-Criteria ABC Analysis Using Artificial-Intelligence-Based Classification Techniques.” Expert Systems with Applications 38: 3416–3421. doi:10.1016/j.eswa.2010.08.127.
- Zhang, R. Q., W. J. Hopp, and C. Supatgiat. 2001. “Spreadsheet Implementable Inventory Control for a Distribution Center.” Journal of Heuristics 7: 185–203. doi:10.1023/A:1009613921001.
- Zijm, H., N. Knofius, and M. van der Heijden. 2019. “Additive Manufacturing and Its Impact on the Supply Chain.” In Operations, Logistics and Supply Chain Management. Lecture Notes in Logistics, edited by H. Zijm, M. Klumpp, A. Regattieri, and S. Heragu, 521–543. Cham: Springer. doi:10.1007/978-3-319-92447-2_23.
Appendix A
Lateral transhipments are usually performed when the stocks in a DC are not sufficient to meet customer needs, so it is necessary to procure stocks from another DC (Cohen, Kleindorfer, and Lee Citation1988). Considering as an example two DCs ( and
), if
receives a demand for spare parts, but cannot satisfy it, it can order the required stocks from
. Consequently, the stocks are first withdrawn from
(first type of withdrawal, namely lateral transhipment) and delivered to
to satisfy its request. Then, the stocks are withdrawn from
(second type of withdrawal) to satisfy customer needs. Based on this, in this work, we considered only the second type of withdrawals as spare parts demand, while lateral transhipments (first type of withdrawal) were not considered for the following reason. In the first instance, it is reasonable to assume that, by applying SP-LACE in each DC, the suggested stock deployment and supply policies and the consequent inventory levels (calculated to compensate for both ordinary demands and those related to the second type of withdrawals) are sufficient to meet the needs of local customers (Tapia-Ubeda et al. Citation2020). Subsequently, since SP-LACE can be applied more than once, by recursively reviewing the spare parts SC configuration, a better alignment of stocks with customer needs is expected in the company’s future and, in a long-term evaluation, it is reasonable to expect a reduction, or even removal, of lateral transhipments.