
 ?Mathematical formulae have been encoded as MathML and are displayed in this HTML version using MathJax in order to improve their display. Uncheck the box to turn MathJax off. This feature requires Javascript. Click on a formula to zoom.
ABSTRACT
Cloud Manufacturing (CMfg) is a promising approach that leverages the sharing economy to reduce costs and enhance supply chain flexibility. Particularly, when utilised alongside Additive Manufacturing (AM), CMfg is considered a key enabler for collaborative production (CP) systems. However, there is still a lack of planning models that reduce entry barriers for CP. Therefore, we propose a decentralised CP planning framework for AM. In our approach, machines autonomously select jobs from an existing production plan to forward them to other suppliers that can produce these parts more efficiently. A CMfg platform facilitates job forwarding and creates promising part bundles and manufacturing machines autonomously places bids on the packages via a combinatorial price reverse auction. Costs of the reallocated bundles are shared throughout a Shapley value-based approach without the need to disclose critical information. We benchmark our proposed framework against a centralised planning approach and find that it achieves comparable effectiveness as the benchmark solution. We also show that this mechanism promotes individual rationality and that agents particularly benefit when participating in both offering and acquiring production jobs through the auction.
1. Introduction
In recent years, the focus in the production industry has shifted from mass production to mass customisation, and service expectations are growing while customers increasingly seek to purchase sustainable products (Alicke, Rexhausen, and Seyfert Citation2016; Crommentuijn-Marsh, Eckert, and Potter Citation2010; Hu Citation2013). Such an environment creates immense pressure on manufacturers to meet customers' requirements. One option to overcome this burden is to adopt the sharing economy (SE) paradigm.
Researchers found that the SE can reduce production costs while responding flexibly to customers' needs and expectations (Grondys Citation2019). This cost saving can be accomplished with collaborative production (CP), which is one of the main pillars of the SE (Probst, Frideres, and Pedersen Citation2015). Several quantitative in-depth studies have already demonstrated that with collaborative production, costs can be decreased significantly (Gansterer, Födermayr, and Hartl Citation2021; Gansterer and Hartl Citation2020b; Zehetner and Gansterer Citation2022a). However, to overcome the barriers of CP, suitable technologies are needed. Cloud Manufacturing (CMfg) could be one of the key technologies for CP. Xu (Citation2012) introduced the term CMfg,and the author proposed to align it with NIST's definition of cloud computing, defining CMfg as
a model for enabling ubiquitous, convenient, on-demand network access to a shared pool of configurable manufacturing resources (e.g. manufacturing software tools, manufacturing equipment, and manufacturing capabilities) that can be rapidly provisioned and released with minimal management effort or service provider interaction.
In CMfg three kind of participants are interconnected: suppliers, who share their production resources, customers, who have parts requiring production and the platform operator, responsible for managing the CMfg system. The operator's role includes finding, combining, controlling, and coordinating the services to meet customer demands (Adamson et al. Citation2017).
Early research that laid the groundwork for CMfg emphasised the significance of these platforms in promoting resource sharing and asserted that the operators need to provide effective and unobstructed coordination mechanisms to market participants in order to generate value (He and Xu Citation2015; Ren et al. Citation2015; Wu et al. Citation2013; Zhang et al. Citation2014).
Some studies explored incorporating traditional manufacturing technologies into CMfg and identified challenges in this fusion. Nevertheless, other researchers proposed using Additive Manufacturing (AM) as a more compatible substitute technology. This approach gained acceptance and has subsequently been adopted by several industry platforms (Haseltalab and Yaman Citation2019).
AM, also known as 3D printing, is a manufacturing technology that produces the needed product layer-by-layer directly (Jiang, Kleer, and Piller Citation2017). In contrast to conventional technologies, it does not require costly tools, molds, or punches for production. AM is also associated with short lead times, which offer a high degree of flexibility and creates the opportunity to sell part print files instead of selling pyhsical parts. This characteristics make it an ideal technology for integration with CMfg (Haghnegahdar, Joshi, and Dahotre Citation2022).
Furthermore, the manufacturing production process is digitally streamlined and produces negligible production quality deviations. Hence, this technology makes it easy to share or exchange production jobs between plants or machines/agents (Baumers et al. Citation2016; Berman Citation2012).
This aspect is of particular importance as it addresses prevalent environmental challenges. By relocating production closer to customers, the potential for reducing CO2 emissions resulting from transportation becomes evident (Chaudhuri et al. Citation2021; Khorram Niaki and Nonino Citation2017). Moreover, environmental concerns can also be mitigated within the manufacturing realm. In Additive Manufacturing (AM), the aggregation of components into batches, referred ‘dense batching’, can significantly reduce overall manufacturing durations (Zehetner and Gansterer Citation2022a). Furthermore, the intrinsic nature of CMfg fosters increased collaboration, creating more opportunities for effective batching. Researchers also have demonstrated that energy consumption can be decreased by optimising machine utilisation, resulting in lower energy consumption (Rinaldi et al. Citation2021). Notably, Simeone, Caggiano, and Zeng (Citation2020) contend that denser batching can also minimise waste metal powder by producing more parts on a single print bed, thereby reducing material costs and enhancing sustainability. Overall, the adoption of AM has the potential to streamline global inventory, leading to conservation of resources (Kunovjanek and Reiner Citation2020).
Nevertheless, to leverage the advantages of CP and AM, service matching and scheduling are essential in CMfg. In the past, researchers primarily focussed on centralised AM planning methods. While these approaches can yield globally better solutions (Saharidis, Dallery, and Karaesmen Citation2006), they encounter challenges in efficiently generating schedules in dynamic CMfg environments. Multi-agent technologies offering solutions for overcoming these challenges in CMfg. Autonomous agents can be modelled with objectives and preferences, enabling the creation of schedules through cooperation, coordination, and negotiation (Y. Liu et al. Citation2019). Halty et al. (Citation2020) suggests that game theory approaches could be suitable tools when designing decentralised systems. However, in decentralised planning involving multiple agents one needs to balance fairness and efficiency. This often results in a trade-off where fairer results lead to less efficient solutions. Furthermore, defining fairness within the system is a critical consideration, a question that lacks a universally applicable answer (Yilmaz and Yoon Citation2020; Yilmaz, Yoon, and Seok Citation2017).
In the past, researchers applied more and more auction mechanism designs to solve production and transport planning problems in a fair manner (Gansterer, Hartl, and Sörensen Citation2020; Pahwa, Starly, and Cohen Citation2018; Z. H. Liu, Wang, and Yang Citation2019). However, only few studies on decentralised planning approaches were conducted in this field, and no study considers all critical elements for CP in AM. Our study tries to close this research gap by proposing a decentralised production planning framework that not only incorporates the essential technical elements necessary for effective AM planning, but also facilitates an appropriate decentralised mechanism to achieve the individual objectives of agents within the system. Thus, we introduce an auction-based mechanism in which machines can select parts from their existing production plans that should be forwarded to a CMfg platform. It creates effective bundles and redistributes them among agents if this increases cost efficiency. The participating agents then share the overall cost savings with a Shapley value-based approach.
Our study provides the following four contributions.
We propose an enhanced decentralised framework for the collaborative batching problem in multi-site AM.
We utilise a novel, fair cost-sharing method to the problem that efficiently approximates the Shapley Value. Additionally, our study demonstrates that active participation in the framework benefits each agent.
In the computational studies, we thoroughly compare the newly proposed approach against the performance of a centralised benchmark solution framework. We demonstrate that significant savings can be reached within reasonable computational time.
In our study, we also investigate the most effective collaboration policies for agents and create valuable management insights.
In our prior research (Zehetner and Gansterer Citation2022c), we introduced the basic framework. Nevertheless, the current study constitutes an enhanced framework. Our work also provides a comprehensive literature review and an in-depth explanation of the framework. It also includes experiments that substantiate the framework's performance and presents larger instances for better real-world applicability. Additionally, we provide deeper insights for individual agents within the framework and draw valuable managerial conclusions.
The remaining paper is structured as follows. Section 2 provides a literature review. In Section 3 we summarise the problem description. Section 4 describes our proposed framework. The computational study can be found in Section 5, while Section 6 closes the study with a summary and a conclusion.
2. Related literature
Our literature review focuses on decentralised scheduling and resource allocation problems in AM and CMfg. However, we also approach the field of logistics as there are several suitable methods which can be adapted to production planning problems.
Only a few articles studied the application of decentralised methods within the field of AM. Pahwa, Starly, and Cohen (Citation2018) devised a reverse auction mechanism in which customers bid prices for requested services. A platform then finds a provider that produces the part under the stated price. Li et al. (Citation2019) presented an approach for dynamic order acceptance and scheduling for on-demand AM production. In their study, service providers select orders and schedule them individually. In the study of de Antón et al. (Citation2020), a method-based combinatorial auction is used to solve an AM-nesting problem in which printers bid on batches. S. Liu et al. (Citation2021) proposed a non-cooperative game model to reduce completion time and cost and to improve service quality. Their model takes into account detailed production attributes such as the moving speed of the nozzle, model dimension, printing resolution, printing material, and pricing. Their model solve two-sub games using a Genetic Algorithm (GA) to obtain the Nash-Equilibrium (NE). Yang, Chen, and Kumara (Citation2021) developed a bipartite matching framework for customers and manufacturers in SE operations. The authors applied the stable matching algorithm to optimise the matches between customers and suppliers.
Researchers conducted numerous studies of decentralised planning problems in CMfg. Y. Liu et al. (Citation2017) proposed a resource service sharing in CMfg based on the Gale-Shapley algorithm. Xiao et al. (Citation2019) introduced a multi-task cloud manufacturing model based on game theory from the customer's perspective. They modelled the agents' utility dependent on the reliability of the service, the total costs, and the completion time and weighed the factors accordingly. The authors optimised the problem by finding the NE with a biogeography-based optimisation algorithm. Gansterer and Hartl (Citation2020a) proposed a multi-level lot sizing problem. They present a 3-phase decentralised mechanism in which no critical information has to be shared. Gansterer, Födermayr, and Hartl (Citation2021) investigated the capacitated multi-level lot sizing problem. They developed a myopic upstream lot-shifting heuristic. Their algorithm fixes feasibility violations with repair operators. Huo et al. (Citation2022) introduced a CMfg collaboration approach in which resources can be jointly utilised across participating factories. Their model optimises the matching degree by balancing supply and demand between factories. The study represents the surplus and demands of resources as vertex vectors on a bipartite graph and solves them using a Kuhn-Munkras algorithm.
To create production plans in a decentralised manner, scholars have found auctions to be particularly useful (Parente et al. Citation2020). Dewan and Joshi (Citation2002) proposed an approach for the dynamic job shop scheduling problem such that time units of machines are being sold in an auction. In this model, jobs act as bidders, and the machines themselves as auctioneers. The problem was formulated as a Lagrangian Relaxation to decompose it. Their experiments revealed that their decentralised approach did not attain the same solution quality as a centralised approach. However, the auction-based method proved capable of solving larger problem sizes. Chang, Hsieh, and Chen (Citation2007) presented a reverse-auction-based mechanism for assigning jobs from owners to bidders. They formulated two integer-programming formulations. One is a deterministic version of a mean value-based bidder, while the other program is modelled stochastically to account the bidder's uncertainties and risks in the decision-making process. They achieved a near-optimal solution using a Lagrange relaxation-based scheduling method. Kang et al. (Citation2020) proposed two multi-unit double auction mechanisms to solve a service allocation problem in an industrial park where manufacturers can share private idle manufacturing capabilities and resources with others. Y. Liu et al. (Citation2022) investigated an iterative combinatorial auction mechanism for multi-agent parallel machine scheduling without violating information privacy. Their experiments demonstrated that their proposed decentralised mechanism delivers a high-quality solution with a small price of anarchy compared to a centralised planning approach.
Researchers also recognised the advantages of truthful auctions and proposed such approaches. Z. H. Liu, Wang, and Yang (Citation2019) introduced an iterative incentive-compatible double auction mechanism in which manufacturing resources are optimally allocated and scheduled to users. The algorithm takes into account multiple objectives, including cost, execution time, and logistics. Z. Liu and Wang (Citation2020) proposed a truthful and fair resource bidding mechanism in an incomplete, transparent information environment. They employed an iterative bidding mechanism approach until providers and demanders reached an agreement on the price.
Auctions are utilised to allocate resources, not only in manufacturing but also in transportation problems. Berger and Bierwirth (Citation2010) investigated a framework for exchanging transportation jobs that facilitates collaboration among logistics providers. The formulated objective is to maximise the total profit without reducing the individual surplus of the carriers. The authors proposed an auction-based five-step approach in which jobs are offered as bundles to bidders in order to reassign tasks. Subsequently, researchers have developed further enhancements for this model. For instance, Gansterer and Hartl (Citation2016) developed and evaluated various request evaluation strategies for carriers participating in auction-based collaborations. Furthermore, Gansterer and Hartl (Citation2018) introduced a method to create a set of attractive bundles and Gansterer, Hartl, and Sörensen (Citation2020) proposed efficient approximate bidding strategies.
Nevertheless, to the best of our knowledge, no study addresses the decentralised combined batching-scheduling problem within a collaborative environment.
3. Problem description
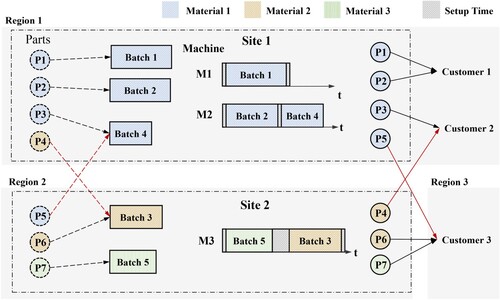
Figure depicts the AM batching and scheduling problem we aim to solve. In this problem, customers and sites are allocated to regions. The customers order parts directly from a manufacturer (site). The parts can be made of different materials and need to be combined in so-called batches that only contain parts of the same material. These batches have geometrical boundaries derived from the print bed of the AM machine. In our problem, we model parts as 2D rectangles, and they need to fit the size of the print bed. Thus, parts 1, 2, 3, and 4 do not fit in one batch but require three batches. The batches are scheduled on the machines of the designated site. A part can only be produced on a site if the material is available at the location. Batches also need setup time. If there is no material change between the batches, the setup time is relatively short. This can be seen between batch 2 and batch 4 on Machine 2. If the material changes (e.g. batch 5 to batch 3), the setup time is high because the printing material must be completely cleaned from the machine. When parts are produced, they are stored onsite until the shipping date, which is determined by the customer's due date of the part and the delivery time. The objective of the problem is to minimise the overall costs, consisting of four components: (i) production costs, which increase linearly with the production duration multiplied by site-specific cost factors, (ii) set-up costs, which are linear regarding the sum of the set-up time, (iii) transportation costs, which naturally differ between locations, and (iv) inventory costs occurring when parts are stored on site. The collaborative aspect of the problem is indicated with the red arrows in the figure. The dashed red arrow indicates a job forwarding from site 2 to site 1 and vice versa. By this, job forwarding costs can be significantly decreased because of (i) better batching opportunities, (ii) reduced setup time, and (iii) lower transport costs. In the given example, parts 4 and 6 are merged into one batch, which decreases the overall production duration of these two parts and, subsequently, the production costs. Part 5 is forwarded to site 1. Thus, this part does not cause a high setup time, as all other parts are made from the same material. Furthermore, region 3 may be in proximity to region 2. Hence, transportation costs could be saved. It is worth mentioning the potential for reducing inventory costs as well. However, given the substantial cost savings, this aspect becomes inconsequential in the discussion. The interested reader can find the mathematical formulation of the global problem, in the study presented by Zehetner and Gansterer (Citation2022a). In the following, we present the newly proposed auction framework, which is applicable when no fully informed decision maker exists.
Figure 1. AM batching and scheduling problem (adapted from the centralised problem presented in Zehetner and Gansterer Citation2022a). Red arrows indicate job forwarding between sites. Schedule of machines represents exchanged situation.
4. Auction framework
To solve the problem, we propose a decentralised framework based on a combinatorial auction. An effectively designed auction has four desired properties: it is (i) incentive compatible (IC), such that the agents' dominant strategy is to report information truthfully, (ii) individually rational (IR), meaning agents participate only if they do not get a higher utility without participation, (iii) budget balanced (BB), which means that the auction does not win or lose money, and (iv) efficient, which means it should maximise the total agents' value (Babaioff and Walsh Citation2005). It is impossible to fulfil all four requirements (Myerson and Satterthwaite Citation1983). However, our approach achieves IR, BB, and IC while maintaining high efficiency. We solve the problem by applying the framework visualised by the swimlane process chart in Figure .
Figure 2. Swimlane representation of bidding framework process.
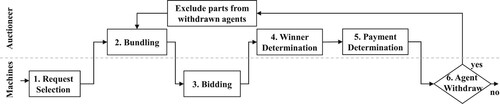
Request selection: The process starts with each site's locally optimised production plan. The machines (agents) select parts (jobs), which are then forwarded to a CMfg platform (auctioneer).
Bundling: The auctioneer creates promising bundles.
Bidding: Agents bid for the bundles by computing marginal costs for each of them.
Winner Determination: The auctioneer allocates the bundles to agents such that the overall costs are minimised.
Payment Determination: Costs are shared by the machines that submitted the parts, and payments are forwarded to the producers of the bundles.
Withdrawal option: After the payments and costs are determined, the auctioneer reports the results to the agents. If an agent is worse-off, it can withdraw its parts. In this case, the framework is repeated from step 2 to step 5 without the parts from the withdrawn agent.
The algorithm terminates if all remaining agents are satisfied with the outcome. Parts are then reallocated to the winning agents.
Figure illustrates the auction system used for the scenario depicted in Figure . This representation demonstrates the initial allocation of production parts, where P1 and P2 are assigned to Machine M1, P3 and P4 to M2, and M3 to P5, P6, and P7. The auction process unfolds in several steps:
Figure 3. Auction framework consisting of 5 steps. Diamonds represent machines, parts are depicted as circles, and bundles as rectangles. Parts can be part of different bundles (e.g. part P5 is included in bundles 3, 4, and 5). Black arrows represent bids, green and red arrows visualise payments.
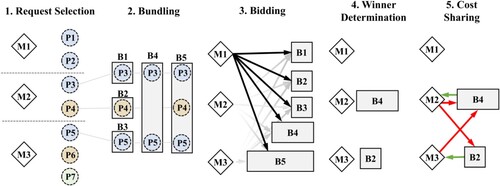
In step 1, the machines select suitable, costly parts, which are forwarded to the auctioneer. The figure represents, the situation where M1 does not submit any part, M2 forwards all its parts, and M3 submits P5. In the second step, the auctioneer forms five bundles, with parts potentially being part of multiple bundles (e.g. part P3 appears in bundles B1 and B5). In the next step, bidding, the bundles are offered to the machines again, and each agent reports its marginal costs for each bundle. It is important to highlight that even though M1 does not submit any bundle, it remains engaged in the process and reports its bids. In step 4, the auctioneer solves the combinatorial optimisation problem, such that allocating bundles to machines minimises overall production costs. In the last step, the payments are determined. The example in bundle B4 involves two parts–one initially requested by M2 and the other by M3. Although M2 receives compensation for producing both parts, fair cost-sharing between M2 and M3 is necessary. Throughout this process, no machine withdraws its parts as each has costs either lower or equal to those prior to the process. Thus, the algorithm is terminated at this point.
The next Sections 4.1 to 4.5 describe each of the five process steps in detail. For the framework we use the notation provided in Table .
Table 1. Notation of the framework.
4.1. Step 1: request selection
Each machine evaluates the parts in terms of production efficiency. If a machine decides that one or several parts are too costly, it can submit them to the auction. We use a threshold strategy for request selection, meaning that part p is selected if its margin is lower than a parameterised threshold margin ε. We determine the Shapley costs (Shapley Citation1953) and then calculate the margin using the revenue of the parts as given in (Equation5
(5)
(5) ). A commonly used definition of the Shapley value is based on marginal vectors. When adapted to our problem,
would contain all possible orderings of the full parts set
, allocated to machine i. Let
be one of these orderings. If part p is at position k, i.e.
, then its marginal costs are defined as
. The marginal value can also be written as
, where
is the set of parts preceding part p in order π. The Shapley costs of part p can then be defined as the average marginal contribution of all possible orderings
of machine i. This is given in (Equation1
(1)
(1) ).
(1)
(1)
(2)
(2)
(3)
(3)
(4)
(4)
(5)
(5) We estimate the marginal costs for each part by (Equation2
(2)
(2) ). This value considers three terms: setup, transport, and production costs. For the latter, we need to determine the production duration, which we do by (Equation3
(3)
(3) ).
represents the affected batches of the part set P, which is required to compute production duration and set-up time. This is expressed by (Equation4
(4)
(4) ). Finally, the marginal costs of part p can be calculated by (Equation5
(5)
(5) ) using the Shapley costs
and the price of part
. A part is selected to be submitted to the auction if
. We apply this set of equations for each machine i to calculate the marginal costs for each part. Computing all marginal costs is time-consuming due to the
-hardness of the Shapley value (Deng and Papadimitriou Citation1994).
We use the sampling technique by Castro, Gómez, and Tejada (Citation2009) to overcome this computational complexity. As it is a generic approach, it can be used to approximate the Shapley values for various problems. The method is based on a randomised subset of all possible orderings and determines the Shapley value by averaging the marginal values for the subset of orderings. van Campen et al. (Citation2018) enhanced this method by modifying the orderings such that each part p appears in each position of the sequences the same amount of times. The authors provide solid results showing the effectiveness of their method. However, their approach does not necessarily lead to solutions, which are BB. As this is an essential property of our framework, we enhance their approach to be BB. Within our novel method, we use a linear model to create orderings that place parts at the same positions the same number of times. However, our model ensures that each sequence only appears once. Hence, we can calculate the marginal values for each part of the ordering. The model for creating the sequences is explained in the following section.
4.1.1. Structured ordering problem
Our Binary Linear Programming (BLP) ordering approach generates a subset consisting of orderings
.
(6)
(6)
(7)
(7)
(8)
(8)
(9)
(9)
(10)
(10) Equation (Equation6
(6)
(6) ) ensures that each part p is allocated to one position u, while (Equation7
(7)
(7) ) establishes that each position u has a part p allocated, and (Equation8
(8)
(8) ) makes sure that each part appears at each position u, a total of n times over all sequences. In (Equation9
(9)
(9) ), we assess whether a part p in ordering o is at the same position u as in ordering
, while (Equation10
(10)
(10) ) ensures that each ordering only appears once. The BLP needs to be solved for each machine i. By solving the model, the ordering can now be encoded by
. We also want to point out that a constraint programming model could be a suitable tool for this problem. However, for the sake of consistency, we use the proposed BLP model. We provide a simple example of the approach in the following paragraph.
4.1.1.1 Example
Table shows an example with 3 players (cf. van Campen et al. Citation2018). We can adapt the principle of this 3-player game to a cost sharing problem with 3 parts. Row S represents all possible player combinations and row , the corresponding costs.
Table 2. An example of a 3-player game.
Table contains all possible orderings of the 3-player game and the corresponding marginal values. Also, the exact Shapley value is given in the last row, , for each player.
Table 3. Exact solution of the Shapley value for a 3-player game.
Table provides the process for approximating the Shapley value with the newly proposed approach. Column Ordering represents the orderings for a group size n = 1. Each part must be at each position exactly once. Thus, we need to create three orderings.
Table 4. The marginal contributions of randomly selected orderings with the proposed structured sequence approach of the 3-player game of Table .
These orderings are created using the BLP model (Equation6(6)
(6) )–(Equation10
(10)
(10) ). Columns
,
, and
represent the marginal values for the orderings and the players. Row
provides the average values of the column. When comparing the sum of the marginal values of this solution to the outcome of the grand coalition
, it becomes visible that the two are equal. Hence, it is BB.
4.2. Step 2: bundling
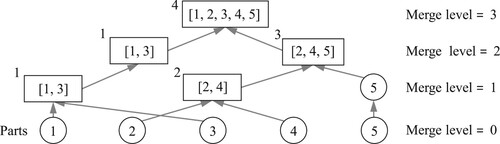
This process step aims to build attractive bundles for the bidders. To do so, one option would be to create all possible part combinations. This approach would increase the number of bundles factorial to the number of parts. Such a method would create considerable computational complexity in the subsequent three steps of this framework. Hence, literature suggests to reduce the number of bundles to a subset of attractive ones (Horner, Pazour, and Mitchell Citation2021; Mancini and Gansterer Citation2021). Gansterer and Hartl (Citation2018) proposed an approach with so-called candidate solutions. A candidate solution is a set of non-overlapping bundles which includes all requests. The authors prove that such an approach reduces complexity while reaching good solution quality. We create candidate solutions by merging two bundles on each level. We start with single parts as a bundle and then evaluate the fitness of each pair. As the auctioneer (i.e. the CMfg platform) does not have complete information about the agents, we can only estimate the attractiveness of the bundles. We do this by using the part information communicated by the agents. A MILP problem minimises the overall fitness of the next level.
(11)
(11)
(12)
(12)
(13)
(13)
(14)
(14)
(15)
(15)
(16)
(16)
(17)
(17) Equation (Equation11
(11)
(11) ) is the objective function, with the aim of minimising the overall fitness of the parts to be merged. The fitness of bundle combinations is defined by (Equation12
(12)
(12) ), where each component of the fitness function refers to one cost component described in Section 3. We introduce parameters α, β, γ, and δ to weigh the components and adjust them to the actual costs. The variable
indicates which bundles are merged together. Equations (Equation13
(13)
(13) )–(Equation15
(15)
(15) ) ensure that only one merge per bundle is possible. As
is symmetric, we only need to consider one side of it. This is done by (Equation16
(16)
(16) ). Equation (Equation17
(17)
(17) ) limits the number of merge operations to half the number of bundles with
, with θ being the number of bundles of the previous merge level. If there is an odd number of bundles, the single residual bundle is conveyed to the next level. This process is repeated until merge level ξ is attained, as illustrated in Figure .
Figure 4. Example of the bundling phase, where 4 non-overlapping bundles are created with 5 parts. Arrows indicate a merge process. On each level, 2 bundles of the previous level are combined into one.
4.3. Step 3: bidding
In our framework, agents can subcontract other agents to fulfil their production requests. We assume that the end customer pays the initial owner, which then pays the subcontracted manufacturer. This means that the subcontractor offers a takeover price to fulfil the task. According to Berger and Bierwirth (Citation2010), this setting can be organised as a reverse auction. For such an auction, the machines must evaluate the marginal costs for each bundle. To determine the marginal costs for each bundle b, machine i has to solve a new production planning problem, which includes the additional part set of the bundle. The machines determine the costs using a single machine batch-scheduling AM model, which is formulated as follows. The marginal costs of the bundle to bid on is equal to the difference of the objective value and the objective value of the initial production plan.
(18)
(18)
(19)
(19)
(20)
(20)
(21)
(21)
(22)
(22)
(23)
(23)
(24)
(24)
(25)
(25)
(26)
(26)
(27)
(27)
(28)
(28)
(29)
(29)
(30)
(30)
(31)
(31)
(32)
(32)
(33)
(33)
(34)
(34)
(35)
(35)
(36)
(36)
(37)
(37)
(38)
(38)
(39)
(39)
(40)
(40) The objective function (Equation18
(18)
(18) ) minimises the costs. Equation (Equation19
(19)
(19) ) ensures that each part is allocated to only one batch. Equations (Equation20
(20)
(20) ) and (Equation21
(21)
(21) ) guarantee that the part is positioned within the geometric boundaries of the print chamber, while (Equation22
(22)
(22) )–(Equation26
(26)
(26) ) avoid collisions with other parts. The model uses pre-configured batches, meaning that a batch j has a pre-allocated material m. Hence,
is determined ex-ante and is therefore an input parameter. This formulation guarantees the linear form of the model. Constraint (Equation27
(27)
(27) ) ensures that parts are allocated to batches j that require the same material. The height of batch j is equal to the maximum height of part p within the batch. This is computed by Equation (Equation28
(28)
(28) ), while (Equation29
(29)
(29) ) determines the production duration of batch j. Auxiliary variable
is needed to determine the inventory costs. It represents the finishing date of part p and is computed by (Equation30
(30)
(30) ). Equation (Equation31
(31)
(31) ) computes the latest possible pickup date of batch j, and Equation (Equation32
(32)
(32) ) ensures that items are allocated only to batches which are scheduled on machine i. We allow only one successor per batch j. This is formulated by (Equation33
(33)
(33) ). Constraints (Equation34
(34)
(34) ) ensure that batch j cannot be its own successor, while (Equation35
(35)
(35) ) guarantees that each allocated batch has a successor (excluding the last one in the production sequence). Equation (Equation36
(36)
(36) ) creates the last batch of the production sequence. We do not allow circular production sequences, which is guaranteed by Equation (Equation37
(37)
(37) ). If a batch j is not produced on a machine, constraints (Equation38
(38)
(38) ) set its production start time
to 0. The production start date of batch j needs to be before the latest possible start date of the batch, which is determined by
. This is done by (Equation39
(39)
(39) ). The production start of
must be scheduled before the end date of the previous batch j, which is ensured by Equation (Equation40
(40)
(40) ).
4.4. Step 4: winner determination
One of the challenges of combinatorial auctions is the computational complexity. We can overcome this issue by solving the model algorithmically or by limiting biddable combinations (Pekeč and Rothkopf Citation2003). Our approach is to restrict combinations to attractive ones by bundling them (see Section 4.2). This allows us to solve the winner determination problem with the following linear model.
(41)
(41)
(42)
(42)
(43)
(43)
(44)
(44) Equation (Equation41
(41)
(41) ) is the objective function that aims to minimise the overall costs. It consists of the winner determination matrix
, which indicates the winning bidders and the bidding matrix
. The latter consists of the reported marginal costs of step 3. Constraint (Equation42
(42)
(42) ) ensures that a maximum of one bundle b is allocated to a machine i. Also, the model only allows each bundle to be allocated to one machine i, which is guaranteed by (Equation43
(43)
(43) ). With this restriction, we overcome the problem of reporting costs of bundle combinations. Thus, machines only need to determine the marginal costs of one bundle but combinations of bundles, which decreases the computational complexity of the bidding phase (see Section 4.3). Equation (Equation44
(44)
(44) ) guarantees that each part is allocated to a machine i only once, while
is the bundle-part configuration, which is determined in step 2.
4.5. Step 5: payment determination
An IC pricing mechanism that requires reporting of true costs is the Vickrey-Clarke-Groves (VCG) mechanism. The VCG auction is based on the concept of second-price auctions (Krishna Citation2010). A suitable way to solve the VCG auction is to run the WDP once for the whole set of bidders and once for each bidder removed (Cramton, Shoham, and Steinberg Citation2006). The actual payments for each machine i are determined by (Equation45(45)
(45) ). In this equation, we use the reported costs
of the agent and deduct the difference between the objective value, including i (
) and the objective value without this agent (
). We calculate
by excluding bidder i from the WDP formulated in (Equation41
(41)
(41) )–(Equation44
(44)
(44) ).
(45)
(45) The initial owners of the parts must share the costs of the bundles. According to Guajardo and Rönnqvist (Citation2016), the Shapley value can be suitably used for cost-sharing methods. By applying such a method, we also can ensure that the auction mechanism is BB, which is given by the definition of the Shapley value (Shapley Citation1953). Our approach does not need to reveal critical information from the buyers or the sellers but is based on an indicator which uses data from part attributes. The indicator
is computed using Equation (Equation46
(46)
(46) ) and the Shapley value defined in (Equation1
(1)
(1) ). To approximate the Shapley value, we use the same approximation method as presented in Section 4.1. The Shapley value then determines the costs
for each part p of bundle b with (Equation47
(47)
(47) ). As we can directly allocate transport costs
to each part, we deduct this cost component from the Shapley value calculation and add it separately to the equation.
(46)
(46)
(47)
(47)
5. Computational study
In this section we investigate distinct studies: a performance study and an experimental study. The performance study evaluates the efficiency of the proposed framework, focussing on its solution time and quality. The latter is quantified in terms of costs. In contrast, the experimental study examines the impact of employing a decentralised framework as opposed to a traditional centralised planning approach. Specifically, our interest lies in understanding the potential cost savings across varying levels of collaboration. Additionally, we analyse the framework's overall efficacy and its performance on an individual level.
5.1. Performance study
We apply the proposed framework (AUCT) and compare the results to the centralised algorithms, which were both proposed by Zehetner and Gansterer (Citation2022a). The first algorithm solves the problem exactly by a quadratic model proposed (CENT-QUAD) with a time-limit parameterised as 36,000 seconds. The second solver is a hybrid GA-MILP algorithm (CENT-GA). This approach cannot guarantee optimum solutions. Still, the study shows that it delivers good results for the collaborative-batching problem. The GA is parameterised such that the ratio of the fitness factors approximately matches the ratio of the corresponding cost components. All experiments are conducted on an Intel Core i5-8365U CPU @1.60 GHz with 16.0 GB RAM on Windows 10. In the performance study, our aim is to evaluate the efficacy of the framework and to assess the solution quality, determined by the costs, as well as the computational time. The framework was coded in Python and utilises Gurobi v9.1 (Gurobi Optimization, L. Citation2022) to solve the MILP models. For the MILP bidding models in step 3 of the process, we reduce the time limit to 180 seconds and use the best solution obtained. We used ,
,
, and
as values for the fitness parameters of Section 4.2.
5.2. Instances
For the performance study, we investigate 30 instances with an increasing number of parts and sites. The number of parts and sites are illustrated in columns Sites and Parts in Table . Regarding the cost factors of the sites, we use ,
,
, and
. The parameters of the machines are set to
;
. The geometry of the parts follow the distribution
;
;
. Part prices are determined as
, where for the costs it is assumed that the parts are produced in a single batch. The transports costs are approximated by
, using
and
.
Table 5. Determined costs for each instances for each algorithm.
5.3. Results
In Table , we detail the associated costs of each algorithm of each instance. Bold values highlight the best solution for their respective instance. Notably, in instances characterised by a comparatively small number of parts, specifically those with fewer than 10 parts, all algorithms exhibit performance levels nearly reaching optimality. CENT-QUAD corresponds to the solution of the commercial solver, which solves the quadratic model. It has a parameterised solution gap of , thus it is expected to produce near-optimal solutions. Due to numerical reasons, we observe that the CENT-GA performs slightly better in several cases. CENT-QUAD manages to successfully solve only the initial 11 instances, as it surpassed the time limit constraint of 10 hours in subsequent cases. For all remaining instances, except for instance 14, CENT-GA consistently delivers superior results compared to AUCT. In Figure (a), we illustrate the disparity between the solutions of the algorithms and the top-performing algorithm for each instance. It demonstrates that the maximum deviation of AUCT from GAP is
at instance 22. For all subsequent larger instances, the disparity remains below
. Hence, we can conclude that despite AUCT being a decentralised solution method, it consistently delivers solution quality comparable to that of centralised methods.
Figure 5. Performance of algorithms is compared of each instance with instance size increases with horizontal-axis. Circles represent solutions solved with quadratic model. Diamonds represent the centralised GA algorithm, while squares denote the decentralised auction-based framework. (a) illustrates the relative costs determined by each solver in comparison to the best solution of each instances. (b) depicts the absolute computational time in seconds for each solver and instance.). .
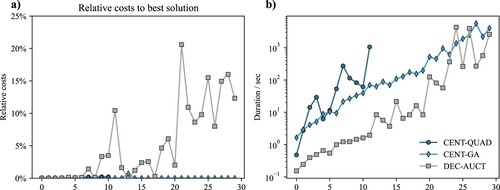
Table lists key figures regarding the solution durations for each instance and algorithm. Columns S1 to S5 denote the time spans for each individual step within the framework. Bold values show the shortest solustion duration. From this, we can observe that AUCT outperforms the other two algorithms in all instances except for instance 25 and 27, where the GA requires less time. In Figure (b), we depict the solving durations of the algorithms. To enhance the ease of comparison across instances, the vertical axis is represented on a loc-scale. It's evident that, at smaller instances, there's a significant gap between AUCT and the other algorithms. Notably, the disparity narrows between GA and QUAD in larger instances. However, on the whole, AUCT generally outpaces GA, even in these larger scenarios.
Table 6. Solution time in seconds for all algorithms.
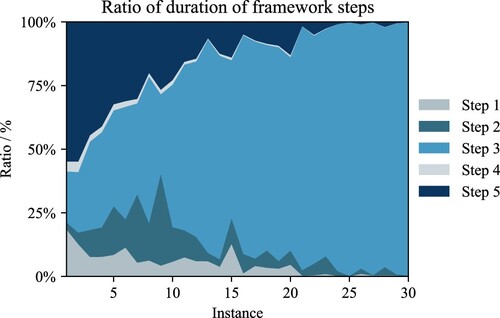
In Figure , we display a stacked line plot illustrating the ratios of each step's duration for every instance. It is evident that, for very small instances, step 5 significantly dominates the overall duration. For instance 1, step 5 accounts for a large share, representing of the total duration. As the instance size increases, step 3 (bidding) emerges as the primary contributor to computational time, with the remaining steps contributing minimally, as the duration of step 3 encompasses
of the overall duration. This observation emphasises the necessity for further optimisation of step 3 to enhance algorithmic efficiency.
Figure 6. Ratio of duration of each framework step for each instance of the computational study.
5.4. Experimental study
In our experimental study, we investigate the cost savings of the proposed framework within a CMfg environment with different levels of collaboration. In contrast to the performance study, we are not only interested in the total savings, but also in the behaviour of the several cost components as well as the trends of the various cost components of the objective of our model.
Furthermore, we compare the costs to benchmark solutions created by a central authority to discuss the limitations of the decentralised approach. Additionally, our investigation delves into the bidding behaviour exhibited by agents and compares it to their individual cost savings. The central authority solution (CENT) is created by the hybrid GA-MILP algorithm used in Section 5.1. Our study starts with an optimal production plan per site. We obtain the optimum production plan, with an MILP model of the single-site problem. This is done to optimality by a general purpose solver. The parameters of the algorithm, are the same as in the previous section.
5.4.1. Instances
We conduct six scenarios with 50 instances each, wherein each site owns three machines. In the design of these scenarios, scenario 1 permits no collaboration due to the presence of only a single site. As the scenario number increases, the aim is to explore scenarios that facilitate enhanced levels of collaboration. This expansion implies that an increasing number of sites, and consequently machines, can exchange their parts, thus offering greater prospects for cost savings. The primary characteristics of these instances are detailed in Table . Given that we are examining a CMfg setting, both suppliers and customers are dispersed geographically. Each machine retains identical cost factors as we aim to evaluate cost savings due to collaboration rather than outsourcing to more efficient machines. We use the same uniform distributions and cost factor as in the performance study of Section 5.1. All instances are publicly available in Zehetner and Gansterer (Citation2022b).
Table 7. Key figures of instances.
5.4.2. Results
Table lists the mean costs and their corresponding ratio for each mode and cost component. INI refers to the cost of the initial production plan, CENT to the costs incurred through collaboration applied by to the centralised GA-based algorithm, and AUCT represents the results from the decentralised auction-framework. We can observe that the predominant cost driver is the production cost (PROD) with a minimum ratio of at scenario 1 and a slight increase for large instance sizes. The table further unveils that transport costs (TRANS) emerge as the second primary cost driver, succeeded by set-up costs (SET) and inventory costs (INV). Figure (a) illustrates the computed efficiency gain of both AUCT and CENT. It reveals that relative cost savings amplify with increasing levels of collaboration. When observing the median values for AUCT and CENT, it becomes apparent that CENT consistently outperforms AUCT across scenarios. Nonetheless, a trend emerges indicating the narrowing of this performance gap from smaller to larger instances. Moreover, the variability in efficiency gain, as represented by the length of the boxes of the plots, is evident for both CENT and AUCT as instance size grows.
Figure 7. Relative efficiency gains, where the costs of the initial machine allocation are used as a reference. AUCT represents the efficiency gains of the auction-based framework. CENT represents the efficiency gain of the centralised benchmark solver. (a): Box plot of overall efficiency gains (sample size n = 50, whiskers factor ); (b): Box plot of efficiency gains for each cost component of all instances (sample size n = 300, whiskers factor
).
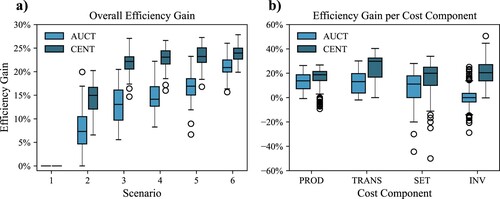
Table 8. Mean costs and ratio for each algorithm and for each cost component.
Figure (b) depicts the efficiency gains for all scenarios for each cost component. Results reveal that cost savings occur particularly for PROD and TRANS, while SET costs occasionally increase for both AUCT and CENT. The centralised approach consistently manages to reduce INV at each instance. In contrast, the inventory costs of AUCT show a high variability. However, this hardly affects the quality of the solutions given the minimum contribution of INV to the total costs (average ratios of the cost components of the initial solution are PROD: , TRANS:
, SET:
, and INV:
).
Table lists the numerical key metrics of the efficiency gains. The mean efficiency gains for AUCT across scenarios span from to
(with scenario 1 excluded), where those for CENT fluctuate between
to
. The maximum efficiency gain is noted in scenario 6 reaching
for AUCT and
for CENT. The column titled Gap highlights the disparity between the mean efficiency gains of AUCT and CENT. These figures also indicate a remarkable gap in instances with minimal collaboration which narrows considerably as collaborative opportunities expand (Scenario 2:
, Scenario 6:
). Column ‘Std’ reflects the standard deviation of the efficiency gain for each scenario. Also here, we can observe that the range of the effiency gain decreases at higher collaboration levels for both approaches, indicating more consistent gains. This consistency might enhance the acceptance of stakeholders for collaborative settings, given the predictability in performance.
Table 9. Key figures of efficiency gains of auction-based (AUCT) and centralised algorithm (CENT) in percentage values.
Given that the results do not adhere to a normal distribution, we employ the one-sided Mann-Whitney U test (Mann and Whitney Citation1947) to evaluate the statistical significance of the efficiency gain. We can observe with column ‘Gap’, not surprisingly, CENT outperforms AUCT in each scenario. Furthermore, we can observe that the corresponding p-value tends to increase with collaboration levels.
This trend suggests that the difference in efficiency gains becomes less statistically significant in high collaboration scenearios. Nevertheless, we have to emphasise that no cost-sharing method is implemented in CENT, and IR cannot be guaranteed within this approach.
Rows in COMP represent the efficiency gains of all scenarios, segmented by individual cost components. Results support findings shown in Figure . Examining the ‘Mean’ columns, it is clear that the benchmark algorithm consistently surpasses the auction-based framework across all cost components. By analysing the ‘Std’ columns, we observe that AUCT tends to produce more stable solutions in comparison to CENT. The ‘Gap’ column reveals that the disparity between the two approaches is at its narrowest for production costs, which is the most significant cost driver.
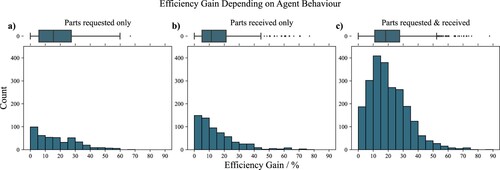
Figure displays the efficiency gains of individual machines, represented by histograms and box plots. Results are segmented into three categories. The first category, Parts requested only represents machines that submitted parts but did not win a bid. The median efficiency gain within this group is . The second category, Parts received only includes agents which won a bundle but did not submit any parts to the auctioneer. The median efficiency gain in this group is
. The final category, (Parts requested & received) covers all machines which submitted at least one part and won at least one part, reaching a median of
. We apply a Mann-Whitney U test (Mann and Whitney Citation1947), to evaluate statistical significance between these groups. In a two-sided test between groups 1 and 2, we could not find a statistically significant difference (p = 0.75). Thus, we conclude that neither supply nor demand would be over-incentivised in the proposed framework. Hence, this should lead to balanced participation levels on both sides. We also conducted a one-sided test between groups 1 and 3 as well as groups 2 and 3, respectively. For both instances, we observe statistical significance (p<0.001) that group 3 has a higher efficiency gain than the other two. This finding suggest that agents should actively participate on both sides to achieve the highest cost savings.
Figure 8. Distribution of efficiency gain clustered by agent behaviour. The data is clustered in three groups: (a) Parts requested only (n = 479) -- machines which submitted parts, but did not win a bid. (b) Parts received only (n = 628) -- agents which won bids, but did not submit parts to the auctioneer. (c) Parts requested & received (n = 2300) -- machines which submitted and received parts from the CMfg platform. Whiskers factor for box plots .
6. Conclusion and future research
We introduced a collaborative, decentralised mechanism for a multi-site AM production planning probem. This approach is based on a reverse combinatorial auction in which agents report their marginal costs, which are to be minimised. We introduced a new method for Shapley-value approximation as well as a new bundle generation method that allows us to create candidate solutions, thus reducing complexity in the subsequent processing steps. A computational study in which we investigated the framework's cost efficiency and computational performance was provided. We also benchmarked the newly proposed method against results generated by a central, fully informed authority.
6.1. Framework performance
The performance study unveiled that the auction-based framework achieves substantial efficiency gains, although agents are not required to disclose sensitive information. The findings also demonstrated that the decentralised framework maintains its efficiency even when applied to large instances. It is worth noting, however, that further scaling up of the problem leads to considerably extended computational times, primarily due to the computational effort associated with step 3 of the framework.
6.2. Managerial implications
Our study shows, that, although a decentralised planning method is utilised for the given problem, significant costs savings can be reached. In the most challenging scenario, we achieved an average cost savings of , which indicates that we were able to reach
of the benchmark solution. Our study further demonstrated that increased active participation increases efficiency for every individual agent. Thus, we prove that our framework is IR, meaning that no agent needs to cover the costs of other agents. In essence, agents who were involved on both the supplier and forwarder fronts reached the most significant efficiency gains. We can conclude that the higher the participation, the higher the efficiency. This result should encourage industry leaders to enforce such mechanisms and avoid free-riding behaviour in this framework.
6.3. Future research
Further research could evaluate alternative approaches for each process step. For the first step, different approximations of marginal costs might be worth investigating. Also, the bundle selection process might be improved by eliminating certain bundles in order to speed up the process. However, at the moment, the third step requires the most computational time. Hence, instead of solving a production planning problem for each bundle, alternative -- probably heuristic -- approaches for determining the marginal costs can be developed.
Acknowledgments
This work is based on a conference paper (Zehetner and Gansterer Citation2022c).
Disclosure statement
No potential conflict of interest was reported by the author(s).
Correction Statement
This article has been corrected with minor changes. These changes do not impact the academic content of the article.
Additional information
Funding
Notes on contributors

Dominik Zehetner
Dominik Zehetner completed his MSc in Mechanical Engineering and Business Economics at Graz University of Technology in 2016. He is presently engaged as a consultant in supply chain management for the retail sector. Concurrently, he is a PhD candidate at the University of Klagenfurt, participating in the Doctoral Programme in Modelling and Simulation. His research interests are in the areas of Linear Programming, Production Planning, and Collaborative Manufacturing.

Margaretha Gansterer
Margaretha Gansterer is Full Professor of Business Administration with a focus on Logistics and Operations Management at the University of Klagenfurt. Since October 2019, she is Head of the Department of Operations, Energy, and Environmental Management and since January 2022 Dean of the Faculty of Management and Economics. She has published about 50 peer-reviewed scientific publications in the field of Operations Management. Her research interests lie in efficient solution approaches for complex decision problems as well as in mechanisms for decentrally planned collaborations in production and logistics.
References
- Adamson, G., L. Wang, M. Holm, and P. Moore. 2017. “Cloud Manufacturing–a Critical Review of Recent Development and Future Trends.” International Journal of Computer Integrated Manufacturing 30 (4–5): 347–380.
- Alicke, K., D. Rexhausen, and A. Seyfert. 2016. “Supply Chain 4.0 in Consumer Goods.” McKinsey & Company (Exhibit 1), 1–11. https://www.mckinsey.com/industries/consumer-packaged-goods/our-insights/supply-chain-4-0-in-consumer-goods.
- Babaioff, M., and W. E. Walsh. 2005. “Incentive-Compatible, Budget-Balanced, Yet Highly Efficient Auctions for Supply Chain Formation.” Decision Support Systems 39 (1): 123–149. https://doi.org/10.1016/j.dss.2004.08.008.
- Baumers, M., P. Dickens, C. Tuck, and R. Hague. 2016. “The Cost of Additive Manufacturing: Machine Productivity, Economies of Scale and Technology-Push.” Technological Forecasting and Social Change 102:193–201. https://doi.org/10.1016/j.techfore.2015.02.015.
- Berger, S., and C. Bierwirth. 2010. “Solutions to the Request Reassignment Problem in Collaborative Carrier Networks.” Transportation Research Part E: Logistics and Transportation Review 46 (5): 627–638. https://doi.org/10.1016/j.tre.2009.12.006.
- Berman, B. 2012. “3-D Printing: The New Industrial Revolution.” Business Horizons 55 (2): 155–162. https://doi.org/10.1016/j.bushor.2011.11.003.
- Castro, J., D. Gómez, and J. Tejada. 2009. “Polynomial Calculation of the Shapley Value Based on Sampling.” Computers and Operations Research 36 (5): 1726–1730. https://doi.org/10.1016/j.cor.2008.04.004.
- Chang, S. C., M. M. Hsieh, and C. W. Chen. 2007. “Reverse Auction-Based Job Assignment Among Foundry Fabs.” International Journal of Production Research 45 (3): 653–673. https://doi.org/10.1080/00207540600792176.
- Chaudhuri, A., P. P. Datta, K. J. Fernandes, and Y. Xiong. 2021. “Optimal Pricing Strategies for Manufacturing-as-a Service Platforms to Ensure Business Sustainability.” International Journal of Production Economics 234 (November 2020): 108065. https://doi.org/10.1016/j.ijpe.2021.108065.
- Cramton, P., Y. Shoham, and R. Steinberg. 2006. Combinatorial Auctions. Boston: MIT Press.
- Crommentuijn-Marsh, P., C. Eckert, and S. Potter. 2010. “Consumer Behaviour Towards Sustainability Within Fashion.” In: KEER2010: Iinternational Conference on Kansei Engineering and Emotion Research 2010, 2-4. Paris, France.
- de Antón, J., J. Senovilla, J. M. González, F. Acebes, and J. Pajares. 2020. “Production Planning in 3D Printing Factories.” International Journal of Production Management and Engineering 8 (2): 75–86. https://doi.org/10.4995/ijpme.2020.12944.
- Deng, X., and C. H. Papadimitriou. 1994. “On the Complexity of Cooperative Solution Concepts.” Mathematics of Operations Research 19 (2): 257–266. https://doi.org/10.1287/moor.19.2.257.
- Dewan, P., and S. Joshi. 2002. “Auction-Based Distributed Scheduling in a Dynamic Job Shop Environment.” International Journal of Production Research 40 (5): 1173–1191. https://doi.org/10.1080/00207540110098445.
- Gansterer, M., P. Födermayr, and R. F. Hartl. 2021. “The Capacitated Multi-Level Lot-Sizing Problem with Distributed Agents.” International Journal of Production Economics 235 (March): 1–11. https://doi.org/10.1016/j.ijpe.2021.108090.
- Gansterer, M., and R. F. Hartl. 2016. “Request Evaluation Strategies for Carriers in Auction-Based Collaborations.” OR Spectrum 38 (1): 3–23. https://doi.org/10.1007/s00291-015-0411-1.
- Gansterer, M., and R. F. Hartl. 2018. “Centralized Bundle Generation in Auction-Based Collaborative Transportation.” OR Spectrum 40 (3): 613–635. https://doi.org/10.1007/s00291-018-0516-4.
- Gansterer, M., and R. F. Hartl. 2020a. “Shared Resources in Collaborative Vehicle Routing.” Top 28 (1): 1–20. https://doi.org/10.1007/s11750-020-00541-6.
- Gansterer, M., and R. F. Hartl. 2020b. “The Collaborative Multi-Level Lot-Sizing Problem with Cost Synergies.” International Journal of Production Research 58 (2): 332–349. https://doi.org/10.1080/00207543.2019.1584415.
- Gansterer, M., R. F. Hartl, and K. Sörensen. 2020. “Pushing Frontiers in Auction-Based Transport Collaborations.” Omega 94:102042. https://doi.org/10.1016/j.omega.2019.01.011.
- Grondys, K. 2019. “Implementation of the Sharing Economy in the B2B Sector.” Sustainability (Switzerland) 11 (14): 1–16. https://doi.org/10.3390/su11143976.
- Guajardo, M., and M. Rönnqvist. 2016. “A Review on Cost Allocation Methods in Collaborative Transportation.” International Transactions in Operational Research 23 (3): 371–392. https://doi.org/10.1111/itor.2016.23.issue-3.
- Gurobi Optimization, L.. 2022. “Gurobi Optimizer Reference Manual.” https://www.gurobi.com.
- Haghnegahdar, L., S. S. Joshi, and N. B. Dahotre. 2022. “From IoT-based Cloud Manufacturing Approach to Intelligent Additive Manufacturing: Industrial Internet of Things–an Overview.” International Journal of Advanced Manufacturing Technology 119 (3–4): 1461–1478. https://doi.org/10.1007/s00170-021-08436-x.
- Halty, A., R. Sánchez, V. Vázquez, V. Viana, P. Piñeyro, and D. A. Rossit. 2020. “Scheduling in Cloud Manufacturing Systems: Recent Systematic Literature Review.” Mathematical Biosciences and Engineering 17 (6): 7378–7397. https://doi.org/10.3934/mbe.2020377.
- Haseltalab, V., and U. Yaman. 2019. A Cloud Manufacturing Application for Additive Manufacturing Methods A Cloud Manufacturing Application for Additive Manufacturing Methods..” In Proceedings - 2019 IEEE International Conference on Mechatronics, ICM 2019, 287–292. Ilmenau. https://doi.org/10.1109/ICMECH.2019.8722949.
- He, W., and L. Xu. 2015. “A State-of-the-Art Survey of Cloud Manufacturing.” International Journal of Computer Integrated Manufacturing 28 (3): 239–250. https://doi.org/10.1080/0951192X.2013.874595.
- Horner, H., J. Pazour, and J. E. Mitchell. 2021. “Optimizing Driver Menus Under Stochastic Selection Behavior for Ridesharing and Crowdsourced Delivery.” Transportation Research Part E: Logistics and Transportation Review 153 (July): 102419. https://doi.org/10.1016/j.tre.2021.102419.
- Hu, S. J. 2013. “Evolving Paradigms of Manufacturing: From Mass Production to Mass Customization and Personalization.” Procedia CIRP 7:3–8. https://doi.org/10.1016/j.procir.2013.05.002.
- Huo, Y., J. Xiong, Z. Guo, X. Wenjun, and L. Lei. 2022. “A Collaboration Approach for Cloud Factories Based on Kuhn–Munkras Algorithm.” International Journal of Computer Integrated Manufacturing 1–17. https://doi.org/10.1080/0951192X.2022.2027021.
- Jiang, R., R. Kleer, and F. T. Piller. 2017. “Predicting the Future of Additive Manufacturing: A Delphi Study on Economic and Societal Implications of 3D Printing for 2030.” Technological Forecasting and Social Change 117:84–97. https://doi.org/10.1016/j.techfore.2017.01.006.
- Kang, K., S. X. Xu, R. Y. Zhong, B. Q. Tan, and G. Q. Huang. 2020. “Double Auction-Based Manufacturing Cloud Service Allocation in An Industrial Park.” IEEE Transactions on Automation Science and Engineering 19 (1): 295–307.
- Khorram Niaki, M., and F. Nonino. 2017. “Additive Manufacturing Management: A Review and Future Research Agenda.” International Journal of Production Research 55 (5): 1419–1439. https://doi.org/10.1080/00207543.2016.1229064.
- Krishna, V. 2010. Auction Theory. 2nd ed. Burlington, MA: Academic Press.
- Kunovjanek, M., and G. Reiner. 2020. “How Will the Diffusion of Additive Manufacturing Impact the Raw Material Supply Chain Process?.” International Journal of Production Research 58 (5): 1540–1554. https://doi.org/10.1080/00207543.2019.1661537.
- Li, Q., D. Zhang, S. Wang, and I. Kucukkoc. 2019. “A Dynamic Order Acceptance and Scheduling Approach for Additive Manufacturing On-Demand Production.” International Journal of Advanced Manufacturing Technology 105 (9): 3711–3729. https://doi.org/10.1007/s00170-019-03796-x.
- Liu, Y., S. Sun, X. V. Wang, and L. Wang. 2022. “An Iterative Combinatorial Auction Mechanism for Multi-Agent Parallel Machine Scheduling.” International Journal of Production Research 60 (1): 361–380. https://doi.org/10.1080/00207543.2021.1950938.
- Liu, Z., and Z. Wang. 2020. “A Novel Truthful and Fair Resource Bidding Mechanism for Cloud Manufacturing.” IEEE Access 8:28888–28901. https://doi.org/10.1109/Access.6287639.
- Liu, Y., L. Wang, X. V. Wang, X. Xu, and L. Zhang. 2019. “Scheduling in Cloud Manufacturing: State-of-the-Art and Research Challenges.” International Journal of Production Research 57 (15–16): 4854–4879. https://doi.org/10.1080/00207543.2018.1449978.
- Liu, Z. H., Z. J. Wang, and C. Yang. 2019. “Multi-Objective Resource Optimization Scheduling Based on Iterative Double Auction in Cloud Manufacturing.” Advances in Manufacturing 7 (4): 374–388. https://doi.org/10.1007/s40436-019-00281-2.
- Liu, Y., L. Zhang, F. Tao, and L. Wang. 2017. “Resource Service Sharing in Cloud Manufacturing Based on the Gale–Shapley Algorithm: Advantages and Challenge.” International Journal of Computer Integrated Manufacturing 30 (4–5): 420–432.
- Liu, S., L. Zhang, W. Zhang, and W. Shen. 2021. “Game Theory Based Multi-Task Scheduling of Decentralized 3D Printing Services in Cloud Manufacturing.” Neurocomputing 446:74–85. https://doi.org/10.1016/j.neucom.2021.03.029.
- Mancini, S., and M. Gansterer. 2021. “Bundle Generation for Last-Mile Delivery with Occasional Drivers.” Omega 108:102582. https://doi.org/10.1016/j.omega.2021.102582.
- Mann, H. B., and D. R. Whitney. 1947. “On a Test of Whether One of Two Random Variables is Stochastically Larger Than the Other.” The Annals of Mathematical Statistics 18 (1): 50–60. https://doi.org/10.1214/aoms/1177730491.
- Myerson, R. B., and M. A. Satterthwaite. 1983. “Efficient Mechanisms for Bilateral Trading.” Journal of Economic Theory 29 (2): 265–281. https://doi.org/10.1016/0022-0531(83)90048-0.
- Pahwa, D., B. Starly, and P. Cohen. 2018. “Reverse Auction Mechanism Design for the Acquisition of Prototyping Services in a Manufacturing-as-a-Service Marketplace.” Journal of Manufacturing Systems 48 (May): 134–143. https://doi.org/10.1016/j.jmsy.2018.05.005.
- Parente, M., G. Figueira, P. Amorim, and A. Marques. 2020. “Production Scheduling in the Context of Industry 4.0: Review and Trends.” International Journal of Production Research 58 (17): 5401–5431. https://doi.org/10.1080/00207543.2020.1718794.
- Pekeč, A., and M. H. Rothkopf. 2003. “Combinatorial Auction Design.” Management Science 49 (11): 1485–1503. https://doi.org/10.1287/mnsc.49.11.1485.20585.
- Probst, L., L. Frideres, and B. Pedersen. 2015. Collaborative Production and the Maker Economy.” Business Innovation Observatory 13. https://doi.org/10.3030/821479.
- Ren, L., L. Zhang, F. Tao, C. Zhao, X. Chai, and X. Zhao. 2015. “Cloud Manufacturing: From Concept to Practice.” Enterprise Information Systems 9 (2): 186–209. https://doi.org/10.1080/17517575.2013.839055.
- Rinaldi, M., M. Caterino, M. Fera, P. Manco, and R. Macchiaroli. 2021. “Technology Selection in Green Supply Chains - the Effects of Additive and Traditional Manufacturing.” Journal of Cleaner Production 282:124554. https://doi.org/10.1016/j.jclepro.2020.124554.
- Saharidis, G. K., Y. Dallery, and F. Karaesmen. 2006, April. “Centralized Versus Decentralized Production Planning.” RAIRO - Operations Research 40.https://doi.org/10.1051/ro:2006017.
- Shapley, L. S. 1953. “A Value for N-Person Games.” Annals of Mathematics Studies 28:307–317.
- Simeone, A., A. Caggiano, and Y. Zeng. 2020. “Smart Cloud Manufacturing Platform for Resource Efficiency Improvement of Additive Manufacturing Services.” Procedia CIRP 88 (March): 387–392. https://doi.org/10.1016/j.procir.2020.05.067.
- van Campen, T., H. Hamers, B. Husslage, and R. Lindelauf. 2018. “A New Approximation Method for the Shapley Value Applied to the WTC 9/11 Terrorist Attack.” Social Network Analysis and Mining 8 (1): 1–12. https://doi.org/10.1007/s13278-017-0480-z.
- Wu, D., M. J. Greer, D. W. Rosen, and D. Schaefer. 2013, October. “Cloud Manufacturing: Strategic Vision and State-of-the-Art.” Journal of Manufacturing Systems 32 (4): 564–579. https://doi.org/10.1016/j.jmsy.2013.04.008.
- Xiao, J., W. Zhang, S. Zhang, and X. Zhuang. 2019. “Game Theory–Based Multi-Task Scheduling in Cloud Manufacturing Using An Extended Biogeography-Based Optimization Algorithm.” Concurrent Engineering Research and Applications 27 (4): 314–330. https://doi.org/10.1177/1063293X19882744.
- Xu, X. 2012. “From Cloud Computing to Cloud Manufacturing.” Robotics and Computer-Integrated Manufacturing 28 (1): 75–86. https://doi.org/10.1016/j.rcim.2011.07.002.
- Yang, H., R. Chen, and S. Kumara. 2021, October. “Stable Matching of Customers and Manufacturers for Sharing Economy of Additive Manufacturing.” Journal of Manufacturing Systems 61:288–299. https://doi.org/10.1016/j.jmsy.2021.09.013.
- Yilmaz, I., and S. W. Yoon. 2020. “Dynamic-Distributed Decisions and Sharing Protocol for Fair Resource Sharing in Collaborative Network.” International Journal of Production Economics 226 (January): 107644. https://doi.org/10.1016/j.ijpe.2020.107644.
- Yilmaz, I., S. W. Yoon, and H. Seok. 2017. “A Framework and Algorithm for Fair Demand and Capacity Sharing in Collaborative Networks.” International Journal of Production Economics 193 (June): 137–147. https://doi.org/10.1016/j.ijpe.2017.06.027.
- Zehetner, D., and M. Gansterer. 2022a, February. “The Collaborative Batching Problem in Multi-Site Additive Manufacturing.” International Journal of Production Economics 108432. https://doi.org/10.1016/j.ijpe.2022.108432.
- Zehetner, D., and M. Gansterer. 2022b. “Instances for the The Collaborative Job Reassignment Problem in Additive Manufacturing”.
- Zehetner, D., and M. Gansterer. 2022c. “The Collaborative Job Reassignment Problem in Additive Manufacturing.” In Proceedings of the Twenty-Second International Working Seminar on Production Economics, edited by M. H., T. O., Innsbruck.
- Zhang, L., Y. Luo, F. Tao, B. H. Li, L. Ren, X. Zhang, H. Guo, et al. 2014. “Cloud Manufacturing: A New Manufacturing Paradigm.” Enterprise Information Systems 8 (2): 167–187. https://doi.org/10.1080/17517575.2012.683812.