
 ?Mathematical formulae have been encoded as MathML and are displayed in this HTML version using MathJax in order to improve their display. Uncheck the box to turn MathJax off. This feature requires Javascript. Click on a formula to zoom.
Abstract
Car manufacturers are electrifying their product portfolios as a reaction to restrictions imposed on car emissions. This leads to additional product introductions of battery electric vehicles to the existing portfolio of internal combustion engine vehicles. For each introduction, car manufacturers must engineer the corresponding production systems. The engineering of these production systems is executed as projects that consist of designing, building, installing, and testing, requiring different types of engineers. Car manufacturers deploy an engineering workforce and outsource work to engineering service providers. In practice, workforce planning, project planning, and outsourcing are performed sequentially using spreadsheets. However, portfolio electrification increases the complexity of planning, calling for more advanced methods. We formulate an integrated workforce and project planning problem (mixed-integer programme) to minimise outsourcing and perform an experimental study using realistic data representing different prevalent strategies for portfolio electrification. Our approach significantly reduces outsourcing and increases workforce utilisation compared to current industry practice for a wide range of workforce sizes. Furthermore, we investigate the benefit of partially aligning the current practice with our integrated approach. Optimising outsourcing alone while maintaining the sequential planning process reaps 70% to 80% of the potential benefits, and integrating workforce or project planning achieves up to 90%.
Sustainable Development Goals:
1. Introduction
The automotive industry is strongly affected by global efforts to reduce carbon emissions. The largest markets, the European Union, the United States, and China, limit the average amount of CO2 emissions of vehicles sold by a car manufacturer. European Union (Citation2019b), China's Department of Industrial Policy and Regulations (Citation2020), and U. S. Environmental Protection Agency (Citation2021). Furthermore, the European Union recently banned new cars with classical combustion engines as of 2035 (European Union Citation2019a). To comply with these regulations, car manufacturers are transforming their product portfolios (Bersch, Akkerman, and Kolisch Citation2021; Thies et al. Citation2022), from internal combustion engine vehicles (ICEVs) to zero-emission vehicles, primarily battery electric vehicles (BEVs). BMW, for instance, aims to achieve 50% of its sales through BEVs by 2030 (BMW Citation2021). Other car manufacturers are transitioning even faster, e.g. Audi will develop exclusively BEVs from 2026 on with the aim of a fully electric portfolio by 2033 (Audi Citation2022). Mercedes has already stopped the development of new ICEVs and will introduce exclusively BEVs from 2025 (Mercedes Citation2022). The electrification of the portfolio poses significant challenges for the automotive industry. One of these challenges is an increased planning complexity for new vehicle introductions. This also involves the engineering of their production systems.
Automotive product portfolios determine which vehicles a car manufacturer offers (Bersch, Akkerman, and Kolisch Citation2021; Thies et al. Citation2022) and define important milestones in the life cycle, such as the start and the end of production. At the end of a vehicle's life cycle, its successor vehicle (next generation) is introduced to the market, and a new cycle begins. Typical cycle times are six to eight years. Due to long development times, the portfolios are planned for five to ten years in advance.
For each market introduction, car manufacturers must develop the new vehicle and simultaneously engineer the corresponding production system. This includes designing, building, installing, and testing the production system. The main parts of an automotive production system are the press shop, body shop, paint shop, and final assembly. The engineering of such a production system is executed as a project that consists of several engineering activities, such as planning the layout of the system, designing and installing production equipment, and planning the assembly process. To perform these activities, various types of engineers, such as layout planers, production-equipment planers, and ergonomic planers, are needed along other resources. To meet the demand for engineers, car manufacturers deploy a workforce of engineers. Since engineers are expensive, the size of the workforce is limited and adjusted by the management over time to align with the car manufacturer's strategy. Demand exceeding the internal workforce is compensated by outsourcing to engineering service providers, which we refer to as suppliers throughout this paper. Outsourcing engineering activities requires selecting a suitable supplier as the suppliers considerably vary in terms of engineering skills and capacities. For instance, some particularly large suppliers are only interested in taking on entire projects.
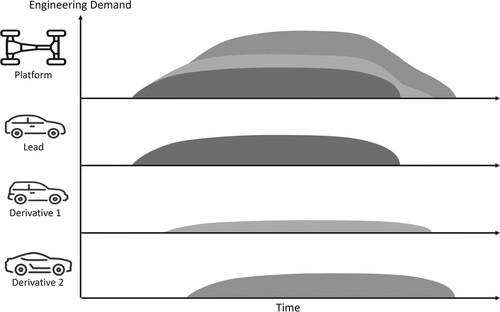
To offer customers a wide range of vehicles while limiting the demand for engineers, automotive product portfolios are platform-based (Robertson and Ulrich Citation1998); an example of a platform is given in Table . A platform specifies common characteristics, such as the chassis. Since equal parts are only developed once per platform, the engineering demand is reduced. The same applies to the engineering of the production system, where vehicles of one platform share, for example, assembly steps and conveyor technology. However, vehicles sharing the same platform differ in some characteristics, such as the body style.
Table 1. Illustration of a product platform using the example of two generations of the BMW 5 series.
The vehicles of a platform are introduced in a time-shifted manner, as depicted in Figure , to level the cumulative engineering demand. First, the development of the production system of the lead vehicle is started. Then, the production systems for the other vehicles are derived from the lead vehicle. Likewise, if a vehicle is produced at several locations, the production system is first developed for a lead plant and then for other plants. In the same way, production systems for the different platforms are developed in a time-shifted manner to achieve an overall levelled demand.
Figure 1. Illustration of vehicle time-shifting for levelling cumulative engineering demand for engineering a production system.
Car manufacturers have a central project planning office responsible for scheduling the engineering projects and planning the engineer workforce (Hab and Wagner Citation2013). In practice, workforce and project planning is done sequentially, in a mainly manual process using spreadsheets. First, the workforce composition is planned by allocating the total capacity of engineering resources among the different types of engineers. Then, for project scheduling, template schedules with predefined start times are used to simplify the planning process. The template schedules are designed such that, in combination with the cyclic nature of the portfolio and the time-shifted development, they result in relatively constant engineering demand. Nevertheless, for fluctuations exceeding the capacity of the internal workforce, the project planning office must decide which activities to outsource to which supplier. The planning goal is to cover as much engineering work as possible by the car manufacturer's engineering workforce and thus minimise outsourcing.
However, the electrification of the product portfolio increases the planning complexity and calls for more advanced planning approaches for the following reasons. First, in the transition phase, car manufacturers will have both ICEVs and BEVs in their portfolio (see Table ) and, thus, a temporarily increased number of vehicles and engineering demand. Second, some manufacturers will use the transition to restructure their portfolios. For instance, Audi and Mercedes will discontinue some vehicles in the compact class (Markus and Murphy Citation2022; Mercedes Citation2022). Mercedes has also dropped several vehicle variants in the large and medium-large car class with the introduction of their first-generation BEVs. These changes will break the cyclic structure of the portfolio, resulting in less constant engineering demand. Furthermore, Mercedes announced the reduction of fixed costs during the transition to BEVs. Hence, the reduction of the portfolio is presumably accompanied by a gradual decrease in the total internal engineering capacity, complicating workforce planning further. However, due to the sequential approach and the use of template schedules, the current planning approach does not use available flexibility to react to these complexities. This raises the question of how much outsourcing is actually needed for the transition to electric product portfolios and how much the current planning practice can be improved.
We are the first to address strategic workforce and project planning for engineering automotive production systems. The contribution of this paper is twofold. First, this paper provides a planning model for strategic workforce and project planning for engineering automotive production systems that can cope with today's complex planning environment. For this purpose, we develop a mixed-integer programme (MIP) that extends and combines modelling approaches from the workforce planning and project scheduling literature. Our MIP seeks to minimise outsourcing, assuming that the management prescribes a total capacity for the workforce that may change over time. The workforce planning component determines (i) the allocation of the total engineering capacity among the different types of engineers (workforce mix) and (ii) its changes over time. The scheduling component determines (i) the start times of engineering activities, (ii) whether an activity is processed by the car manufacturer or outsourced (make-or-buy decision), and (iii) to which supplier an activity is outsourced (supplier selection). Second, we derive managerial insights by conducting an extensive computational study using realistic data that represents prevalent strategies for portfolio electrification of different car manufacturers. Our approach significantly reduces outsourcing and increases workforce utilisation compared to current industry practice. The reduction in outsourcing translates to annual savings of several million euros. These improvements are consistent over a wide range of workforce sizes. We achieve high utilisation, also for workforce sizes substantially larger than current headcounts. The extent of the improvements heavily depends on the transition strategy and the initial size of the internal engineering workforce, suggesting that the workforce size should be adjusted to the transition strategy. For car manufacturers that reduce the variant diversity of their portfolio during the transition, a reduction of the internal workforce is advisable to reach high utilisation. In contrast, car manufacturers maintaining their variant diversity may consider hiring additional engineers to avoid large outsourcing rates in the transition phase. Furthermore, we investigate the benefit of partially aligning the current industry practice with our integrated approach. Optimising the outsourcing decisions alone while maintaining the sequential planning process already reaps about 70% to 80% of the potential benefits. Further improvements of up to 90% can be achieved by integrating either the workforce or project planning with the outsourcing decision. Thus, car manufacturers may consider continuing to use template schedules for simplicity.
The remainder of this paper is organised as follows: First, we survey the related Literature (Section 2). Next, we formalise the problem and present our MIP formulation (Section 3). Then, we detail the design of our computational study (Section 4) before discussing its results (Section 5). Finally, we conclude this paper with a summary and avenues for future research (Section 6).
2. Related literature
Our work builds on the literature on project scheduling (Section 2.1), and integrated workforce planning and project scheduling (Section 2.2).
2.1. Project scheduling
The project scheduling literature provides the basis for our model. The classical problem in project scheduling is the resource-constrained project scheduling problem (RCPSP). It concerns scheduling several activities subject to precedence and resource constraints and seeks to minimise the total project duration, also known as makespan. The RCPSP has been subject to research for decades, resulting in many extensions. We focus on a few key publications of the most related RCPSP variants for conciseness and refer to Hartmann and Briskorn (Citation2022) for an in-depth survey.
The resource-constrained multi-project scheduling problem (RCMPSP), introduced by Pritsker, Waiters, and Wolfe (Citation1969), extends the RCPSP by considering multiple projects competing for shared resources. The basic RCMPSP assumes, like this study, a given portfolio of projects to be scheduled by a central decision-maker. Another related variant is the multi-mode RCPSP (MRCPSP). In the MRCPSP, activities can be processed in multiple modes, representing alternative ways of processing an activity; for a recent application in a production context, see Ghasemi et al. (Citation2022), and for a review, see Weglarz et al. (Citation2011). Li and Womer (Citation2012) proposed using multiple modes to model outsourcing decisions. In their model, the make-or-buy decisions and supplier selection are represented by different modes, where each mode maps to either processing an activity using internal resources or outsourcing to one of the suppliers. Other relevant RCPSP variants are resource levelling problems (RLPs), which seek to minimise fluctuations in resource usage while completing a project subject to a prescribed deadline; for a survey on RLPs, see Rieck and Zimmermann (Citation2015) and Christodoulou, Michaelidou-Kamenou, and Ellinas (Citation2015). RLPs usually assume that resources are unlimited but associate costs. Most closely related to our work is the overload RLP, in which resource demand exceeding a given resource availability (i.e. overloading) is penalised. In our problem, the engineering workforce size corresponds to the resource availability. As in the overload RLP, we penalise demand exceeding the resource availability. However, we do not allow overloading of resources but require activities that would cause overloading to be outsourced. Thus, we must additionally decide which activities to outsource, which adds another layer of complexity. Furthermore, in contrast to the RLP, the resource availability (workforce size) may change over time in our setting.
2.2. Integrated workforce planning and project scheduling
The literature on workforce planning can be segmented into three categories: staffing (strategic level), shift scheduling/rostering (tactical level), and reallocation (operational level). Staffing pertains to the strategic level of workforce planning and concerns determining the optimal size and mix of a workforce (Ernst et al. Citation2004). It sets the restrictions for lower-level planning, which primarily involves allocating work among a given workforce (Ernst et al. Citation2004; Wijngaard Citation1983). Most workforce planning models are based on the assumption that resource demands are given parameters. In our problem, the resource demand results from the schedules of the engineering projects and is a decision rather than a parameter. Thus, we focus on the workforce planning literature that integrates project scheduling.
The first studies on the integrated problem go back to the 90s and address the tactical level. Bailey, Alfares, and Lin (Citation1995), Alfares and Bailey (Citation1997), and Alfares, Bailey, and Lin (Citation1999) propose integer programmes to integrate project scheduling and the daily allocation of manpower to fulfill the resource demand induced by the schedule. They consider the objective of minimising costs for (human) resources and demonstrate significant cost savings of the integrated model compared to solving the problems sequentially. Subsequent work studies the integrated model in more detail. Bassett (Citation2000), Wu and Sun (Citation2006), Heimerl and Kolisch (Citation2010), Kolisch and Heimerl (Citation2012), and Van Den Eeckhout, Vanhoucke, and Maenhout (Citation2021) consider multi-project scheduling for a given workforce with the option of acquiring additional resources via outsourcing. Maenhout and Vanhoucke (Citation2016) consider integrated (single) project scheduling and shift scheduling with outsourcing. Maenhout and Vanhoucke (Citation2017) extend this work by considering different shift policies. Volland, Fügener, and Brunner (Citation2017) study a problem similar to Maenhout and Vanhoucke (Citation2017) not considering outsourcing but under-coverage of resources. Van Den Eeckhout, Maenhout, and Vanhoucke (Citation2019) and Van Den Eeckhout, Vanhoucke, and Maenhout (Citation2020) generalise the problem to a multi-mode project scheduling problem.
Models for the strategic level, which is addressed in our work, are missing. An exception is the work by Milivcka et al. (Citation2022), who propose a bilevel optimisation model with decentralised decision makers. On the upper level, modelled as an RLP, the size and mix of the workforce (resource capacities) are determined. On the lower level, schedules with minimal makespan subject to resource capacities defined by the upper level are generated.
Although integrated workforce planning and project scheduling has received more attention recently, the literature lacks an appropriate model for our application. Except Milivcka et al. (Citation2022), all papers address the tactical level, neglecting strategic workforce aspects such as changes in workforce size and mix over time. However, the model by Milivcka et al. (Citation2022) does not consider strategic outsourcing decisions such as the make-or-buy decision and supplier selection. Furthermore, it considers decentralised decision-makers, resulting in a game-theoretic model that deviates significantly from our problem setting.
3. Problem definition and mathematical model
In this section, we define the problem by formalising workforce planning (Section 3.1), project scheduling (Section 3.2), and outsourcing (Section 3.3). Then, we formulate our mathematical model (Section 3.4).
3.1. Workforce planning
We consider managing a workforce consisting of a set of different types of human resources (types of engineers, e.g. layout planer, production-equipment planer) over a discrete planning horizon
, specifically, we consider a ten-year planning horizon with a period length of one month. Formally, we denote the workforce by a
matrix U, where each entry
represents the number of engineers of type
employed in period t. We assume that the workforce size and mix at the beginning of the planning horizon is given by
for all
. In other words,
represents the current engineering workforce of the car manufacturer. The workforce may be changed over time to be aligned with the resource demand, where changes represent hiring, reassigning, and dismissing engineers. When changing the workforce size, several strategic and legal aspects should be considered. On the one hand, car manufacturers seek to maintain a certain internal workforce size to avoid outsourcing work that requires disclosing sensitive data. On the other hand, car manufacturers seek to maintain a lean internal workforce to achieve high utilisation, but relying too strongly on outsourcing poses a risk as it creates a dependence on suppliers. Furthermore, labour rights must be considered as they limit the extent to which engineers can be dismissed. Hence, in practice, the management predefines a workforce size
for each period t considering the aforementioned aspects. To align with industry practice, where headcounts are planned annually, the workforce can only be changed in specific periods
(e.g. in the first period of each year). Finally, to avoid extreme workforce fluctuations, we assume the number of each engineering type (resource) k can change by at most γ percent between consecutive periods. Note that we do not consider hiring costs because changes can be aligned with natural fluctuations that are due to employees quitting their jobs and retiring and because of the option of reassigning engineers internally.
3.2. Project scheduling
We consider a given project portfolio denoted by the set . We represent each project
by an activity-on-node network
defined by the node set
and the arc set
. The nodes
represent activities, where activities
represent real activities (e.g. layout planning and ergonomic planning), and the remaining activities 0 and n + 1 are dummy activities representing the start and finish of the project, respectively. The release date of a project is defined by the earliest start
of the start activity, and the project deadline is defined by the latest finish
of the finish activity. The arcs
represent finish-to-start precedence relationships, meaning an activity i must be finished before its successor j starts. Via forward and backward computations on the precedence relationships (Neumann, Schwindt, and Zimmermann Citation2002), we compute time windows
defining precedence feasible start times for activities
. Each activity j must be started once in its time window
and be processed for a duration of
periods requiring
units of resource k during each period of processing. The processing can be done in multiple modes
; where mode 0 represents processing using engineers employed by the car manufacturer and modes
represents outsourcing to supplier m. Scheduling consists of determining a schedule for all projects. Each project schedule is a set of tuples
that indicate the start time
and the mode assignment
of each activity j. Having obtained the project schedules, the master schedule
is derived from the project schedules
.
3.3. Outsourcing
For outsourcing, we consider a set of suppliers . The capacity
represents the number of engineers of type k available at supplier m. Some large suppliers, also called full-service suppliers (Ciravegna, Romano, and Pilkington Citation2013), take on only entire projects. We denote the set of these full-service suppliers by the subset
. Note, we model the general case in which all suppliers can be full-service suppliers. In practice, there are also suppliers that specialise in certain areas and small suppliers that do not offer a full service.
While the internal workforce must be paid regardless of their utilisation, outsourcing incurs additional costs. Hence, we assume the car manufacturer seeks to minimise outsourcing. More precisely, we consider the objective of minimising the weighted outsourced workload. The workload of activity j is defined as its resource requirement
multiplied by its duration
. The workload
is weighted by multiplying it with an activity-specific weight
. The weight represents the car manufacturer's preference to outsource an activity. This allows the car manufacturer to influence which activities are outsourced. For instance, activities belonging to important projects or requiring access to intellectual property receive high weights to avoid outsourcing.
3.4. Mathematical formulation
Our MIP model builds on the so-called pulse disaggregated discrete-time formulation of the RCPSP (Artigues et al. Citation2015). A pulse variable is a binary variable that takes the value 1 if an activity j is started in mode m in the beginning of period t and 0 otherwise. We have chosen to build on this particular formulation as it yields the tightest LP-relaxation of all known RCPSP formulations (Artigues Citation2017; Tesch Citation2020). Our formulation is a single-project formulation obtained by merging all projects into a super-project defined by the activity-on-node network
with the node set
and arc set
. We model the engineering workforce using the following notation. The number of engineers of type k employed by the car manufacturer in period t is denoted by the decision variable
. Similarly, we use the auxiliary variables
to denote the positive and negative change in the number of engineers of type k from period t−1 to t. Lastly, we use the decision variable
to denote that all activities
of project p are outsourced to the full-service supplier m. Using this notation, we formulate the problem as follows. A summary of the notation is given in Appendix 1.
(1)
(1)
(2)
(2)
(3)
(3)
(4)
(4)
(5)
(5)
(6)
(6)
(7)
(7)
(8)
(8)
(9)
(9)
(10)
(10)
(11)
(11)
(12)
(12)
(13)
(13)
Objective (Equation1(1)
(1) ) aims to minimise the weighted outsourced workload. Constraints (Equation2
(2)
(2) )–(Equation5
(5)
(5) ) are workforce planning constraints. Constraints (Equation2
(2)
(2) ) define the workforce mix and limit the workforce size by the maximum size as stated by management. Constraints (Equation3
(3)
(3) ) track changes in the workforce over time. Constraints (Equation4
(4)
(4) ) and (Equation5
(5)
(5) ) limit the extent of workforce changes and ensure that the workforce is changed only in eligible periods. Constraints (Equation6
(6)
(6) ) and (Equation7
(7)
(7) ) are scheduling constraints. Constraints (Equation6
(6)
(6) ) ensure that each activity starts once during its time window and is performed in one mode. Constraints (Equation7
(7)
(7) ) are precedence constraints ensuring that an activity does not start before its predecessors are finished. Note for the precedence constraints, we adjusted the disaggregated formulation from Christofides, Alvarez-Valdés, and Tamarit (Citation1987) to our setting, as the LP-relaxation of this formulation gives tighter lower bounds than the classical aggregated formulation. Constraints (Equation8
(8)
(8) ) link scheduling and workforce planning by limiting the activities scheduled to be processed internally by the allocated workforce capacity. Similarly, Constraints (Equation9
(9)
(9) ) limit outsourcing to suppliers by their capacities. Constraints (Equation10
(10)
(10) ) ensure that full-service suppliers only receive entire projects. Finally, Constraints (Equation11
(11)
(11) )–(Equation13
(13)
(13) ) define the variable domains.
4. Instance generation and design of the experimental study
In this section, we first provide details on the generation of the test instances (Section 4.1), which are available at https://doi.org/10.14459/2024mp1735955. Then, we explain the planning practice in industry (Section 4.2), which serves as a benchmark, before we outline the design of our experimental study (Section 4.3).
4.1. Test instances
We created four project portfolios that represent different strategies for transitioning from ICEVs to BEVs and result from combining powertrain and variant diversity strategies, as depicted in Figure .
Figure 2. Product portfolio for different transition strategies.
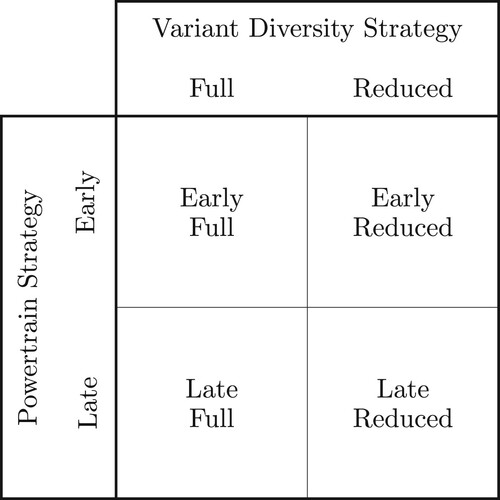
The powertrain strategy defines how fast the car manufacturer transitions from internal combustion to electric engines. We consider an early or late powertrain transition. In the early transition, we assume all new products are BEVs and projects for ICEVs are limited to ongoing projects and facelifts. A facelift is a minor update made to an existing model's exterior and interior design to maintain its appeal to the customer. Facelifts are usually done once in the middle of the product life cycle, i.e. three to four years after the start of production. For an early transition to BEVs, however, it can be assumed that the car manufacturer will carry out a second facelift after six to eight years to extend the product life cycle of its ICEVs for another three to four years. This early transition is undertaken by Mercedes, which has already stopped the development of new ICEVs (Mercedes Citation2022). In the late transition, the next generation of products are still mainly ICEVs but also include several BEVs. The late transition is inspired by BMW, which is ramping up its BEV production while offering customers both new ICEVs and BEVs (BMW Citation2021).
The variant diversity strategy describes whether the manufacturer reduces the number of different model variants during the transition process. Again, we consider two options. First, a full portfolio, assuming the car manufacturer maintains its current portfolio and only changes the powertrain of its products. Second, a reduced portfolio, considering the car manufacturer reduces its number of model variants during electrification. This strategy is inspired by Audi and Mercedes, which both announced the discontinuation of some models (Markus and Murphy Citation2022; Mercedes Citation2022).
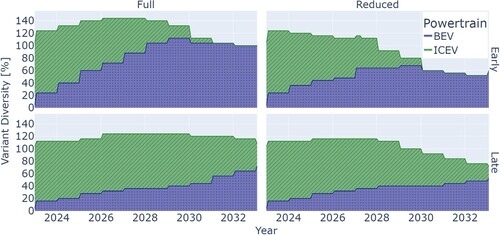
Combining the powertrain and variant diversity strategies results in the four product portfolios Early Full, Early Reduced, Late Full, and Late Reduced. In addition to these four portfolios, which we refer to as innovative portfolios, we consider a Legacy portfolio. The Legacy portfolio represents the case in which the car manufacturer renews its models, which are all ICEVs, in the typical cyclic pattern without electrifying the portfolio or adding or removing any models. We use the Legacy portfolio as a baseline to assess the impact of the different transition strategies. The portfolios differ in variant diversity (size) and the ratio of ICEVs to BEVs, as depicted in Figure . The variant diversity is given relative to the variant diversity of the Legacy portfolio. More details on the project portfolios are given in the Supplemental Material and Appendix 2.
Figure 3. Portfolio mix for different transition strategies (Share of BEVs: dotted area; Share of ICEVs: hatched area. A coloured version of the figure is available online).
We form complete test instances based on the abovementioned project portfolios, augmenting them as outlined in the following subsections by the planning horizon (Section 4.1.1), the project and activity characteristics (Section 4.1.2), and the engineering workforce (Section 4.1.3). We cooperate with a major European car manufacturer to ensure realistic augmentations. However, the test instances neither represent the product portfolio nor the engineering workforce of our industry partner. Furthermore, we have anonymised the data (removed descriptions of activities and engineering types) to not allow conclusions relevant to the competition.
4.1.1. Planning horizon
We consider the ten-year horizon from 2023 until 2032, with a period length of one month. Within this horizon, a number of vehicles are introduced into the market. For projects initiated earlier but overlapping with the planning horizon, we assume their schedules to be known and fixed, including the make-or-buy decisions and the supplier selection. To account for their impact, we adjust the right-hand side of Constraints (Equation8(8)
(8) ) and (Equation9
(9)
(9) ). For projects that start during the planning horizon but finish after 2032, we extend our planning horizon until the last project ends. However, our result analysis focuses on the horizon from 2023 until 2032.
4.1.2. Project and activity characteristics
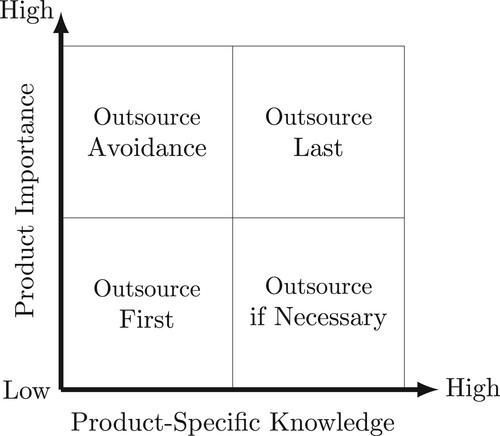
An engineering project for a new production system concerns several development areas. We have identified work packages in the following four domains as main drivers for the engineering demand: facility, body shop, paint shop, and final assembly. For each project, these work packages are detailed into a total of 93 activities requiring 12 different types of engineers over a time horizon of more than four years. The durations, resource requirements, and weights of the activities are based on expert estimates. The estimates for the resource requirements define requirements for the lead vehicle, i.e. the first vehicle of a platform. The derivates of the lead vehicle have lower resource requirements because they can build on the engineering work done for the lead vehicle. The demands for derivatives are determined by scaling down the lead vehicle's resource requirements. The scaling factors depend on how much a derivative deviates from the lead vehicle. To assign weights to the activities, we group them into the four groups ‘Outsource First’, ‘Outsource if Necessary’, ‘Outsource Avoidance’, and ‘Outsource Last’, which represent the integer weights 1, 2, 3, and 4, respectively. The assignment of an activity to one of the groups is determined, as depicted in Figure , by the required product-specific knowledge and the importance of the associated product (vehicle). The product-specific knowledge refers to confidential data, such as the design of the car or details about new technologies needed to perform an activity. For instance, if planning the assembly of a battery requires knowledge about a new battery technology, then planning this assembly process is more important than planning the assembly of the wheels of the same vehicle. The product importance refers to how important the product is relative to the other products in the portfolio. For instance, the first generation of a BEV is more important than an ICEV, which will be removed from the portfolio in the next cycle. Thus, if the same activity has to be executed to engineer the BEV and ICEV production system, then the activity for the BEV receives a higher weight. The rationale behind this ranking is to protect intellectual property and to keep activities for important products inhouse if possible.
Figure 4. Matrix to determine weights of activities.
4.1.3. Engineering workforce
We consider a workforce with an initial size of 703 engineers consisting of 12 different types. In practice, car manufacturers employ more engineers, but we focus on the most important types and adjust for base loads and special projects. We assume management seeks to reduce the total workforce size over time, prescribing a reduction of three percent annually. This assumption is motivated by the car manufacturer's goal of reducing costs. Discussions with industry experts have validated this assumption. Furthermore, to align with industry practice, we only allow to change the workforce in the first period of each year. Moreover, we assume the workforce size of a specific engineering type can vary by at most 10% between consecutive years.
4.2. Industry practice
In practice, project planning is done mainly manually by a central project planning office. The planning process consists of three sequential steps: workforce planning, project planning, and resolving resource conflicts. In the first step, the planner allocates the total resource capacities among the different engineering types by adjusting the initial capacity of each engineering type be the same rate to match the total headcount defined by the management. Second, for each project, a standard schedule with predefined default start times is applied. The default start times are based on backward scheduling from the project deadline. Furthermore, the standard schedule assumes that all activities are processed internally. Next, the project schedules are aggregated into a master schedule. The master schedules' resource demand will likely violate the resource capacities defined in the first step. Hence, in the third step, resource conflicts are resolved. For this purpose, activities are outsourced iteratively. The quality of this make-or-buy decision depends on the experience and skills of the planner. Since it is difficult to simulate such a make-or-buy decision process, we assume the planner makes the decision in a greedy fashion. This means that activities that have the smallest impact on the objective are outsourced first. A formal description of the industry practice is given in Appendix 3.
4.3. Design of the experimental study
Before outlining the experiments, we define the performance indicators used for the analysis (Section 4.3.1). Then, we outline our managerial study, which is three-fold. First, we establish a baseline comparing the different transition strategies and benchmark our MIP against the industry practice (Section 4.3.2). Second, we evaluate the impact of the workforce size (Section 4.3.4). Third, we systematically limit the decision domain to assess the impact of different adjustments to the current industry practice (Section 4.3.5).
4.3.1. Performance indicators
We consider the following three performance indicators:
WOW: The weighted outsourced workload (WOW) represents the amount of work outsourced weighted by their priority and is computed as follows:
OW: The outsourced workload (OW) represents the total amount of work outsourced. We consider the OW in absolute terms measured in full-time equivalents (FTEs) and relative to the total workload:
U: The utilisation (U) of the internal workforce, which we compute as follows:
The WOW is the objective of the planning problem and allows comparing the quality of different solutions. However, the WOW is not directly interpretable. Thus, we also consider the OW, which is naturally interpretable. The OW gives the car manufacturer information on how much work is outsourced in terms of full-time equivalents (FTEs). Note that we divide the OW (measured in absolute terms) and WOW by 12 to get FTEs in terms of man-years rather than man-months. Furthermore, evaluating both the OW and WOW allows gaining insights into the extent to which important activities are outsourced. If the OW and WOW are relatively close, mainly activities with low priorities are outsourced. In contrast, if the gap between the WOW and OW is large, many activities with high priority are outsourced. Lastly, we consider the utilisation of the internal workforce. The utilisation is directly interpretable and is an important measure in workforce planning. Furthermore, the utilisation indicates the potential for improvement. If the utilisation is very high (close to 100%), then there is little room to further decrease outsourcing. However, if the utilisation is low, it indicates that there is much idle time, which leaves room for improvement.
4.3.2. Design for baseline and comparsion of transition strategies
We establish a baseline by applying the industry practice and our MIP to the Legacy portfolio and each innovative portfolio, resulting in a total of 10 experiments. We assess the impact of the different transition strategies, comparing the results for the innovative portfolios and the Legacy portfolio.
4.3.3. Design for analysis of weight assignment
The weight of an activity represents its importance and depends on its classification into the four groups ‘Outsource First’, ‘Outsource if Necessary’, ‘Outsource Avoidance’, and ‘Outsource Last’ as explained above in Section 4.1.2. Moreover, the weights for each group represent the decision maker's preference between outsourcing activities of different importance. The choice of the weights for the different groups directly influences the objective function and may impact the resulting outsourcing volumes and workforce utilisation. Therefore, we investigate the impact of changing the weights considering three configurations. First, we consider the unweighted case by assigning each group the same weight of 1. Second, we consider the baseline, where the weights are 1, 2, 3, and 4 for the groups ‘Outsource First’, ‘Outsource if Necessary’, ‘Outsource Avoidance’, and ‘Outsource Last’, respectively. Third, we consider the case of squared weights of the baseline weights, which results in the weights 1, 4, 9, and 16, respectively. We run the industry heuristic and MIP for each innovative portfolio and each of the three weight configurations, resulting in 16 experiments in addition to the baseline experiments.
4.3.4. Design for analysis of workforce size
The management directly prescribes the workforce size, a crucial parameter for workforce planning. While increasing the workforce size may reduce outsourcing, it has the downside of increasing personnel costs. We explore this trade-off by systematically varying the maximum workforce size. For this purpose, we multiply the initial workforce size by a constant ϕ before we apply the annual reduction of three percent, as discussed in Section 4.1.3. For ϕ, we consider values in the interval
in increments of 0.05. Note that
represents the baseline workforce size. We run the industry practice and MIP for each innovative project portfolio and workforce size, resulting in 96 experiments in addition to the baseline experiments.
4.3.5. Design for analysis of changes to the industry practice
The industry practice determines workforce plans and project schedules independently and uses them as input for outsourcing decisions (make-or-buy decisions and supplier selection). The outsourcing decisions are made in a heuristic fashion without guarantees regarding the solution quality. Hence, the benefit of aligning them with workforce and project planning in an integrated approach remains untapped. We provide insights on the value of changing the current planning practice by investigating the individual contributions of using the MIP to determine outsourcing decisions and integrating them with workforce and project planning. First, we assess the impact of keeping the sequential planning process but optimising the outsourcing decisions (impact of outsourcing decisions). Second, we assess the contribution of optimising the outsourcing decisions and integrating workforce planning (impact of workforce planning). Third, we assess the contribution of optimising the outsourcing decisions and integrating project scheduling (impact of project scheduling). Note that we do not consider optimising the project schedules or workforce plans without optimising the outsourcing decisions, as this likely yields infeasible solutions. To test the changes, we restrict the MIP to only consider the desired subset of decisions while setting the other decisions to the values obtained from industry practice. For the impact of outsourcing decisions, we fix the workforce decisions and the activities' start times; for the impact of project scheduling, we fix the workforce decisions; and for the impact of workforce planning, we fix the activities' start times. We assess the impact of the different changes by comparing their improvements over the industry practice to the improvements made by the fully integrated planning approach, which is represented by the MIP without modifications (baseline). This results in the four configurations given in Table . We run the MIP for each configuration and innovative project portfolio, resulting in 15 experiments in addition to the baseline experiments.
Table 2. Configurations to investigate the impact of optimising individual decisions.
5. Results of the experimental study
This section discusses the results of our experimental study. First, we discuss the computational performance (Section 5.1) before presenting managerial insights (Section 5.2).
5.1. Computational performance
The reported computational results have been generated by implementing the MIP in Python using Gurobi 9.5.1 for solving. We use a time limit of 1 hour and an optimality gap of 1%. All experiments are run on a machine with 32 GB working memory and an Intel(R) Xeon(R) W-1390P 3.50GHz CPU.
For the evaluation, we use the same 52 instances that are also used for the sensitivity analysis of the workforce size (see Section 4.3.4). Table reports the runtimes and MIP gaps. All except three instances run into the time limit. However, the MIP gaps are only on 5% average, and considering that scheduling problems have notoriously weak lower bounds (see, e.g. Brucker and Knust Citation2003), the gaps to the optimal solutions are most likely even smaller. We performed additional tests on a subset of twelve instances to assess if we can decrease the MIP gaps further by increasing the time limit to twelve hours. However, these tests show a typical behaviour for solving MIPs where much progress is made early in the search before the progress starts stalling. Hence, despite much larger runtimes, we cannot observe a statistically significant improvement in the MIP gaps and thus keep the time limit of one hour for our experiments.
Table 3. Runtimes and MIP gaps (avg.: average, std.: standard deviation).
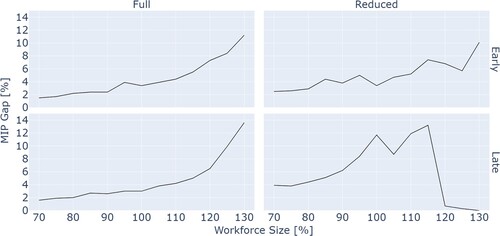
Figure shows that there is a trend such that with increasing workforce size, the MIP gaps are increasing. However, for instances where the workforce size is very large relative to the workload (see Late Reduced portfolio), the MIP gaps start to decrease after exceeding a certain workforce size. This behaviour aligns with findings from the project scheduling literature that show an inverted u-shape relationship between the hardness of an instance and its resource constrainedness (Herroelen and De Reyck Citation1999). Considering that even the hardest instances have gaps smaller than 15% and that most instances are solved nearly optimal, we conclude that solving the problem using a commercial solver is reasonable in practice.
Figure 5. Impact of workforce size on MIP gap for innovative portfolios.
5.2. Scenario analysis and managerial insights
In this section, we provide managerial insights. First, we establish a baseline and discuss the impact of different strategies for transitioning from ICEVs to BEVs (Section 5.2.1). Second, we study the impact of the workforce size on the outsourced workload and utilisation (Section 5.2.3) before we discuss the impact of different changes to the industry practice (Section 5.2.4). Throughout the discussions of the results, we benchmark the solutions of the industry practice against our MIP. Lastly, we summarise the managerial insights and discuss their implications for the automotive industry (Section 5.2.5).
5.2.1. Baseline and comparison of transition strategies
Baseline: We establish a baseline benchmarking the MIP against the industry practice. The results, given in Table , show that the MIP improves all three performance measures for all portfolios. The results for the Legacy portfolio show that the MIP already reduces the outsourced workload and increases utilisation considerably if car manufacturers would not electrify their portfolios. For the innovated electrified portfolios, the MIP achieves even larger improvements. The results for the innovative portfolios show that the weighted outsourced workload can be reduced on average by 2737 units, which is a relative improvement of 43.3%. In percentage, the outsourced workload can be reduced on average by 7.9 percentage points from 45.1% to 37.2%, which are 569 FTEs over the ten-year planning horizon in absolute terms. Assuming costs of 120,000 € per year and engineer, this translates into savings of 68.3 Mio. €. The MIP achieves these savings by determining workforce plans and project schedules that increase the utilisation of the workforce by 8.8 percentage points on average. Due to the higher utilisation, more work is processed internally, reducing the need for outsourcing. Furthermore, considering the ratio of the weighted outsourced workload to the unweighted outsourced workload, which gives an average weight of 1.2 (MIP) for outsourced activities compared to 1.8 (industry), reveals that the MIP also outsources less important activities. The extent of the improvement over the industry practice depends on the transition strategy, which we discuss in the following.
Table 4. Basline results for MIP and industry practice.
Impact of Powertrain Strategy: Transitioning to BEVs early leads to larger increases in outsourcing than transitioning late due to a larger increase in variant diversity. For the early transition, the outsourced workload may exceed 50% even if optimisation is used. The gap between the industry practice and MIP is especially large for an early transition with full variant diversity, specifically 12.0 percentage points for outsourced workload and 14.3 percentage points for utilisation. This gap translates to an average annual difference in outsourced work equivalent to about 90.7 FTE. Again, assuming costs of 120,000 € per year and engineer, this translates into annual savings of more than 10.8 Mio. €. The outsourced workload and the gap between the industry practice and the MIP are smaller for the late electrification of the portfolio. However, even for a late transition, optimisation achieves improvements up to 6.8 and 7.9 percentage points in outsourced workload and utilisation, respectively. These results emphasise the increased planning complexity and the need for advanced planning methods.
Impact of Variant Diversity Strategy: Also, variant diversity significantly impacts the outsourced workload. As expected, the (weighted) outsourced workload is larger for portfolios with full variant diversity, as they have more projects and, thus, a higher workload. Reducing the number of variants is an effective way of counteracting the increasing outsourcing workload caused by electrification. In case of a late transition to BEVs, a reduction of the portfolio leads to reductions in outsourcing of about 16 percentage points, resulting in almost the same outsourced workload as for the Legacy portfolio.
5.2.2. Impact of weight assignment
In this section, we discuss the effect of changing the weights on the outsourcing volume and utilisation, considering the three weight configurations ‘Unweighted’, ‘Baseline’, and ‘Squared Weights’ as defined in Section 4.3.3. Table gives the results for the industry heuristic and MIP. Intuitively, we expect the lowest outsourced workload for the unweighted case and the largest outsourced workload for the case of squared weights. This intuition is based on the fact that the incentive to outsource more workload with a low weight to avoid outsourcing less work with a higher weight increases with the difference between the weights. Similarly, we expect the utilisation to decline with an increase in the difference between the weights. While the results for the MIP show the expected behaviour, the results for the industry heuristic seemingly behave opposite to the intuition. However, a Wilcoxon-Test shows that differences between the three configurations are not statistically significant (p-value >5%) for neither the industry heuristic nor the MIP. This indicates that there is enough flexibility to outsource mainly activities with low weights. To verify this indication, we compute the average weight of the outsourced work (i.e. the ratio between the weighted outsourced workload and unweighted outsourced workload) for the three weight configurations. The resulting average weights are 1.0, 1.8, and 1.7 for the industry heuristic and 1.0, 1.2, and 1.2 for the MIP, confirming the indication. For practice, this means that car manufacturers can assign high weights to important activities that should not be outsourced without significantly increasing the outsourced workload or hurting utilisation.
Table 5. Impact of weights on the outsourced workload and utilisation for innovative portfolios (avg.: average, std.: standard deviation).
5.2.3. Impact of workforce size
In this section, we study the impact of the workforce size. Table reports the weighted outsourced workload for the industry heuristic and MIP. The results show that the MIP consistently outperforms the industry heuristic over a wide range of workforce sizes. We validated the reported improvements over the industry practice using a Wilcoxon-Test, showing a high statistical significance (p-value < 1%).
Table 6. Impact of workforce size on the weighted outsourced workload for innovative portfolios.
Figure illustrates the impact of changing the workforce size on the outsourced workload. The figure gives the impact measured as the difference to the baseline results (workforce size of 100%) of the industry practice. Intuitively, one expects that an increase in the workforce by one FTE will decrease the outsourcing volume by one FTE and vice versa. As expected, for the MIP, there is roughly a one-to-one relationship between the workforce capacity and outsourced workload. However, if the capacity of the workforce size becomes so large that it exceeds the workload, then an increase in the workforce cannot further decrease outsourcing (see Late Reduced portfolio). While the outsourced workloads are generally on a higher level for the industry practice, except for the Early Full portfolio, we also observe roughly a one-to-one relationship between changes in the workforce capacity and outsourced workload. However, for the Early Full portfolio, for workforce sizes less than 115% of the base size, a decrease in the workforce by one FTE translates to an increase in the outsourced workload larger than one FTE. In other words, for each engineer that is removed from the internal workforce, the car manufacturers must outsource workload requiring more than one engineer. Furthermore, for workforce sizes at 80% or smaller than the base size, the industry practice fails to find a feasible solution for the Early Full portfolio. Considering that the Early Full portfolio has the highest resource demand of all portfolios, the results indicate that the industry practice struggles to minimise outsourcing, especially if the workforce capacity is small.
Figure 6. Impact of changing the workforce size on the outsourced workload for innovative portfolios. (MIP: solid line; Industry practice: dashed line. A coloured version of the figure is available online.)
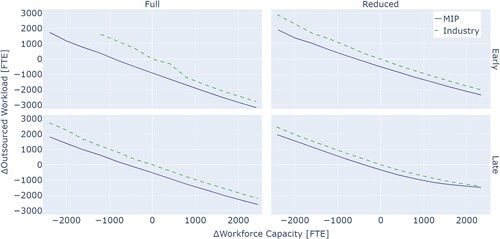
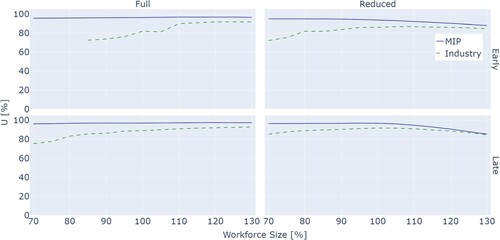
Figure illustrates the utilisation for different workforce sizes. The utilisation is high for the MIP and remains relatively constant for a wide range of workforce sizes. However, if the workforce capacity becomes so large that it exceeds the workload, utilisation starts to decline. This can be observed for the portfolios, in which the variant diversity is reduced. For the industry practice, the utilisation decreases with decreasing workforce size. While this seems counterintuitive, we explain this result as follows. First, the industry practice considers workforce planning before making the make-or-buy decisions. Thus, the industry practice is missing the flexibility to adjust the workforce plans to the make-or-buy decisions and leaves some potential to improve the utilisation untapped. Second, in contrast to the MIP, the industry practice does not provide a guarantee on the solution quality and may determine make-or-buy decisions that produce unnecessary idle times that hurt utilisation. Third, suboptimal make-or-buy decisions are more severe for a smaller workforce as there is less capacity to correct a mistake, and idle times have a larger impact as utilisation is a relative measure.
Figure 7. Impact of workforce size on utilisation for innovative portfolios. (MIP: solid line; Industry practice: dashed line. A coloured version of the figure is available online.)
5.2.4. Impact of changes to the industry practice
As demonstrated in the previous section, the MIP leads to significant improvements over the industry practice. The MIP achieves these improvements using three levers. First, the MIP makes outsourcing decisions (make-or-buy decisions and supplier selection) with a certain solution quality in contrast to the industry practice. Second, the MIP aligns workforce planning and outsourcing. Third, in contrast to the predefined template schedules used in practice, the MIP determines project schedules and aligns them with the workforce plans and outsourcing decisions. Now, we investigate the benefit of adjusting the current planning practice to exploit some of the aforementioned levers. As outlined in Section 4.3.5, we first assess the benefit of optimising the outsourcing decisions before considering the integration of workforce planning and project scheduling. We measure the realised benefit of an adjustment by dividing its improvement over the industry practice by the total improvement gained from optimising and integrating all decisions simultaneously. The realised benefit for all three performance measures is given by Table and Figure . Note the results discussed in this section only concern the innovative portfolios and not the Legacy portfolio.
Figure 8. Impact of optimising only a subset of decisions measured relative to the improvement gained from optimising all decisions simultaneously. (WOW: dotted, OW: hatched, U: cross-hatched. A coloured version of the figure is available online.).
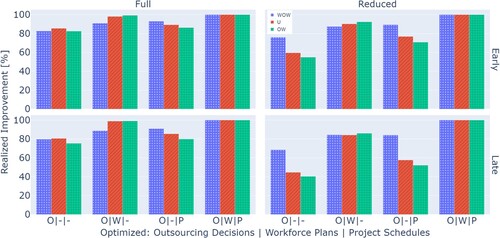
Table 7. Average improvement of optimising only certain decisions measured relative to the improvement gained from optimising all decisions simultaneously (avg.: average, std.: standard deviation).
Impact of Outsourcing Decisions: Only optimising the outsourcing decisions but sticking to the sequential approach of the industry practice already yields 77%, 63%, and 68% of the total improvement on average in terms of the weighted outsourced workload, outsourced workload, and utilisation, respectively. For further improvements, the sequential approach is missing the flexibility to align the workforce plans (resource supply) and project schedules (resource demand) to reduce outsourcing and increase utilisation. This is emphasised by the deviation between the different product portfolios (see Figure ). For portfolios that maintain full variant diversity, more than 80% of the maximum achievable improvement of the utilisation is achieved. In contrast, for strategies restructuring the portfolio by reducing its variant diversity, only 60% (Early Reduced) and 45% (Late Reduced) are achieved.
Impact of Workforce Planning: Optimising the outsourcing decisions and integrating workforce planning achieves 88%, 94%, and 93% of the potential improvement for the weighted outsourced workload, outsourced workload, and utilisation, respectively. It reaches almost the full optimisation potential, and the performance deviates little between the different portfolios. Nevertheless, there are differences between the portfolios, and not all potential for optimisation is exploited. For instance, for the Late Reduced portfolio, there is still a gap of about 15 percentage points for all three performance measures.
Impact of Project Scheduling: Optimising the outsourcing decisions and integrating project scheduling almost achieves the same weighted outsourced workload (89%) as optimising all decisions. However, the impact on the outsourced workload (72%) and utilisations (77%) is lower. Similar to only optimising the outsourcing decisions, there is a large deviation between the portfolios regarding utilisation, suggesting a lack of flexibility to match resource demand and supply. Again, the impact on utilisation for portfolios with reduced variant diversity, with 77% (Early Reduced) and 58% (Late Reduced) of the total improvement, is considerably lower compared to the portfolios with full variant diversity.
5.2.5. Summary of managerial insights
In this section, we summarise the managerial insights and discuss implications for the automotive industry. First, we discuss the key insights from comparing the different transition strategies. Then, we discuss the impact of the workforce size before we summarise the benefits of an optimisation-based planning approach compared to the current industry practice.
During the transition from ICEVs to BEVs, car manufacturers must accept higher outsourcing rates for all transition strategies. The outsourcing rates are especially high if car manufacturers transition early and maintain the full variant diversity of their product portfolios. Reducing the portfolio size is a viable option to reduce outsourcing. Especially if combined with a late transition, they result in only slight increases in outsourcing. However, we are not aware of any car manufacturer that uses such a strategy. Because the portfolio has a major impact on the car manufacturer's profitability, market shares, and other important business objectives, a portfolio reduction is not be made solely based on the impact on the outsourced workload. However, eliminating models with low sales and margins should be considered by car manufacturers as they may be beneficial overall due to savings in outsourcing.
Recall that we assume an annual reduction of 3% of the engineering workforce to reduce fixed costs for the car manufacturer's workforce. However, if the full variant diversity is maintained, the workload is high enough to even increase the initial workforce of 703 engineers by 30% at the start of the planning horizon without hurting utilisation. Hence, car manufacturers that maintain their full product portfolio may consider hiring additional engineers for the transition phase. However, if a long-term reduction in variant diversity is pursued, the workforce should not be increased, and a gradual reduction is needed to utilise the workforce highly.
The optimisation-based planning approach of the MIP has several benefits. First, using optimisation significantly reduces the (weighted) outsourced workload. For the base case, the average improvements are 46.8 % (WOW) and 17.8 % (OW), respectively. The largest absolute improvements are made for an early transition to BEVs while maintaining full variant diversity. For this case, the optimisation saves 908 man-years of outsourcing over the ten-year planning horizon. Considering the costs for engineers, e.g. 120,000 € per year, these savings translate to almost 109 Mio. €. About 90% of these savings can be obtained using template schedules, which is currently the practice, and only optimising the outsourcing decisions (make-or-buy decision and supplier selection) and workforce plans.
Another benefit is an increased utilisation of the internal workforce. In practice, it is often argued for small workforce sizes to reach high utilisation. However, the industry practice struggles to reach high utilisation for smaller workforce sizes. In contrast, the optimisation-based approach is capable of maintaining high levels of utilisation and allows steering the outsourced workload via the workforce size. For a wide range of workforce sizes, an increase/decrease of the workforce by one FTE can be translated roughly to a decrease/increase of one FTE in outsourcing while maintaining high utilisation.
Our experiments show that the current planning practice in the industry will perform suboptimal even if the planner would make better outsourcing decisions. Especially if the portfolios are restructured by reducing their variant diversity, the sequential process leaves much room for decreasing the outsourcing workload and increasing utilisation. This indicates that the transformation of the portfolio leads to changes in the engineering demand to an extent that cannot be mitigated without integrating workforce planning and project scheduling. Hence, we recommend an integrated planning approach to exploit the full potential of optimisation. Surprisingly, most of this potential can be realised by only optimising outsourcing decisions and integrating workforce planning. This may be useful for practice as it allows the continued use of template schedules.
6. Conclusions and future research
This paper addresses strategic workforce planning and scheduling projects for engineering automotive production systems. We formalise the problem and present a mathematical model for the problem. The model contributes to the integrated workforce planning and project scheduling literature by providing a model for the strategic planning level considering strategic outsourcing decisions such as make-or-buy and supplier selection. Our computational experiments show that commercial solvers can solve the model for realistic-sized instances.
This study contributes to practice by deriving managerial insights for the automotive industry. The insights are derived by applying our model to an extensive experimental study. Specifically, we compare the impact of different strategies to transition from ICEVs to BEVs and investigate the effect of workforce size on outsourcing and workforce utilisation. The results show that the transition to BEVs increases outsourcing. The extent of the increase depends on how fast the car manufacturer transitions and whether the full variant diversity is maintained during the transition. Furthermore, our experiments show that the transition leads to an increased planning complexity, which the current planning practice cannot cope with efficiently. Our MIP significantly reduces outsourcing and increases utilisation compared to the industry benchmark.
There are several future research directions. First, our model assumes that the project portfolios, resource requirements, and other characteristics of the engineering activities are known. Due to the long planning horizon, this model input may change over time. Hence, one could extend our work by considering a stochastic setting, e.g. where project portfolios and resource requirements are uncertain. From a production management perspective, the integration of our planning model with other planning tasks related to the introduction of new products is another interesting research direction. For example, our model could be integrated with product portfolio planning (Bersch, Akkerman, and Kolisch Citation2021; Thies et al. Citation2022) to better align the selection of new products and their start of production with the internal engineering capacities. Another option is the integration with strategic ramp-up planning (Becker, Stolletz, and Stäblein Citation2017) to ensure a smooth transition from engineering the production system to its deployment. Furthermore, our model could be extended regarding workforce-related characteristics such as the consideration of a multi-skilled workforce and the impact of training skill levels as discussed, for instance, by Heimerl and Kolisch (Citation2010) and Ruf, Bard, and Kolisch (Citation2022). Finally, a possible research direction is the development of efficient problem-specific solution approaches. Although our model is solvable for realistic-sized problems, a more efficient approach may allow an integration into a more interactive planning tool. Furthermore, stochastic extensions of the problem will likely lead to longer runtimes, which could be compensated for by a tailored solution approach.
Disclosure statement
No potential conflict of interest was reported by the author(s).
Data availability statement
The data used in this paper is available at https://doi.org/10.14459/2024mp1735955
.Additional information
Funding
Notes on contributors

Maximilian Kolter
Maximilian Kolter is a PhD candidate at the Chair of Operations Management at the TUM School of Management of the Technical University of Munich. Prior to pursuing his PhD, he received a MSc degree in industrial engineering from the University of Arkansas as a Fulbright grantee. Besides academia, Maximilian Kolter gained experience in the automotive industry. He did an apprenticeship in body manufacturing at BMW and worked in several positions for Webasto a tier-one supplier. In his research, he uses operations research methodology to solve supply chain and scheduling problems.

Martin Grunow
Martin Grunow is a Professor of Production and Supply Chain Management at the Technical University of Munich's TUM School of Management in Germany. He received his MSc degree in industrial engineering and his PhD from Technical University Berlin. After working in the R&D department of Evonik Degussa, Martin Grunow was a Full Professor of Operations Management and Department Head at Technical University of Denmark before joining TUM. In his research, he develops planning and scheduling methodology for manufacturing, logistics, and supply chain management. He has a special interest in the automotive and electronics sector as well as in the process industries, including chemicals, pharmaceuticals, and food.

Rainer Kolisch
Rainer Kolisch is a professor in the Operations and Technology Department of the School of Management at the Technical University of Munich, Germany. His research focuses on scheduling, service operations, and project management. He was editor-in-chief of OR Spectrum and he currently serves on five editorial boards.

Thomas Stäblein
Thomas Staeblein is the Head of Data Operations at Mercedes-Benz. For 20 years he has been with the company in senior management positions leading teams in Production Engineering, Project Scheduling, and Research & Development in Germany, China, and the US. He holds a PhD in Engineering from TU Clausthal and has been a visiting researcher at the University of Cambridge. His research focuses on designing and implementing lean production systems, enabling AI for autonomous driving with data collection operations, and managing product variety. In addition to his role at Mercedes-Benz, Thomas has been an Adjunct Lecturer at the Technical University of Munich since 2011.
References
- Alfares, Hesham, and James Bailey. 1997. “Integrated Project Task and Manpower Scheduling.” IIE Transactions 29 (9): 711–717.
- Alfares, Hesham, James Bailey, and Wen Y. Lin. 1999. “Integrated Project Operations and Personnel Scheduling with Multiple Labour Classes.” Production Planning & Control 10 (6): 570–578. https://doi.org/10.1080/095372899232867.
- Artigues, Christian. 2017. “On the Strength of Time-Indexed Formulations for the Resource-Constrained Project Scheduling Problem.” Operations Research Letters 45 (2): 154–159. https://doi.org/10.1016/j.orl.2017.02.001.
- Artigues, Christian, Oumar Koné, Pierre Lopez, and Marcel Mongeau. 2015. “Mixed-Integer Linear Programming Formulations.” In Handbook on Project Management and Scheduling Vol.1, edited by Christoph Schwindt and Jürgen Zimmermann, 17–41. Cham: Springer.
- Audi. 2022. “Audi Presents Plan for the Production of the Future.” Accessed March 5, 2024. https://www.audi-mediacenter.com/en/press-releases/audi-presents-plan-for-the-production-of-the-future-15135.
- Bailey, James, Hesham Alfares, and Win Yuan Lin. 1995. “Optimization and Heuristic Models to Integrate Project Task and Manpower Scheduling.” Computers & Industrial Engineering 29 (1-4): 473–476. https://doi.org/10.1016/0360-8352(95)00119-L.
- Bassett, Matt. 2000. “Assigning Projects to Optimize the Utilization of Employees' Time and Expertise.” Computers & Chemical Engineering 24 (2-7): 1013–1021. https://doi.org/10.1016/S0098-1354(00)00534-2.
- Becker, Annika, Raik Stolletz, and Thomas Stäblein. 2017. “Strategic Ramp-Up Planning in Automotive Production Networks.” International Journal of Production Research 55 (1): 59–78. https://doi.org/10.1080/00207543.2016.1193252.
- Bersch, Christopher V., Renzo Akkerman, and Rainer Kolisch. 2021. “Strategic Planning of New Product Introductions: Integrated Planning of Products and Modules in the Automotive Industry.” Omega105:102515. https://doi.org/10.1016/j.omega.2021.102515.
- BMW. 2021. “BMW Group Report 2021.” Accessed March 5, 2024. https://www.bmwgroup.com/en/report/2021/downloads/index.html?pdf-viewer=report.
- Brucker, Peter, and Sigrid Knust. 2003. “Lower Bounds for Resource-Constrained Project Scheduling Problems.” European Journal of Operational Research 149 (2): 302–313. https://doi.org/10.1016/S0377-2217(02)00762-2.
- China's Department of Industrial Policy and Regulations. 2020. “Measures for the Parallel Management of Average Fuel Consumption and New Energy Vehicle Credits of Passenger Car Enterprises.” Accessed February 5, 2024. https://www.miit.gov.cn/zwgk/zcwj/flfg/art/2020/art_2337a6d7ca894c5c8e8483cf9400ecdd.html.
- Christodoulou, Symeon E., Anastasia Michaelidou-Kamenou, and Georgios Ellinas. 2015. “Heuristic Methods for Resource Leveling Problems.” In Handbook on Project Management and Scheduling, edited by Christoph Schwindt and Jürgen Zimmermann, 389–407. Cham: Springer.
- Christofides, Nicos, Ramon Alvarez-Valdés, and José M. Tamarit. 1987. “Project Scheduling with Resource Constraints: A Branch and Bound Approach.” European Journal of Operational Research 29 (3): 262–273. https://doi.org/10.1016/0377-2217(87)90240-2.
- Ciravegna, Luciano, Pietro Romano, and Alan Pilkington. 2013. “Outsourcing Practices in Automotive Supply Networks: An Exploratory Study of Full Service Vehicle Suppliers.” International Journal of Production Research 51 (8): 2478–2490. https://doi.org/10.1080/00207543.2012.746797.
- Ernst, Andreas T., Houyuan Jiang, Mohan Krishnamoorthy, and David Sier. 2004. “Staff Scheduling and Rostering: A Review of Applications, Methods and Models.” European Journal of Operational Research153 (1): 3–27. https://doi.org/10.1016/S0377-2217(03)00095-X.
- European Union. 2019a. “Regulation(EU) 2019/631.” Official Journal of the European Union 62:13–53.
- European Union. 2019b. “Regulation(EU) 2023/851.” Official Journal of the European Union 66:5–20.
- Ghasemi, M., Seyed Meysam Mousavi, Saeed Aramesh, Reza Shahabi-Shahmiri, Edmundas Kazimieras Zavadskas, and J. Antucheviciene. 2022. “A New Approach for Production Project Scheduling with Time-Cost-Quality Trade-Off Considering Multi-Mode Resource-Constraints Under Interval Uncertainty.” International Journal of Production Research 61 (9): 2963–2985.
- Hab, Gerhard, and Reinhard Wagner. 2013. Projektmanagement in der Automobilindustrie. Wiesbaden: Springer.
- Hartmann, Sönke, and Dirk Briskorn. 2022. “An Updated Survey of Variants and Extensions of the Resource-Constrained Project Scheduling Problem.” European Journal of Operational Research 297 (1): 1–14. https://doi.org/10.1016/j.ejor.2021.05.004.
- Heimerl, Christian, and Rainer Kolisch. 2010. “Scheduling and Staffing Multiple Projects with a Multi-Skilled Workforce.” OR Spectrum 32 (2): 343–368. https://doi.org/10.1007/s00291-009-0169-4.
- Herroelen, Willy, and Bert De Reyck. 1999. “Phase Transitions in Project Scheduling.” Journal of the Operational Research Society 50 (2): 148–156. https://doi.org/10.1057/palgrave.jors.2600680.
- Kolisch, Rainer, and Christian Heimerl. 2012. “An Efficient Metaheuristic for Integrated Scheduling and Staffing IT Projects Based on a Generalized Minimum Cost Flow Network.” Naval Research Logistics59 (2): 111–127. https://doi.org/10.1002/nav.v59.2.
- Kolisch, Rainer, Arno Sprecher, and Andreas Drexl. 1995. “Characterization and Generation of a General Class of Resource-Constrained Project Scheduling Problems.” Management Science 41 (10): 1693–1703. https://doi.org/10.1287/mnsc.41.10.1693.
- Li, Haitao, and Keith Womer. 2012. “Optimizing the Supply Chain Configuration for Make-To-Order Manufacturing.” European Journal of Operational Research 221 (1): 118–128. https://doi.org/10.1016/j.ejor.2012.03.025.
- Maenhout, Broos, and Mario Vanhoucke. 2016. “An Exact Algorithm for an Integrated Project Staffing Problem with a Homogeneous Workforce.” Journal of Scheduling 19 (2): 107–133. https://doi.org/10.1007/s10951-015-0443-z.
- Maenhout, Broos, and Mario Vanhoucke. 2017. “A Resource Type Analysis of the Integrated Project Scheduling and Personnel Staffing Problem.” Annals of Operations Research 252 (2): 407–433. https://doi.org/10.1007/s10479-015-2033-z.
- Markus, Fasse, and Martin Murphy. 2022. “‘Die Menschen wollen sich etwas gönnen’ – Audi-Chef Duesmann erklärt seine Hochpreis-Strategie.” Accessed March 5, 2024. https://www.handelsblatt.com/unternehmen/industrie/interview-die-menschen-wollen-sich-etwas-goennen-audi-chef-duesmann-erklaert-seine-hochpreis-strategie/28030822.html?ticket=ST-11307529-w34Gsh3wOWosNB3vfYNi-ap2.
- Mercedes. 2022. “Mercedes-Benz Prepares Car Production Network for New Electric Portfolio.” Accessed March 5, 2024. https://media.mercedes-benz.com/article/ebb08358-4fd1-46af-a969-e608cc43de03.
- Milivcka, P., P. Sucha, Mario Vanhoucke, and Broos Maenhout. 2022. “The Bilevel Optimisation of a Multi-Agent Project Scheduling and Staffing Problem.” European Journal of Operational Research 296 (1): 72–86. https://doi.org/10.1016/j.ejor.2021.03.028.
- Neumann, Klaus, Christoph Schwindt, and Jürgen Zimmermann. 2002. Project Scheduling with Time Windows and Scarce Resources: Temporal and Resource-Constrained Project Scheduling with Regular and Nonregular Objective Functions. Berlin: Springer.
- Pritsker, A. A. B., Lawrence J. Waiters, and Philip M. Wolfe. 1969. “Multiproject Scheduling with Limited Resources: A Zero-One Programming Approach.” Management Science 16 (1): 93–108. https://doi.org/10.1287/mnsc.16.1.93.
- Rieck, Julia, and Jürgen Zimmermann. 2015. “Exact Methods for Resource Leveling Problems.” In Handbook on Project Management and Scheduling Vol. 1, edited by Christoph Schwindt and Jürgen Zimmermann, 361–387. Cham: Springer.
- Robertson, David, and Karl Ulrich. 1998. “Planning for Product Platforms.” Sloan Management Review39 (4): 19–31.
- Ruf, Christian, Jonathan F. Bard, and Rainer Kolisch. 2022. “Workforce Capacity Planning with Hierarchical Skills, Long-Term Training, and Random Resignations.” International Journal of Production Research 60 (2): 783–807. https://doi.org/10.1080/00207543.2021.2017058.
- Tesch, Alexander. 2020. “A Polyhedral Study of Event-Based Models for the Resource-Constrained Project Scheduling Problem.” Journal of Scheduling 23 (2): 233–251. https://doi.org/10.1007/s10951-020-00647-6.
- Thies, Christian, Christoph Hüls, Karsten Kieckhäfer, Jörg Wansart, and Thomas S. Spengler. 2022. “Project Portfolio Planning Under CO2 Fleet Emission Restrictions in the Automotive Industry.” Journal of Industrial Ecology 26 (3): 937–951. https://doi.org/10.1111/jiec.v26.3.
- U. S. Environmental Protection Agency. 2021. “Revised 2023 and Later Model Year Light-Duty Vehicle Greenhouse Gas Emissions Standards.” Federal Register 86 (248): 74434–74526.
- Van Den Eeckhout, Mick, Broos Maenhout, and Mario Vanhoucke. 2019. “A Heuristic Procedure to Solve the Project Staffing Problem with Discrete Time/Resource Trade-Offs and Personnel Scheduling Constraints.” Computers & Operations Research101:144–161. https://doi.org/10.1016/j.cor.2018.09.008.
- Van Den Eeckhout, Mick, Mario Vanhoucke, and Broos Maenhout. 2020. “A Decomposed Branch-And-Price Procedure for Integrating Demand Planning in Personnel Staffing Problems.” European Journal of Operational Research 280 (3): 845–859. https://doi.org/10.1016/j.ejor.2019.07.069.
- Van Den Eeckhout, Mick, Mario Vanhoucke, and Broos Maenhout. 2021. “A Column Generation-Based Diving Heuristic to Solve the Multi-Project Personnel Staffing Problem with Calendar Constraints and Resource Sharing.” Computers & Operations Research 128:105163. https://doi.org/10.1016/j.cor.2020.105163.
- Volland, Jonas, Andreas Fügener, and Jens O. Brunner. 2017. “A Column Generation Approach for the Integrated Shift and Task Scheduling Problem of Logistics Assistants in Hospitals.” European Journal of Operational Research 260 (1): 316–334. https://doi.org/10.1016/j.ejor.2016.12.026.
- Weglarz, Jan, Joanna Jozefowska, Marek Mika, and Grzegorz Waligora. 2011. “Project Scheduling with Finite or Infinite Number of Activity Processing Modes–A Survey.” European Journal of Operational Research 208 (3): 177–205. https://doi.org/10.1016/j.ejor.2010.03.037.
- Wijngaard, Jacob. 1983. “Aggregation in Manpower Planning.” Management Science 29 (12): 1427–1435. https://doi.org/10.1287/mnsc.29.12.1427.
- Wu, Muh-Cherng, and Shih-Hsiung Sun. 2006. “A Project Scheduling and Staff Assignment Model Considering Learning Effect.” International Journal of Advanced Manufacturing Technology 28 (11–12): 1190–1195. https://doi.org/10.1007/s00170-004-2465-0.
Appendices
Appendix 1. Notation
Table A1. Notation: sets and parameters.
Table A2. Notation: decision variables.
Appendix 2
Instance Characteristics
This section gives additional information about the instance characteristics. Table specifies the size of the instance by providing the number of projects , the number of real activities
, and the number of periods
. All instances consider 12 different types of engineers (resources), i.e.
. To give further details on the instance characteristics, we determined two well-established metrics to describe project scheduling instances (Kolisch, Sprecher, and Drexl Citation1995). First the resource factor, which describes how many different resources an activity requires. For our instances, the resource factor is
for all real activities, meaning that each activity requires exactly one type of resource (engineer). Second, the network complexity, which describes how many non-redundant precedence relationships an activity has on average. The network complexity for our instances is 1.38.
Table A1. Instance characteristics.
Appendix 3
Industry Heuristic
Algorithm 1 formalises the industry practice. The first step, workforce planning, is accommodated in Line 1. Here, the resource capacities for each resource
and period
are obtained by scaling the initial capacity
using the factor
to match with the prescribed workforce size
. Second, scheduling is done in Lines 2 and 3. In Line 2, for each project p, the project schedule
is constructed by setting the start times
to a default start time
, given by a template schedule, and the processing modes
to 0 for each activity
. In Line 3, the project schedules are aggregated into a master schedule Ω. The master schedule Ω determines the set of activities that are processed in mode m in period t denoted by the active set
. The active set results in the resource demand
for resource k and mode m. Line 4 initialises the set
, representing the outsourced projects. Initially, all activities and projects are scheduled to be processed internally, which likely violates the capacities determined in step one. Hence, in the third step, resource conflicts are resolved (Lines 5 to 15). Line 4 checks if at least one resource conflict exists for some period t and resource k. If a conflict is detected, Line 6 checks if a single activity participating in the conflict can be outsourced to some supplier, see Algorithm 2. If such an activity can be outsourced, the schedule gets updated in Line 13. Otherwise, the algorithm attempts to outsource an entire project to a full-service supplier, see Algorithm 3. If some full-service supplier has sufficient capacity left, the project is outsourced, and the schedule is updated in Line 10. Otherwise, Algorithm 1 fails to find a feasible solution, and we return
(Line 8). This process repeats until all resource conflicts are resolved or Algorithm 1 fails.
Algorithm 2 defines the process for outsourcing an activity. First, in Line 1, the activities participating in the conflict are determined. Then, in the for-loop in Lines 2 to 7, it is iteratively checked if one of these activities can be outsourced, i.e. if a supplier has sufficient capacity left. Note while it is not explicitly mentioned in Line 2, the activities are considered greedily, meaning in the order of their impact on the objective (weighted outsourcing volume). If a supplier is found, the activity is outsourced, and the resulting schedule is returned in Line 5. Otherwise, the remaining activities are checked. The routine terminates if no remaining activities exist by returning an empty set (Line 8).
Algorithm 3 defines the process for outsourcing projects. First, in Line 1, the projects participating in the conflict for resource k in period t are identified. Then, in the for-loop in Lines 2 to 13, it is iteratively checked if one project can be outsourced to a full-service supplier, i.e. if a supplier has sufficient capacity left. Here, while not explicitly mentioned in Line 2, projects for which some activities are already outsourced are considered first in the order of the already outsourced workload. If a supplier is found, the project is outsourced. Since outsourcing an entire project may decrease the internal workload significantly beyond the internal workforce capacity, all activities for projects that are not entirely outsourced are assigned to internal processing again (for-loop in Lines 7 to 10). The schedule is updated accordingly and returned in Line 11. If no supplier is found, the remaining projects are considered for outsourcing. If no remaining projects exist, the routine terminates by returning an empty set (Line 14).