
Abstract
The International Social Survey Programme (ISSP) recently released the 5th survey on the perception of social inequalities. The data was collected in more than 30 countries around the globe. This introduction offers an overview of the substantive contributions that are included in the two special issues on these data. It also presents results from an analysis of the recent ISSP data that shows how people perceive social inequalities, assess current levels of taxation and the performance of the government, experience inequality, and to what extent they trust other people. Despite evident variations across countries, the analysis highlights that respondents’ views continue to align with the conventional classification of countries into liberal welfare states, Scandinavian welfare states, continental welfare states, and post-communist countries.
Introduction
The International Journal of Sociology started to publish special issues on the new data releases of the International Social Survey Programme (www.issp.org) in 2017. These special issues consist of an overview of the new module, a contribution offering a descriptive analysis of the results, and several articles that use ISSP data to study substantive questions. So far, special issues and descriptive overviews were published on “citizenship” (Scholz et al. Citation2017; Eder Citation2017), “work orientations” (Jutz et al. Citation2018; Volk and Hadler Citation2018), “role of government” (Edlund and Lindh Citation2019; Hadler et al. Citation2019), “social networks” (Sapin et al. Citation2020; Hadler et al. Citation2020), and “religion” (Smith and Schapiro Citation2021; Höllinger and Makula Citation2021).
The COVID-19 pandemic delayed the fieldwork and data depositing within the ISSP group by a year. Hence, the ISSP research group released the final data on the ISSP 2019 "Social Inequality V" survey only in 2022 (ISSP Research Group Citation2022). We use this occasion to introduce the social inequality module in two separate special issues. The first issue includes this introduction and three additional contributions.
Roberts et al. discuss the significance of the social inequality survey as a comprehensive database of public beliefs about inequality and socioeconomic conditions in their article “The ISSP 2019 Social Inequality module: Country-comparative individual-level data on public beliefs about inequality and socioeconomic conditions over three decades.” The authors point out that the social inequality module was fielded five times since 1987 and that the topics were adjusted over time to reflect changing debates on social inequality. The fifth wave of the module introduced new questions addressing current debates in inequality research, including topics such as anger, unfairness, government inefficacy, economic insecurity, and social trust.
Frédéric Gonthier analyzes the ways by which ordinary citizens are moved by anger toward economic inequality in his contribution “It’s the moral economy. stupid! Anger toward economic inequality and populist voting.” His study suggests that when individuals perceive a violation of distributive norms, their anger benefits political parties advocating for redistribution. Findings also indicate that angry citizens are more likely to vote for economically progressive populist and pluralist parties than conservative parties on economic issues.
Lilia Dimova and Martin Dimova ask “Are the subjective social status inequalities persistent?” and analyze data from countries around the globe within the ISSP 2019 "Social Inequality V" survey. The research separates countries into four segments based on societal inequality and affluence, revealing that ancestry, social class, financial stability, income, education, and ethnicity all contribute to subjective status rankings. Additionally, their study highlights that subjective status groups persist over time, exist within specific societal contexts, and can be transmitted across generations. Finally, it notes that North and Central European societies tend to exhibit greater egalitarianism in a cross-national subjective context.
In total, there are two special issues on the ISSP inequality data, i.e., the present issue and a forthcoming issue guest-edited by Benjamin Roberts, Jare Struwig, Jonas Edlund, and Arvid Lindh. The contributions in these two special issues cover numerous ISSP items and provide interesting insights into the areas they cover. Yet, the ISSP survey includes several other items, which are not fully covered by these contributions. To provide a comprehensive overview of all items, we conducted a brief descriptive analysis of the remaining items at the country level. Our results are presented on the following pages.
Country-level results on new themes
The results presented in this introduction are derived from questions included in the ISSP 2019 "Social Inequality V" survey (ISSP Research Group Citation2022). We use the data set that includes 29 countries, i.e., all countries that are included in the final release. Data from four additional countries (Estonia, Hungary, Slovakia, and Ukraine) is available at the GESIS archive but was not included in the final release due to methodological considerations. Furthermore, India has also deposited its data.
We grouped the 29 countries for some of our analyses into regime types: Continental welfare states (Austria, France, Germany, Italy, and Switzerland), Liberal welfare states (Australia, Great Britain, New Zealand, and the United States), post-communist countries (Bulgaria, Croatia, Czech Republic, Lithuania, Russia, and Slovenia), Scandinavian countries (Denmark, Finland, Iceland, Norway, and Sweden), and a remaining group (Chile, Taiwan, Israel, Japan, Philippines, South Africa, Suriname, Thailand, and Venezuela).
We present the mean values for each country based on the weighted data and the mean values across countries as indicators of the strength of agreement for all Likert-type questions. Furthermore, we also present the standard deviation of the countries’ mean values as an indicator of the coherence of opinions across countries. For variables that are nominal, we present the percentage of agreement and the variation across countries. The actual question text and answer categories are presented in the subsequent sections.
Perceived inequality and desired roles for different market actors
The ISSP 2019 survey includes a few questions on the size of income differences and different responsibilities in diminishing them. The questions are: “Q4a Differences in income in [COUNTRY] are too large.”, “Q4b It is the responsibility of the government to reduce the differences in income between people with high and low incomes.”, “Q4c The government should provide a decent standard of living for the unemployed.”, and “Q4d It is the responsibility of private companies to reduce the differences in pay between their employees with high and those with low pay.” The answer categories are (1) Strongly agree to (5) Strongly disagree, whereas the scale was reversed for the analysis and a high value thus means that the agreement is strong. shows the results in this regard. reports the results on the follow-up question: “Q5 Looking at the list below, who do you think should have the greatest responsibility for reducing differences in income between people with high incomes and people with low incomes?” The answer categories are: “Private companies.”, “Government.”, “Trade unions.”, “High-income individuals themselves.”, “Low-income individuals themselves.” and “Income differences do not need to be reduced.”
Figure 1. Responsibility for reducing differences in income between people with high and low income*.
*In %, n = 40,864, weighted data, data source: ISSP Research Group Citation2022.
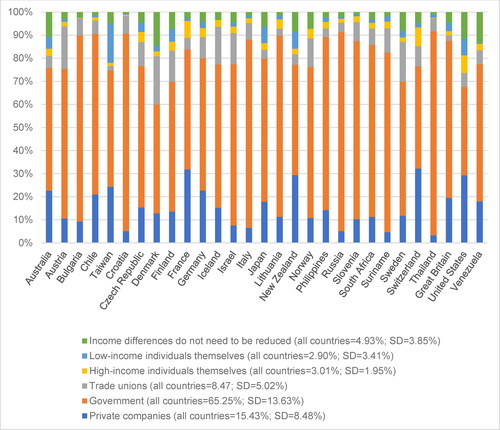
Table 1. Attitudes toward income differences and their reductionTable Footnote*.
shows that the question “income differences are too large” received on average the strongest agreement, followed by the two statements on different government responsibilities. The lowest agreement can be found regarding private companies being responsible to reduce income gaps. Considering differences across countries based on the standard deviations, the opinions are most similar regarding private companies and the least similar regarding the size of the income differences, whereas respondents in Bulgaria, Croatia, and Russia agree the most that they are too large.
provides a more detailed insight into the desired responsibility to reduce income differences by asking respondents to choose between the individuals themselves, trade unions, the government, and private companies. It indicates that the government is seen as the actor that has the greatest responsibility in all countries (65.3% across-country mean), followed by private companies (15.4%), trade unions (8.5%), high-income individuals themselves (3%) and low-income individuals themselves (2.9%). Around 5% of the respondents do not see any need to reduce income differences. Despite the overall preference for the government, some differences exist between countries. The government was mentioned very often in Bulgaria, Croatia, Italy, Russia, and Thailand, trade unions in Austria, Denmark, Finland, Iceland, and Sweden, and private companies in Taiwan, New Zealand, France, Switzerland, and the United States.
As for the patterns across countries, we can notice some coherence when considering our classification in “continental welfare states,” “liberal welfare states,” “post-communist countries,” “Scandinavian countries,” and the remaining countries. This is also confirmed in ANOVA analyses and eta values based on the country-level mean values and these groups. These analyses result in the following eta values for the questions in : Income differences are too large (.75); Gov’t resp. to reduce inc. difference (.76), Gov’t resp. to provide a living standard (.57), Private companies resp. to reduce the pay gap (.34), and for the categories in : Private companies (.64), Government (.67), Trade unions (.76), High-income individuals themselves (.48), Low-income individuals themselves (.45), and Income differences do not need to be reduced (.66).
Perceived government inefficacy and lived experience of inequality
shows the results regarding topics of political action, tax policies, health care, and education. The survey included the questions “Q6 To what extent do you agree or disagree with the following statement: Most politicians in [COUNTRY] do not care about reducing the differences in income between people with high and low incomes.” with (1) Strongly agree to (5) Strongly disagree as answer categories. “Q7 How successful is the government in [COUNTRY] nowadays in reducing the differences in income between people with high incomes and people with low incomes?” offered (1) Very successful to (5) Very unsuccessful as answer categories. Answers from (1) Much larger share to (5) Much smaller share were available for the question “Q8a Do you think people with high incomes should pay a larger share of their income in taxes than those with low incomes, the same share or a smaller share?”, while for “Q8b Generally, how would you describe taxes in [COUNTRY] today for those with high incomes. Taxes are …?” the answers go from (1) … much too high to (5) … much too low. For the questions “Q9a Is it just or unjust – right or wrong – that people with higher incomes can buy better health care than people with lower incomes?” and “Q9b Is it just or unjust – right or wrong – that people with higher incomes can buy better education for their children than people with lower incomes?” the answer categories are (1) Very just, definitely right to (5) Very unjust, definitely wrong. All values were reversed for the analyses so that higher values represent stronger agreement.
Table 2. Attitudes toward political action, tax policies, health care, and educationTable Footnote*.
indicates that, across all countries, respondents agree quite strongly that most politicians do not care about reducing income inequalities and do not think that the government is very successful in reducing income inequalities. At the same time, respondents think that high-income groups should pay a larger share in taxes, but are also somewhat unsure about the current level of taxation as the average is about in the middle between “too small” and “too large”. Finally, on average, respondents are rather inclined to think that it is unfair that people with a higher income can afford better health care and education. Considering the differences between countries shows that the variation is also higher among the latter items, which indicates a diverse array of opinions across countries.
Considering the differences across the regimes indicates strong effects with eta above .7 for the first and the two last items and smaller effects on the items about the taxation of people with high incomes and the government’s success (with eta below .5). As for the view that politicians do not care about reducing income differences, it is the post-communist countries, where strong agreement can be found, and the Scandinavian countries, where lower agreement can be found. Finally, the agreement to the questions regarding affording better health care and education is considered unjust in post-communist countries, Scandinavian and continental welfare states and more accepted in other countries. Overall, we see again significant differences between the regimes.
Economic insecurity and deprivation
lists the results of questions regarding economic insecurity and deprivation. The following three questions “Q17a How often do you have any contact with people who are a lot poorer than you when you are out and about? This might be in the street, on public transport, in shops, in your neighbourhood, or at your workplace.”, “Q17b How often do you have any contact with people who are a lot richer than you when you are out and about? This might be in the street, on public transport, in shops, in your neighbourhood, or at your workplace.”, and “Q18c How often do you or other members of your household skip a meal because there is not enough money for food?” were asked as a 7-point scale ranging from (1) Never, (2) Less than once a month, (3) Once a month, (4) Several times a month, (5) Once a week, (6) Several times a week, and (7) Every day. “Q18a Thinking of your household’s total income, including all the sources of income of all the members who contribute to it, how difficult or easy is it currently for your household to make ends meet?” and “Q18b and during the next 12 months, how difficult or easy do you think it will be for your household to make ends meet?” had five answer categories which range from (1) Very difficult to (5) Very easy. As with the previous tables, the difficulty scales were reversed for the analyses so that higher values represent more problems.
Table 3. Attitudes toward social interaction and income situationTable Footnote*.
shows that several times a month to once a week is the average number of contacts reported in most countries. Across all countries, respondents report average problems making ends meet, but, as we will discuss later, there are large differences between countries in this regard. Skipping a meal is reported occasionally with an average of 1.35, yet we need to consider that this kind of severe material deprivation still affects some people in all countries and a larger number in Venezuela and South Africa. As for the differences across regimes, the ANOVA and the eta values show that the variation is larger regarding the questions on how difficult it is to make ends meet (eta > .8), followed by the question on skipping meals (.51). Fewer differences can be seen regarding the contacts with rich people (.33) and poor people (.20). Problems with making ends meet are reported more often in the post-communist countries and the group consisting mostly of Asian and Latin American countries.
Social trust
As a last addition to the social inequality module the survey also included a question on social trust measured by the item “Q19 Generally speaking, would you say that people can be trusted or that you can’t be too careful in dealing with people?”. This item could have been answered with (1) People can almost always be trusted, (2) People can usually be trusted, (3) You usually can’t be too careful in dealing with people, (4) You almost always can’t be too careful in dealing with people. shows the results in this regard.
Figure 2. Social trust*.
* In %. n = 43,639, weighted data, data source: ISSP Research Group Citation2022.
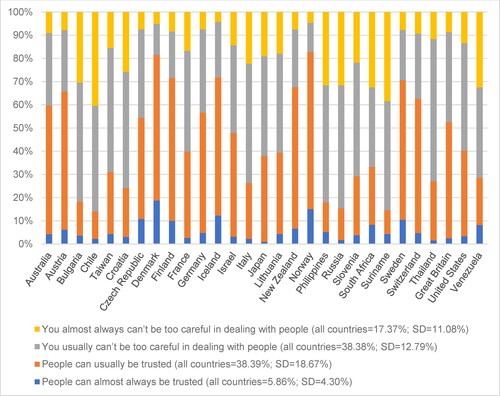
As for social trust, across all countries, the “usually can’t be too careful” and “the usually can be trusted” options are mentioned most frequently with around 38% each. Given that the “almost always can’t be too careful” is mentioned more often than the “almost always can be trusted” (17% vs. 6%) shows that, overall, respondents lean toward the being careful side. Again, there are some notable country differences with trust being particularly strong in the Scandinavian countries and particularly low in the South American countries. The ANOVA analyses confirm this view with eta values above .8.
Summary and outlook
This editorial introduction offered an overview of the two special issues of the International Journal of Sociology on the ISSP 2019 “Social Inequality V” survey. To provide a comprehensive overview of the new data, we also analyzed several items that were not used in the included papers. The results of our descriptive country-level analysis on views about social inequality, perceived responsibility of different actors in reducing inequality, lived experience of inequality, economic insecurity and deprivation, social trust, and other topics pointed to a few known patterns and differences across countries in the perception of social inequality. In many regards, differences between post-communist countries, Scandinavian countries, continental welfare regimes, and liberal countries occurred. Our analyses are, however, only descriptive in nature and have the main aim to ignite some research ideas that can be studied in more detail in the future.
References
- Eder, Anja. 2017. “Cross-Country Variation in People’s Attitudes toward Citizens’ Rights and Obligations: A Descriptive Overview Based on Data from the ISSP Citizenship Module 2014.” International Journal of Sociology 47(1):10–25. doi: 10.1080/00207659.2017.1265309.
- Edlund, J., and A. Lindh. 2019. “The ISSP 2016 Role of Government Module: Content, Coverage, and History.” International Journal of Sociology 49(2):99–109. doi: 10.1080/00207659.2019.1582963.
- Hadler, M. A., C. Eder., and, C. Mayer. 2019. “An Overview of Attitudes and Opinions On the Role of Government. A Cross-National Comparison Covering the Period of 1985 to 2016.” International Journal of Sociology 49(3):171–81. doi: 10.1080/00207659.2019.1605027.
- Hadler, Markus, Florian Gundl, and Boštjan Vrečar. 2020. “The ISSP 2017 Survey on Social Networks and Social Resources: An Overview of Country-Level Results.” International Journal of Sociology 50(2):87–102. doi: 10.1080/00207659.2020.1712048.
- Höllinger, Franz, and Lorenz Makula. 2021. “Religiosity in the Major Religious Cultures of the World.” International Journal of Sociology 51(5):345–59. doi: 10.1080/00207659.2021.1958181.
- ISSP Research Group 2022. International Social Survey Programme: Social Inequality V – ISSP 2019. GESIS. Köln. ZA7600 Datenfile Version 3.0.0. doi: 10.4232/1.14009.
- Jutz, Regina, Evi Scholz, Michael Braun, and Markus Hadler. 2018. “The ISSP 2015 Work Orientations IV Module.” International Journal of Sociology 48(2):95–102. doi: 10.1080/00207659.2018.1446115.
- Sapin, Marlène, Dominique Joye, Christof Wolf, Johannes Andersen, Yanjie Bian, Ali Carkoglu, Yang-Chi Fu, Ersin Kalaycioglu, Peter V. Marsden, and Tom W. Smith. 2020. “The ISSP 2017 Social Networks and Social Resources Module.” International Journal of Sociology 50(1):1–25. doi: 10.1080/00207659.2020.1712157.
- Scholz, Evi, Regina Jutz, Jon H. Pammett, and Markus Hadler. 2017. “ISSP and the ISSP 2014 Citizenship II Module: An Introduction.” International Journal of Sociology 47(1):1–9. doi: 10.1080/00207659.2017.1264825.
- Smith, Tom W., and Benjamin Schapiro. 2021. “The International Social Survey Program Modules on Religion. 1991–2018.” International Journal of Sociology 51(5):337–44. doi: 10.1080/00207659.2021.1976471.
- Volk, H., and M. Hadler. 2018. “Work Orientations and Perceived Working Conditions across Countries: Results from the 2015 ISSP Survey.” International Journal of Sociology 48(2):103–23. doi: 10.1080/00207659.2018.1446116.