
ABSTRACT
Adhesive bonding is one of the most promising joining technologies for composite aircraft. However, to comply with current aircraft certification rules, current safety-critical bonded joints, in which at least one of the interfaces requires additional surface preparation, are always used in combination with redundant mechanical fasteners, such as rivets and bolts. This lack of trust in bonded structures is mostly linked to the fear of lack of adhesion or a “weak bond”.
The aim of this paper is to tackle this challenge by assessing the ability to use composite peel tests and acoustic emission (AE) technique to assess adhesion quality and distinguish a good bond quality from a “weak bond”.
Composite Bell Peel (CBP) tests and Double-Cantilever-Beam (DCB) tests were performed on contaminated and non-contaminated CFRP bonded specimens. The results show that peel strength drops significantly at the location of the contaminated interface that has led to weak adhesion, as a result from adhesive failure. The AE signals obtained during DCB tests show different features for cracks growing at the interface (“weak bonds”) and inside the adhesive layer (cohesive failure). In addition to this, scattering of the AE signals were observed in the contaminated specimens with “weak bonds”.
Introduction
Adhesive bonding is one of the most promising joining technologies for the assembly of composite parts. In comparison with the traditional fasteners, adhesively bonded joints induce lower stress concentrations in the adherends, which increases the efficiency of the joint in terms of strength-to-weight ratio.
However, current aircraft certification rules impose limitation to explore the full capacity of bonded joints in composite aircraft structures. According to Federal Aviation Administration Advisory Circular on composite aircraft structure, for any bonded joint, where at least one of the interfaces requires additional surface preparation and which failure would result in a catastrophic loss of the airplane, the limit load must be guaranteed by one of the following methods: “(i) The maximum disbonds of each bonded joint consistent with the capability to withstand the loads in paragraph (a)(3) of this section must be determined by analysis, tests, or both. Disbonds of each bonded joint greater than this must be prevented by design features; or (ii) Proof testing must be conducted on each production article that will apply the critical limit design load to each critical bonded joint; or (iii) Repeatable and reliable non-destructive inspection techniques must be established that ensure the strength of each joint”. [Citation1] Since testing every single production article is unfeasible in a production line and, up to now, there is no non-destructive inspection technology adaptable to the production line that can detect weak bonds, aircraft manufacturers are left only with the first option. This results in current safety-critical bonded joints, in which at least one of the interfaces requires additional surface preparation, are always used in combination with redundant mechanical fasteners, such as rivets and bolts (fail safety design features), used as a backup in case the bond fails. This implies that current aircraft made out of more than 50% of composites still have a significant number of fasteners. This represents a huge penalty weight, since holes cut through the critical load-carrying fibers of the composites, drastically decreasing their performance. As a consequence, current composite structures have far lower strength-to-weight ratios than expected because of the use of inefficient joining technology.
The main reason for this lack of acceptance is the inability to detect lack of adhesion or interfacial failure during manufacturing and in-service life of the aircraft. Current Non-Destructive Techniques (NDT) did not prove to be able to detect a lack of adhesion at the interface, the so called “weak bonds” or “kissing bonds”, in a production environment. “Weak bonds” are characterised by a lack of adhesion strength between the adherends and the adhesive, which cannot be detected using ultrasonic C-scans (current NDT used in production). This lack of adhesion can lead to unpredictable interface failure when in-service. “Weak bonds” can be caused by either a lack of surface preparation leading to contaminations prior to bonding and/or non-fully-cured adhesives.
In the authors opinion, the challenge to predict interfacial failure can be tackled at different life stages of the bonded structure; prior to bonding, by guaranteeing a controlled and reliable surface preparations (free of contaminations); after bonding, by performing destructive tests on dummy samples (or travelling coupon samples) and/or non-destructive tests to the real structure; and finally, by using structural health monitoring (SHM) techniques during the in-service life of the bonded structure which can distinguish damage propagation at a weak bond (interface failure or adhesive failure) from damage progression at good adhesion quality bond (cohesive failure). This study aims to contribute to the development of destructive tests for dummy samples and SHM techniques to use during the in-service life.
The most common destructive test to detect lack of adhesion in composite bonded structures is the Double Cantilever Beam test. [Citation2] Research shows that the fracture surface of DCB test coupons show adhesive failure when defects such as pre-bond contamination, pre-bond moisture and uncured adhesive are present at the bond line. [Citation3,Citation4,Citation5] As a consequence, fracture toughness values under opening mode (GIC) significantly decrease, which is a direct result from the crack growing at the interface instead of inside the adhesive layer (cohesive failure–good adhesion quality). [Citation6,Citation7] The same studies also show that neither ultrasonic C-scan nor X-ray tomography are able to detect those defects prior to testing.
Significant effort has been done on mapping possible defects on bonded joints and on the limitation of existing non-destructive techniques. [Citation8,Citation9] Recently, emphasis has been given on detecting a lack of adhesion at the interface, “kissing bonds” or “weak bonds”, since the mere detection of voids prove to be insufficient to guarantee good bond quality. [Citation10] Different techniques have been investigated such as ultrasonic techniques, [Citation11–Citation14] thermography, [Citation15,Citation16] digital image correlation, [Citation17] dynamic response [Citation18] etc. Results show the dependency on compressive loads for the detectability through ultrasonic techniques [Citation19] and the potential of nonlinearity shown when “weak bonds” are illuminated with ultrasound. [Citation20] Other authors have explored the potential of laser shock waves originally developed for coating to detect weak adhesive bonds of carbon fiber-reinforced polymers. [Citation21,Citation22] Furthermore, many researchers have employed electromechanical impedance (EMI) technique; Malinowski1 et al. used the frequency shift of the first resonant mode and the root mean square as indicators to differentiate strong bonds from weak bonds. [Citation23] The authors detected a frequency change with weak bond level (contamination and level of poor curing). They used relative small specimens and the applicability of their proposed methodology is still debatable for realistic structures. Gulizzi et al. [Citation24] used EMI to monitor the degree of curing of the adhesive in aluminum joints on a larger scale in comparison to. [Citation23] Because they used low frequencies, meaning relative long wavelengths, the efficiency of the technique to localise the weaken area is questionable. More recently, Dugnani et al. proposed EMI technique by embedding piezoelectric transducers into the bondline. [Citation25] The authors predicted satisfactorily the failure of the adhesive for both joints with and without kissing bonds. Although they demonstrated the effectiveness of the technique to detect and locate damage during static loading, during fatigue loading the detection was achieved only at 60% of the joint life. Overall, to the authors’ knowledge, up to now there is no widely acceptable experimental technique in format of NDT or SHM that can reliably detect kissing bonds and/or weak bonds.
Despite the wide use of DCB test for the evaluation of bond quality in composite structures, it is a relatively time-consuming and cost-ineffective test method when only the adhesion quality is to be assessed. It is in fact a fracture mechanics test that proved to give a good evaluation on the adhesion quality but not optimized for that purpose. Therefore, there is a need for a faster and as reliable test method that can easily be used in the manufacturing line to access solely adhesion quality on composite bonded structures.
For metal bonding, the Floating roller peel test is a widely accepted industrial test to assess adhesion quality in metal structures. [Citation26] This method is commonly used in literature for adhesive screening, effect of surface pre-treatment, [Citation27,Citation28] bond durability, etc. [Citation29–Citation31] It has been found that the peel strength, measured while testing, gives an indication of the adhesion strength but it also includes the work of the plastic deformation of the thin adherend. Therefore, the mechanical characteristics of the thin adherends have a significant effect on the measured peel load. [Citation32–Citation35]
For composite bonding, such standard test method is yet to be established. Van Voast [Citation36] and Flinn [Citation37] have modified the floating roller peel test, to the so called “Rapid Test method” (RAT), in which an Aluminium adherend is bonded to the flexible one-ply-thick composite adherend. An Aluminium back-strip is then bonded in a second stage to the thin flexible adherend, prior to testing. Holtmannspötter [Citation38] suggests a similar modification but with the composite as the rigid adherend and the Aluminium as the flexible one. Due to the asymmetry of the bonded specimen in a floating roller peel tests, the crack has the tendency to grow close to the interface of the flexible adherend. Therefore, from both test modifications mentioned, RAT is the more appropriate to assess the adhesion quality of the composite bonded interface as it uses the composite as the flexible adherend. In both cases the tested bonded joint is metal-to-composite and not composite-to-composite. Recently Teixeira de Freitas [Citation39] has studied a Composite Bell Peel (CBP) test in which both flexible- and rigid adherend are composite laminates. Results show that the suggested test method is able to screen and compare the adhesion quality of different adhesives to composite adherends. The main limitation of the CBP is that intra-laminar failure of the flexible composite is more likely to occur than for example in a DCB. It remains the question if once facing a limited area of a “weak bond”, the results from a CBP would still show the lack of adhesion. This study aims to give more insight into this challenge.
Acoustic Emission (AE) technique has been employed by several researchers in order to monitor the structural integrity of adhesively bonded joints and composite structures. [Citation40–Citation42] The main goal of those studies was to locate damage within the bondline, identify whether the AE hits are generated by cohesive or adhesive failure and characterise the features of the corresponding hits. More recently, Droubi et al. used AE to study the effect of bonded quality on the failure process of adhesively bonded structures. [Citation43] Although the authors performed a large experimental campaign with different adhesives types, bond qualities and substrate configuration, they couldn’t identify a general trend between the mechanical behavior of the joints and the AE response.
The aim of this study is to contribute to the detection of weak bonds by (1) investigating the limitation of a composite peel test for assessing interfacial adhesion and by (2) monitoring the debonding mechanisms under pure mode I using AE technique to identify the features that describe interface debonding and cohesive failure.
Materials and experimental methods
Materials
Carbon Fiber Reinforced Polymer (CFRP) HexPly 8552 was used as the unidirectional prepreg epoxy resin in combination with AS4 carbon fiber (Hexcel Composites, Cambridge, UK). CFRP laminates were manufactured in the autoclave with a curing cycle of 180°C for 120 minutes at 7 bars pressure. During manufacturing, the surface of the laminates was in contact with a Fluorinated Ethylene Propylene Copolymer release film (FEP Copolymer A 4000 clear red, Airtech Europe, Niederkorn, Luxembourg).
The composite parts were bonded using the epoxy film adhesive AF 163-2K (3M Netherlands B.V., Delft, Netherlands). The bonding curing cycle was performed in the autoclave at 120°C for 90 minutes at 3 bars pressure.
Experimental methods
Surface analysis (before bonding)
In order to characterise the effect of different surface pre-treatments and of a contamination agent on the CFRP surface, contact angle measurements with distilled water were performed using a Tensiometer (KSV instrument CAM 200, Helsinki, Finland) shown in . The lower the contact angle between the drop and the surface, the better the wettability of the surface. This set of experiments was performed on small CFRP specimens (50x50 mm, layup [0°]5). Five specimens were used for each configuration and five contact angle measurements were taken for each specimen at distinctive places of the samples, as shown in .
Figure 1. Contact angle measurement instrument (KSV CAM 200).
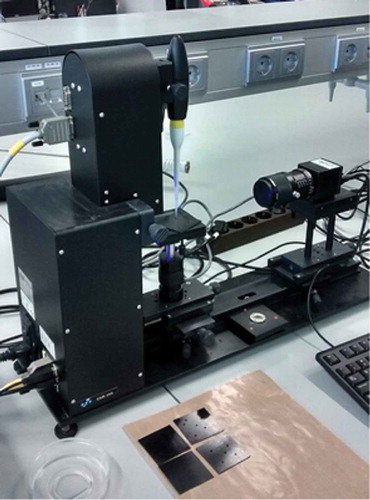
Figure 2. Contact angle measurements.
The surfaces of the CFRP were analysed for the following 4 conditions:
No treatment
Cleaned with PF-QD
Cleaned with PF-QD + Sanding + cleaned with PF-QD
Cleaned with PF-QD+UV/ozone
The PF-QD (PT Technologies Europe, Cork, Ireland) is a quick drying, low odor, residue-free cleaning solvent for surface cleaning and degreasing. [Citation44] The treatment using PF-QD is a solvent cleaning method to remove organic materials such as grease and oil from the surface. The sanding is a mechanical treatment (abrasion) and its main purpose is to generate roughness and a fresh surface area. The sandpaper used was Aluminum Oxide cloth sheets, grade 240 (KL 361 J-Flex P240, Klingspor Abrasives, Hickory, North Carolina, USA). Solvent cleaning should precede the abrasion process to ensure the contaminants do not spread further into the surface. Besides this, to obtain a clean surface after abrasion, solvent cleaning was used to remove all the dust particles generated in the process.
An in-house UV/Ozone apparatus was used consisting of three 30 watt UV-lamps with a sleeve of natural Quartz (UV-Technik, Wümbach, Germany). Wave lengths are of the order of 184.9 nm and 253.7 nm. The UV/Ozone treatment is a physical treatment consisting on the application of high intensity ultra violet light in the presence of ozone gas, generate from oxygen gas of the exposed laboratory air, to both clean and modify the surface of the specimen on a molecular level. This treatment is effective for the removal of very thin layers organic contaminants. [Citation45] This process works by decomposing the organic compounds into volatile substances (i.e. water and carbon dioxide) with the use of ultraviolet rays and by strong oxidations during the formation and decomposition of the ozone. [Citation46,Citation47] The treatment was performed at atmospheric condition. The samples were treated for seven minutes at a distance of approximately 40 mm away from the UV-lamps. shows a schematic representation of the UV/Ozone surface treatment apparatus.
Figure 3. Schematic representation of the UV/Ozone surface treatment apparatus. [Citation48]
![Figure 3. Schematic representation of the UV/Ozone surface treatment apparatus. [Citation48]](/cms/asset/c697b73d-594e-41d6-a3ca-d5ee9108c567/gadh_a_1396975_f0003_b.gif)
However, UV/Ozone is ineffective for removing inorganic contaminants. Therefore, the surface was previously cleaned with PF-QD, to remove the bulk of organic contaminants and the inorganic surface contaminants that may be present.
In some selected samples, a stripe of “weak bond” was simulated by applying surface contamination using MARBOTE 227/CEE (Marbocote Ltd, Middlewich, UK), a common release agent used in aerospace, designed to release all types of epoxy, phenolic, polyester or vinyl ester resins from steel, aluminium or composite molds. The surface of the specimen was wiped with a cloth impregnated with the release agent and left to dry for 15 minutes. This procedure was repeated six times. Weight measurements of samples before and after the contamination show a contamination weight of approximately 0.12μg/mm2. Contact angle measurements were compared before and after contamination.
In addition to contact angle measurements, Scanning Electron Microscopic (SEM) pictures were taken in some selected samples to analyse the surface after treatment, using JEOL JSM-7500F Field emission Scanning Electron Microscope (JEOL, Tokyo, Japan).
Composite bell peel tests
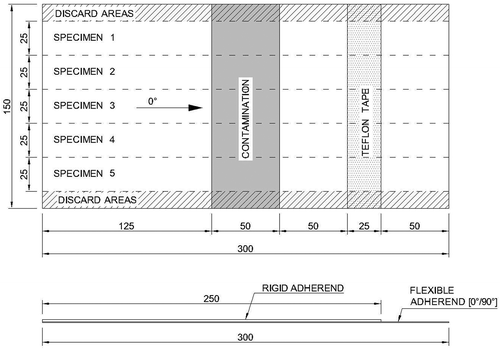
CBP tests were used for assessing the interface adhesion quality of adhesively bonded composite joints. The CBP test is a modification of the standard floating roller peel test, ASTM standard D3167. [Citation26] The adherends are Carbon Fiber Reinforced Polymer (CFRP) laminates instead of aluminium sheets. The rigid adherend is a CFRP laminate with a layup of ten plies [0°/90°/0°/90°/0°]s - approximately 1.55 mm thick–and the flexible adherend a CFRP laminate with two plies [0°/90°]–approximately 0.27 mm thick. The final specimens were manufactured by adhesively bonding the rigid adherend to the flexible adherend using AF163-2K. shows an example of the bonded test panels (with a contamination strip). The final specimens were cut from the bonded panels to 25 mm wide and 300 mm long final strip dimensions. A PROTH (PROTH Industrial Co. Ltd, Taichung, Taiwan) cutting/gridding machine with a diamond saw was used for cutting the specimens (app. 1600 rpm in steps of 100 μm through the thickness). The final adhesive thickness was determined by subtracting from the total thickness, the thicknesses of the adherends. The average ± standard deviation of the bondline thickness was 0.26 ± 0.02 mm.
Figure 4. CBP test panels with the contamination strip (dimensions in mm).
After the results from the surface analysis, three different surface treatments were selected for the destructive tests:
Cleaned with PFQD;
Cleaned with PF-QD + UV/ozone;
Cleaned with PF-QD + UV/ozone + contamination (MARBOCOTE).
The contamination was applied along 50 mm of the 300 mm length of the flexible adherend, as shown in .
shows the test setup of the CBP tests. During testing, the flexible adherend is peeled off from the rigid adherend. Testing was carried out using an electro mechanic Zwick machine with a maximum capacity of 10 kN. The testing speed was 125 mm/min. A total of five specimens were tested in each test condition. During tests, the load and the crosshead displacement were recorded.
Figure 5. CBP test set up. [Citation39]
![Figure 5. CBP test set up. [Citation39]](/cms/asset/217d3822-fb3d-49ab-ba3a-f14eaf3edbd3/gadh_a_1396975_f0005_oc.jpg)
Double cantilever beam tests
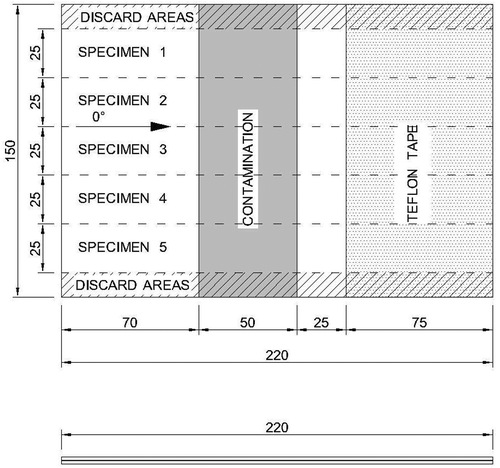
Double Cantilever Beam tests were performed in order to identify the AE features of different adhesion strengths, including a “weak bond”, and to benchmark the results from the CBP. The test procedure followed the ASTM standard D5528. [Citation2] Instead of co-curing CFRP adherends as in the standard, pre-cured CFRP adherends were adhesively bonded with AF163-2K (secondary bonding). Both adherends consisted of a laminate with 10 plies with a layup [0°]10. shows an example of the bonded test panels (with contamination). Five specimens were cut from the bonded panels to the final dimensions of 25 mm wide and 220 mm long. The final adhesive thickness was determined by subtracting from the total thickness, the thicknesses of the adherends. The average ± standard deviation bondline thickness was 0.24 ± 0.04 mm. The three different surface pre-treatments presented for the CBP test were applied in the DCB specimens. The contamination strip was applied along 50 mm of the 220 mm length, on the surface of one of the CFRP adherends (see ).
Figure 6. DCB test panels with the contamination strip (dimensions in mm).
Prior to testing, the specimens were inspected using Ultrasonic C-scan. shows a representative example of the C-scan of the contaminated specimens (squirter C-scan, 10 MHz frequency, crystal diameter 10 mm, water nozzle 8 mm diameter, scanned every 1 mm, 10 dB damping, no filters). As it can be observed, the contamination area cannot be detected by the C-scan, which proves the existence of a “weak bond” or a “kissing bonds” in the specimens. Unfortunately, C-scans of the CBP specimens prior to testing are not available, but since the contamination and manufacturing procedure was exactly the same, one can assume that also “weak bonds” are present in the CBP specimens.
Figure 7. Ultrasonic C-scan of the DCB contaminated specimens.
shows the test set up of the DCB. The tests were carried out at the same machine as the CBP tests. The testing speed was 4 mm/min. The tests were stopped when the desired crack length was reached. A camera is placed near the specimen to monitor the crack length throughout the tests.
Figure 8. DCB test set up.
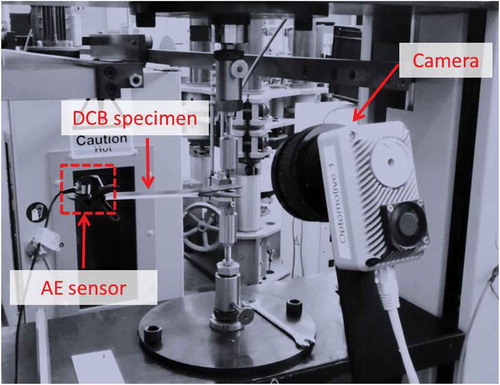
An AMSY-6 (Vallen Systeme GmbH, Icking, Germany), 8 channel AE system, was used in order to perform the AE measurements. One wide-band piezoelectric sensor AE1045S-VS900M, with external 34 dB preamplifier and a band pass filter of 20–1200 kHz, was attached on the surface of the coupon using a special clamping device. The sampling rate is 2 MHz. Ultrasonic gel coupling was applied on the sensor surface in order to maximize the conductivity between the sensor and the specimen. The AE system was continuously recording AE activity until the failure of the specimen. The sensor was positioned at the end of the specimen as shown in . A threshold of 55dB was selected and the AE data set for each AE hit contained the duration (sec), rise time (sec), peak amplitude (dB), energy (eu), the number of threshold crossings and ratio rise time to amplitude. It should be mentioned that within the purpose of this study, AE was used to identify differences between AE activities from coupons with different surface treatments and evaluate the capability of AE technique to detect the weak bonds. Localisation of the crack tip during the testing was performed with a camera, and thus only one AE sensor was used. During tests, the load and the cross head displacement were also recorded.
Results and discussion
Surface analysis results
presents the average contact angles measured for each surface treatment. shows an example of the contact angle measurements as found after the three surface treatments (no treatment, UV/ozone and contaminated).
Table 1. Contact angle measurements for different surface pre-treatments (average ± standard deviation).
Figure 9. Water drop at the surface of the CFRP and contact angle measurement.
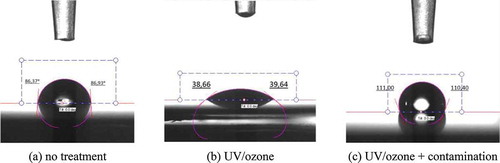
UV/ozone surface treatment results in the best wettability of the CFRP surface–the lowest contact angle. The application of MARBOCOTE in the surface increases the contact angle significantly (surface contamination).
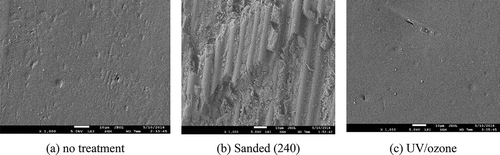
shows SEM pictures of the surfaces after the pretreatment (5.0 kV acceleration voltage, Low angle secondary electron detector – LEI). While the UV/ozone treatment seems not to change the morphology of the CFRP surface, sanding results in an increase of the surface roughness but also significant fiber break. This fiber damage is undesirable on the CFRP adherends since it may decrease the adherends performance and facilitate intralaminar failure of the composite.
Figure 10. SEM pictures of the CFRP surface after treatment (scale 1000x).
Based on the above results, it was decided to use UV/ozone as surface treatment for the follow-up destructive tests. Moreover, MARBOCOTE prove to be a good contamination agent for the CFRP surface.
Composite bell peel test results
shows examples of load displacement graphs recorded while testing specimens treated with PFQD and treated with UV/ozone with and without contamination strip. shows representative fracture surfaces corresponding to each load displacement graph.
Figure 11. Representative load displacement graphs from the CBP tests.
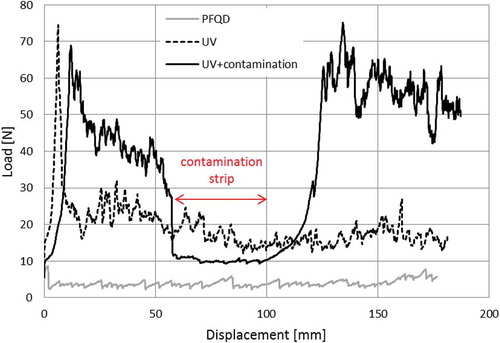
Figure 12. Typical fracture surfaces of the rigid adherend after CBP tests (CF – cohesive failure, AF – adhesive failure; ILFC – Intralaminar failure of the composite).
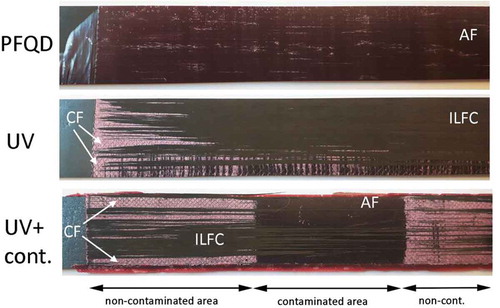
The lowest peel load occurs for the specimens cleaned only with PFQD. This is the result of the crack growing at the interface resulting in 100% adhesive failure as it can be observed in .
The second lowest peel load occurs for the specimens treated with PFQD+UV/Ozone. The final fracture surface is predominantly intralaminar failure of the composite (ILFC) - flexible adherend, with the exception of the begging of the peel length where cohesive failure is mixed with ILFC.
For the contaminated specimens (UV+contamination), a sudden drop in the peel load is observed when the crack reaches the contaminated area (weak bond) where the failure is predominantly adhesive failure, with a very low percentage of ILFC. In the non-contaminated area, the fracture shows cohesive failure in the adhesive layer and ILFC. The contaminated area (weak bond) can be clearly detected by visual observation of the fracture surface and by a drop in the load.
Important to notice that when applying UV/ozone pre-treatment, both cohesive failure in the adhesive layer and ILFC have been observed in the final fracture. The peel loads associated with these two failure mechanisms are different–the peel strength of ILFC is lower than for the cohesive failure inside the adhesive. This has been observed in previous research, not only on CBP tests but also in other bonded joint geometries. [Citation35,Citation39,Citation49] This is the reason why the peel load for UV/Ozone specimens is lower than for the non-contaminated area of the UV/Ozone contaminated specimens. The predominant failure mode is ILFC in the former and cohesive failure inside the adhesive in the later.
presents the average peel strength obtained from the CBP test related with each typical failure mode (based on visual observation of the fracture surfaces). The peel strength is the average peel load along a certain peel length, disregarding the first 15 mm of measurements. The average peel strength for the contamination was taken only with points in the contamination strip.
Table 2. Peel strength from the CBP tests (average ± standard deviation).
The weak bond has been detected using CBP tests both by a sudden drop in the load and by visual inspection of the final fracture surface. The main disadvantage of the CBP test is the intralaminar failure of the composite flexible adherend, but this did not prove to be a limitation to detect the weak bond simulated in this study.
Double cantilever beam test results
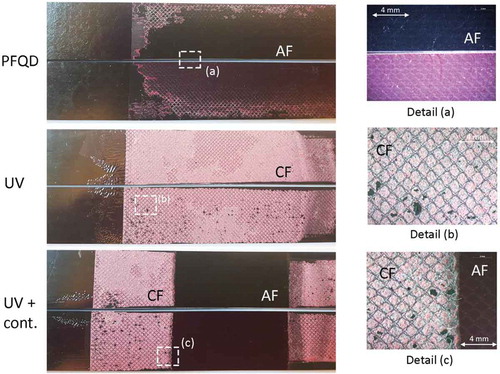
shows typical examples of the load displacement curves obtained from the DCB tests for the three different types of specimens. The corresponding final fracture surfaces are shown in , with details on typical areas of fracture surfaces taken using optical microscope.
Figure 13. Examples of load displacement graphs from the DCB tests.
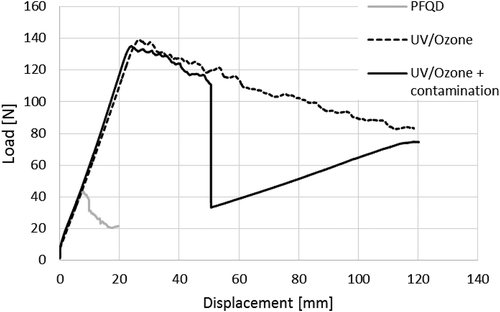
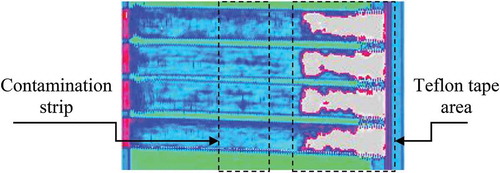
Figure 14. Typical fracture surfaces after DCB tests (CF – cohesive failure, AF – adhesive failure).
The mode I fracture toughness GIC was determined using the maximum load value and following the procedure suggested in the ASTM D5528. [Citation2] The values calculated of the fracture toughness are shown in .
Table 3. Open mode fracture toughness GIC (average ± standard deviation).
The results are in accordance with the CBP test results. Surfaces treated with PFQD present 100% adhesive failure, indicating bad adhesion. Surfaces treated with UV/Ozone present nearly 100% cohesive failure, indicating good adhesion. The contamination strip–weak bond–is also clearly detected by the DCB load-displacement curve where a sudden load drop is observed, and by a change in failure mode, from cohesive failure to adhesive failure. In the DCB tests, there is no intralaminar failure of the composite adherend. This is considered an advantage in comparison with the CBP. As expected, the fracture toughness is significantly different when the crack grows through the interface between the adherend and the adhesive (as in the PFQD case) or if the crack grows inside the adhesive layer (UV/ozone). The GIC values are also in accordance with the peel strength values. This indicates that CBP test gives the same indication of adhesion quality as DCB tests.
During DCB tests, AE sensors were attached to the DCB specimens. and shows representative examples of the AE activity obtained for specimens treated with PFQD and UV/Ozone. The different sets of AE signals are compared with their corresponding failure mechanism, as shown in . The AE activity was similar between specimens of the same test series/surface-treatment.
Figure 15. Number of hits for specimens treated with PFQD and UV/Ozone.
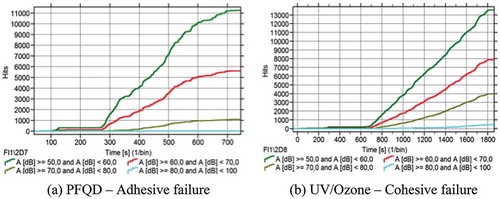
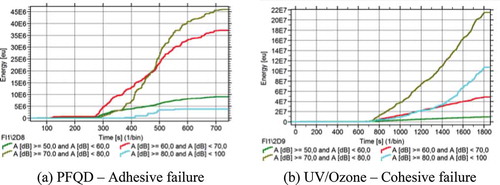
Figure 16. Cumulative energy for specimens treated with PFQD and UV/Ozone.
The hits were clustered in four groups with respective peak amplitude: Group (1) 50–60 dB, Group (2) 60–70 dB, Group (3) 70–80 dB, Group (4) 80–100dB. As can be seen in , for both specimens, the majority of the hits were found in Group (1). The results show that there is less AE activity, in terms of number of AE events, when adhesive failure occurs (PFQD – )) in comparison with cohesive failure (UV/ozone – )).
shows the cumulative energy of the AE activity for both specimens. For the case of the cohesive failure inside the adhesive layer, the cumulative AE energy is significantly higher than the case of the adhesive failure. These results are in a good agreement with the fracture toughness values presented in . The largest amount of energy was attributed to the AE hits of Group (3) and (4), in contrast to the specimens treated with PFQD for which the largest amount of energy was carried by the AE hits of group (2) and (3). As it was expected, Group (1) contains AE hits with very low energy, since the peak amplitudes are lower.
This means that, the cohesive failure process releases larger amounts of energy in comparison with the adhesive failure. The characteristic of different amounts of energy recordings is of great value and can be used as a reference, for example, during the in-service monitoring of adhesive bonded joints where the adhesion quality of the bonded joint might be unknown, and an early detection of poor adhesion can thus be achieved.
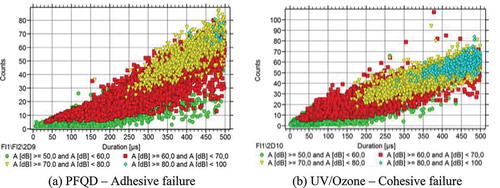
Furthermore, presents the number of counts of each AE hit in respect to their duration, for the two different specimens. The AE hits of Groups (1) and (2) (highlighted with green and red) show very similar characteristics for both specimens. However, different trends were observed for the hits of Group (3); the hits of specimens treated with PFQD range between 20 and 80 counts with duration between 250 μs and 500 μs while the hits of specimens treated with UV/Ozone range between 20 and 70 counts with duration 150 μs and 500 μs.
Figure 17. The typical number of counts in respect to the duration of measurement for each hit for the specimens treated with PFQD (a) and the specimens treated with UV/Ozone (b).
Finally, presents the cumulative hits during the DCB tests for two specimens without and with contamination, respectively. At time t=1000 s, the crack reached a length of a=25 mm of the bondline (start of contamination area) and, in contrast to the specimens without contamination where AE activity continues with the same rate, the AE activity is zero for a time period of 600 sec which corresponds to the time that the crack needed to reach the end of the contaminated area. Therefore the AE activity drops significantly in the contaminated area, following the trend of the load drop. Such information can be used for detecting contaminated areas or “weak bonds” during in-service where the crack may grow without AE activity.
Figure 18. The cumulative number of hits during the tests for specimen without and with contamination respectively.
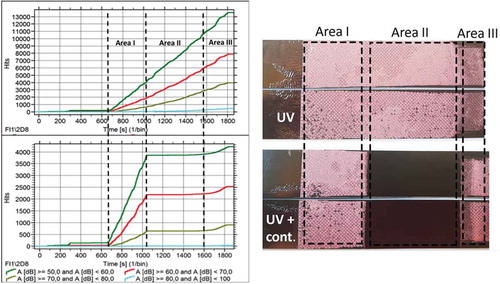
In addition, it is of great importance to be able to detect contaminated areas that result in weak bonds, at the very early stages of the operational life of the structure. As it was shown , C-scan, a well-established non-destructive technique, could not detect the weak bonds highlighting the importance to find methodologies and techniques to detect them. Within this research framework, the following methodology was followed in order to investigate the potential of AE technique to detect weak bond or kissing bonds; AE signals recorded during the crack propagation in the area I, see , were transferred in the frequency-time domain using the Gabor wavelet transformation. This transform is implemented in the AGU-Vallen wavelet module, and standard settings were used. It should be noted that 10 kHz of resolution was used as it was found to be the optimum in terms of resolution and computational time.
, presents typical samples of AE signals in frequency-time domain. The signals correspond to the hits recorded during crack propagation in Area I (see ), in contaminated and non-contaminated specimens, clustered within groups of peak amplitude ranges.
Figure 19. The frequency time analysis of AE signals recorded during crack propagation of Area I (see ), from non-contaminated and contaminated specimens.
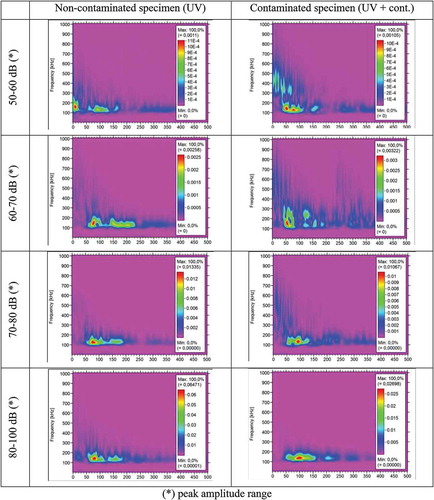
The comparison between the results of the wavelet transformation for the AE signals coming from the non-contaminated and contaminated specimens reveals that differences in the frequency bandwidth exist. For the contaminated specimens, at the beginning of the signal there is energy present in frequencies 300 kHz – 600 kHz, which is not the case for the non-contaminated specimens. During the propagation of the AE signal in the medium, the contaminated area may cause scattering of the signal. However, such scattering does not occur for the signals with the highest peak amplitudes (80–100 dB). This indicates that signals that carry large amounts of energy are not affected by kissing bonds type of defects.
Overall, it is observed that the lower the amount of energy the signal contains, the more profound the scattering phenomenon is. In this way and by using time-frequency analysis, differences between signals that propagate through a non- and contaminated area are likely to be found. However, further analysis should be performed in order to validate these preliminary results for different types of contaminations.
Conclusions
The aim of this study was to contribute to the detection of weak bonds on Carbon Fiber Reinforced Polymer structures. CBP tests were investigated as a destructive test to assess interfacial adhesion and benchmarked with double cantilever beam tests. In addition to this, crack growth was monitored during the double cantilever beam tests to evaluate the potential of the AE technique to detect interface debonding during the service life of composite bonded structures. From the results, the following conclusion can be drawn:
Bonded joints pretreated with UV/Ozone fail under open mode loading cohesively inside the adhesive layer or cohesively inside the composite adherend.
A weak bond has been successfully simulated by applying MARBOCOTE to one of the CFRP adherends prior to bonding. Ultrasonic C-scan was unable to detect the lack of interfacial adhesion at the contamination strip;
CBP tests can identify the weak bond simulated in this study by steep decrease in the peel strength and change in failure mode. The main disadvantage of this test, in comparison with double cantilever beam test, is that composite delamination of the flexible adherend also occurs. However, this has not prevented the visual observation of adhesive failure nor the drop in peel strength at the weak bond location simulated in this study.
AE monitoring can be used to assess adhesion quality of a bonded joint in pure mode I. The energy released recorded by the AE was significantly higher for cohesive failure than for the adhesive failure. The characteristic of different amounts of energy recordings can potentially be used during the in-service monitoring of adhesive bonded joints to early detection of poor adhesion (or “weak bonds”).
By using time-frequency analysis, differences between signals that propagate through a non- and contaminated area were found (only for peak amplitudes lower than 80 dB).
Acknowledgments
The authors would like to thank Isabela Vieira and Guilherme Peixoto for their contribution to this work, 3M Netherlands B.V. (Netherlands) for the adhesive material and Fokker Aerostructures for the composite material.
Additional information
Funding
References
- U.S. Dep. of Transportation: FAA, AC No: 20-107B, AIR-100. 2009.
- ASTM-D5528:01, Standard Test Method for Mode I Interlaminar Fracture Toughness of Unidirectional Fiber-Reinforced Polymer Matrix Composites. 2007.
- Markatos, D.; Tserpes, K.; Rau, E.; Markus, S.; Ehrhart, B. et al. The Effects of Manufacturing-Induced and In-Service Related Bonding Quality Reduction on the Mode-I Fracture Toughness of Composite Bonded Joints for Aeronautical Use. Compos. Part B. 2013, 45, 556–564. DOI: 10.1016/j.compositesb.2012.05.052.
- Blackman, B. K.; Johnsen, B.; Kinloch, A.; Teo, W. The Effects of Pre-Bond Moisture on the Fracture Behaviour of Adhesively-Bonded Composite Joints. J. Adhes. 2008, 84, 256–276. DOI: 10.1080/00218460801954391.
- Wetzel, M.; Holtmannspötter, J.; Gudladt, H. J.; Czarnecki, J. V. Sensitivity of Double Cantilever Beam Test to Surface Contamination and Surface Pretreatment. Int. J. Adhes. Adhes. 2013, 46, 114–121. DOI: 10.1016/j.ijadhadh.2013.06.002.
- Markatos, D. N.; Tserpes, K. I.; Rau, E.; Brune, K.; Pantelakis, S. Degradation of Mode-I Fracture Toughness of CFRP Bonded Joints due to Release Agent and Moisture Pre-Bond Contamination. J. Adhes. 2013, 90, 156–173. DOI: 10.1080/00218464.2013.770720.
- Tserpes, K.; Markatos, D.; Brune, K.; Hoffmann, M.; Rau, E. et al. A Detailed Experimental Study of the Effects of Pre-Bond Contamination with a Hydraulic Fluid, Thermal Degradation, and Poor Curing on Fracture Toughness of Composite-Bonded Joints. J. Adhes. Sci. Technol. 2014, 28, 1865–1880. DOI: 10.1080/01694243.2014.925387.
- Adams, R.; Drinkwater, B. Nondestructive testing of adhesively-bonded joints. NDT&E Int. 1990, 30, 93–98.
- Adams, R.; Cawley, P. Nondestructive Testing of Adhesively-Bonded Joints. NDT&E Int. 1988, 21, 208–222.
- Dukes, W.; Kinloch, A. Non-Destructive Testing of Bonded Joints: An Adhesion Science Viewpoint. Non-Destructive Test. 1974, 7, 324–326.
- Nagy, P. B. Ultrasonic Detection of Kissing Bonds at Adhesive Interfaces. J. Adhes. Sci. Technol. 1991, 5, 619–630. DOI: 10.1163/156856191X00521.
- Kundu, T.; Maji, A.; Ghosh, T.; Maslov, K. Detection of Kissing Bonds by Lamb Waves. Ultrasonics. 1998, 35, 573–580. DOI: 10.1016/S0041-624X(97)00095-4.
- Brotherhood, C. J.; Drinkwater, B. W.; Dixon, S. The Detectability of Kissing Bonds in Adhesive Joints Using Ultrasonic Techniques. Ultrasonics. 2003, 41, 521–529. DOI: 10.1016/S0041-624X(03)00156-2.
- Perton, M.; Blouin, A.; Monchalin, J. Adhesive Bond Testing of Carbon–Epoxy Composites by Laser Shockwave. J. Phys. D: Appl. Phys. 1998, 44, 34012. DOI: 10.1088/0022-3727/44/3/034012.
- Waugh, R. C.; Dulieu-Barton, J. M.; Quinn, S. Pulse Phase Thermography and Its Application to Kissing Defects in Adhesively Bonded Joints. Appl. Mechanics Mater. 2011, 70, 369–374. DOI: 10.4028/www.scientific.net/AMM.70.
- Tighe, R.; Dulieu-Barton, J.; Quinn, S. Identification of Kissing Defects in Adhesive Bonds Using Infrared Thermography. Int. J. Adhes. Adhes. 2015, 64, 168–178. DOI: 10.1016/j.ijadhadh.2015.10.018.
- Vijaya-Kumar, R. L.; Bhat, M. R.; Murthy, C. R. L. Evaluation of Kissing Bond in Composite Adhesive Lap Joints Using Digital Image Correlation: Preliminary Studies. Int. J. Adhes. Adhes. 2013, 42, 60–68. DOI: 10.1016/j.ijadhadh.2013.01.004.
- Yang, S.; Gu, L.; Gibson, R. Nondestructive Detection of Weak Joints in Adhesively Bonded Composite Structures. Compos. Struct. 2001, 51, 63–71. DOI: 10.1016/S0263-8223(00)00125-2.
- Brotherhood, C. J.; Drinkwater, B. W.; Guild, F. J. The Effect of Compressive Loading on the Ultrasonic Detectability of Kissing Bonds in Adhesive Joints. J. Nondestructive Eval. 2002, 21, 95–104. DOI: 10.1023/A:1022584822730.
- Yan, D.; Drinkwater, B. W.; Neild, S. A. Measurement of the Ultrasonic Nonlinearity of Kissing Bonds in Adhesive Joints. NDT&E Int. 2009, 42, 459–466. DOI: 10.1016/j.ndteint.2009.02.002.
- Berthe, L.; Arrigoni, M.; Boustie, M.; Cuq-Lelandais, J. P.; Broussillou, C.; Fabre, G.; Jeandin, M.; Guipont, V.; Nivard, M. State-Of-The-Art Laser Adhesion Test (LASAT). Nondestructive Test. Eval. 2011, 26, 303–317. DOI: 10.1080/10589759.2011.573550.
- Ehrhart, B.; Ecault, R.; Touchard, F.; Boustie, M.; Berthe, L.; Bockenheimer, C.; Valeske, B. Development of a Laser Shock Adhesion Test for the Assessment of Weak Adhesive Bonded CFRP Structures. Int. J. Adhes. Adhesives. 2014, 52, 57–65. DOI: 10.1016/j.ijadhadh.2014.04.002.
- Malinowski, P.; Wandowski, T.; Ostachowicz, W. The Use of Electromechanical Impedance Conductance Signatures for Detection of Weak Adhesive Bonds of Carbon Fibre–Reinforced Polymer. Struct. Health Monit. 2015, 14, 332–344. DOI: 10.1177/1475921715586625.
- Gulizzi, V.; Rizzo, P.; Milazzo, A. Electromechanical impedance method for the health monitoring of bonded joints: numerical modeling and experimental validation. Struct. Durabil Health Monit. 2014, 10, 19–54.
- Dugnani, R.; Zhuang, Y.; Kopsaftopoulos, F.; Chang, F. K. Adhesive Bond-Line Degradation Detection via a Cross-Correlation Electromechanical Impedance–Based Approach. Struct. Health Monit. 2016, 15, 650–667. DOI: 10.1177/1475921716655498.
- ASTM-D3167:10 Standard Test Method for Floating Roller Peel Resistance of Adhesives. 2010.
- Abrahami, S. T.; Hauffman, T.; De Kok, J. M. M.; Terryn, H.; Mol, J. M. C. Adhesive Bonding and Corrosion Performance Investigated as a Function of Aluminum Oxide Chemistry and Adhesives. Corrosion. 2017, 73, 903–914. DOI: 10.5006/2391.
- Abrahami, S. T.; Hauffman, T.; De Kok, J. M. M.; Mol, J. M. C.; Terryn, H. Effect of Anodic Aluminum Oxide Chemistry on Adhesive Bonding of Epoxy. J. Phys. Chem. C. 2016, 120, 19670–19677. DOI: 10.1021/acs.jpcc.6b04957.
- Bishopp, J. A.; Sim, E. K.; Thompson, G. E.; Wood, G. C. The Adhesively Bonded Aluminium Joint: The Effect of Pretreatment on Durability. J. Adhes. 1988, 26, 237–263. DOI: 10.1080/00218468808071288.
- Hart-Smith, L. J.;. A Peel-Type Durability Test Coupon to Assess Interfaces in Bonded, Co-Bonded, and Co-Cured Composite Structures. Int. J. Adhes. Adhes. 1999, 19, 181–191. DOI: 10.1016/S0143-7496(98)00033-5.
- Sargent, J. P.;. Durability Studies for Aerospace Applications Using Peel and Wedge Tests. Int. J. Adhes. Adhes. 2005, 25, 247–256. DOI: 10.1016/j.ijadhadh.2004.07.005.
- Crocombe, A. D.; Adams, R. D. An Elasto-Plastic Investigation of the Peel Test. J. Adhes. 1982, 13, 241–267. DOI: 10.1080/00218468208073190.
- Kim, J.; Kim, K. S.; Kim, Y. H. Mechanical Effects in Peel Adhesion Test. J. Adhes. Sci. Technol. 1989, 3, 175–187. DOI: 10.1163/156856189X00146.
- Wei, Y.; Hutchinson, J. Interface Strength, Work of Adhesion and Plasticity in the Peel Test. Int. J. Fract. 1998, 93, 1–4, 315–333.
- Teixeira De Freitas, S.; Sinke, J. Adhesion Properties of Bonded Composite-to-Aluminium Joints Using Peel Tests. J. Adhes. 2014, 90, 511–525. DOI: 10.1080/00218464.2013.850424.
- Van Voast, K.; Blohowiak, P.; Osborne, J.; Belcher, M., Rapid Test Methods for Adhesives and Adhesion. SAMPE 2013 Conference Proceedings, Long Beach, CA, May 6–9, 628–636 (2013)
- Flinn, B. D.; Clark, B. K.; Satterwhite, J.; Voast, P. J. V. Influence of peel ply type on adhesion bonding of composites. SAMPE 2008 Conference Proceedings, Long Beach, CA, June 3–7, 1–26 (2008).
- Holtmannspötter, J.; Czarnecki, J.; Gudladt, H. J. The Use of Power Ultrasound Energy to Support Interface Formation for Structural Adhesive Bonding. Int. J. Adhes. Adhes. 2010, 30, 130–138. DOI: 10.1016/j.ijadhadh.2009.10.002.
- Teixeira De Freitas, S.; Sinke, J. Test method to assess interface adhesion in composite bonding. Appl. Adhes. Sci. 2015, 3(9), 1–13. DOI: 10.1186/s40563-015-0033-5.
- Kempf, M.; Skrabala, O.; Altstädt, V. Acoustic Emission Analysis for Characterisation of Damage Mechanisms in Fibre Reinforced Thermosetting Polyurethane and Epoxy. Compos. Part B. 2014, 56, 477–483. DOI: 10.1016/j.compositesb.2013.08.080.
- Zarouchas, D.; Van Hemelrijck, D. Mechanical Characterization and Damage Assessment of Thick Adhesives for Wind Turbine Blades Using Acoustic Emission and Digital Image Correlation Techniques. J. Adhes. Sci. Technol. 2014, 28, 1500–1516. DOI: 10.1080/01694243.2012.698122.
- Zhou, W.; Liu, R.; Lv, Z.; Chen, W.; Li, X. Acoustic Emission Behaviors and Damage Mechanisms of Adhesively Bonded Single-Lap Composite Joints with Adhesive Defects. J. Reinf. Plast. Compos. 2014, 34, 84–92. DOI: 10.1177/0731684414563112.
- Droubi, M. G.; Stuart, A.; Mowat, J.; Noble, C.; Prathuru, A. K.; Faisal, N. H. Acoustic emission method to study fracture (Mode-I, II) and residual strength characteristics in composite-to-metal and metal-to-metal adhesively bonded joints. J. Adhes. 2017. DOI: 10.1080/00218464.2017.1278696.
- PSG Limited. http://www.paintservices.com/pf-qd/, 2017.
- Poulis, J. A.; Cool, J. C.; Logtenberg, E. H. P. UV/ozone Cleaning, a Convenient Alternative for High Quality Bonding Preparation. Int. J. Adhes. Adhes. 1993, 13, 89–96. DOI: 10.1016/0143-7496(93)90019-6.
- Ultraviolet-Ozone Surface treatment, Three Bond Technical News. (1987).
- Poulis, J. A.;, PhD thesis, Technical University Delft, The Netherlands, ISBN-90-370-0082-7 (1993).
- Oosterom, R.; Ahmed, T. J.; Poulis, J. A.; Bersee, H. E. N. Adhesion Performance of UHMWPE after Different Surface Modification Techniques. Med. Eng. Phys. 2006, 28, 323–330. DOI: 10.1016/j.medengphy.2005.07.009.
- Teixeira De Freitas, S.; Sinke, J. Failure analysis of adhesively-bonded skin-to-stiffener joints: Metal–metal vs. composite–metal. Eng. Fail Anal. 2015, 56, 2–13. DOI: 10.1016/j.engfailanal.2015.05.023.