
ABSTRACT
In this study, factors that improve bonded joints structural response through laser surface pre-treatment on aluminum surfaces were investigated. Specifically, the focus was put on analyzing the laser treatment conditions, formation of the interface structure, and behavior of interface strength at the adhesive interface. The results revealed a specific range of laser treatment conditions in which tensile shear strength and fracture mode are stable. Although laser-treated adhesive joints showed cohesive failure similar to that observed in sandblasting or chemical treatment during the double cantilever beam test, the fracture toughness value was improved by a factor of 2 and 1.5, respectively. The laser-induced microstructure on the aluminum interface contributed to the improvement of fracture toughness. Furthermore, observation of the adhesive layer using a microscopic mechanoluminescence measurement system revealed that changes in the 3D structure of the interface significantly altered the stress luminescence pattern reflecting strain. As a result, direct visualization of interface strengthening via laser processing was achieved.
1. Introduction
In bonding and joining, it is essential to obtain the necessary strength within the required period of time. Many researchers and engineers specialized in adhesion have focused on improving the adhesive bonding interface and developing technologies that ensure stable adhesive bonding regardless of the manufacturer, whilst also guaranteeing stable strength and quality control throughout the adhesive manufacturing process.[Citation1,Citation2] Several approaches have been employed to address the challenges posed by unstable and unpredictable interfacial failure (AF) and to achieve cohesive failure (CF), which results in stable and predictable strength. These approaches include degreasing to eliminate oil contamination that weakens bonds, chemical treatment[Citation3] to create surface nanostructures that promote the formation of an anchor effect, and blasting to roughen, grind, and clean surfaces. Flame treatment,[Citation4] atmospheric pressure plasma treatment[Citation4–6] and laser treatment,[Citation7–9] in addition to degrading surface contaminants, enable the control of the formation of reactive functional groups on the resin surface. This facilitates the establishment of reliable chemical bonds with the adhesive. The formation of chemical bonds with high cleavage energy using such surface treatments has paved the way for the use of carbon fiber reinforced plastics (CFRP) in next-generation lightweight mobility, e.g., reliable automobiles and aircraft, and has accelerated the adoption of adhesive bonding for this purpose.[Citation5,Citation10]
By contrast, despite achieving high initial strength and stable fracture through cohesive failure, it has been reported that adhesive joints used in vehicles can experience a loss of adhesive strength, with residual strength decreasing in the range of 5–10% over a period of 10 years in certain components. This deterioration can be attributed to factors such as moisture degradation, corrosion, and fatigue.[Citation11] Thus, long-term stability of adhesion interface remains a challenge. In this context, K. Dilger and S. Hartwig et al. found that laser treatment of steel surfaces attains high corrosion resistance and CF even after conducting environmental test cycles.[Citation12,Citation13] Using this as a stepping stone, we have conducted collaborative research on the factors that contribute to the long-term stability and strength improvement of adhesive interfaces. This research has been based on controlling laser treatment conditions and leveraging our original visualization and evaluation techniques, such as structural and chemical analysis of adhesive nanointerfaces using electron microscopes, evaluation of moisture degradation, which is super-accelerated from 4.5 years to 12 h, and mechanoluminescence (ML) for visualization of strain distribution.[Citation14]
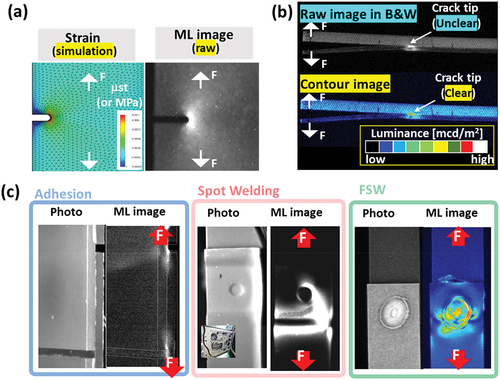
In this study, factors that improve bonded joints structural response through laser surface pre-treatment on aluminum surfaces were investigated. Specifically, the focus was put on analyzing the laser treatment conditions, formation of the interface structure, and behavior of interface strength at the adhesive interface. Direct visualization of interfacial strength was accomplished using ML technology (), which uses paint to display dynamic strain distribution as a luminescence pattern.[Citation15–25] ML technology has demonstrated its effectiveness in accurately tracking crack tips ()[Citation2,Citation20,Citation21,Citation24,Citation25] and adhesive interfaces close to locations where strain gauges are difficult to apply.[Citation2,Citation22,Citation24,Citation25] ML also enables the visualization of mechanical behavior (strain distribution behavior under load) in complex structures such as spot welds and friction stir welds ().[Citation2,Citation24,Citation25] Therefore, ML technology is considered particularly suitable for investigating the mechanical behavior of the laser-treated adhesive layer interface with the adhesive.
Figure 1. Research objective: long-term stabilization of adhesive bonding; on the right, focus of this paper.
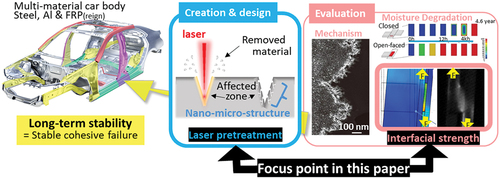
Figure 2. Properties and applications of mechanoluminescence (ML): (a) Comparison of simulation and ML image; (b) Raw and contour ML images during DCB test; (c) ML images during tensile test at various joints.
The results of this study reveal a specific range of laser treatment conditions that provide stable tensile shear strength and fracture mode. Although laser-treated adhesive joints showed CF similar to that observed in sandblasting or chemical treatment during the double cantilever beam (DCB) test, the fracture toughness value was improved. Furthermore, observation of the adhesive layer using a microscopic ML measurement system revealed that changes in the 3D structure of the interface significantly altered the stress luminescence pattern reflecting strain. As a result, direct visualization of interface strengthening via laser processing was achieved.
2. Experimental details
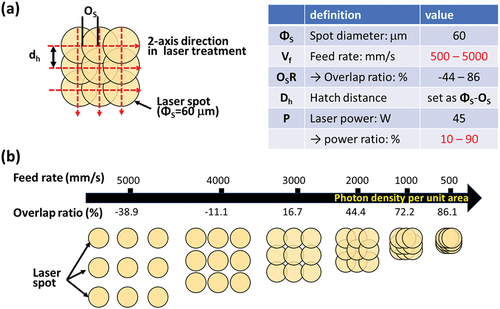
shows the conditions of laser surface pre-treatment and correlation between the feed rate (Vf) and overlap ratio (OsR). A laser scanning system (MPS-502, Keyence, Japan) equipped with a nanosecond fiber laser (λ = 1098 nm) was used for laser surface pre-treatment. Various combinations of Vf and OsR were set for varying the photon density per unit area and unit time, respectively. For example, when the feed rate was decreased from 5000 mm/s to 500 mm/s, the laser spots did not overlap with each other initially (OsR = −38.9%), according to the spot diameter and frequency. However, starting from 3000 mm/s, they showed overlap (OsR = 16.7%), eventually reaching OsR = 86.1%. The increasing overlap rate of the laser spots indicates a higher photon density per unit volume, which in turn indicates a higher processing energy.
Figure 3. Laser surface pre-treatment. (a) Conditions and definitions; (b) Correlation of feed rate (Vf) and overlap ratio (OsR).
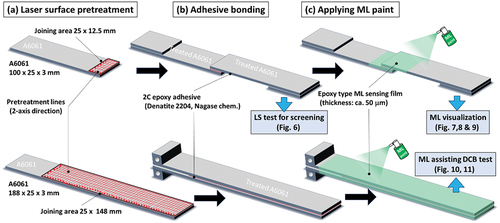
shows a schematic illustration of the workflow followed for the specimens preparation: (a) laser surface pre-treatment, (b) adhesive bonding, and (c) application of ML paint for single lap shear (SLS) and DCB test specimens (N = 3). The joining area (SLS): 12.5 × 25 mm, DCB: 148 × 25 mm) was scanned in a 2-axis direction (n = 2) using the laser treatment system on an aluminum substrate (A6061, LS: 100 × 25 × 3 mm, DCB: 188 × 25 × 3 mm) as the adherent. Epoxy adhesive (Denatite 2204, Nagase ChemteX Co., Osaka, Japan) was applied to the laser-treated area to realize adhesive bonding. The specimens were then subjected to thermal curing at 100°C for 30 min. As a benchmark, the Al substrate was treated with sand-blasting and aqueous acid etching (known as nanomolding technology (NMT))[Citation26] to obtain reference adhesive specimens.
Figure 4. Schematic illustration of preparation flow for (a) Laser surface pre-treatment; (b) Adhesive bonding, and (c) Application of ML paint to SLS and DCB test specimens.
Green-emitting europium-doped strontium aluminate (SrAl2O4:Eu2+, denoted as SAOE, λem = 520 nm) is commonly used as the core component of ML sensors owing to its high ML compared to other ML materials.[Citation2,Citation15,Citation16] Commercial ML paint (ML-32ET, Sakai Chemical. Japan) consisting of SAOE ML and epoxy resin was applied onto all four surfaces of the SLS and DCB specimens to create ML paint films (thickness = 50 μm).
The detailed conditions and settings for ML measurement are described in a previous paper accompanied by experimental movies.[Citation24] In this previous study, four CMOS cameras were positioned in front of each direction surrounding the adhesive joint to capture ML at the moment of tensile loading utilizing a testing machine (EZ-Test, Shimadzu Co., Tokyo, Japan).[Citation2,Citation25–28] Camera recording rate was set as 50 fps for SLS tests and 2 fps for DCB test in maximum gain. ML measurements were taken under dark conditions and at room temperature to eliminate environmental light and achieve a high signal-to-noise ratio. Before loading, ML paint-sprayed SLS and DCB specimen with 470-nm blue light for excitation using a blue LED from every camera direction for 1 min for reproducible results.[Citation24]
The laser-treated aluminum surface and fracture surface were observed conducting SLS and DCB tests using a scanning electronic microscope (SEM. S5000, JEOL, Japan) and a 3D digital optical microscope and profiler (K-5000, KEYENCE, Japan). All preparations and measurements were carried out under ambient conditions.
3. Results and discussion
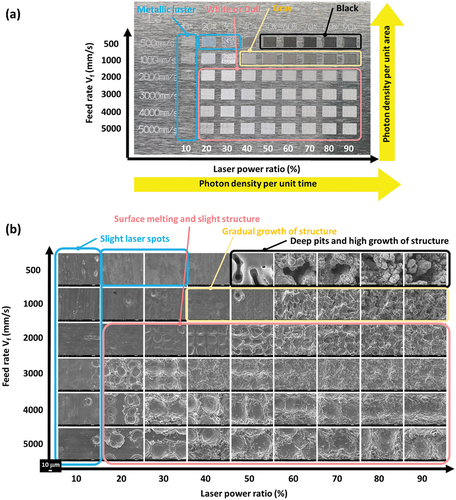
shows pictures and SEM images of a laser-treated surface of A6061 substrate for various combinations of Vf (500–5000 mm/s) and laser power ratio (10–90%), to vary the photon density per unit area and time, respectively. The lower left image represents a condition with a lower laser power ratio and a higher feed rate, resulting in a lower photon density for processing. For example, within the 10% laser intensity ratio range, the treated area shown in the picture exhibited a metallic luster while the SEM image only displays faint laser traces, indicating limited treatment (light blue area). Increasing the laser power ratio, such as in the 20% laser power ratio column, while maintaining the fastest feed rate of 5000 mm/s (OsR: −39. %) reveals that the laser spot marks did not overlap, as depicted in . In addition, a rippled structure was observed around the edge of the laser spot mark, suggesting thermal effects and metal melting during the treatment process (laser melting). Comparing the vertical rows of SEM images at the same laser power ratio of 20%, it is evident that the laser spot marks gradually overlapped as the feed speed decreased. In addition, focusing on the horizontal row at a feed rate of 5000 mm/s and observing the effect of laser power ratio, an increase in the size of laser spot marks was observed for higher laser power ratios up to an intensity ratio of 30%, which corresponds to the size of a leather spot (60 μm). Subsequently, the molten structure surrounding the laser spots expanded radially, covering the entire surface, even though the laser spots themselves did not overlap. The area characterized by this molten structure (red frame) is highlighted in white in . Furthermore, as the feed rate was decreased and the photon density per unit area was increased, the surface structure began to grow (yellow frame, gray in the picture). When the input photon density reached a feed rate of 500 mm/s (OsR: 86.9%) and laser power ratio of 50%, it can be considered that the ablation threshold was exceeded for aluminum surface, and the formation of deep pits and bulky 3D microstructures was observed (black frame, also black in the picture). In conclusion, by controlling the laser processing conditions, in particular the photon density, feed rate, and intensity ratio, it is possible to intentionally create the required surface structure.
Figure 5. Picture and SEM images of laser treated surface of A6061 substrate for various combination of feed rate Vf (500–5000 mm/s) and laser power ratio (10–90%).
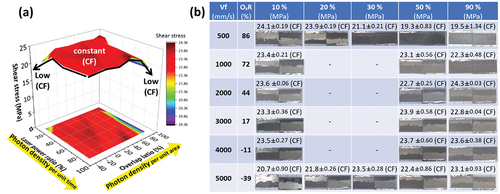
The aluminum substrates treated with the explored laser processing conditions were used to create single lap joints. These joints were summarized in a 3D contour map and 2D projection map with the laser power ratio represented on the x-axis, overlap ratio (OsR) on the y-axis, and shear strength on the z-axis, as shown in . shows a table of shear stress and pictures of fracture surface for each treatment condition. Stable CF was observed under all laser treatment conditions. Regarding shear stress, a decrease in bond strength was observed at low photon densities (e.g., Vf = 5000 mm/s, OsR = 10%), suggesting insufficient surface treatment. Similarly, high photon densities (e.g., Vf = 500 mm/s, OsR = 90%) resulted in excessive growth of surface 3D structures. However, shear stress remained stable at 22–23 MPa across most treated photon density regions, highlighted in red.
Figure 6. Results of SLS tests. (a) Plots of shear stress in 3D counter and 2D projection map; (b) List of shear stress values in average (N = 3) and photos of fracture surface.
In fact, our initial expectation was that bulky 3D microstructures (e.g., materials with Vf = 500 mm/s, OsR = 90%), would yield the most effective treatment for improving interfacial strength, particularly in terms of the anchoring effect. However, contrary to our expectations, we observed a decrease in shear stress. To further investigate this phenomenon, three samples were compared with different 3D structures (melting, microgrowth, and bulky growth), varying shear stress levels and treatment conditions (Vf = 500 mm/s-OsR = 90%; Vf = 1000 mm/s-OsR = 90%; and Vf = 2000 mm/s-OsR = 90%). To gain a better understanding of the interface strength and strain distribution, we employed ML to visualize the samples.
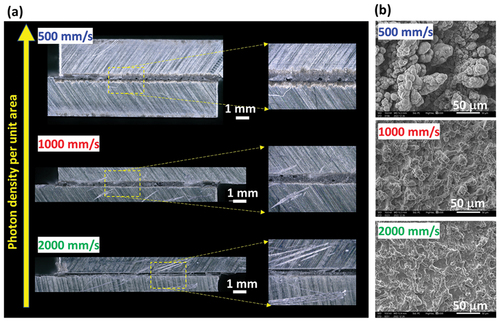
Let us consider now the thickness of the adhesive layer. shows a comparison of the microscopic image of the adhesive layer, its magnified view, and SEM image of the laser-induced microstructure before bonding. Although we aimed to control the thickness of the adhesive layer by using glass beads (translation of 200 μm) during specimen preparation, it was evident that the thickness of the adhesive layer increased as the feed rate during laser processing decreased to Vf = 2000, 1000, and 500 mm/s. This can be attributed to the bulky growth of the 3D structure of the interface observed in the SEM images. The increase in photon density per unit area during the treatment, which is associated with the laser-treated layer thickness, is believed to be the cause of this phenomenon.
Figure 7. Observation of effect in adhesive thickness of SLS specimen for ML measurement. (a) Microscope observation of adhesive layer after adhesively bonding and (b) SEM images of laser-induced 3D micro-structure on aluminum (A6061) substrate.
summarizes the experimental setup, shear stress, observed fracture surface, adhesive thickness values remaining on both adherends after fracture, and sum of these values from ML measurements during the SLS test. As the feed rate during laser processing was decreased to Vf = 2000, 1000, and 500 mm/s, and the photon density was increased in excess, the shear stress decreased from 22.5 MPa (observed in the sample processed at Vf = 2000 mm/s, within the stable strength range of 22–23 MPa shown in ) to approximately 19 MPa for the sample processed at Vf = 500 mm/s (). The observation of the fracture surface showed that all specimens exhibited CF occurring within the adhesive layer. However, the appearance of the fracture surface varied significantly. In the case of the sample treated at Vf = 2000 mm/s, the adhesive thickness remaining on the fracture surface of both adherends was measured to be 158 μm and 80 μm (for a total of 238 μm, ). This indicates a thin-layer CF on one side in which a crack propagates near each interface in the adhesive layer from top and bottom to the center of the adhesive lap area, ultimately resulting in a transverse crack across the adhesive layer and rupture.
Figure 8. SLS test. (a) Schematic illustration of experimental set-up to identify the recording view of mechanoluminescence in ; (b) Plots of shear stress values and sum of thickness of residual adhesive layers on fracture surface; (c) Pictures of fracture surface and illustration of crack propagating behavior.
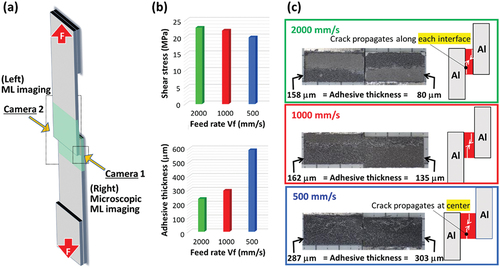
By contrast, in the case of the sample treated at Vf = 500 mm/s, the adhesive thickness remaining on the fracture surface of both adherends was almost the same: 287 μm and 303 μm (for a total of 590 μm, ). This suggests that both cracks originated from the upper and lower edges of the lapped area and propagated near the center of the adhesive layer. Previous studies on bond thickness and bond strength in SLS tests reported that bond strength tends to decrease as bond thickness increases,[Citation29,Citation30] which is consistent with the present results.
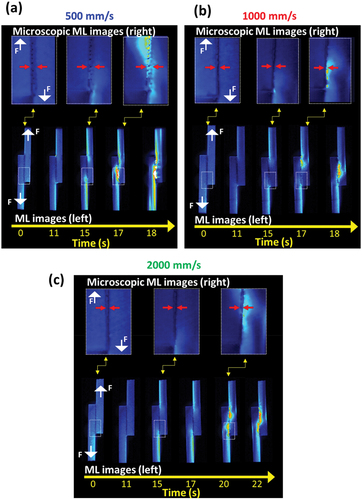
Stress luminescence measurements were taken to further explore the effect of the differences in both the fracture surface and appearance at break described above, as well as the mechanical behavior near the interface, which influences the adhesive strength of laser treatment. To further focus on the adhesive layer, in addition to ML measurements using a conventional CMOS camera on the left side of the specimen, ML microscopic measurements using a CMOS camera with a magnifying lens were taken on the other side of the adhesive layer, as shown in . illustrates the time segments of ML microscopic images and ML images during the SLS test of adhesive joints using laser-treated aluminum substrates under different feed rates of (a) 500, (b) 1000, and (c) 2000 mm/s. In the microscopic ML images, the red arrows indicate both edges of the interface adhesive layer. In the conventional ML image, the ML behavior reflecting dynamic strain distribution appears to be similar across the laser-treated specimen. ML points reflecting strain concentration were observed at the upper and lower edges of the adhesive layer, with a change in ML pattern accompanying crack propagation from the top and bottom edges to the center. Finally, strong emission associated with transverse cracking across the adhesive layer was observed at the center, leading to fracture. The microscopic ML images, which focused on the adhesive layer, revealed clear differences in the emission patterns based on the photon density of each laser treatment, indicating variations in the strain distribution behavior near the interface. Specifically, for sample treated at Vf = 500 mm/s, where a bulky 3D microstructure formed at the adherend interface, the luminescence extended to the area between the relative arrows, encompassing the adhesive layer. More precisely, luminescence was observed throughout the left half of the adhesive layer at the top and right half at the bottom. Furthermore, high-stress emission was localized around the center of the adhesive layer. This can be explained by the fact that, although the externally observable adhesive layer is within the apparent range of the arrows, the laser-induced bulky 3D microstructures effectively transferred the strain to deformation of the entire adhesive layer. While cracks propagate in the center between adherends with both of these bulky 3D structures, their deformability within the adhesive layer exceeds that of the bulk aluminum, resulting in concentrated strain distribution in this area. Note also that as the photon density decreased and the laser-induced growth of the surface structure reduced, the emission region in the adhesive layer became thinner and closer to the interface, which indicates concentrated strain along the interface (). Furthermore, the sample treated at Vf = 2000 mm/s, in which structure formation was suppressed by surface melting alone, exhibited strong luminescence near the interface, with the luminescence distribution extending towards the adherend. These differences in emission patterns are the first direct visualization of change in strain distribution within the adhesive layer depending on the laser treatment conditions. They effectively explain the fracture mode of the fracture surface in .
Figure 9. Visualization of dynamic strain distribution over time using ML microscopic images and ML images of adhesive joints obtained during SLS test using laser-treated aluminum substrates. Feed rate: (a) 500, (b) 1000, (c) 2000 mm/s. The red arrows indicate the interface between the two sides of the adhesive layer. White arrows with the F character indicates the load direction during tensile test.
Next, the fracture toughness values of the laser-treated adhesive specimens were examined using the DCB test ().
Figure 10. Results of DCB tests using laser-treated aluminum substrates. Feed rate: 500,1000, 2000, 3000, 40000 and 5000 mm/s. (a) R curves, (b) ML images for crack tip monitoring, (c) Comparison of fracture toughness values, (d) Photos of fracture surface, (e) Microscopic image and 2D profiles of fracture surface (vf = 500 and 2000 mm/s.) and (f) Their illustration regarding to crack propagation.
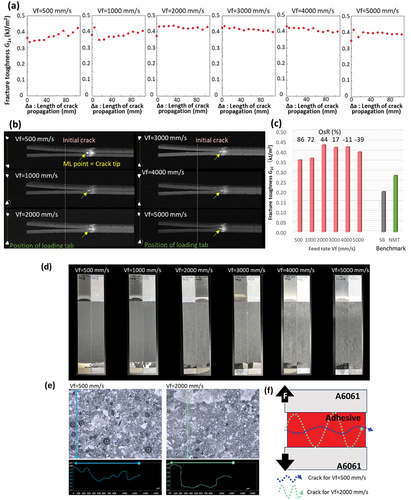
The DCB specimens were treated at different feed rates of Vf = 500, 1000, 2000, 3000, 4000, and 5000 mm/s (OsR = 86, 72, 44, 17, −11, and −39%, respectively) at a laser intensity ratio of 90%. These conditions were compared to those used in the SLS test shown in . Aluminum substrates were utilized for the experiments.
To determine the energy release rate to be used as fracture toughness value, information on the crack tip was obtained from the location of the ML point () and incorporated in the R curve (). The average energy release rate values at five points in the crack length range of 20–60 mm were summarized into the fracture toughness value (). The highest value of 0.43 kJ/m2 was obtained for the sample treated at Vf = 2000 mm/s. As the photon density was increased to grow the interfacial 3D structure, the values decreased to approximately 0.36 kJ/m2 for the sample treated at Vf = 1000 mm/s, and 0.35 kJ/m2 for the sample treated at Vf = 500 mm/s. The results of the SLS tests are consistent. Interestingly, as the feed rate was increased from Vf = 2000 mm/s to 5000 mm/s and the photon density was decreased, the energy release rate tended to decrease. This trend differs from that of the SLS test, which exhibited a nearly consistent bond strength regime. The DCB test is particularly sensitive to the opening mode (mode I) crack propagation and reflecting surface conditions. Despite all samples exhibited CF, the fracture toughness values varied slightly depending on the laser treatment conditions. However, the laser-treated specimens demonstrated a twofold increase in fracture toughness compared to conventional surface pre-treatment methods such as sandblasting and chemical etching (NMT). Observation of the fracture surface after testing revealed a characteristic black-and-white random pattern in the laser-treated specimens. It was also found that the shading of this pattern tends to become lighter for the same laser-treated samples processed at Vf = 500 mm/s and 1000 mm/s, where a decrease in fracture toughness values was observed. To further investigate this point, we conducted 3D microscopic observations of the fracture surface and evaluated the line profile of the fracture surface (). For the specimen treated at Vf = 2000 mm/s, which featured the aforementioned characteristic black-and-white random pattern, a structure with a height of 200–250 μm was observed, indicating non-linear crack propagation during the DCB test with meandering in the adhesive layer (). For the sample treated at Vf = 500 mm/s, where the fracture toughness value was reduced, the unevenness at the interface was suppressed to approximately 150 μm, and the lighter shading of the black-and-white random pattern can be attributed to the suppression of meandering during crack propagation. Similar behavior was observed in the sandblasted and chemically etched substrates used for comparison.[Citation2,Citation20,Citation21,Citation24,Citation25] Therefore, the increase in fracture toughness values after laser treatment, despite CF, can be attributed to the 3D microstructure at the interface induced by the laser treatment, which acts as a crack arrester[Citation31,Citation32] and induces meandering of crack propagation.[Citation33,Citation34]
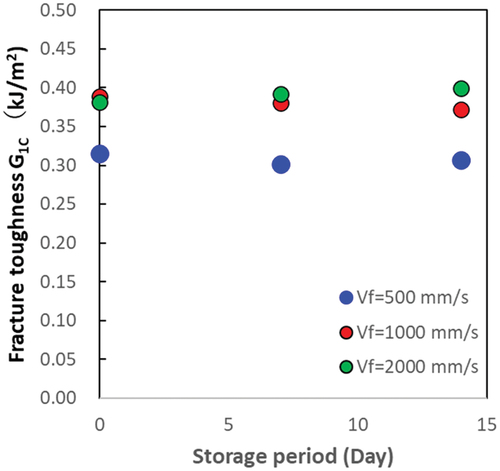
Finally, from the perspective of manufacturing stability of the laser treatment, changes in fracture toughness values were evaluated by intentionally varying the storage time between laser treatment and adhesion (). Three samples with different growth of interfacial 3D microstructures (laser power ratio: 90%, feed rate Vf = 500, 100,0 and 2000 mm/s) were used for comparison. The results demonstrated that the initial laser-treated substrate with any interface structure remained stable for up to 2 weeks of storage without significant changes in fracture toughness values. Understanding the “specification limit” within which production conditions can be stably manufactured, as well as the mechanisms behind it, is crucial for quality control in adhesive bonding production. Future research will aim to establish specification limits for storage time, incorporating contact angle and chemical analysis.
Figure 11. Effect of storage term on fracture toughness (G1C) after laser pretreatment to adhesive bonding. Storage condition.: ambient temperature and humidity, around 23°C and 40–50%RH, in air-conditioning condition.
4. Conclusions
In this study, factors that improve adhesive strength through laser surface pre-treatment on aluminum surfaces were investigated. Specifically, the focus was put on analyzing the laser treatment conditions, formation of the interface structure, and behavior of interface strength at the adhesive interface. The findings have led to the identification of a specific range of laser treatment conditions that yield stable tensile shear strength and fracture modes. Although laser-treated adhesive joints showed CF similar to that observed in sandblasting or chemical treatment during the DCB test, the fracture toughness value was improved by a factor of 2 and 1.5, respectively. The laser-induced microstructure on the aluminum interface contributed to the improvement of fracture toughness. Furthermore, observation of the adhesive layer using a microscopic ML measurement system revealed that changes in the 3D structure of the interface significantly altered the stress luminescence pattern reflecting strain. As a result, direct visualization of interface strengthening via laser processing was achieved.
As mentioned above, this study aimed to elucidate the factors contributing to long-term stability of adhesive interface and strength improvement for long-term stability of adhesive strength. While this study primarily focused on the strength improvement factors, it is important to note that we are also exploring processing conditions that exhibit stable CF even under challenging conditions such as fatigue, moisture-accelerated degradation, and high-temperature and high-humidity environments. Our future research will delve deeper into achieving long-term stability of adhesion by exploring the underlying factors and implementing effective quality control measures during the manufacturing process.
Acknowledgments
N. T. is grateful to Prof. Dr.-Ing. Klaus Dilger (Technical University Braunschweig) for his valuable assistance and efforts on accelerating the international collaboration between AIST, Technical University Braunschweig, and open hybrid lab factory (OHLF).
N. T. extends appreciation to Ms. C. Hirakawa for her work on laser pre-treatment, Ms. Y. Sakamoto for her assistance in preparing the SLS specimens and conducting the tensile tests, Ms. M. Iseki for her involvement in preparing DCB specimens, Ms. Y. Nogami for her contributions in spraying ML paint, and Ms. Y. Sugawa and Ms. M. Tsuyama, from the 4D visual sensing team (AIST), for their support in ML testing.
Disclosure statement
No potential conflict of interest was reported by the author(s).
Additional information
Funding
References
- Da Silva, L. F. M.; Öchsner, A.; Adams, R. Handbook of Adhesion Technology, 3rd ed.; Cham: Springer, 2018.
- Horiuchi, S.; Terasaki, N.; Miyamae, T. Interfacial Phenomena in Adhesion and Adhesive Bonding, 1st ed.; 2024 Edition; Singapore: Springer, 2023.
- Holtmannspötter, J.; Hofmann, F.; Zimmer, T.; Gudladt, H. J.; Gudladt, H.-J. The Role of Chemical Surface Modification for Structural Adhesive Bonding on Polymers - Washability of Chemical Functionalization without Reducing Adhesion. Int. J. Adhes. Adhes. 2019, 102409, 1–9. DOI: 10.1016/j.ijadhadh.2019.102409.
- Sato, T.; Ise, S.; Horiuchi, S.; Akiyam, H.; Miyamae, A. Influences of Low-Temperature Ambient Pressure N2 Plasma and Flame Treatments on Polypropylene Surfaces. Int. J. Adhes. Adhes. 2019, 9, 376–382. DOI: 10.1016/j.ijadhadh.2019.01.016.
- Elmarakbi, A. Advanced Composite Materials for Automotive Applications: Structural Integrity and Crashworthiness 2013. John Wiley & Sons, Ltd. DOI: 10.1002/9781118535288.
- Rhee, K. Y.; Yang, J.-H. A Study on the Peel and Shear Strength of Aluminum/CFRP Composites Surface-Treated by Plasma and Ion Assisted Reaction Method. Comp. Sci. Technol. 2003, 63(1), 33–40. DOI: 10.1016/S0266-3538(02)00145-8.
- Reisgen, U.; Schleserb, N. Laser Assisted Joining of Plastic Metal Hybrids. Phys Procedia. 2011, 12, 370–377. DOI: 10.1016/j.phpro.2011.03.146.
- Soriano, E.; Leunda, C. S.; Verhaeghe, G. Effect of Metal Micro-Structuring on the Mechanical Behavior of Polymer–Metal Laser T-Joints. J. Mater. Pro.Technol. 2016, 229, 668–677. DOI: 10.1016/j.jmatprotec.2015.10.026.
- Harder, S.; Schmutzler, H.; Hergoss, F. D.; Jetter, F.; Holtmannspötter, J.; Fiedler, B. Effect of Infrared Laser Surface Treatment on the Morphology and Adhesive Properties of Scarfed CFRP Surfaces. Compos. Part A. 2019, 121(212019), 299–307. DOI: 10.1016/j.compositesa.2019.02.025.
- Encinas, N.; Oakley, B. R.; Belcher, M. A. K.; Blohowiak, Y.; Dillingham, R. G.; Abenojar, M. A.; Martínez, U. Surface Modification of Aircraft Used Composites for Adhesive Bonding. Int. J. Adhes. Adhes. 2014, 50, 157–163. DOI: 10.1016/j.ijadhadh.2014.01.004.
- Masanori, A. Kobelco-Kaken Tech Report, Accelerated Evaluation Technology Considering Real-World Environmental Degradation of Adhesive Joints. 2020. https://www.kobelcokaken.co.jp/tech_library/pdf/no50/a.pdf.
- Lippky, K.; Mund, M.; Blass, D.; Dilger, K. Investigation of Hybrid Fusion Bonds Under Varying Manufacturing and Operating Procedures, Composite Structures. Compos. Struct. 2018, 202, 275–282. DOI: 10.1016/j.compstruct.2018.01.078.
- Lippky, K.; Hartwig, S.; Blass, D.; Dilger, K. Bonding Performance After Aging of Fusion Bonded Hybrid Joints. Int. J. Adhes. Adhes. 2019, 93, 19–31. DOI: 10.1016/j.ijadhadh.2019.01.025.
- Terasaki, N. Project: Long-Term Stabilization of Automotive Adhesion and the Interfacial Design Commissioned by NEDO. 2021-2024. https://www.nedo.go.jp/content/100939450.pdf
- Xu, C. N.; Watanabe, T.; Akiyama, M.; Zheng, X. G. Direct View of Stress Distribution in Solid by Mechanoluminescence. Appl. Phys. Lett. 1999, 74(17), 2414–2416. DOI: 10.1063/1.123865.
- Terasaki, N. Innovative first step toward mechanoluminescent ubiquitous light source for trillion sensors. Sens. Mater. 2016, 28, 827–836.
- Terasaki, N. ML Movies, (A) Movies of Mechanoluminescence Sensing, Lectured by N. Terasaki; AIST https://www.youtube.com/watch?v=7fsA-POmKjA, (b) Mechanoluminescence (ML) Introduction in science view, broadcasted by NHK world, Protecting Infrastructure by Visualizing Stress, https://www3.nhk.or.jp/nhkworld/en/tv/scienceview/20220222/2015274/ (b) ML movies in AIST official account on YouTube. (c) ML paper cup, https://www.youtube.com/watch?v=ose3T1Gd2SU, (d) Mechanoluminescence under tensile load for perforated SUS631 specimen, https://www.youtube.com/watch?v=PSzTvntGTM4, (e) Mechanoluminescence during front collision test, https://www.youtube.com/watch?v=JElP-4Zvl5w.
- Terasaki, N.; Xu, C. N.; Yasuda, K.; Ichinose, L. Fatigue Crack Detection of Steel Truss Bridge by Using Mechanoluminescent Sensor. Proc. Int. Conf. Bridge. Maint. Saf. Manag. 2012, 6, 2542–2549.
- Terasaki, N.; Xu, C.-N. Historical-Log Recording System for Crack Opening and Growth Based on Mechanoluminescent Flexible Sensor. IEEE Sens. J. 2013, 13(10), 3999–4004. DOI: 10.1109/JSEN.2013.2264665.
- Terasaki, N.; Fujio, Y.; Sakata, Y.; Horiuchi, S.; Akiyama, H. Visualization of Crack Propagation for Assisting Double Cantilever Beam Test Through Mechanoluminescence. J. Adhesion. 2018, 94(11), 867–879. DOI: 10.1080/00218464.2018.1423968.
- Terasaki, N.; Fujio, Y.; Horiuchi, S.; Akiyama, H. Mechanoluminescent Studies of Failure Line on Double Cantilever Beam (DCB) and Tapered-DCB (TDCB) Test with Similar and Dissimilar Material Joints. Int. J. Adhes. Adhes. 2019, 93, 40–46. DOI: 10.1016/j.ijadhadh.2019.01.022.
- Terasaki, N.; Fujio, Y.; Sakata, Y.; Uehara, M.; Tabaru, T. Direct Visualization of Stress Distribution Related to Adhesive Through Mechanoluminescence. ECS Trans. 2017, 75(45), 9–16. DOI: 10.1149/07545.0009ecst.
- Terasaki, N.; Fujio, Y.; Horiuchi, S.; Akiyama, H.; Itabashi, M. Mechanoluminescent Study for Optimization of Joint Design by Cross Tension Test. J. Adhesion. 2022, 98(6), 637–646. DOI: 10.1080/00218464.2021.2009807.
- Terasaki, N.; Fujio, Y. Mechanoluminescent Visualization of Crack Propagation for Joint Evaluation. J. Vis. Exp. 2023, 191, e64118. DOI: 10.3791/64118.
- ISO/DIS 8065, Composites and Reinforcements Fibres — Mechanoluminescent Visualization Method of Crack Propagation for Joint Evaluation.
- Horiuchi, S.; Terasaki, N.; Itabashi, M. Evaluation of the Properties of Plastic-Metal Interfaces Directly Bonded via Injection Molding. Manuf. Rev. 2020, 7, 1–9. DOI: 10.1051/mfreview/2020004.
- ISO 4587: 2003(en) Adhesives—Determination of Tensile Lap-Shear Strength of Rigid-To-Rigid Bonded Assemblies
- ISO 22841: 2021 Composites and Reinforcements Fibres—Carbon Fibre Reinforced Plastics (CFRPs) and Metal Assemblies—Determination of the Tensile Lap-Shear Strength
- ISO 15024: 2023, Fibre-Reinforced Plastic Composites — Determination of Mode I Interlaminar Fracture Toughness, GIC, for Unidirectionally Reinforced Materials.
- ISO 22838: 2020, Composites and Reinforcements Fibres — Determination of the Fracture Energy of Bonded Plates of Carbon Fibre Reinforced Plastics (CFRPs) and Metal Using Double Cantilever Beam Specimens.
- Da Silva, L. F. M.; Rodrigues, T. N. S. S.; Figueiredo, M. A. V.; De Moura, M. F. S. F.; Chousal, J. A. G. Effect of Adhesive Type and Thickness on the Lap Shear Strength. J. Adhes. 2006, 82(11), 1091–1115. DOI: 10.1080/00218460600948511.
- Grant, L. D. R.; Adams, R. D.; Da Silva, L. F. M. Effect of the Temperature on the Strength of Adhesively Bonded Single Lap and T Joints for the Automotive Industry. Inter. J. Adhes. Adhes. 2009, 29(5), 535–542. DOI: 10.1016/j.ijadhadh.2009.01.002.
- Sun, F.; Pruncu, C. I.; Penchev, P.; Jiang, J.; Dimov, S.; Blackman, B. R. K. Influence of Surface Micropatterns on the Mode I Fracture Toughness of Adhesively Bonded Joints. Int.J. Adhes. Adhes. 2020, 103, 102718. DOI: 10.1016/j.ijadhadh.2020.102718.
- Hirakawa, R.; Yasuoka, T.; Mizutani, Y. Crack-Arresting Behavior of Adhesively Bonded Joints with a Single Rectangular Convex/Concave Shape Formed on Adherend Surfaces. J. Adhes. 2023, 99(7), 1142–1167. DOI: 10.1080/00218464.2022.2088282.