
 ?Mathematical formulae have been encoded as MathML and are displayed in this HTML version using MathJax in order to improve their display. Uncheck the box to turn MathJax off. This feature requires Javascript. Click on a formula to zoom.
ABSTRACT
Damages in composite structures are typically repaired using external bonded patches. In this work, the damage tolerance within external patches is studied using double strap joint (DSJ) with carbon fibre reinforced plastic (CFRP) specimens. The damage tolerance in this work refers to bond-line manufacturing-related defects such as debond or dry area. Both intact and pre-cracked DSJ specimens are numerically analysed using experiments for comparisons. DSJ specimens’ adherends were CFRP laminates with AS4/3501–6 plies and bonded using adhesive film FM 300–2. The pre-cracked specimens are monitored during experiments using high-speed digital image correlation to visualize damage propagation. The unsymmetric pre-crack influences in a clear way as shown by experiments. The numerical analyses reveal the effect of failure mechanisms on final failure and the maximum force during a test. The included parametric sensitivity analysis is performed using statistical methods. The normally distributed parameters are sampled using separate distributions for each analysed interface and fracture mode. UNCLASSIFIED Based on Foreground Information under EDA Contract No B.PRJ.RT.670 covering the Ad Hoc Project entitled ”PATCHBOND II”.
1. Introduction
Composite structures are often repaired using adhesively bonded joints. The usage of adhesively bonded joints has several advantages, but also challenges remain[Citation1,Citation2] The bonded joint geometry has an influence on the joint's strength.[Citation3] The external patch (also known as doubler) repairs are typically used in thin structures while they are not providing as high joint strength as scarf and step repairs.[Citation4] One-sided (unsymmetric) and two-sided (symmetric) external patches are commonly used depending on the access to the opposite side. For developing repair techniques for the external patches and analysing damage tolerance, the simplicity of the (experimental) specimen is an advantage. For that reason, double strap joint (DSJ) coupon specimens are often considered to be representative for the symmetrical external patches. The damage tolerance of a structure is important because adhesively bonded repairs can meet defects during the lifetime. These defects are not allowed to endanger the load carrying capability of the joint.
The defect’s effect on the bonded joint has been experimentally investigated in the literature. Glass fibre reinforced plastic (GFRP) DSJ coupons have been analysed in terms of damage tolerance.[Citation5] Bond line defects were not seen to alter failure behaviour, which was sudden and occurred in a brittle manner. The pre-test defect size and location were also varied in the work.[Citation5] Delamination was seen to be the likely failure mode when defects did not exist. The addition of pre-test defects changed the failure towards a mixed failure mode where debonding also occurred. The similar change from delamination to combined failure of delamination and steel-CFRP (carbon fibre reinforced plastic) interfacial debonding was reported in a work for CFRP-steel DSJs.[Citation6] Multiple small defects decreased the joint strength more than single defects with the comparable region. Damage initiation in DSJ joints has been reported to take place at the end of the strap in DSJ joints with GFRP adherends,[Citation7] and highlighted the peeling effect on the joint failure.
Another approach of development, in addition to experiments, is to study the damage tolerance using analytical and numerical analysis. Analytical solutions for DSJ stresses have been developed in the current literature.[Citation8,Citation9] The DSJ peel and shear stress distributions show highest values at the ends of the bond line.[Citation10] The effects of fillet shape on stresses have been studied numerically in single lap joints.[Citation11] The improvement of the DSJ joint strength has been studied by modifying the joint geometry[Citation12] and by using the bi-adhesive technique.[Citation13] The defects typical of DSJ (i.e. debond and dry spots) have been investigated numerically using cohesive zone model (CZM) in the literature. The ability of CZM for simulating cohesive failure in single and double strap configuration was shown in a work.[Citation14] The study showed that defects away from overlap ends have little effect on adhesive damage in double strap joint when the defect size is less than 30% of the total bonded area.[Citation14] Several studies have widely focused on bond line defects, such as debond or dry area. However, the failure mode at the joint with composite adherends can change to another failure mechanism, such as delamination. The analysis of the combined debond and delamination are not such common although they are not out-of-scope for CZM application.
CZM is an applicable tool when the needed parameters are available. In addition to fracture toughness, additional parameters (such as the cohesive strengths parameters) are needed for the CZM analysis. Sensitivity analysis or curve-fitting is often performed when cohesive strength values are to be determined.[Citation15] Certain CZM parameter can be extracted with a kind of physical basis.[Citation16] Strength and fracture parameters can differ in the experimental batch and the determined value might not be presentative for all interfaces. However, the numerical sensitivity analysis of CZM parameters varying in different interfaces seems to be scarce in literature. Various numerical sensitivity analyses have been performed for studying Young’s modulus[Citation17] and strength[Citation18,Citation19] in different composite materials. The statistical analysis using Weibull analysis have been performed for adhesive test results under pull-off, single lap joint and three-point bending tests.[Citation20] The influence of CZM traction-separation law has been analysed statistically in basic coupons as double cantilever beam, end notched flexure and single lap joint configurations.[Citation21,Citation22,Citation23] Statistical approaches have been used for mechanical fastener joints,[Citation24,Citation25] as structural application cases.
The target of this work is to study the damage tolerance of DSJ specimens with CFRP composite adherends. The work includes intact and pre-cracked specimens. The latter specimens had a pre-existing defect in the bond line representing a manufacturing defect. The specimens are experimentally tested and subsequently simulated. High-speed digital image correlation (DIC) is used for searching for the damage onset and propagation in the cracked specimens’ quasi-static experiments. The pre-existing crack causes specimens to deform asymmetrically. Both specimen types are modelled using finite element method (FEM). The intact specimen is used to develop the cohesive damage parameters for the pre-cracked model. The experimental observations indicate that the pre-cracked specimen’s failure is dominated by delamination in the CFRP adherends. Finally, the statistical analysis of delamination parameters and related effects, and interaction is performed. This novelty approach remarks the parameter sensitivity influence on the joint strength and damage propagation. The approach remarked that some of the parametric variables are more important than other, but none was clearly dominating.
2. Materials and methods
2.1. DSJ specimens
The DSJ specimen types studied in this work are listed in . The DSJ-crack specimens had the pre-existing crack, which was placed between the film adhesive and parent laminate as shown in . The pre-existing crack is located in this manuscript at the lower left interface in experimental and finite element analysis figures.
Figure 1. DSJ-intact-0.5 (top), DSJ-intact-1.0 (middle) and DSJ-crack (bottom) specimens’ schematic dimensions.
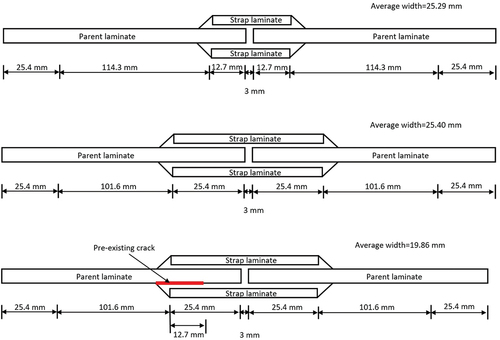
Table 1. DSJ specimen types tested in this work.
In all the DSJ series, the parent laminate had 20 plies of AS4/3501–6 carbon fibre epoxy prepreg with the stacking sequence of [0/0/0/-45/-45/0/0/45/-45/0]S. The strap laminates had 10 plies of AS4/3501–6 with the stacking sequence of [0/0/0/45/-45]S. The 0°-direction was placed in the specimen’s longitudinal direction. The film adhesive (FM 300–2 by Solvay) was used for bonding. The gap (3 mm) between adherend laminates was fitted by using PTFE shim. CFRP laminate surfaces were sanded before bonding. The pre-existing crack was made using PTFE film (thickness 20 µm). An adhesive chamfer of 45° was made using support plates during manufacturing. Secondary bonding was performed at 118°C for 120 min. The final specimen dimensions were made with the water jet cutting. The average apparent adhesive thickness (bond line) was 0.3 mm. The DSJ specimen series’ dimensions are shown in . The average specimen width was 25.29 mm, 25.40 mm and 19.86 mm for DSJ-intact-0.5, DSJ-intact-1.0 and DSJ-crack, respectively.
2.2. Tensile testing
The DSJ-intact-0.5 and DSJ-intact-1.0 were tested using a universal tensile testing machines Instron 5967 and 8800 using load cells of 30 kN and 100 kN, respectively. The tensile testing machine’s crosshead displacement was recorded along with force. The DSJ-intact-0.5 and DSJ-intact-1.0 specimens were tested under the constant displacement rate of 2 mm/min. In total, five DSJ-intact-0.5 and five DSJ-intact-1.0 specimens were tested.
The DSJ-crack series included six specimens in total. A servo-hydraulic universal testing machine Instron 8800 was used at a displacement rate of 1 mm/min. Three specimens out of six were monitored with a 3-D DIC system (LaVision, Germany) using the image acquisition rate of 10 Hz. The specimens were monitored from the sideview as seen in . The target was to observe the damage onset and propagation in the bond line and laminates. During the experiments, it was noticed that the damage onset and propagation was very fast and unstable forcing to use the high-speed DIC. The final three DSJ-crack specimens were monitored using a high-speed 3-D DIC system with an acquisition rate of 27 kHz.
2.3. Modelling of failure modes
The following different failure mechanisms were included in the finite element analysis (FEA) of DSJ specimens:
ply failure in the 0°-oriented plies,
cohesive failure in adhesive,
delamination failure between two 0°-oriented plies of the strap and parent laminates (these plies were the nearest to the adhesive bond line), and
interfacial (debond) failure between adhesive and parent laminate.
2.3.1. Cohesive Zone Model (CZM)
CZM was used for modelling the debond-type of failure between the adhesive and the parent laminates. CZM was also applied for modelling delamination. Delaminations were modelled to the parent laminates’ top plies and to the upper strap laminate bottommost ply interface (closest to the bond line). Additionally, CZM was also applied to the strap ends that included the adhesive chamfer. The 45°-angled adhesive chamfers were modelled including adhesive and strap thickness, as indicated in . The CZM analyses were performed in Abaqus without separate CZM elements. Instead, CZM was modelled based on contact algorithm between the studied surfaces. In this implementation, cohesive stiffnesses were not provided as separate value. Here, the quadratic stress criterion was used for the CZM damage onset. The criterion can be extracted in the form
where and
are tractions for mode I and II and
and
are the critical cohesive strengths for mode I and II, respectively. The analyses were performed using a two-dimensional model. For that reason, the fracture mode III was neglected. The adhesive-laminate interface was fitted for its values based on the DSJ-intact (test data). The delamination interface and its cohesive strengths (
was assumed to be equal, which minimized the number of unknown parameters to one (i.e.,
). The bi-linear traction-separation law was used for both delamination and debond modelling with CZM. The final damage evolution (for mode mixity) was defined using the Power law mixed-mode criterion, in which the apparent energy release rates (ERR) are compared to the (known) critical ERRs (fracture energies). Power law criterion takes the form
where and
are the ERRs evaluated by the method for mode I and II, and
and
are the fracture energies based on experiments for mode I and II, and
is the fitting parameter. The modelled crack tip was two-dimensional, and the fracture mode III was neglected.
2.3.2. Hashin failure criterion
The CFRP plies were analysed using the Hashin failure criterion implemented on Abaqus.[Citation26] A literature reference[Citation26] provides detailed description of the implemented model. The criterion was also used for adhesive’s damage at the bond line, where adhesive is isotropic. Hashin failure criterion for damage onset is divided into fibre and matrix failure, as presented in the following. Fibre failure can be extracted from the equation for tensile and compression loading:
respectively. In the Equationequation (3)(3)
(3) –(Equation4
(4)
(4) ),
is the effective stress component value, and
and
are tensile and compressive strengths in the ply-system's axis directions.
The matrix failure criterion takes the form:
where and
are the effective stress components and
,
and
are the strengths in the ply-system's axis directions (
for tension and
for compression) and shear. The stress component of axis 1 was aligned with the specimen's longitudinal and 0° ply angle direction. The axis 2 was directed to the thickness direction of the specimen.[Citation26]
Hashin criterion’s value exceeding unity will lead to damage onset. The effective stress tensor is defined as
where
and is the nominal stress. The damage variables are defined as
where sub-index and
refers to fibre and matrix, and superscripts
and
are for tension and compression.[Citation26]
2.4. Finite element models
The DSJ specimens were modelled using Abaqus/Standard 2021. The DSJ-intact models consisted of adhesives, strap, and parent laminates. Parent and strap laminates’ plies were modelled using partition. Interfaces, in which the damage was not modelled, were tied together (tie constraint in Abaqus). This means that the considered surfaces’ relative movement was restricted. This constraint was used between the strap laminates and adhesive(s). The constraints (tie) were also included in vertical edges or chamfers at the bond line ends. In total, four surface to surface contact regions were defined between the parent laminate and adhesive when the gap between two parent laminates were taken into account. In the DSJ-intact model, interfaces between the parent laminates and adhesives were modelled as a CZM surface (zero thickness). It should be noted that the cracked model will require modelling both sides of the DSJ due to asymmetric deformation.
The DSJ-crack was more complicated to model when delamination and the pre-existing crack were included. The delamination modelling requires two separate surfaces (separate parts modelled) where the delamination is modelled between the parts. The parent laminates’ top plies were modelled as a separate part. The upper strap (not the pre-crack side of the specimen) and its 0°-oriented ply closest to adhesive was also modelled as a part. The CZM-related surface was modelled in between the delamination interfaces. The vertical ends of the straps had the CZM-interface, which modelled the adhesive-CFRP (interfacial) bond. In the DSJ-crack model, the pre-existing crack was modelled as part of CZM surface. The specimen interfaces (half thickness) are schematically shown in .
Figure 2. The schematic representation of the FE model interfaces and parts (only half thickness of the DSJ coupon presented).
The boundary conditions were modelled at the specimen ends in the one-inch region, as shown in . The boundary conditions of the DSJ-intact were limited to a surface region while DSJ-crack had boundary condition through the parent laminate. The left end boundary condition was the restriction of both vertical and horizontal movements. The right end boundary condition was a limitation to the vertical movement. The enforced displacement was subjected to the right end boundary condition. The enforced displacement was not fully analysed (up to 2 mm), but the analyses were aborted when the failure occurred in the specimen. The Abaqus Hashin failure criterion is provided only for elements with plane stress state encoded. The whole model was meshed using two-dimensional four-noded plane stress elements (CPS4R) with reduced integration. The CFRP part’s typical element dimension in the specimen’s longitudinal direction was 0.25 mm. The element dimension in the thickness direction was defined by the CFRP’s ply thickness (0.14 mm). The adhesive part’s typical element dimension was 0.15 mm in both directions, which provided two element per adhesive bond line thickness. The adhesive part’s elements were mainly square shaped, excluding the chamfer region. The joint region with its mesh is shown in . The CFRP (a ply) and adhesive’s properties are shown in . All analyses were performed implicitly in Abaqus/Standard. The geometrical nonlinearities were included in analyses.
Figure 3. The DSJ FE model and its boundary conditions.
Figure 4. The whole joint region (top) and strap end chamfer region (bottom) with its element mesh in the DSJ FE model.
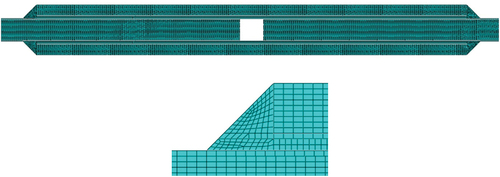
Table 2. Material properties used in this study; all the values are based on published works.[Citation27–32]
2.5. Statistical analyses
Four delamination (ply-ply) surfaces of the DSJ-crack model were chosen based on experimental testing for probabilistic analyses. These surfaces were between:
parent plies, upper side plies and right end of the specimen (PUR),
parent plies, upper side plies and left end of the specimen (PUL),
strap plies, upper side plies (SU), and
parent plies, bottom side and left end of the specimen (PBL).
The bottom side strap and parent laminate’s bottom side (right end) delamination contacts were not included in order to limit the analyses in this study. These locations were not likely to fail according to the experiments. The CZM properties were determined for each delamination location individually. The ratio between cohesive strength and fracture toughness for each mode was kept constant when modifying the parameter values. However, the fracture modes I and II (their relation) were not similarly constrained. This means that the mixed-mode ratio was varying during the statistical analyses.
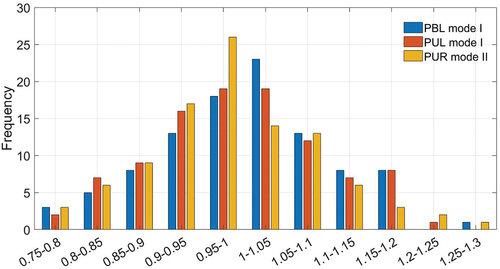
Eight sampled normally distributed parameter sets (four surfaces and two fracture modes) were generated in total. The sampling size was limited to 100 analyses. The fracture toughness mean values are presented in . The cohesive strengths values were fitting parameters for the analysis and are shown in the Results section. The normalized mean value for each normal distribution was unity and the standard deviation 0.1. Three different distribution sets are shown in . Three sets characterize dimensionless value distributions of PBL and PUL surfaces in mode I and PUR surface in mode II. The applied value for analysis is achieved when multiplied by fracture toughness or cohesive strength average value. The distribution of sets shows randomness when sets are not exactly similar. The generation of a random parameter set was performed in Microsoft Excel following the normal distribution while MATLAB was used for modifying the Abaqus input files accordingly. Finally, the maximum force value per simulation was captured as the Abaqus output.
Figure 5. Three generated normal distribution sets for DSJ variational analysis.
3. Results
3.1. Experimental results for the DSJ-intact series
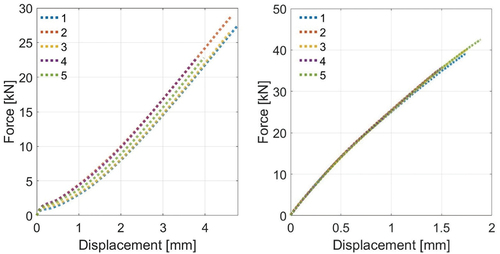
The fracture surfaces of the series DSJ-intact-0.5 and DSJ-intact-1.0 are shown in and . The specimens failed in a cohesive manner either in CFRP or adhesive. The recorded maximum forces per specimen are shown in . Force-displacement curves of DSJ-intact-0.5 and DSJ-intact-1.0 are shown in .
Figure 6. The DSJ-intact-0.5 fracture surfaces; strap lifted and placed with fracture surface up after the final failure.
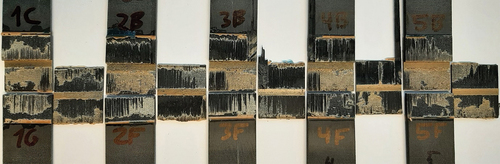
Table 3. The experimental maximum forces per series DSJ-intact-0.5 and DSJ-intact-1.0.
3.2. Experimental results for the DSJ-crack series
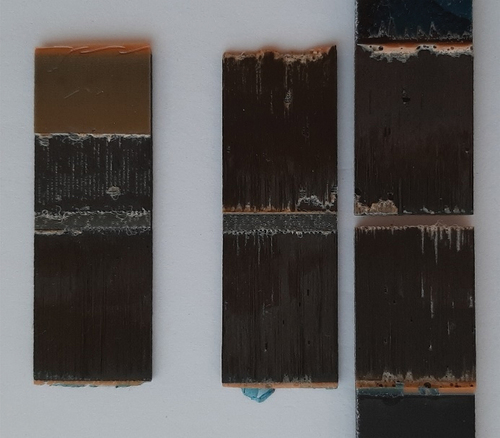
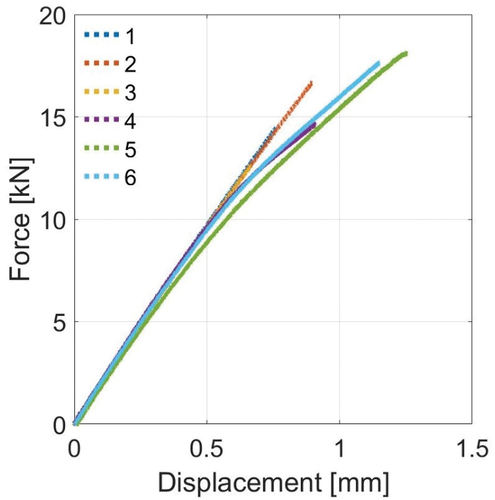
The fracture surfaces of the series DSJ-crack – for its specimen 4 are shown in . The failure mode is mainly dominated by delamination. These include delaminations in the parent and strap laminates. The schematic view of the fracture path as a sideview is shown in for all the specimens. The schematic view indicates that the most common failure mode was delamination. The crack had also certain tendency to shift between the strap and parent laminates, as was the case in the specimen 5. For the DSJ-crack specimens, the maximum forces and initial slopes of the force–displacement curves are collected in . The DSJ-crack series specimens force–displacement curves are shown in .
Figure 7. The DSJ-intact-1.0 fracture surfaces; strap lifted and placed with fracture surface up after the final failure.
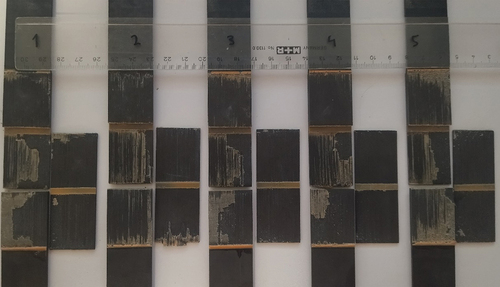
Table 4. The experimental maximum forces and force-displacement slopes for the series DSJ-crack.
3.3. Failure in the series DSJ-crack according to high-speed imaging
The DSJ-crack series, in terms of specimen failure, was extremely unstable and fast. Three last specimens of the series were studied by using high-speed imaging (and DIC analysis). The final failure in these three specimens is shown in . The time interval between the acquired images was 37 µs and, basically, no indications about the failure initiation could be observed from the previous images. In the images, the lower right side of the parent adherend, which did not have the pre-crack, did not indicate any systematic failure mechanism.
Figure 8. The series DSJ-intact-0.5 (left) and DSJ-intact-1.0 (right) force–displacement curves.
3.4. Numerical analysis results of DSJ-intact-0.5
The cohesive strengths for the CZM model of adhesive (debond) in this study were fitted using DSJ-intact experiments. The DSJ simulation’s force–displacement curves are shown in . The fitting was done based on the experimental average maximum force (25.7 kN). The feasible fit was achieved with the cohesive strengths of 35 MPa and 40 MPa, for the mode I and II, respectively. DSJ-intact-0.5 was also used for testing the Hashin criterion in the adhesive part. For this purpose, the CZM damage evolution was not activated and Hashin was assigned to the adhesive part. The adhesive’s Hashin model finally led to a maximum force of 25.0 kN. The simulations resulted in an abrupt drop in the force-displacement response (see ). The complete element failure was not allowed for avoiding overly large element distortion.
Figure 9. The fracture surfaces of specimen DSJ-crack 4. Parent adherends are shown far right; pre-cracked and non-pre-cracked strap parts are shown in the left and middle, respectively.
3.5. Numerical analysis results of DSJ-crack
The modelling of DSJ-crack included CZM for the adhesive-CFRP interface. For this, CZM was applied between the laminate and adhesive parts – the CZM properties of adhesive were used. The fitted cohesive strengths (35 MPa, 40 MPa) provided the maximum force of 29.5 kN, which overpredicted the maximum experimental average force. This result indicated the need to consider other failure mechanisms alongside. The simulated damage initiated at the pre-existing crack and evolved towards the other side of the parent laminate. For certain length, damage propagated in the adhesive part longitudinally (midline) until damage initiated at the end with the chamfer. The latter damage location evolved above the adhesive part (interfacially) and did not confront the initial damage at the other end. The Hashin criterion did not predict onset of failure in adhesive (bulk) so that adhesive remained carrying load.
The cohesive failure modelling did not precisely correspond to the experimental data and clearly other failure mechanisms were to be included. In the next step of the analysis, the CZM modelling delamination was activated. For minimizing the number of parameters, the delamination cohesive strengths for mode I and II were assumed to be equal. The influence of three different cohesive strength values on the force–displacement curve are shown in . The delamination-related cohesive strengths showed significant effect on the specimen behaviour where values of 30 MPa and 35 MPa provided practically similar force–displacement curve than the curve without delamination modelling (cohesive failure). The cohesive strength of 25 MPa for mode I and II decreased the maximum force and matched better with the experimental average. This modelling of delamination led to situation where the CFRP failure initiated in the parent laminate close to the pre-existing crack. The damage onset and propagated in one side of the parent laminate (as a delamination) and in the strap laminate (as delamination), as shown in .
Figure 10. Schematic view for the DSJ-crack series with fracture path in specimens 1 to 6 (left to right). The pre-crack location is shown with the blue line at the left lower interface. The parent and strap laminates are shown with diagonal and horizontal stripes, respectively. Adhesive is shown with the orange colour.
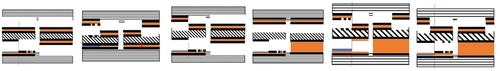
Figure 11. The DSJ–crack series force–displacement curves.
The delamination-related cohesive strength value (25 MPa) was used additionally in CFRP, its top 0°-oriented ply as well as for the adhesive’s damage modelling. The response is shown in (green continuous curve). The behaviour of the simulated DSJ test agreed well with the experimental (average) observation. The slope of the experimental specimen is slightly lower than numerical models’ responses. This can be partly explained by tensile testing machine displacement where machine compliances are also included. The force drop is also more sudden than when delamination (25 MPa) was modelled but degradation of bulk adhesive (onset by Hashin criterion) neglected. The comparisons in and remark that the failure accumulation is localized on the pre-cracked side in the FE model. Interestingly, the high-speed imaging showed failure to occur also on the other side of the specimen. Of course, the experimental failure on the other side could be the consequence of the pre-existing crack side failure. However, the limited time interval used in DIC did not allow defining precisely the experimental failure initiation and evolution, which limits the conclusions about the difference between FE analysis and experiments.
3.6. Statistical analyses
The maximum force distribution is shown to be skewed towards higher values, as indicated by the histogram shown in . The skewed distribution could be caused by the limited number of the parameter sets or the dominance of certain parameters. The maximum force value range is from 12.9 kN and to 20.9 kN. The experimentally determined range was from 12.6 kN to 18.0 kN. The standard deviation of the computed data set seems to be in a feasible range. The distribution is, of course, dependent on the occurrence of given parameter sets.
Figure 12. High-speed imaging at the moment of final failure: specimens DSJ-crack4, DSJ-crack5 and DSJ-crack6 (top to bottom) shown. The pre-crack is in the lower left location of the joint.
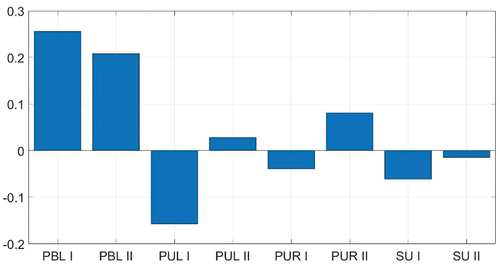
Linear correlation factors for all the varied parameters are shown in . The correlation factors indicate that the data is scattered where even the highest factor is less than 0.25. None of the parameters can interpret (dominate) completely the maximum force. However, it can be found that the delamination of the left side and bottom parent laminate has the most significant effect on the maximum force. In terms of the fracture toughness values (parameters), the mode I value seems to be more important than the values applied for the mode II. The upper left side delamination has the second effective role. This result suggests the likeliness of cracks to initiate at the “lower” side (bottom in ) of the left side parent laminate and grow towards the upper side.
Figure 13. The fitting of cohesive strengths and comparing the isotropic hashin criterion with the CZM response in the DLS-intact FE model.
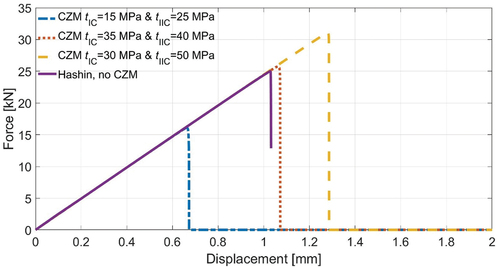
Figure 14. The behaviour of the numerically simulated tests of the DSJ-crack series with different delamination models activated (incl. delamination) and representative experimental result.
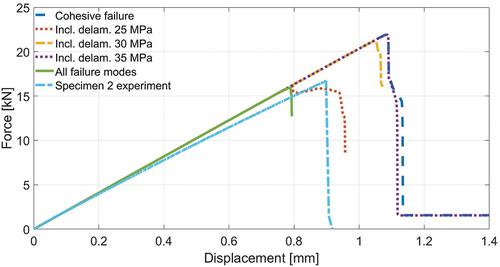
Figure 15. The displacement field in the simulated DSJ-crack FE model: with only cohesive (CZM) failure modelled for adhesive part (upper image), with cohesive (CZM) failure and delamination in CFRP parts with cohesive strength of 25 MPa (lower image). 3X magnification (of deformation) applied for clarity in the images.
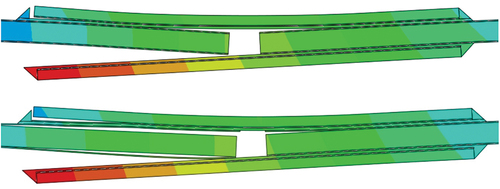
Figure 16. The histogram of computed maximum force values.
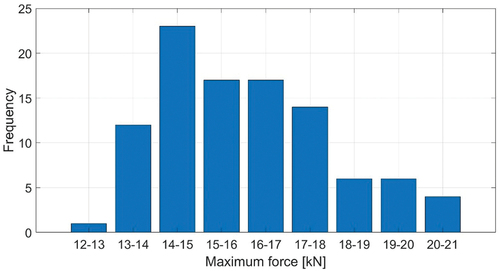
Figure 17. The linear correlation coefficients for different FE modelling schemes of failure mechanisms and in terms of linearized weight to affect maximum force.
4. Conclusions
In this work, the damage tolerance of the double strap joint (i.e., DSJ specimen) was studied. The experimental results showed that a 0.5 inch-long and 1 inch-long overlaps provided a 25.7 kN and 38.5 kN average maximum force. The lap length of 1 inch with the pre-existing crack (0.5 inch long), provided the average maximum force of 15.7 kN. The decrease in the maximum force when compared to 0.5 inch-long overlap was almost 40%.
The DSJ specimen’s (experimental) failure occurred suddenly – in less than a millisecond. By using high-speed imaging, the failure mechanisms in the pre-cracked DSJ specimen were studied. The explanation for the lower maximum force was delamination. The pre-existing crack caused unsymmetric failure mode (switching) towards delamination. Delamination was observed in several ply interfaces on both sides of each bond line.
The specimens were modelled using FEM in this study. The intact-DSJ-0.5 with the CZM for modelling the cohesive failure in adhesive provided cohesive strength values for the pre-cracked specimen’s analysis. The usage of similar parameter values in the pre-cracked DSJ overestimated the maximum force. Finally, delamination was also modelled with cohesive strength values fitted using the pre-cracked model simulated in comparison with the experimental average maximum force.
Delamination-related cohesive strength values were lower compared to those of adhesive part’s CZM. The applied values were in a meaningful range. The model with CZM used for adhesive and CFRP led to test simulations with active delamination onset and growth on the side of the pre-crack. For that reason, variation-based study was considered for the different models of damage. This led to a statistical analysis where four delamination locations (of CZM) were having eight normal parameter distributions. In total, 100 analyses were performed. The statistical analysis focused on the computed maximum force values, which agreed with the experiments (deviation range). The analysis also showed that the resulting maximum force value distribution was asymmetric with more emphasis on the high force values. The analyses showed that part of the parametric variables were more important than others, but conclusive domination was not found. The most important failure mode was the delamination of the left and bottom parent laminate, which is close to the pre-existing crack. The fracture mode I was seen to be more influential than the mode II fracture.
Disclosure statement
No potential conflict of interest was reported by the author(s).
Additional information
Funding
References
- Katnam, K. B.; Da Silva, L. F. M.; Young, T. M. Bonded Repair of Composite Aircraft Structures: A Review of Scientific Challenges and Opportunities. Prog. Aerosp. Sci. 2013, 61, 26–42. DOI: 10.1016/j.paerosci.2013.03.003.
- Baker, A.; Gunnion, A. J.; Wang, J. On the Certification of Bonded Repairs to Primary Composite Aircraft Components. J. Adhes. 2015, 91(1–2), 4–38. DOI: 10.1080/00218464.2014.883315.
- Banea, M. D.; da Silva, L. F. M. Adhesively Bonded Joints in Composite Materials: An Overview. Proc. Inst. Mech. Eng. Part L J. Mater. Des. Appl. 2009, 223(1), 1–18. DOI: 10.1243/14644207JMDA219.
- Orsatelli, J.-B.; Paroissien, E.; Lachaud, F.; Schwartz, S. Bonded Flush Repairs for Aerospace Composite Structures: A Review on Modelling Strategies and Application to Repairs Optimization, Reliability and Durability. Compos. Struct. 2023, 304, 116338. DOI: 10.1016/j.compstruct.2022.116338.
- Fame, C. M.; Ramôa Correia, J.; Ghafoori, E.; Wu, C. Damage Tolerance of Adhesively Bonded Pultruded GFRP Double-Strap Joints. Compos. Struct. 2021, 263, 113625. DOI: 10.1016/j.compstruct.2021.113625.
- Wu, C.; Yu, Y.-Z.; Tam, L.-H.; He, L. Effects of Bondline Defects on the Bond Behaviour of CFRP-Steel Double Strap Joints. Compos. Struct. 2023, 308, 116682. DOI: 10.1016/j.compstruct.2023.116682.
- Lee, H. K.; Pyo, S. H.; Kim, B. R. On Joint Strengths, Peel Stresses and Failure Modes in Adhesively Bonded Double-Strap and Supported Single-Lap GFRP Joints. Compos. Struct. 2009, 87(1), 44–54. DOI: 10.1016/j.compstruct.2007.12.005.
- Hart-Smith, L. J., Adhesive-Bonded Double-Lap Joints. Douglas Aircraft Co., NASA Langley Report CR-11234, 1973.
- Chalkley, P.; Rose, F. Stress Analysis of Double-Strap Bonded Joints Using a Variational Method. Int. J. Adhes. Adhes. 2001, 21(3), 241–247. DOI: 10.1016/S0143-7496(01)00008-2.
- Aakkula, J.; Jokinen, J.; Saarela, O. Fatigue Performance of DIARC® Plasma Coated Bonded Metal Specimens. Int. J. Adhes. Adhes. 2017, 79, 83–94. DOI: 10.1016/j.ijadhadh.2017.09.009.
- Lang, T. P.; Mallick, P. K. Effect of Spew Geometry on Stresses in Single Lap Adhesive Joints. Int. J. Adhes. Adhes. 1998, 18(3), 167–177. DOI: 10.1016/S0143-7496(97)00056-0.
- Marques, E. A. S.; da Silva, L. F. M. Joint Strength Optimization of Adhesively Bonded Patches. J. Adhes. 2008, 84(11), 915–934. DOI: 10.1080/00218460802505275.
- Mohabeddine, A.; Malik, G.; Correia, J.; De Jesus, A.; Fantuzzi, N.; Castro, J. M. High Performance and Cost-Effective Hybrid Steel/CFRP Joints Using Bi-Adhesive Technique for the Repair of Metallic Infrastructures. Compos. Struct. 2023, 321, 117284. DOI: 10.1016/j.compstruct.2023.117284.
- Saeimi Sadigh, M. A. Enhanced Failure Load Bearing in Adhesively Bonded Strap Repairs: Numerical Analysis and Experimental Results. J. Fail. Anal. Prev. 2019, 19(1), 182–192. DOI: 10.1007/s11668-019-00589-y.
- Campilho, R. D. S. G.; Banea, M. D.; Neto, A. B. P.; Da Silva, L. F. M. Modelling of Single-Lap Joints Using Cohesive Zone Models: Effect of the Cohesive Parameters on the Output of the Simulations. J. Adhes. 2012, 88(4–6), 513–533. DOI: 10.1080/00218464.2012.660834.
- Cabello, M.; Turon, A.; Zurbitu, J.; Renart, J.; Sarrado, C.; Martínez, F. Progressive Failure Analysis of DCB Bonded Joints Using a New Elastic Foundation Coupled with a Cohesive Damage Model. Eur. J. Mech. A Solids. 2017, 63, 22–35. DOI: 10.1016/j.euromechsol.2016.12.004.
- Jokinen, J.; Kanerva, M. Sensitivity Analysis for Simulated Testing of Composites: Mapping via Isight and Abaqus. J. Struct. Mech. 2017, 50(3), 191–197. DOI: 10.23998/rm.64885.
- Phoenix, S. L.; Ibnabdeljalil, M.; Hui, C.-Y. Size Effects in the Distribution for Strength of Brittle Matrix Fibrous Composites. Int. J. Solids Struct. 1997, 34(5), 545–568. DOI: 10.1016/S0020-7683(96)00034-0.
- Sutherland, L. S.; Guedes Soares, C. Review of Probabilistic Models of the Strength of Composite Materials. Reliab. Eng. Syst. Saf. 1997, 56(3), 183–196. DOI: 10.1016/S0951-8320(97)00027-6.
- Genty, S.; Sauvage, J.-B.; Tingaut, P.; Aufray, M. Experimental and Statistical Study of Three Adherence Tests for an Epoxy-Amine/aluminum Alloy System: Pull-Off, Single Lap Joint and Three-Point Bending Tests. Int. J. Adhes. Adhes. 2017, 79, 50–58. DOI: 10.1016/j.ijadhadh.2017.09.004.
- Jaillon, A.; Jumel, J.; Paroissien, E.; Lachaud, F. Mode I Cohesive Zone Model Parameters Identification and Comparison of Measurement Techniques for Robustness to the Law Shape Evaluation. J. Adhes. 2020, 96(1–4), 272–299. DOI: 10.1080/00218464.2019.1669450.
- Jaillon, A.; Jumel, J.; Lachaud, F.; Paroissien, E. Mode I Cohesive Zone Model Parameters Identification And Comparison Of Measurement Techniques Based On Uncertainty Estimation. Int. J. Solids Struct. 2020, 191-192, 577–587. DOI: 10.1016/j.ijsolstr.2019.12.014.
- Gustafson, P. A.; Waas, A. M. The Influence of Adhesive Constitutive Parameters in Cohesive Zone Finite Element Models of Adhesively Bonded Joints. Int. J. Solids Struct. 2009, 46(10), 2201–2215. DOI: 10.1016/j.ijsolstr.2008.11.016.
- Zhao, L.; Shan, M.; Liu, F.; Zhang, J. A Probabilistic Model for Strength Analysis of Composite Double-Lap Single-Bolt Joints. Compos. Struct. 2017, 161, 419–427. DOI: 10.1016/j.compstruct.2016.11.074.
- Li, H.; Lu, Z.; Zhang, Y. Probabilistic Strength Analysis of Bolted Joints in Laminated Composites Using Point Estimate Method. Compos. Struct. 2009, 88(2), 202–211. DOI: 10.1016/j.compstruct.2008.03.040.
- Abaqus User Manual, Abaqus. Dassault Systemes, 2021.
- Jokinen, J.; Wallin, M.; Kanerva, M., The Influence of the Number of Adhesive Plies (FM 300-2) on Fracture Properties, 32nd Congress of the International Council of the Aeronautical Sciences, Shanghai, China, Sept 6–10, 2021.
- Skyttä, V.; Saarela, O.; Wallin, M. Progressive Failure of Composite Laminates; Analysis vs Experiments. In Fracture of Nano and Engineering Materials and Structures; Gdoutos, E. E., Ed.; Springer : Dordrecht, 2006; pp. 341–347.
- Jokinen, J.; Orell, O.; Wallin, M.; Kanerva, M. A Concept for Defining Mixed-Mode Behaviour of Tough Epoxy Film Adhesives by Single Specimen Design. J. Adhes. Sci. Technol. 2020, 34(18), 1982–1999. DOI: 10.1080/01694243.2020.1746606.
- Sachse, R.; Pickett, A. K.; Middendorf, P. Simulation of Impact and Residual Strength of Thick Laminate Composites. Compos. Part B. 2020, 195, 108070. DOI: 10.1016/j.compositesb.2020.108070.
- Jokinen, J.; Kanerva, M.; Wallin, M.; Saarela, O. Analyses of Criticality for Multiple Site Delaminations in the Flap Spar of Finnish F/A-18 Aircraft. Aeronaut. J. 2020, 125(1285), 556–577. DOI: 10.1017/aer.2020.69.
- Rodera, O.; Jokinen, J.; Orell, O.; George, L.; Pournoori, N.; Kanerva, M. Multi-Layer Continuum Model for Adhesive Films with Knitted Carrier. Compos. Sci. Technol. 2023, 236. DOI: 10.1016/j.compscitech.2023.109981.