
 ?Mathematical formulae have been encoded as MathML and are displayed in this HTML version using MathJax in order to improve their display. Uncheck the box to turn MathJax off. This feature requires Javascript. Click on a formula to zoom.
ABSTRACT
To reliably compensate fuel cell stack tolerances, sealings with a layer thickness of at least 500 µm are necessary. Additionally, threads positioned at the upper region of the stencil apertures need to be integrated to print closed-loop designs under cycle times of as low as 3 seconds. All these requirements can intensify the occurrence of print defects and diminish the process stability. This paper addresses the issues of incomplete regions and air bubbles emerging during the squeegee process. It was detected that the cleanliness state of the stencil directly impacts the formation of incomplete regions by affecting venting conditions inside the aperture. Moreover, it was identified that bubbles are either transferred from the adhesive roll into the aperture or created due to interactions between the moving adhesive and stencil threads. Further, it was shown that bubbles cannot be completely eliminated using a stencil with threads but their size can remain smaller than 300 µm when printing with a new adhesive roll. Finally, distinct strategies were derived and verified experimentally to successfully print a basic sealing design. By introducing a small local gap between substrate and stencil, the entire sealing aperture was reliably filled without the need of a cleaning step.
1. Introduction
The structure of a single low temperature proton exchange membrane fuel cell (LT-PEMFC) fundamentally consists of a membrane electrode assembly (MEA) sandwiched between bipolar plates (BPPs) with sealings between these elements.[Citation1] Up to hundreds of cells can be combined into a stack to provide the required power output, which demands highly reliable manufacturing processes since a single defective cell can compromise the entire stack safety and performance.[Citation2] In light of this, the sealing is one specific component that has been receiving increased attention in the last years. Besides impeding gas and coolant leakages, the sealing is a crucial element in the overall stack concept for compensating assembly tolerances, which can reach up to 300 µm.[Citation3]
To achieve projected market volumes, stencil printing was identified as an attractive technique to meet cycle time requirements for the sealing production, which should be as low as 3 seconds.[Citation4–6] Despite that simple deposit structures achieving heights of up to 500 µm have been reported using solder pastes and conductive adhesives,[Citation7,Citation8] stencil printing is typically not adopted to apply layer thicknesses higher than 200 µm. In comparison, fuel cell sealing concepts demand a minimum layer thickness of 500 µm to safely offset the mentioned stack tolerances under compression ratios of up to 40%.[Citation9–12] Additionally, the sealings are characterized by significantly more complex contour designs to effectively seal ports, flow field and distribution channels of BPPs.
To print closed-loop designs, a so-called double-layer stencil can be adopted to apply the desired structure using a single print cycle.[Citation12–15] As shown in , it consists of an upper layer with patterned threads that link different regions of the stencil and provide sufficient mechanical stability. These threads also support the second lower layer, which delineates the print design. This same stencil concept was previously tested using distinct configurations for the threads to print sealings for fuel cells.[Citation5,Citation6] These studies were mainly focused on investigating phenomena and print inconsistencies occurring during the separation process, such as the formation of air bubbles, filaments and excessive spreading. In contrast, print defects emerging during the squeegee process have not been thoroughly explored using this stencil concept.
Figure 1. Schematic of the stencil printing process consisting of a squeegee process (a) and a separation process (b). Perspective view of an aperture segment of a double-layer stencil made from stainless steel, based on.[Citation5,Citation6]
![Figure 1. Schematic of the stencil printing process consisting of a squeegee process (a) and a separation process (b). Perspective view of an aperture segment of a double-layer stencil made from stainless steel, based on.[Citation5,Citation6]](/cms/asset/629d9cdd-1e2b-494f-bf6b-082703e23ece/gadh_a_2356105_f0001_oc.jpg)
In this paper, a basic sealing design was used to identify relevant printing problems during the squeegee process, as shown in . It presents approximate dimensions of 60 mm x 60 mm that should resemble the sealing design in the ports region of typical fuel cells. The squeegee direction corresponds to the indicated x-direction and the three sealing lines perpendicular to the squeegee direction were marked with the letters A, B and C for the sake of better differentiation. With this design, potential printing difficulties closer to the real application can be identified and evaluated more effectively. Based on preliminary experiments, two main print defects during the squeegee process were identified: incomplete regions and bubble formation.
Figure 2. Representative specimen of the basic sealing design with highlighted print defects (printed at 160 mm/s using condition SS–R1). The used squeegee direction corresponds to the indicated positive x-direction.
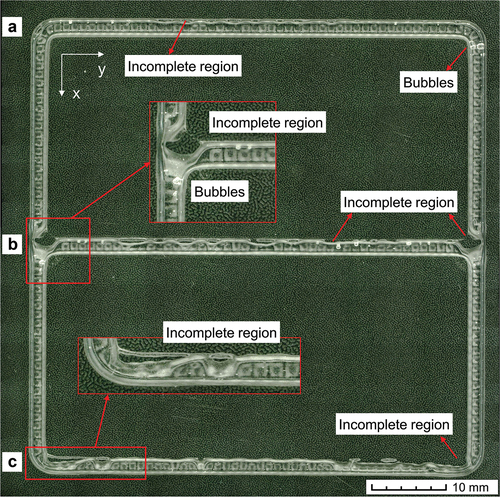
Incomplete regions are a known issue in stencil printing.[Citation16–20] Typically, small aperture dimensions and an insufficient pressure inside the print material are the main reported reasons for the emergence of this defect. In contrast, the formation of bubbles during the squeegee process is a less recognized phenomenon in stencil printing but can considerably impact the process reproducibility. In the field of screen printing, the presence of bubbles inside specimens was already reported by several studies.[Citation20–27] The mechanical agitation of the print material before the squeegee process and inherent interactions with the mesh were indicated as driving mechanisms for bubbles to appear.[Citation24–28] Yet, there is still very little consensus and a general lack of correlation with experimental data on describing how these bubbles are produced. Several computational fluid dynamics (CFD) simulations were developed to estimate the pressure distribution within the print material in front of the moving squeegee[Citation29–32] and the filling completeness of a given aperture volume,[Citation17,Citation18,Citation33,Citation34] where the latter has the additional advantage of being experimentally measurable. However, more comprehensive simulative approaches demonstrating the print material motion are still missing in the literature, which could provide valuable information to optimize the aperture filling behaviour and avoid print defects.
Based on this scenario, comprehensive print experiments were conducted to determine how print and stencil parameters influence the formation of incomplete regions and bubbles during the squeegee process. Characterisation methods using microscope images and micro-CT scans were applied to quantify and analyse these defects. Here, a stencil containing a lines design with and without threads was adopted, which allows to isolate the impact of threads in the print results. In addition, a new CFD model of the squeegee process was developed in FLOW–3D[Citation35] to visualize how these print defects emerge. The squeegee process was recorded in slow motion to analyse the adhesive roll behaviour and provide additional validation for the simulations. Based upon the combined experimental and simulation results, potential approaches to avoid these printing problems using the basic sealing design were derived and tested. Ultimately, the collected findings in this paper should enhance the understanding on decisive process and stencil parameters during the squeegee step, increasing the attractiveness of this technique for the application of sealings and adhesives in the industry.
2. Materials and methods
All preparation steps and experiments were conducted in laboratory conditions, at 23°C.
2.1. Stencil design
Two different stencils made from stainless steel (Christian Koenen GmbH, Ottobrunn, Germany) were used for the experiments. As illustrated in , both stencils presented apertures with a 680 µm thick step and 120 µm thick threads, resulting in a stencil thickness of 800 µm. Here, a thicker stencil than the minimum layer thickness of 500 µm is required since a certain degree of spreading (height loss) of the applied material over the substrate always occurs. A very similar configuration was previously used to reliably reach the same layer thickness using several distinct adhesives as print material.[Citation6] The first stencil (a) corresponds to the one used to print the mentioned sealing design, and the second stencil (b) consists of 80 mm length lines with two different widths: 1.52 and 2.34 mm, which correspond to aperture aspect ratios (AR = width/height) of 1.90 and 2.93, respectively. A second pair of lines without threads was included in this stencil to separately examine how the addition of threads influences the print results. The line orientation relative to the squeegee direction was primarily adjusted at 0°. This considerably reduces the modelling and computational effort for the numerical simulations but still allows to capture the basic formation mechanisms of desired print defects.
Figure 3. Schematic of used stencils and detailed views of the aperture threads design.
2.2. Adhesive selection and print parameters
An ultraviolet (UV) curable acrylic was selected for all experiments, and it corresponds to adhesive B3, which was thoroughly characterized and tested previously by Indicatti et al.[Citation6] It exhibited very good printability, and its transparency facilitates the characterisation of bubbles inside the specimen. Moreover, this adhesive presented a reduced filament-stretching tendency, which avoided the formation of bubbles during the separation process.
The rheological properties of this adhesive required for the simulation model are reported in . The viscosity values were obtained with a stepped flow approach using a rheometer (MCR 500, Anton-Paar GmbH, Ostfildern, Germany) equipped with a plate-plate setup (25 mm diameter) and a 0.4 mm gap. The adhesive surface tension was measured with the Wilhelmy plate method (K100 Force Tensiometer, KRÜSS GmbH, Hamburg, Germany) using a platin-iridium Wilhelmy-plate (10 × 20 x 0.2 mm). These measurements were carried out at a constant speed of 0.01 mm/s and an immersion depth of 2 mm. An optical contact angle measurement system (DSA 10, KRÜSS GmbH, Hamburg, Germany) was used to determine the adhesive equilibrium contact angle with the stencil surface. The surface tension and contact angle measurements were conducted with adhesive B3 without fumed silica since the filled one used for the print experiments exhibited an apparent yield stress that prevented wetting and thereby reliable measurements with these methods. For additional information about this adhesive and rheological characterisations, see reference.[Citation6]
Table 1. Average and corresponding standard deviation of the adhesive properties incorporated into the model. The contact angle and surface tension measurements were repeated five times. The viscosity standard deviation remained below 5%, based upon three measurements.
The print experiments were performed with a commercial stencil printer (EKRA STS E5, ASYS Group, Dornstadt, Germany). Squeegee speeds of 40 and 160 mm/s were tested, and the separation speed kept unchanged at 1 mm/s to minimize the risk of print defects emerging during separation. A squeegee pressure of 0.5 N/mm was adopted to leave the stencil topside completely free of adhesive remains after the squeegee process, which is a required condition to not affect the final layer thickness. The used squeegee (RKS Carbon S HQ/30 65 Shore, RK Siebdrucktechnik GmbH, Rösrath, Germany) presented a length of 120 mm and a 4 mm chamfer (45°) at the tip. A squeegee holder of 60° was adopted, resulting in a nominal squeegee angle of 15°. This squeegee configuration was selected based on previous experiments to enhance the aperture filling and process reproducibility.
An adhesive roll was manually dispensed over the stencil using an adhesive gun to ensure comparable initial conditions. Every new adhesive roll was completely free of bubbles and its height was always between 8 and 12 mm. Large adhesive residues on the squeegee after printing were also removed when a new roll was added to prevent any further sources of bubbles. Another additional parameter evaluated was the aperture state and cleanliness of the stencil underside before printing. Considering the adhesive roll state, four different print conditions were investigated, as illustrated in : cleaned aperture with cleaned stencil and a new adhesive roll (CA–R1), pre-wetted aperture with cleaned stencil and a new adhesive roll (CS–R1), pre-wetted aperture with smeared stencil and a new adhesive roll (SS–R1), and pre-wetted aperture with smeared stencil and a three-times used adhesive roll (SS–R3).
Figure 4. Simplified illustration of the aperture cross section describing the four tested print conditions considering the state of the aperture, stencil underside and adhesive roll.
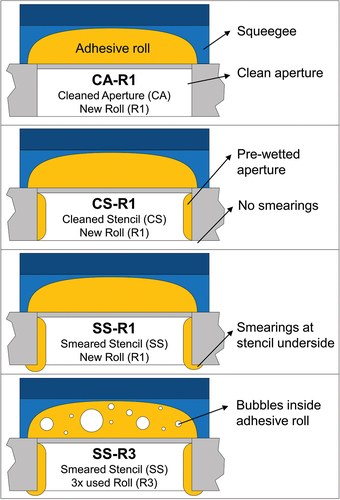
With exception of condition CA–R1, these correspond to relevant operation modes that have direct impact on the production cycle time and process efficiency. The cleaning procedure of the stencil was conducted manually by hand using absorbent wipes. It is important to emphasize that the illustrated smearings in were not considered as a print defect since these remained roughly smaller than 0.2 mm throughout the performed experiments. Moreover, the extent of smearings observed did not cause instabilities during the separation process, nor did it significantly affect print resolution due to the relatively large dimensions of the printed structures.
2.3. Specimens characterisation
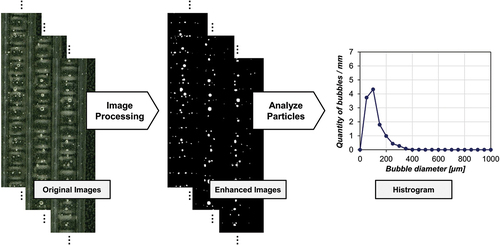
All specimens were scanned using a light microscope (VHX-2000, Keyence, Osaka, Japan) with a resolution of 5.2 µm/pixel. To analyse the bubbles inside the specimens, ImageJ[Citation36,Citation37] was used for image processing and extracting the quantity and area of bubbles, as depicted in . Since the majority of the bubbles exhibited a circular shape, the measured bubble area was converted to an equivalent bubble diameter, which is a more convenient indicator. Frequency distribution histograms of the bubble diameter were derived from this data by combining the quantity of bubbles of three different specimens printed at identical conditions. Furthermore, micro-CT measurements (voxel-size: 10 µm) were conducted with a few representative specimens to obtain the precise position of the bubbles along the specimen height, which could not be assessed using the microscope.
Figure 5. Developed approach using ImageJ to characterize bubbles formed during the squeegee process.
3. Experimental results and discussion
3.1. Incomplete regions
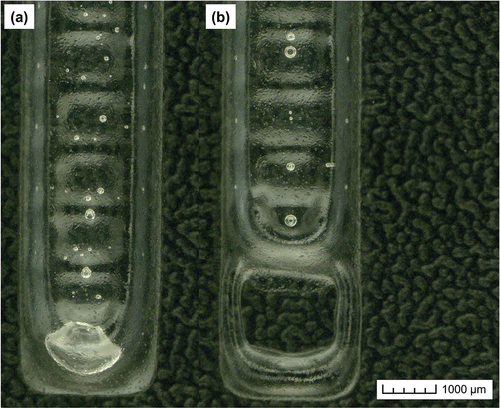
The gap between stencil and substrate was measured and set to zero in order to keep the smearings at a minimum. Prominent smearings were not observed during all experiments. However, it was identified that the cleanliness state of the stencil before printing was associated with the emergence of incomplete regions, as reported in . When the stencil was not cleaned before printing (conditions SS–R1 and SS–R3), 95.8% of the specimens exhibited incomplete regions. In contrast, only 6.3% of the specimens printed with a cleaned stencil (conditions CA–R1 and CS–R1) presented this defect. The incomplete regions were located exclusively at the line extremity that was last filled by the squeegee and appeared either as a large bubble that extends almost throughout the entire line width () or as an empty space ().
Figure 6. Number of specimens exhibiting incomplete regions printed at 40 and 160 mm/s.
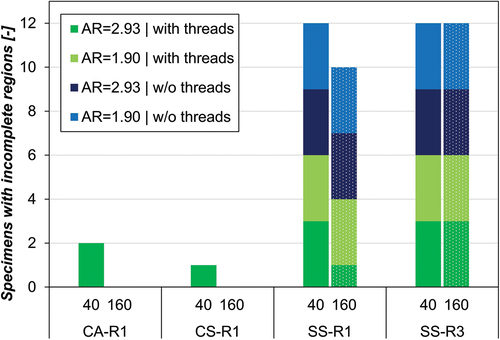
Figure 7. Representative specimens with incomplete regions at the line extremity (last part to be filled by the squeegee).
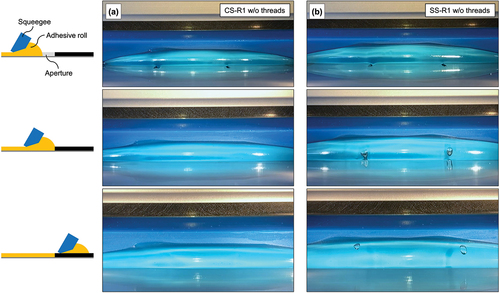
The occurrence of this defect was attributed to the lack of air venting at the line extremity due to the smearings at the stencil underside. Despite being small, the smearings can act like an additional seal between the stencil and substrate that impedes air to be expelled from the aperture during the squeegee process. This deduction is supported by the fact that large air bubbles were transferred into the adhesive roll when printing with a smeared stencil whereas such bubbles were not observed when it was cleaned. displays this phenomenon with two image sequences from the squeegee process recorded at a frame rate of 120 fps using a cleaned (a) and a smeared stencil (b). As can be seen, both adhesive rolls are completely free of bubbles before reaching the line extremity. The gap between stencil and substrate is intended to be zero, however, it still allows air to escape when the stencil is cleaned, which most of the time is sufficient to avoid filling defects and the formation of bubbles inside the adhesive roll. This phenomenon was identified using all four print conditions and was consistently replicated using both squeegee speeds.
Figure 8. Image sequences of the squeegee process using a cleaned (a) and smeared stencil (b) to compare the formation of bubbles inside the adhesive roll when the squeegee (40 mm/s) passes through the line extremity.
The same effect was observed when printing the sealing design, where large bubbles formed inside the adhesive roll when it was passing by the T-intersections and the line C of the sealing. Here, the detection of these bubbles was correlated with the presence of incomplete regions as well. The T-intersections can be considered as a more critical part to be completely filled due to their geometry and larger volume compared to the lines. Thus, the aperture design and its orientation relative to the squeegee direction can be considered as an additional influencing parameter, which directly determine the available time for filling. For instance, a few small incomplete regions were also formed at lines A and B, as shown in . In this case, large bubbles did not appear inside the adhesive roll when passing through these lines, and the formation of these incomplete regions can be further associated with an insufficient time for the adhesive to fill the aperture or air to be expelled from it. This is reinforced by the observation that lines A and B of sealing specimens printed at 40 mm/s exhibited a better or even complete filling of those lines. Therefore, additional approaches to provide sufficient venting and time for filling are required to reliably fill all critical regions, which will be discussed later in section 5.
Variations of the squeegee speed and aperture AR or the presence of stencil threads did not notably impact the formation of incomplete regions, see . All specimens were printed with a nominal squeegee angle of 15°, and experiments performed with larger (30°) and shallower (5°) angles did not result in any significant improvement of the aperture filling completeness. Increasing the vertical squeegee pressure to minimize the extent of smearings at the stencil underside also did not avoid incomplete regions. Indeed, an excessive squeegee pressure (>1 N/mm) might even enhance the restriction on air flow between stencil and substrate, leading to the emergence of incomplete regions using a cleaned stencil as well. This description better indicates the ‘cleanliness state’ as the decisive parameter on the formation of the print defect.
3.2. Bubble formation
reports frequency distribution histograms of the bubble diameter from specimens printed at two different squeegee speeds and aperture ARs. The measured quantity of bubbles was normalized by the total considered length of three specimens (240 mm) to enhance comparability. The histograms of specimens printed without threads were included as well. Yet, the following explanations are only considered for the specimens printed with threads if not indicated.
Figure 9. Frequency histograms of the diameter of the bubbles produced during the squeegee process.
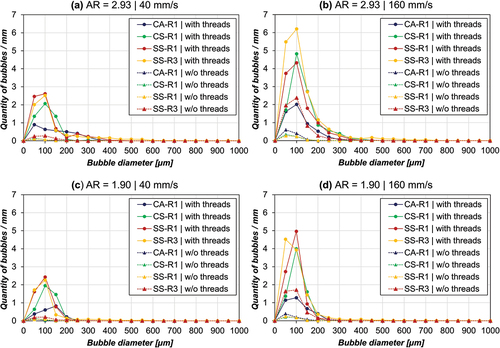
Overall, the diameter of the bubbles did not surpass 1000 µm and the majority of them remained below 300 µm. By increasing the squeegee speed from 40 to 160 mm/s, the quantity of bubbles more than doubled in average considering the four tested print conditions. When the aperture AR is increased from 1.90 to 2.93, the average quantity of bubbles increased about 44%. In all considered cases, the cleaned aperture (CA–R1) produced the smallest quantity of bubbles. The bubble formation drastically increased with a pre-wetted aperture, as represented by the profiles of the cleaned (CS–R1) and smeared stencil (SS–R1). Here, the quantity of bubbles stayed relatively constant independent of the cleanliness state of the stencil (CS–R1 or SS–R1), and the distribution of the bubble diameter maintained a similar range as well. In this case, the largest discrepancy was notable in bubbles of up to 50 µm in diameter. Specimens printed with a smeared stencil (SS–R1) presented about twice the quantity of bubbles of this size when compared to those printed with the cleaned stencil (CS–R1). When printing with the same adhesive roll for the third time (SS–R3), the quantity of bubbles kept in about the same level of specimens printed with a new adhesive roll (SS–R1). One exception here was observed using the larger aperture AR at 160 mm/s, which produced approximately 50% more bubbles with the three times used adhesive roll. In addition, SS–R3 specimens were the only ones that exhibited very large bubbles with more than 300 µm in diameter.
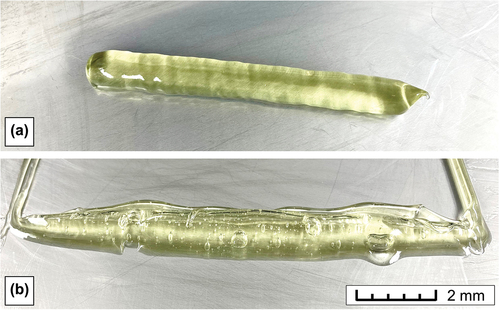
By combining the results from the diagrams with the recordings of the squeegee process and specimens characteristics, three main mechanisms for bubble formation were identified, as shown in . The first mechanism corresponds to bubbles that are not created due to the stencil threads but transferred from the adhesive roll into the aperture during the squeegee process. These bubbles are in general smaller than 300 µm and they hardly interact with stencil threads due to their size. This was confirmed by the fact that lines printed with the aperture without threads still presented bubbles but in considerable smaller quantities. In this case, lines printed with a new adhesive roll did not exhibit a significant quantity of bubbles independent of the squeegee speed. However, if a new adhesive roll was not added, the quantity of bubbles increased with the number of print cycles. presents an adhesive roll free of air bubbles before the squeegee process (a) and the same adhesive roll after three print cycles (b). The visible bubbles in the roll correspond to the ones that can be transferred into the aperture during the squeegee process. These bubbles might be created by random local instabilities during filling, but the main sources appear to be the air entrapment due to the lack of venting at the aperture extremity, as mentioned earlier, and due to the first contact or recontact between the squeegee and the adhesive over the stencil.
Figure 10. Identified bubble formation mechanisms during the squeegee process. The shown specimen segments were printed with an aperture AR of 2.93.
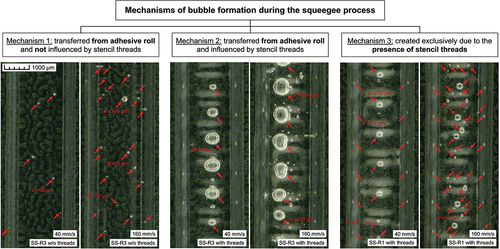
Figure 11. Adhesive roll over the stencil free of air bubbles before printing (a) and after three print cycles (b). In this case, the aperture with threads was used but very similar bubble characteristics inside the adhesive roll were observed when printing with the aperture without threads.
The second mechanism is very similar to the first one, with the difference that the stencil threads interact with large bubbles from the adhesive roll (shown in ) when these are entering the aperture. This was deduced considering the regular position of large bubbles coinciding with the threads pitch and by comparing specimens printed with and without threads. This mechanism was responsible for producing the largest bubbles identified (>300 µm), which solely emerged inside specimens printed with threads. Thus, it is plausible to say that the interactions with the threads might increase the final air volume of bubbles coming from the adhesive roll since the characteristics of bubbles produced inside the adhesive roll were very similar independent of the threads presence. Alternatively, the threads might also locally change flow conditions, which could facilitate the transfer of larger bubbles from the adhesive roll.
Finally, the third mechanism is exclusively related to the presence of stencil threads, as these bubbles presented a very uniform pattern correlated with the threads pitch. Here, bubbles having a broad size range between 50 and 300 µm appearing near the centreline were the main type responsible for increasing the quantity of bubbles when a higher squeegee speed was used. Moreover, bubbles typically smaller than 100 µm in diameter emerged very close to the aperture walls and mostly in pairs. These are the primary contributors to the increase of the bubbles quantity when printing with a pre-wetted aperture (CS–R1 and SS–R1) instead with a cleaned aperture (CA–R1). The formation mechanisms of these two types of bubbles could not be captured experimentally but were assessed by the numerical simulations.
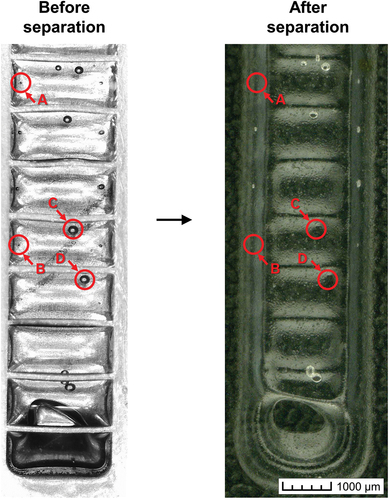
During the experiments it was also observed that bubbles can disappear after the separation process, as shown in . Bubbles close to the aperture walls and threads might stay in the aperture or break due to the separation process since filaments are stretched near these regions. However, this phenomenon happened only occasionally and has a considerable smaller impact than the mechanisms previously presented. Yet, this phenomenon should be still mentioned since these bubbles might remain inside the aperture after separation and reappear in the following printed specimen. Thus, considering this and the three bubble formation mechanisms shown in , it can be stated that all bubbles inside specimens printed with condition CA–R1 emerge due to the presence of stencil threads (Mechanism 3). Specimens produced with conditions CS–R1 and SS–R1 present bubbles that are majorly originated from Mechanism 3 since a new adhesive roll is used for these two conditions as well. Finally, specimens printed with condition SS–R3 exhibit bubbles from all mechanisms described before. It is possible to infer that all bubbles larger than 300 µm emerge due to Mechanism 2. However, excepting the small bubbles (<100 µm) close to the lateral walls exhibiting a uniform relative distance (Mechanism 3), the remaining bubbles cannot be categorized into their corresponding formation mechanism with certainty.
Figure 12. Comparison of the aperture before the separation process (left) and the final specimen (right) demonstrating how bubbles can disappear when located near the aperture walls and threads. This specimen was printed using condition SS–R1.
4. Modelling approach
This numerical study is focused on reproducing the basic formation mechanisms of incomplete regions and bubbles during the squeegee process. The simulations were performed only at a constant squeegee speed of 40 mm/s since it was already sufficient for both print defects to emerge. As previously discussed, a higher squeegee speed solely increased the quantity of bubbles but did not drastically change other characteristics of these print defects. For validation, the position and relative size of these defects were assessed alongside real specimens using microscope images and micro-CT scans. In addition, recordings of the adhesive motion during the squeegee process were compared with the simulation results to identify possible similarities. The CFD model was implemented in the commercially available software FLOW–3D,[Citation35] which applies the finite volume method (FVM) to numerically solve the conservation equations for mass and momentum. By neglecting turbulence effects and mass generation, these two equations can be described by the following expressions, respectively:
where is the adhesive density,
is the time,
is the divergence,
is the velocity vector, and
is the static pressure.
corresponds to the kinematic viscosity and
to the external body forces, such as gravitational and surface tension forces. To describe the free interface between the two fluids (adhesive and air), the volume of fluid (VOF) method is used:
The variable represents the proportion of the cell volume occupied by adhesive, with
signifying a cell entirely filled with air and
indicating a cell entirely filled with adhesive. Consequently, a partially filled cell is defined as
. At each step time, the interface between the fluids can be dynamically reconstructed based on this cell information and is iteratively recalculated considered the updated moving squeegee location. For further details about the model implementation, we refer here to the software’s user manual.[Citation38]
4.1. Model description and assumptions
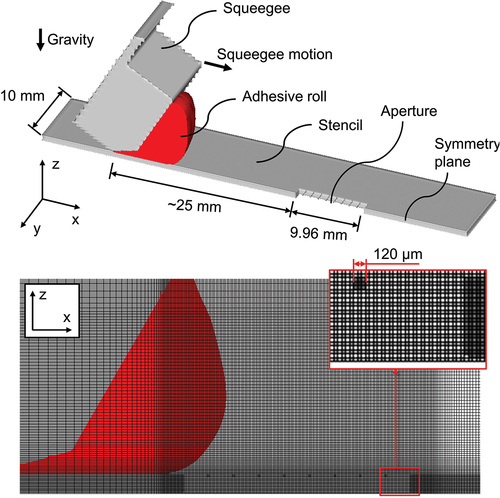
The same squeegee and threads dimensions from the experiments were incorporated into the model. To reduce computational effort, the aperture with 2.34 mm width (AR = 2.93) was modelled using an axisymmetric geometry, and only a line segment with 9.96 mm length was considered, as shown in . A 3D model was adopted since a 2D model is not able to capture the adhesive flow perpendicular to the squeegee direction, which is a decisive phenomenon inside the aperture during the filling process. In order to investigate the impact of venting on the formation of incomplete regions and bubbles, two different simulation cases were established. In the first case, a 50 µm gap between stencil and substrate was integrated to allow air to escape from the aperture during filling. This should be equivalent to condition CA–R1 tested experimentally. In the second case, the model did not include a gap and should correspond to condition SS–R1. Here, it is important to note that the simulation model did not contain pre-wetted aperture walls or threads, which has to be considered when comparing it with experimental results.
Figure 13. Model overview with relevant dimensions and mesh details.
The following assumptions have been further considered for the model:
The simulation domain contains only two phases (adhesive and air) with constant volumes, where the adhesive motion is simulated as an incompressible and laminar fluid flow.
The stencil and squeegee are modelled as rigid bodies and exhibit no-slip boundary conditions. A horizontal translational speed is given to the squeegee to simulate the filling process, and the stencil remains stationary. There is no gap between the squeegee tip and the stencil.
The shear thinning viscosity of the adhesive was defined in a tabular form between the shear rates of 10 and 100 s−1, see .
The measured adhesive surface tension and its equilibrium contact angle with the stencil surface were included in the material model. The same equilibrium contact angle was adopted for the squeegee surface in the simulation.
The entire simulation domain was meshed with regular block shaped cells adopting a commonly used meshing strategy, where the cells exhibit reducing dimensions towards the aperture region and remain unchanged throughout the entire simulation time, as shown in . To minimize repeated calculations, the squeegee process was modelled using a two-step approach. In the first step, the adhesive over the stencil rolls for about 25 mm up to near the aperture, reproducing the initial conditions from the experiments. The rolling motion of the adhesive reduces the viscosity due its shear thinning properties, which can impact the filling behaviour. This step was identical in both simulation cases, and the adhesive roll remained free of air bubbles. A coarser mesh with cell sides of up to 750 µm was applied for this step resulting in a simulation domain with about 1.8 million cells. In the second step, the adhesive starts entering the aperture, which corresponds to the simulation stage of main interest. Inside the aperture, the cells exhibited equal sides of 40 µm, which was adopted as a balance between computational time and accuracy. Using this mesh approach, the second domain contained about 3 million cells. The time step was automatically adjusted and ranged from 1 × 10³ to 1 × 10⁴ s during the first step while in the second one it stayed between 1 × 10⁻⁴ and 1 × 10⁻⁵ s.
4.2. Simulation results and validation
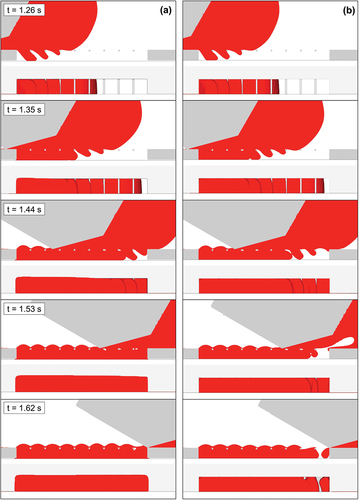
shows two simultaneous views from the symmetry plane and aperture bottom over the simulation time during the aperture filling with (a) and without (b) a gap between stencil and substrate. As can be seen, the adhesive is able to completely fill the aperture when a gap for venting is available. When the gap is removed, the right aperture extremity remains unfilled due to the enclosed volume formed between substrate, aperture walls and adhesive (t = 1.44 s). In this case, the formation of an air bubble inside the adhesive roll (t = 1.53 s) was captured by the simulation as well, agreeing with the experiment results presented in . Another important phenomenon observed in the experiments and replicated by the model was the adhesive infiltrating the gap between the stencil and substrate, resulting in the formation of smearings that remained smaller than 0.15 mm in the simulation.
Figure 14. Simultaneous views (∆t = 0.09 s) from the symmetry plane and aperture bottom of the simulated squeegee process with (a) and without (b) a gap between stencil and substrate.
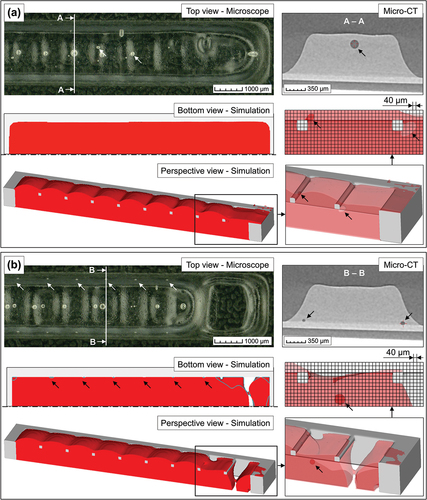
The simulations were also able to reproduce the formation of bubbles due to the presence of threads, as previously described by the third mechanism shown in . In the simulation case without a gap, bubbles with size ranging between 50 and 100 µm formed at the aperture walls and substrate surface with their relative distance coinciding with the threads pitch. When entering the aperture, the adhesive front is split by the threads into two smaller fronts that entrap air when reencountering at the substrate surface (t = 1.35 s). As the squeegee advances, the air is pushed towards the lateral walls but remains inside the aperture due to lack of venting. From micro-CT scans, it was possible to verify that these bubbles are touching the substrate surface as well, see . Thus, these simulation results correlate very well with real specimens printed using condition SS–R1. Here is important to stress that the bubbles in the simulation are directly touching the aperture walls and would disappear in a subsequent separation process. In the real specimens, these bubbles are not contacting the aperture walls before separation, as shown in . This difference can be explained by the fact that the aperture in the simulation is not pre-wetted with adhesive before being filled, which differs from real SS–R1 conditions. Hence, the formation of these bubbles near the aperture walls results from the interplay between the incoming adhesive pushed by the squeegee and the adhesive that is pre-wetting the aperture walls. For comparison, these bubbles near the aperture walls did not appear when venting was available in the simulation, which also correlates with real specimens printed with CA–R1 conditions.
Figure 15. Qualitative comparison of representative specimens (scanned with microscope and micro-CT) and corresponding simulation exhibiting the final state of the aperture after the squeegee process with (a) and without (b) a venting gap. Bubbles produced due to the presence of threads (Mechanism 3) are visible in both experimental and simulation results, as indicated by the arrows. Two additional views (perspective and symmetry plane showing mesh cell size) of the two last threads (aperture extremity) from the simulated cases were included with the adhesive showing transparent properties to better visualize the generated bubbles.
Bubbles along the aperture centreline were formed in both simulation cases as well, see . These bubbles are located close to or on the threads and exhibited sizes in the range of 100 to 200 µm, which fairly correlates with the experimental results. In the model, these bubbles only remained at the two last threads of the aperture. However, it is possible to observe bubbles forming around the other threads during filling (t = 1.44 s) but are broken after the squeegee tip passes through them (t = 1.62 s). In the experiments, these bubbles were visible all along the line length using conditions CA–R1 and SS–R1. Hence, the formation of these bubbles is unaffected by whether the threads are pre-wetted with adhesive or not. This discrepancy can be related to the apparent higher difficulty for the bubbles to detach from the threads in the model, which might be associated with insufficient small cell elements or simplifications in the material model.
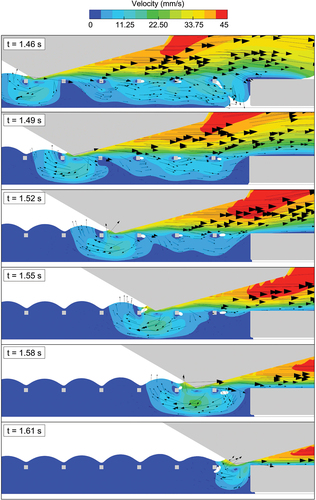
To better understand this behaviour, presents the resulting adhesive velocity during the aperture filling for the case with a venting gap. The bubbles around the threads are formed approximately 4 to 6 mm in front of the squeegee tip (t = 1.46 s) and remain attached up until the squeegee tip reaches them (t = 1.55 s). The generated adhesive flow around the bubbles is not sufficient to release these from the threads. About 1 mm in front of the squeegee tip, a region with practically zero velocity is formed due to the flow direction change inside the aperture (t = 1.46 s). Immediately below the squeegee tip, the adhesive flow follows the squeegee direction but is gradually reorientated towards the substrate surface up until reaching the opposite direction of the squeegee. This reorientation leads to the formation of a backflow behind the squeegee tip, which causes a local overfilling of the aperture and contributes to break the bubbles around the threads (t = 1.55 s). When approaching the aperture extremity, the backflow region is affected by the aperture wall, which can explain why these bubbles only formed near the last two threads in the simulation.
Figure 16. Detailed symmetry plane view (∆t = 0.03 s) showing the resulting adhesive velocity for the simulation case with a venting gap between the stencil and substrate. The velocity vectors and fields are represented for a stationary observer fixed on the stencil.
This backflow was also observed experimentally but not in the same intensity as in the simulations. This difference can be related to the reduced viscosity range adopted and calibrated for the model, which used the viscosity value at 10 s−1 for lower shear rates. In addition, the neglected thixotropic properties of the adhesive might also have an impact on this response. Simulations using a larger range for the shear thinning viscosity of up to 0.1 and 1 s−1 were carried out but the higher viscosity avoided the reliable filling of the aperture, preventing any assessment of bubble formation during this step. Thus, the model is sensitive to changes in the viscosity range and should be recalibrated when, for instance, the squeegee speed is considerably increased. Additional simulation cases were not conducted since the formation of incomplete regions and bubbles was already detected and an appropriate investigation of the mentioned models deviations would go beyond the scope of this paper.
5. Sealing design with optimized print conditions
In this section, new strategies based on the presented experimental and numerical results were assessed to enhance the print conditions of the sealing design. Primary focus was placed on minimizing the process cycle time and on reducing print defects. The exhibited findings indicate that bubbles cannot be completely eliminated when using a stencil with threads. However, when using a new adhesive roll, the bubble diameter generally did not surpass 300 µm independent of the squeegee speed. Therefore, for every new specimen, a new adhesive roll was used. Despite producing more bubbles, the higher squeegee speed of 160 mm/s was favoured since these marginally impacted the process reliability. Yet, it should be emphasized that the influence of such bubbles on other sealing characteristics still needs to be quantified experimentally. For instance, previous studies have shown that voids inside composite and polymeric materials can notably diminish gas permeability, which on the other hand might be also compensated by increasing the sealing width or altering material properties.[Citation39–43] Hence, systematic investigations should be conducted in the future to assess the real performance of sealings printed with stencil printing and determine how process parameters can be actively adjusted to control gas permeability.
It is possible to reduce the number of stencil threads and consequently the quantity of bubbles. However, the mechanical stability of the stencil must be re-evaluated when altering the threads design. In this case, the stencil was not changed but the orientation of the sealing design relative to the squeegee direction was rotated by 20°. This angle was selected based on previous experiments to shift the position of incomplete regions to the sealing edges highlighted in . Yet, solely adjusting the sealing orientation was not sufficient to prevent all filling defects, which can be considered the major cause for print inconsistencies. For this reason, four different approaches were investigated to achieve a completely filled sealing, as reported in . Here, only approaches using the least amount of cleaning were considered since adding a cleaning step before printing every single specimen can substantially increase cycle time and production costs. Thus, all approaches were conducted using a pre-wetted aperture with a smeared stencil (SS–R1 condition), and three specimens were printed in sequence to confirm the observations. It is also important to note that, despite rotating the sealing design at 20° or adding a second squeegee stroke, the observed quantity and size of bubbles did not notably change compared to sealings printed at 0° with a single squeegee stroke. Thereby, further bubble characterisations were not conducted to analyse the influence of these parameters.
Figure 17. Illustration of the rotated stencil with the sealing design and indication of regions exhibiting filling problems.
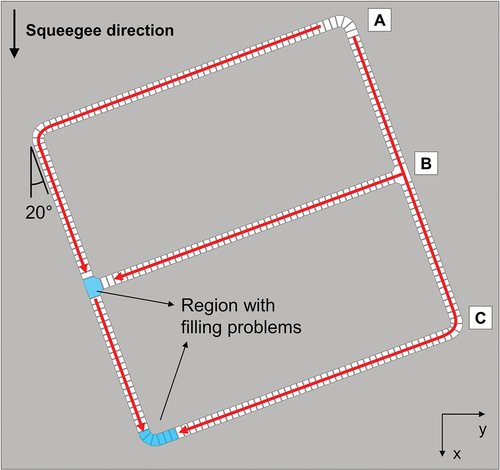
Table 2. Overview of evaluated approaches to eliminate incomplete regions in the sealing design.
The first approach was based on introducing a gap of 0.2 mm between stencil and substrate, also sometimes referred as snap-off distance.[Citation44,Citation45] It was expected that this gap could provide sufficient venting to fill the aperture entirely. However, no significant improvement in avoiding incomplete regions was observed compared to sealings printed without a gap, see . Here, the squeegee vertical pressure closes the gap when it advances towards the aperture, and the smearings at the stencil underside act, as previously described, as an additional seal that inhibit air being expelled through it. Additional tests including the cleaning of the stencil enhanced the filling completeness of the T-intersection, but the last sealing edge (at line C) still remained incomplete.
Figure 18. Representative specimens printed with four different approaches to avoid the formation of incomplete regions: (a) single squeegee stroke with snap-off distance, (b) double squeegee stroke, (c) double squeegee stroke with snap-off distance, and (d) single squeegee stroke with local tape pieces.
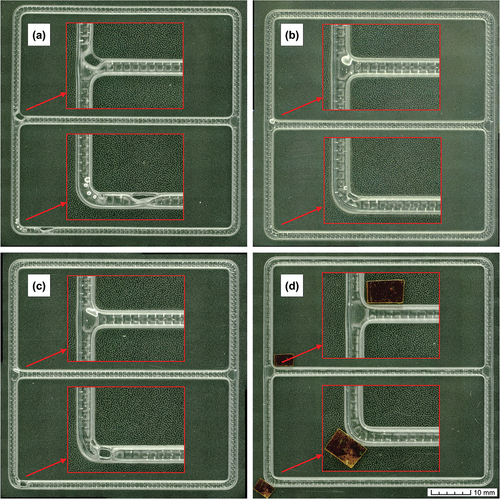
The second and third approaches relied on using two squeegee strokes moving forwards and backwards. The idea here was that a second squeegee stroke could eliminate the incomplete regions by pushing adhesive from the opposite direction. However, this approach was insufficient to completely prevent this print defect as well. Adding a gap of 0.2 mm between stencil and substrate also did not improve the filling completeness. Instead of an incomplete filling, large bubbles usually larger than 1000 µm formed at these regions, see cases (b) and (c) in . The main disadvantage of this approach is that it requires at least twice the time for the squeegee process. Yet, an additional squeegee stroke can be considered to have a smaller impact on production efficiency compared to introducing a cleaning step before every single specimen.
For the fourth approach, local gaps of about 0.2 mm height were introduced between the stencil and substrate by adding a small piece of adhesive tape near the edges with filling problems. The main difference to the first approach is that the gap created by the piece of tape does not close due to the squeegee vertical pressure or due to smearings. Thus, a small venting channel is maintained during the squeegee process that allows air to escape the aperture at those edges, ensuring the complete filling of the entire sealing, see . The use of a tape piece was solely a simple method to prove the effectiveness of a local gap and more sophisticated approaches can be used, such as integrating a local elevation or channel on the substrate or stencil.[Citation46–48]
6. Conclusions
The squeegee process to print a basic sealing including relevant design features close to real fuel cell applications was optimized using experimental and numerical approaches. First, incomplete regions and bubbles forming during the squeegee process were detected as the main print defects. An additional stencil containing only lines with and without threads was used to isolate the formation mechanisms of these two defects. It was shown that the stencil cleanliness state considerably impacts the venting conditions inside the aperture during filling and thereby is determinant on the emergence of incomplete regions. Moreover, three main formation mechanisms of bubbles were proposed, evidencing that pre-existing bubbles inside the adhesive roll might be transferred into the aperture by the squeegee movement or produced due to interactions between the adhesive and stencil threads. The developed numerical model presented an overall good agreement with experimental observations and was able to reproduce the formation of incomplete regions and bubbles as well.
By combining experiment and simulation results it was verified that bubbles cannot be completely avoided when using a stencil with threads. However, by adding a new adhesive roll for every new print cycle, the quantity of bubbles can be reduced, and their diameter remained generally smaller than 300 µm, which was considered to have a minor impact on the process reliability. Based on these findings, four different print strategies focused on minimizing the print cycle time were assessed to eliminate incomplete regions emerging in the sealing design. By reorienting the aperture relative to the squeegee direction and maintaining a local gap during the squeegee process, this printing issue was prevented and the reproducible filling of the entire sealing was successfully achieved.
Disclosure statement
The authors declare the following financial interests/personal relationships which may be considered as potential competing interests: Fabiano I Indicatti and Michael Rädler have patents pending or held to Robert Bosch GmbH. Co-author Klaus Dilger is a member of the Editorial Advisory Board at The Journal of Adhesion.

Additional information
Funding
References
- Mehta, V.; Cooper, J. S. Review and Analysis of PEM Fuel Cell Design and Manufacturing. J. Power Sources. 2003, 114(1), 32–53. DOI: 10.1016/S0378-7753(02)00542-6.
- Jörissen, L.; Garche, J. Polymer Electrolyte Membrane Fuel Cells. In Hydrogen and Fuel Cell, 1st ed.; Töpler, J. Lehmann, J., Eds.; Springer Vieweg: Berlin/Heidelberg, 2016; pp. 239–281.
- Bieringer, R.; Adler, M.; Geiss, S.; Viol, M. Gaskets: Important Durability Issues. In Polymer Electrolyte Fuel Cell Durability, Büchi, F., Inaba, M. Schmidt, T., Eds.; Springer: New York, 2009; pp. 271–281. DOI: 10.1007/978-0-387-85536-3_13.
- Heimes, H.; Kehrer, M.; Hagedorn, S.; Hausmann, J.; Krieger, G.; Müller, J. Production of fuel cell components, 2nd ed.; PEM of RWTH Aachen University and VDMA AG Fuel Cell: Aachen, 2022.
- Indicatti, F. I.; Rädler, M.; Günter, F.; Stammen, E.; Dilger, K. Stencil Printing of Adhesive-Based Fuel Cell Sealings: The Influence of Rheology on Bubble Formation During the Separation Step. Proc. Inst. Mech. Eng. Part C J. Mech. Eng. Sci. 2022, 238(7), 2552–2567. DOI: 10.1177/09544062221121991.
- Indicatti, F. I.; Rädler, M.; Stammen, E.; Dilger, K. Optimizing Adhesive Rheology for Stencil Printing of Fuel Cell Sealings Using Supervised Machine Learning. Int. J. Adhes. Adhes. 2024, 132, 103693. DOI: 10.1016/j.ijadhadh.2024.103693.
- Dušek, M.; Hunt, C. A Novel Measurement Technique for Stencil Printed Solder Paste. Solder. Surf. Mount. Technol. 2003, 15(2), 35–45. DOI: 10.1108/09540910310479512.
- Zou, L.; Dušek, M.; Wickham, M.; Hunt, C. Characterising Stencil Printing of Surface Mount and Conductive Adhesives; NPL Report. MATC(A)55, 2002.
- Freudenberg-NOK. Ice Cube Sealing Prototyping Sheets. https://www.fst.com/-/media/files/gated/solution-sheets/en/ice-cube-sealing_fst.pdf (accessed Mar 24, 2024).
- Freudenberg-NOK. Elastomeric Seals for Bipolar Plates. https://www.fst.com/-/media/files/gated/solution-sheets/en/elastomeric-seals-for-bipolar-plates_fst.pdf (accessed Mar 24, 2024).
- Xu, Q.; Zhao, J.; Chen, Y.; Liu, S.; Wang, Z. Effects of Gas Permeation on the Sealing Performance of PEMFC Stacks. Int. J. Hydrogen. Energy. 2021, 46(73), 36424–36435. DOI: 10.1016/j.ijhydene.2021.08.137.
- Zhao, J.; Guo, H.; Ping, S.; Guo, Z.; Lin, W.; Yang, Y.; Shi, W.; Wang, Z.; Ma, T. Research on Design and Optimization of Large Metal Bipolar Plate Sealing for Proton Exchange Membrane Fuel Cells. Sustainability. 2023, 15(15), 12002. DOI: 10.3390/su151512002.
- Tepner, S.; Lorenz, A. Printing Technologies for Silicon Solar Cell Metallization: A Comprehensive Review. Prog. Photovoltaics Res. Appl. 2023, 31(6), 557–590. DOI: 10.1002/pip.3674.
- Hoornstra, J.; Roberts, S.; Moor, H.; Bruton, T. First Experiences with Double Layer Stencil Printing for Low Cost Production Solar Cells. Vienna: 2nd World Conf Photovoltaic Solar Energy Conv. 1998, 1527–1530.
- Hoornstra, J.; Moor, H.; Weeber, A.; Wyers, P. Improved Front Side Metallization on Silicon Solar Cells with Stencil Printing. Glasgow: 16th Eur. Photovoltaic Solar Energy Conf. Exhib. 2000, 1, 5.
- Rösch, M. Potenziale und Strategien zur Optimierung des Schablonendruckprozesses in der Elektronikproduktion. Doctoral Dissertation, FAU, Erlangen, 2011.
- Seo, W.; Kim, J. Filling Analyses of Solder Paste in the Stencil Printing Process and Its Application to Process Design. Solder Surf. Mt. Technol 2013, 25(3), 145–154. DOI: 10.1108/SSMT-Oct-2012-0022.
- Rusdi, M. S.; Abdullah, M. Z.; Ishak, M. H. H.; Aziz, M. S. A.; Abdullah, M. K.; Rethinasamy, P.; Jalar, A. Three-Dimensional CFD Simulation of the Stencil Printing Performance of Solder Paste. Int. J. Adv. Manuf. Technol. 2020, 108(9–10), 3351–3359. DOI: 10.1007/s00170-020-05636-9.
- Kumar, S.; Mallik, S.; Ekere, N.; Jung, J. Stencil Printing Behavior of Lead-Free Sn-3Ag-0.5 Cu Solder Paste for Wafer Level Bumping for Sub-100 μm Size Solder Bumps. Met. Mater. Int. 2013, 19(5), 1083–1090. DOI: 10.1007/s12540-013-5025-z.
- Barlow, F. D.; Elshabini, A. Ceramic Interconnect Technology Handbook, 1st ed.; CRC Press: New York, NY, 2007; p. 227.
- Dittrich, S.; Reitz, E.; Schell, K. G.; Bucharsky, E. C.; Hoffmann, M. J. Development and Characterization of Inks for Screen Printing of Glass Solders for SOFCs. Int. J. Appl. Ceram. Technol. 2020, 17(3), 1304–1313. DOI: 10.1111/ijac.13461.
- Pennemann, H.; Dobra, M.; Wichert, M.; Kolb, G. Optimization of Wash-Coating Slurries As Catalyst Carrier for Screen Printing into Microstructured Reactors. Chem. Eng. & Technol. 2013, 36(6), 1033–1041. DOI: 10.1002/ceat.201200637.
- Sborikas, M.; Qiu, X.; Wirges, W.; Gerhard, R.; Jenninger, W.; Lovera, D. Screen Printing for Producing Ferroelectret Systems with Polymer-Electret Films and Well-Defined Cavities. Appl. Phys. A 2014, 114(2), 515–520. DOI: 10.1007/s00339-013-7998-3.
- Kamp, M.; Efinger, R.; Gensowski, K.; Bechmann, S.; Bartsch, J.; Glatthaar, M. Structuring of Metal Layers by Electrochemical Screen Printing for Back-Contact Solar Cells. IEEE J. Photovoltaics. 2018, 8(3), 676–682. DOI: 10.1109/JPHOTOV.2018.2802201.
- Hong, H.; Jiang, L.; Tu, H.; Hu, J.; Yan, X. Formulation of UV Curable Nano-Silver Conductive Ink for Direct Screen-Printing on Common Fabric Substrates for Wearable Electronic Applications. Smart Mater. Struc 2021, 30(4), 045001. DOI: 10.1088/1361-665X/abe4b3.
- Wilson, S.; Howison, S.; Parker, D. Void Elimination in Screen Printed Thick Film Dielectric Pastes. Math. Ind. Rep. 2021, 145, 1–12. DOI: 10.33774/miir-2021-vgnwr.
- Bommineedi, L. K.; Upadhyay, N.; Minnes, R. Screen Printing: An Ease Thin Film Technique. In Simple Chemical Methods for Thin Film Deposition: Synthesis and Applications, Sankapal, B., Ennaoui, A., Gupta, R. Lokhande, C., Eds.; Springer Nature: Singapore, 2023; pp. 449–507. DOI: 10.1007/978-981-99-0961-2_11.
- Riemer, D. E. Ein Beitrag zur Untersuchung der physikalisch-technischen Grundlagen des Siebdruckverfahrens. Doctoral Dissertation, TU, Berlin, Berlin, 1988.
- Krammer, O.; Al-Ma’aiteh, T. I.; Illes, B.; Bušek, D.; Dušek, K. Numerical Investigation on the Effect of Solder Paste Rheological Behaviour and Printing Speed on Stencil Printing. Solder Surf. Mt. Technol. 2020, 32(4), 219–223. DOI: 10.1108/SSMT-11-2019-0037.
- Glinski, G. P.; Bailey, C.; Pericleous, K. A. A Non-Newtonian Computational Fluid Dynamics Study of the Stencil Printing Process. Proc. Inst. Mech. Eng. Part C J. Mech. Eng. Sci. 2001, 215(4), 437–446. DOI: 10.1243/0954406011520869.
- Kay, R. W.; Stoyanov, S.; Glinski, G. P.; Bailey, C.; Desmulliez, M. P. Ultra-Fine Pitch Stencil Printing for a Low Cost and Low Temperature Flip-Chip Assembly Process. IEEE Trans. Compon. Packag. Technol. 2007, 30(1), 129–136. DOI: 10.1109/TCAPT.2007.892085.
- Durairaj, R.; Jackson, G. J.; Ekere, N. N.; Glinski, G.; Bailey, C. Correlation of Solder Paste Rheology with Computational Simulations of the Stencil Printing Process. Solder. Surf. Mount. Technol. 2002, 14(1), 11–17. DOI: 10.1108/09540910210416422.
- Ishak, M. H. H.; Ismail, M. I.; Mat, S.; Ismail, F.; Mohd Salleh, M. A. A. Influence of Squeegee Impact on Stencil Printing Process: CFD Approach. IOP Conf. Ser Mater. Sci. Eng. 2020, 957(1), 012065. DOI: 10.1088/1757-899X/957/1/012065.
- Choi, S. A.; Youn, J. T.; Mok, J. S.; Koo, C. W. Computer Simulation of Ink Transfer in the Different Printing Speed and Ink Viscosity in the Screen Printing. J Korean Graph. Arts Commun Soc. 2011, 29(1), 75–83.
- Flow Science, Inc. Santa Fe, NM, USA. FLOW-3D® Version 2023R1. 2023. https://www.flow3d.com/
- Schindelin, J.; Arganda-Carreras, I.; Frise, E.; Kaynig, V.; Longair, M.; Pietzsch, T.; Preibisch, S.; Rueden, C.; Saalfeld, S.; Schmid, B. Fiji: An Open-Source Platform for Biological-Image Analysis. Nat. Methods. 2012, 9(7), 676–682. DOI: 10.1038/nmeth.2019.
- Preibisch, S.; Saalfeld, S.; Tomancak, P. Globally Optimal Stitching of Tiled 3D Microscopic Image Acquisitions. Bioinformatics. 2009, 25(11), 1463–1465. DOI: 10.1093/bioinformatics/btp184.
- FLOW-3D® Version 2023R1 Users Manual. FLOW-3D [Computer Software]; Flow Science, Inc: Santa Fe, NM, 2023. https://www.flow3d.com.
- Murray, B. R. Characterisation of Rotationally Moulded Polymer Liners for Low Permeability Cryogenic Applications in Composite Overwrapped Pressure Vessels. Doctoral Dissertation, National University of Ireland, Galway, 2016.
- Grimsley, B. W.; Cano, R. J.; Johnston, N. J. Hybrid Composites for LH2 Fuel Tank Structure; NASA Langley Research Center: Hampton, USA, 2001.
- Jackson, J. R.; Vickers, J.; Fikes, J. Composite Cryotank Technologies and Development 2.4 and 5.5m Out of Autoclave Tank Test Results. Composites and Advanced Materials Expo (CAMX); Dallas, USA, Oct 26–29, 2015.
- Guan, C.; Zhan, L.; Shi, H. Simulation and Experiment Analysis of Relationship Between Voids and Permeability of Composites. Proc. Inst. Mech. Eng. Part L J Mater. Des. Appl. 2022, 236(1), 23–36. DOI: 10.1177/14644207211026942.
- Saha, S.; Rani, W. S. A Review on Gas Permeability of Polymer Matrix Composites for Cryogenic Applications. J. Compos. Mater. 2024, 00219983241228550. DOI: 10.1177/00219983241228550.
- Yang, T.; Tsai, T. N. A Neurofuzzy-Based Quality-Control System for Fine Pitch Stencil Printing Process in Surface Mount Assembly. J. Intell. Manuf. 2004, 15, 711–721. DOI: 10.1023/B:JIMS.0000037719.35871.aa.
- Manessis, D.; Patzelt, R.; Ostmann, A.; Aschenbrenner, R.; Reichl, H. Technical Challenges of Stencil Printing Technology for Ultra Fine Pitch Flip Chip Bumping. Microelectron. Reliab. 2004, 44(5), 797–803. DOI: 10.1016/S0026-2714(03)00361-5.
- Indicatti, F. I.; Rädler, M. Device and Method for Printing a Substrate with a Sealant And/Or Adhesive. DE102022209195A1, German Patent and Trade Mark Office, 2024.
- Indicatti, F. I.; Rädler, M. Method for Printing a Substrate with a Sealant And/Or Adhesive, Electrochemical Cell with a Printed Seal. DE102022209196A1, German Patent and Trade Mark Office, 2024.
- Indicatti, F. I.; Rädler, M. Device and Method for Printing a Substrate with a Sealant And/Or Adhesive. DE102022209197A1, German Patent and Trade Mark Office. 2024.