
 ?Mathematical formulae have been encoded as MathML and are displayed in this HTML version using MathJax in order to improve their display. Uncheck the box to turn MathJax off. This feature requires Javascript. Click on a formula to zoom.
Abstract
Insects hold enormous potential to address food and nutritional security issues. The honey bee is a key insect, given its importance for pollination, as well as its products which can be directly consumed, like honey, pollen and brood. Research on edible insects is an emerging field that draws upon methods and techniques from related fields of research. In this paper, we provide recommendations and research protocols centered on production of worker and drone brood for human consumption, on brood harvesting, including hygienic considerations, on nutritional aspects of brood, on sensory analyses of brood and brood products and on the gastronomic applications of honey bee brood; all of which will help elucidate the edible potential of honey bee brood now, and in the future.
Los insectos tienen un enorme potencial para abordar cuestiones de seguridad alimentaria y nutricional. La abeja de la miel es un insecto clave, dada su importancia para la polinización, así como por sus productos que pueden consumirse directamente, como la miel, el polen y la cría. La investigación sobre insectos comestibles es un campo emergente que se basa en métodos y técnicas de campos de investigación relacionados. En este documento, proporcionamos recomendaciones y protocolos de investigación centrados en la producción de obreras y en la cría de zánganos para el consumo humano, sobre la producción de cría, incluyendo consideraciones sobre la higiene, en los aspectos nutricionales de la cría, en los análisis sensoriales de la cría y los productos de la cría y en las aplicaciones gastronómicas de la cría de la abeja de la miel, todo lo cual ayudará a dilucidar el potencial comestible de la cría de las abejas de la miel, ahora y en el futuro.
将蜜蜂幼虫制备成食物的标准方法昆虫在保障食物供应和营养安全问题上的作用巨大。蜜蜂不但是重要的授粉昆虫,而且能提供食用蜂产品,比如蜂蜜,花粉和蜜蜂幼虫。研究食用昆虫是一个新兴的领域。食用制备技术与方法也在相关领域的研究中形成。在本文中,我们介绍雄蜂和工蜂幼虫的食用方法,包括幼虫收集、卫生、营养、检测和美食搭配。这些都将有助于阐明目前以及将来蜜蜂幼虫作为可食用昆虫的潜力。
1. Introduction
The potential of insects for food
and feed has gained global attention in the past few years, and with good reason: many species require fewer resources to rear, have a lower environmental impact than conventional livestock (Oonincx et al., Citation2010), are highly nutritious (Rumpold & Schlüter, Citation2013), and are celebrated for their high gastronomic value in much of the world. Approximately 2,000 species are consumed (van Huis et al., Citation2013) in at least 113 countries (Macevilly, Citation2000). By no means are insects a “new” food to humanity and their potential for improving global food systems by diversifying our food supplies is considerable high.
Brood of the honey bee (Apis mellifera) is a particularly promising edible resource, as honey bees are kept by humans worldwide, and in many cultures eaten as a delicacy. Consumption of honey bee brood is a common cultural practice in regions as diverse as Mexico (Ramos-Elorduy et al., Citation1997), Ecuador (Onore, Citation1997), China (Zhi-Yi, Citation1997), Thailand (Yhoung-Aree, Puwastien, & Attig, Citation1997), Senegal (Gessain & Kinzler, Citation1975), Zambia (Mbata, Citation1995) and Australia (de Foliart, Citation2002). Honey bee brood is valued for its rich nutritional composition of proteins, fatty acids, vitamins and minerals (Finke, Citation2005; Hocking & Matsumura, Citation1960; Rumpold & Schlüter, Citation2013), as well as its pleasing taste and versatility in culinary preparations (Evans, Citation2013, Citation2014).
In certain regions of the world, drone brood removal has become part of regular hive maintenance by beekeepers as a strategy for managing populations of the varroa mite (Varroa destructor), widely recognized as the most harmful parasite affecting honey bees worldwide (Dietemann et al., Citation2013). This practice makes honey bee drone brood a by-product, producing an abundant source of farmed insects with untapped potential.
In 2015, the European Food safety Authority (EFSA) reviewed food safety risks associated with production and consumption of insects (European Food safety Authority (EFSA), Citation2015). The review covered insect species identified to be relevant for farming in closed farming systems in Europe and elsewhere. Since honey bee production is not a closed production system, the perspective of bee-brood harvested for human consumption was not specifically covered. Also, bee-brood is legislatively an api byproduct. The overall findings for other insect species-such as grasshoppers, crickets and mealworms – were that there were no additional or specific biological safety risks associated with the production and consumption of these insects, when compared to traditional livestock production systems.
Research on honey bee biology and breeding has a long history as compared with other candidates for insect farming and in many parts of the world the link between research and beekeepers are ensured by extension services. Furthermore, compared with other forms of local natural resource development, setting up hives and beekeeping practice require relatively little arable surface and low financial investment. In addition honey bees provide important pollination services; stimulating ecological robustness, agricultural production and related local economies in rural and urban areas. Considering this, we recommend further research into the potential of honey bee brood for human food and food systems. Very limited research has been performed so far, thus scientific protocols have not yet been fully developed on all subjects; hence this chapter will have a mixture of both considerations and more developed protocols.
2. Production of worker brood
Honey bees have developed a mechanism to react to changes in the ratio of pollen supply and protein demand of the brood. Under pollen deprivation, brood rearing in a colony is at first limited (Hrassnigg & Crailsheim, Citation1998; Imdorf, Rickli, Kilchenmann, Bogdanov, & Wille, Citation1998) later, eggs and young larvae are cannibalized, thereby providing protein to feed other larvae (Boes, Citation2010). Genetic and environmental factors can influence the bee brood production directly or indirectly by modulating the food flow to the hive. Queen age and colony composition and size are also crucial factors for optimal brood production, a young and healthy queen has higher egg production, while her capacity decreases with age (Gary, Citation1992), and small colonies of 2,300–9,000 bees produce more bee brood per bee than more populous ones (Harbo, Citation1986). Colonies without pollen supply maintain brood rearing only for a short time. Thus, research in pollen resources or supplementary diet is essential for a high production of worker brood.
2.1. Subspecies and queens
Honey bee subspecies greatly vary genetically, physiologically and behaviorally (Ruttner, Citation1988), in particularly in response to climatic and environmental factors, such low or high temperature, food utilization and reproductive traits (DeGrandi-Hoffman, Eckholm, & Huang, Citation2013). For further details on characterization of honey bee subspecies see the BEEBOOK chapter of Meixner et al. (Citation2013). The queen quality such as age and mating age are important for her reproduction and thus important to consider before an experimental setup. For further details, see the BEEBOOK chapter on standard methods for rearing and selection of Apis mellifera queens (Büchler et al., Citation2013).
| (1) | Be sure that the same subspecies of honey bee is used for all the treatments in the experiment, including control. | ||||
| (2) | Choose full sister queens in order to minimize the influence of genetic variability. | ||||
| (3) | Choose queens that have been mated by several drones to ensure genetic variation within colony variation. | ||||
2.2. Setting up experimental colonies
It is important to use experimental colonies of uniform strength either by use of the classical objective mode or shook swarm, see the BEEBOOK chapter on measuring colony strength parameters (Delaplane et al., Citation2013). If the classical objective mode is chosen (described in Delaplane et al., Citation2013), presence/absence of brood at the beginning is an option worth considering. Small nucleus hives containing five frames are called “nucs” by beekeepers) and are ideal for brood production. They may be occupied by ~9,000 workers, thus a size for optimal brood production per worker (Harbo, Citation1986). However standard hives can also be used in particular in regions with cold weather, in which the colony should be more populous to foster thermoregulation.
Small nucleus hives have the advantages of optimal brood production and they are cheaper, lighter, and portable. Standard hives can be an advantage when conducting food supplement experiments since it will permit sufficient space for food stocking in the control hives (where brood is not removed), thus leaving enough space for the queen to lay new eggs (Martinez, personal observation).
In order to get reliable data from experiments it is important to work with healthy colonies thus check the experimental colonies, or the source of the workers for clinical symptoms of bacterial, fungal and viral diseases (de Graaf et al., Citation2013; de Miranda et al., Citation2013; Forsgren, Budge, Charrière, & Hornitzky, Citation2013; Fries et al., Citation2013; Jensen et al., Citation2013). Pesticide residues at sub-lethal doses can have negative effects on brood and adult emergence (Wu, Anelli, & Sheppard, Citation2011) thus it is also recommended to get wax from combs and foundations analyzed. Pesticide residues can also affect human health (Blair, Ritz, Wesseling, & Freeman, Citation2014) thus residues in the brood for human consumption should also be tested.
2.3. The site of the experimental apiary
If the experiment is based, partly or totally, on natural feeding of the bees – control and treatment colonies have to be placed in the same apiary. If a geographic comparison is part of the experimental design, the hives will be allocated to different apiaries, but each treatment and control should be assigned to each site.
| (1) | Choose a sunny open site to prevent humidity and to allow sooner activity of the foragers (Ambrose, Citation1995). At the contrary, in very hot regions, choose a naturally shadowed place, e.g., by high trees. Be aware of the wind regime because it may impact the forager activities, as well as the cooling of the hives. | ||||
| (2) | Locate the experimental apiary on dry and well drained ground, on a stand. | ||||
| (3) | If no natural water source is present around the apiary – supply it at least during the hot season. A barrel full of water, with some pieces of wood or polystyrene on the liquid surface, is enough (Johansson & Johansson, Citation1978). | ||||
| (4) | In countries with great concern about ants as bee predators, insert each leg of the stand in a cup full of a solution of engine and diesel oil (50:50) to prevent the ants entering the hive It is also possible to fill the cups with water and detergents as detailed by Dainat, Kuhn, Cherix, and Neumann (Citation2011) or grease caps (Seregen, Citation2004). | ||||
| (5) | The site should be isolated from hazards: insecticides, pollution, robbery, vandalism, predators and bush fire, because it may impact the number of foragers in each colony, and consequently the results of the experiments. Distance from such hazards should be determined following the experience of the professional beekeepers in the region and agriculture extension services for informations (Ambrose, Citation1995). | ||||
| (6) | Be aware that you can receive valuable data from a meteorological station near the apiary, or equip the apiary with a meteorological field station. This is important because the activity of the foragers is impacted by weather. | ||||
| (7) | Minimize forager drift among colonies by dispersing the hives in the area without any arrangement, not in line, their entrances open to different directions. Paint varying geometric forms of different colors above the entrance that will help the foragers to orientate to their own colony when coming back (see references in Neumann, Moritz, & Mautz, Citation2000). Drift may impact the results of the experiment because the population of foraging workers may increase in some hives while decreasing in others. | ||||
| (8) | Write directly the code or identity number on both the roofs and on one side of the hives. Use permanent ink. | ||||
Table 1. Types of syrup feeders to be used in feeding experiments for optimal brood production.
2.4. Feeding experiments
Food flow, of both pollen and nectar, has qualitative and quantitative impacts on brood production, mainly via brood food-producing hypo-pharyngeal glands of nurse worker bees (Brodschneider & Crailsheim, Citation2010; Haydak, Citation1970; Standifer, Moeller, Kauffeld, Herbert, & Shimanuki, Citation1977). Supplemental feeding in particular in periods with food shortages can be important for maintaining a higher brood production. Measuring the natural food flow is however important for such studies and methods on various measures e.g., hive weight, food reserves, counting forager workers and pollen traps can be found in the BEEBOOK paper on miscellaneous standard methods for Apis mellifera research (Human et al., Citation2013) and BEEBOOK paper on measuring colony strength parameters (Delaplane et al., Citation2013).
| (1) | For each hive, adopt a particular feeder that can be used uniquely by the foragers of the hive (Table ). | ||||
| (2) | Check impermeability of the feeders before experiment, using tap water. The ones that are permeable should be treated: pour hot liquefied candle’s paraffin or wax on the slots and fissures and repeat impermeability test. | ||||
| (3) | Quantities can be calculated following some criteria: (1) amount of artificial food per adult worker, (2) type of hives and population size in each colony, (3) length of the experiment. | ||||
| (4) | Prepare the food no more than 48 h before feeding the colonies and keep it cold to prevent its deterioration and microbial development. | ||||
| (5) | Artificial feeding should be the last operation of the day in the apiary to avoid robbery. Robbing can be controlled by reducing the entrance of the hive, sealing all cracks or openings, placing straw or grass in front of the entrance. All these actions will help the guarding bees in their mission (Ambrose, Citation1995; Standifer et al., Citation1977). | ||||
3. Production of drone brood
Drone brood production is, like brood in general, dependent on a good pollen supply to meet their protein demand. A drone larva is more costly to produce and maintain than a worker larva and colonies regulate drone production in accordance with the availability of food and season (Hrassnigg & Crailsheim, Citation1998; Seeley, Citation2002; Seeley & Mikheyev, Citation2003). Optimal drone productivity is dependent upon how resources are allocated between the sexes given particular climate, colony status (size and queen ages) and forage availability conditions (Boes, Citation2010). The amount of drone brood present in the colony also affects drone production by a negative feedback process (Free & Williams, Citation1975). Therefore, removal of drones from the colony should upregulate drone production when regularly harvested. In temperate regions of the Northern hemisphere the drone production season occurs from May to August (Boes, Citation2010; Free & Williams, Citation1975).
3.1. Production of drone brood and Varroa sp. trapping
Drone production at any one time is limited by the amount of drone comb cells present in the colony (Boes, Citation2010) particularly in modern beekeeping where frames with imprinted worker cell foundation are used. The tendency for workers to build fresh drone comb when empty frames are placed within the colony during drone production season can be exploited to encourage drone brood production. Current evidence indicates that the practice of drone brood removal is an effective measure of Varroa spp. mite control (Calderone, Citation2005). In Europe, particularly in Nordic countries this technique combined with chemical treatment, is used as part of a Varroa spp. IPM strategy.
Typically, an empty frame allocated for drone production is placed in the hive from which capped brood comb sections are later removed containing pupae and trapped Varroa sp. mites. Frames without wax foundation either as full frames or frames divided into two to three sections can be used.
| (1) | Prepare the experimental colonies according to the guidelines given for worker brood production (Sections 2.1, 2.3 and 2.4).) | ||||
| (2) | Use an empty trap frame, full or divided into two or three sections. Alternatively, a trap frame with imprinted drone brood cells can be used. | ||||
| (3) | Placed the frame next to or in the center of the brood nest at the beginning of drone season-the springtime. | ||||
| (4) | The first drone brood is capped approximately eleven days after its introduction so weekly data collection is recommended. | ||||
| (5) | Record the wanted data e.g., worker brood area (capped and uncapped cells), drone brood area (capped/uncapped cells), colony weight, storages (honey and pollen), Varroa spp. infested cells. See more details in the BEEBOOK chapters: Miscellaneous standard methods for Apis mellifera research (Human et al., Citation2013); Measuring colony strength parameters (Delaplane et al., Citation2013) and Standard methods for Varroa spp. research (Dietemann et al., Citation2013). | ||||
| (6) | Remove capped drone brood weekly for three section frames or at longer intervals for two section frames (10 days) and full frames (20 days). | ||||
Pros and cons:
Three section frames (Figure ) give more uniform brood ages at harvest that could be timed according to the brood ages of interest (Section 4.1), and longer periods for Varroa spp. trapping. However it makes weekly removal of drone brood necessary.
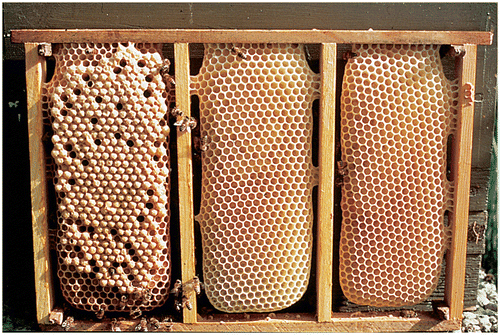
Figure 1. A three section drone brood 12 × 10 frame (306 × 262 cm). The right section is one week, the middle section is two weeks and the left section is three weeks old and ready to be harvested.
3.2. Estimations of drone brood from weight of combs
The weight of the edible part of a brood comb can be estimated by the weight of the brood piece or the number of capped drone cells by use of regression equations. Drone pupae lose weight during the pupation (Duay, Jong, & Engels, Citation2003) thus it is important to make a regression equation based on representative subsamples of the study material.
| (1) | Weigh out the removed comb pieces on a scale. | ||||
| (2) | Count or estimate the number of capped brood cells Delaplane et al. (Citation2013). | ||||
| (3) | Separate drone pupae from the wax and weigh the pupae from each piece. | ||||
| (4) | Plot the comb weight and edible drone pupae weight to generate a regression equation. | ||||
| (5) | Plot the number of capped brood against the edible drone pupae weight to generate a regression equation. | ||||
| (6) | Alternatively, the mean weight of a subsample of individual drone pupae can used together with count of capped drone brood cells. | ||||
4. Brood harvesting
4.1. Time of harvest – age of brood
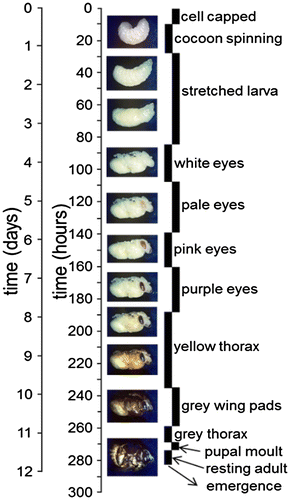
Honey bee brood can be harvested from the colonies at different stages in the development from larvae to adult bee. To maximize biomass of the harvested brood it should not be harvested before the larvae stop feeding, which is at the time of capping. As pupae grow older, there will be an increasing amount of chitin (from the yellow thorax stage in Figure ) making the brood less palatable. Just before emergence the brood resembles adults with considerable amounts of indigestible chitinous cuticle and has an aversive taste (Schmidt & Buchmann, Citation1992). In addition, the pupae will lose weight during the pupation period. Based on these considerations, brood should be harvested before the pupae eyes becomes pink, corresponding to 0–130 h and 0–160 h post-capping for worker and drone brood respectively.
Figure 2. Time and duration of sealed worker brood from capping to emergence including morphological categories.
4.2. Hygienic measures
Insects are rich in nutrients and moisture, providing a favorable environment for microbial survival and growth (Klunder, Wolkers-Rooijackers, Korpela, & Nout, Citation2012). No records of food poisoning from bee brood currently exist. Nevertheless, more research however will be required from a food safety perspective as goes for microbial hazards in brood for human food. In Japan, wasp brood (Vespula spp.) is among the main insect food consumed today and also here no records of food poisoning exists (Payne, Citation2015). The main aspect from a food perspective is not the microflora composition of live animals, but the possibility to safely store and preserve raw material or derived products.
4.2.1. Harvesting in the field and preprocessing storage
| (1) | To avoid contamination of toxic chemicals brood should not be harvested from colonies treated with toxic substances used for protection against pests and parasites. | ||||
| (2) | To reduce the risk of microbiological contamination harvested brood combs should be kept in clean hive boxes or other suitable containers that allows transportation without physical damages to the brood. | ||||
| (3) | Both open and capped brood will stay alive at room temperature for a few hours allowing for transport from apiaries to facilities where the brood can be processed or stored. | ||||
| (4) | If brood frames are cut out from a frame in the apiary additional care should be given due to the risk of nutritious liquid leaking from damaged brood. Therefore each brood piece should be placed in clean plastic bags or containers and kept cold during transportation to facilities where the brood can be processed or stored. | ||||
| (5) | The brood should be frozen as soon as possible after harvest, at −20 °C ideally within 4–6 h after harvest to ensure the freshness of the product. | ||||
| (6) | Add date and apiary/colony id to the stored batch. | ||||
4.3. Separation of the edible brood after freezing
The brood combs consist of brood and bee wax. Bee wax is used as an additive to food, but is not recommended to ingest in large quantities (European Food safety Authority, Citation2007), thus, the brood needs to be separated from the wax. Honey bee larvae, prepupae and pupae are very fragile; therefore special consideration is required if the brood is to remain intact. Obtaining larvae from the combs might be easier prior to capping as larvae can then be removed from combs by a stream of water (Schmidt & Buchmann, Citation1992).
For capped brood combs we recommend freezing the comb down before proceeding with the separation as it preserve the freshness and allows easy breaking up of the comb.
4.3.1. Intact brood separation at −20 °C
| (1) | Work in clean environments with clean hands, gloves and tools according to EU regulations on the hygiene of foodstuffs (European Union, Citation2004b, Regulation (EC) No 852/2004 (e.g., clean tables with water and soap, warm water, 70% ethanol and warm water). Tools have to be washed in a dishwasher min 80 °C. | ||||
| (2) | Place large (~3 l) and small (0.5–1 l) containers made of material intended to come into contact with food (European Union, Citation2004a, Regulation (EC) No 1935/2004) into freezer. | ||||
| (3) | Work only with one comb piece at a time and let the rest be in the freezer. | ||||
| (4) | Break the comb piece into small pieces with hands in the large (~3 l) container. | ||||
| (5) | Remove individual brood from the wax with forceps or tweezers into smaller plastic containers. | ||||
| (6) | Every 5 min, before the frozen brood begins to thaw, place the small container of separated brood back into the freezer and pull another small container from the freezer. | ||||
| (7) | Repeat, processing comb from the freezer one piece at a time. Rear small containers once the separated brood is re-frozen and keep in the freezer before using for new separated brood. | ||||
Pros and cons:
The brood and wax quickly thaw so only small amount of material can be handled at a time, and due to the quick thawing small wax pieces quickly stick to the brood, which still makes it difficult to remove fully. Uncapped brood can be harvested by swing-impact described by Hocking and Matsumura (Citation1960) but will only work if the brood is produced in a stable wood or plastic frame otherwise it the brood comb will break apart due to the swing-impact. If the brood has to be uncapped, the uncapping is difficult without injury of the brood and subsequently the brood will liquefy.
4.3.2. Intact brood separation using liquid nitrogen
| (1) | Work in clean environments with clean hands, gloves and tools (see Section 4.3.1). | ||||
| (2) | Liquid nitrogen should be kept in an appropriate tang (e.g., a Dewar tank) and gloves should be used when handling liquid nitrogen. | ||||
| (3) | Pour liquid nitrogen into an insulated food-grade container. | ||||
| (4) | Drop pieces of brood comb (~100 cm2) into the container. | ||||
| (5) | Let it freeze completely (about 20–30 s). | ||||
| (6) | Use a spoon or a steel strainer to lift the chunk of comb out of the liquid nitrogen and place onto a clean (see Section 4.3.1) plastic tray. | ||||
| (7) | Quickly rub and break up the brood comb using gloved hands to separate all the frozen wax and debris from the brood. | ||||
| (8) | Rub the brood in between a clean (see Section 4.3.1), dry cloth to remove any remaining debris. | ||||
| (9) | Rubbing should be gentle in particular for pupae not to cause breakages between the thorax and abdomen. | ||||
| (10) | Once clean, place the brood in a small container and store in a freezer. | ||||
Pro and cons:
Access to liquid nitrogen is necessary. The advantages of using liquid nitrogen are the lower temperature of the brood and wax which increase the window of handling time before thawing. In addition the wax becomes more brittle and thus easier to break and remove fully.
4.3.3. Brood juice by squeeze-method
| (1) | Work in clean environments with clean hands, gloves and tools (see 4.3.1). | ||||
| (2) | Use unfrozen or thawed brood combs. | ||||
| (3) | Place a stainless steel sieve (∅ = 18 cm) above a plastic container (∅ = 20 cm). | ||||
| (4) | Squeeze comb pieces above the sieve and let the juices pass the sieve. | ||||
| (5) | The juice needs to be frozen or used quickly. | ||||
Pro and cons:
The method is much faster and less labor-intensive, however, it has a lower yield and the liquid oxidizes extremely quickly.
4.4. Storage of brood combs and processed brood
Storage conditions and shelf life information of food products is important (Taoukis & Labuza, Citation1989), however no research has so far been done with honey bee brood. Due to the high fat content of the larvae and pupae, rancidification, if not properly removed from contact with oxygen, causing a rank, unpleasant smell or taste might be expected to occur. However, brood in the combs has been stored at −20 °C without severe loss or change of taste for up to 6 months and cleaned intact brood in vacuum-sealed bags for up to 10 months (Pers com, Josh Evans).
| (1) | Place frozen and separated brood in vacuum bags, not too full so they can be sealed properly with space to move. | ||||
| (2) | Seal the brood in vacuum bags, so they are sealed from oxygenated air. | ||||
| (3) | Do not pack brood tightly in the bag but rather with space enough left for them to stay loose from each other. | ||||
| (4) | Keep the sealed bag frozen at −20 °C until required for use. | ||||
| (5) | Once taken from the freezer they are best used immediately. | ||||
| (6) | If only a part of a bag is used, reseal to preserve storability. | ||||
5. Nutritional value of edible honey bee brood
The high nutritional value of honey bee larvae and pupae that can be compared to beef by its protein quality and quantity (van Huis et al., Citation2013) is among the main reasons for using it as an alternative food source. The determination of the nutrients is based on standard analytical methods, used for meat in the food science industry and in research (Association of Officiating Analytical Chemists, Citation1996). Attention is given in this chapter to the unique nutritional ingredients found in insects, particularly honey bees.
5.1. Protein analyses
Proteins can be considered as the most valuable food ingredient, as they serve as building blocks of life. We need to obtain the essential amino acids from food, because they cannot be metabolized by ourselves. The amino acids are important for growth, development, and for the proper functioning of organs and systems, such as brain, immune, and endocrine systems, etc., from the cell level to the entire body. Accurate analyses of total proteins and amino acids composition is important when considering bee brood as a nourishing, alternative foodstuff.
5.1.1. Total protein (Kjeldahl method)
Protein quantity can be analyzed by a few standard techniques, most dependent on the amino acid content or covalently bound material. Honey bee brood proteins can be roughly separated into three groups: hemolymph, muscle, cuticular proteins. These groups differ in composition and structure, and the quantitative ratio among them varies according to body part, age, and external factors. The haemolymph proteins are water soluble and can easily be quantified by Bradford assay or bicinchoninic acid assay as described earlier (Hartfelder et al., Citation2013). The muscle and cuticular proteins are fibrous. They are connected to the insect’s exoskeleton. As in other meat and fish food products, Kjeldahl is the preferred method for determining total protein in honey bee brood, as it accurately measures nitrogen content. Nitrogen amount can easily be converted into the amount of protein, after subtracting the nitrogen derived from chitin and divided by the conversion ratio between nitrogen and protein. This method is based on the standard procedures of the Association of Analytical Chemists (Association of Officiating Analytical Chemists, Citation1996) with minor modification (Jonas-Levi, Benjamin, & Martinez, Citation2015).
5.1.1.1. Total nitrogen
Sample preparation:
Samples can be used either without preparation or after drying (60 °C or freeze-drying until constant weight). While analyzing small samples (<10 g), it is recommended to use intact items in order to prevent testing a nonhomogeneous sample. For analyzing larger samples (>10 g), it is recommended either to homogenize a fresh sample or powder a dry sample before analysis.
Procedure:
| (1) | Weigh approximately 1.0 g (dry weight or equivalent fresh weight) sample and transfer to a Kjeldahl digestion flask without staining the flask`s wall. | ||||
| (2) | Add 0.15 g Kjeldahl catalyst, 10 ml concentrated sulfuric acid, and 10 ml 35% hydrogen peroxide. | ||||
| (3) | Boil in a Kjeldahl apparatus at 400 °C for two hours and cool. Add 50 ml distilled water. | ||||
| (4) | Prepare the distillation apparatus: place a 250 ml titration flask containing trapping solution-65 ml boric acid and five drops indicator. Verify that the delivery tube dips into the trapping solution. | ||||
| (5) | Carefully pour down the side of the digestion flask, 60 ml 50% NaOH and connect to the distillation apparatus. | ||||
| (6) | Mix and boil until about 150 ml distillate has been collected. | ||||
| (7) | Titrate with 0.1 N HCl until green color changes to gray and purple. | ||||
Calculation:
Total nitrogen:
where Ns is the Total nitrogen in sample (%) of dry bee weight; Vs is the Titration volume for sample (ml); Vb is the Titration volume for blank (ml); Ws is the Sample weight (g).
Total protein is calculated by multiplying the Nitrogen content from the proteins by the conversion factor 6.25 (0.16 g nitrogen per gram of protein). This is very close to reality, especially in young larvae, where the cuticle weight is negligible.
When the precise amount of protein is required, chitin nitrogen should be measured, as described below.
where Ns is the is the Total nitrogen in sample (%) of dry bee weight.
5.1.1.2. Total protein after diminution of chitins nitrogen
Extraction of the chitin should be done as described in Section 4.3.3, following nitrogen quantification of the fibrous material by Kjeldahl, as described above (Section 4.1.1). To determine total nitrogen in chitin use the following equation:
where Nc is the Total nitrogen in chitin (%) of dry bee weight; Vc is the Titration volume for sample (ml); Vb is the Titration volume for blank (ml); Ws is the Sample dry weight (g) (dry bee weight before chitin extraction).
where Ns is the Total nitrogen in sample (%) of dry bee weight; Nc is the Total nitrogen in chitin (% )of dry bee weight (be aware to calculate Nc as percentage of dry bee weight and not of cuticle weight).
5.1.2. Amino acid composition
Amino acids can be analyzed by various methods, such as GC-MS, HPLC with UV and fluorescence detection, NIR spectroscopy, or amino acid analyzer. Sample preparation principles are identical nonetheless and are based on hydrolysis of the proteins to amino acids. Acid hydrolysis is the most common method, but unfortunately affects several amino acids: Tryptophan is destroyed and asparagine and glutamine are deaminated, resulting in aspartic acid and glutamic acid, respectively. Serine, threonin, methionine and cysteine are partly oxidized and use of vacuum or an inert gas in the headspace of the reaction vessel can reduce the level of their oxidative destruction. The peptide bonds between isoleucine and valine and between themselves are not easily or totally cleaved. When HPLC analyses are used, common artificial results can occur due to contamination. For this analysis, therefore, high purity reagents are used and solvents, especially buffers, must be fresh in order to avoid microorganism contamination, which are rich in amino acids. In any case, using an internal standard to monitor losses and variations during amino acid analysis is recommended.
Sample preparation:
Use freeze dried and fat free samples.
5.1.2.1. For most amino acids
| (1) | Weigh 0.2 g into a 15 ml flask, add 8 ml 6.0 N HCl, seal well, and hydrolyze at 110 °C for 24 h. | ||||
| (2) | Withdraw 1 ml and evaporate under vacuum at 45 °C until dry. | ||||
| (3) | Re-dissolve the sample by mixing in 5 ml 0.02 N HCl and centrifuge at 5,000 rpm. | ||||
5.1.2.2. For tryptophan
| (1) | Weigh 0.20 g into a 15 ml flask, add 8 ml 5 N NaOH containing 5% SnCl2 (w/v) for 20 h at 110 °C. | ||||
| (2) | After hydrolysis, neutralize with 6 N HCl and centrifuge at 5,000 rpm. | ||||
These samples are ready to use in an amino acid analyzer, in GC-MS, NMR and NIR spectroscopy. For HPLC analysis further derivatization is needed.
5.1.2.3. Derivatization for analysis by HPLC
Ion-exchange chromatography followed by postcolumn derivatization with ninhydrin:
Postcolumn derivatization techniques can be used with samples that contain small amounts of buffer components, such as salts and urea, and generally require between 5 and 10 μg of protein sample per analysis. A Na-based cation-exchange system can also be used.
Precolumn derivatization with Phenylisothiocyanate (PITC): Precolumn derivatization techniques are very sensitive and usually require between 0.5 and 1.0 μg of a protein sample per analysis, although may be influenced by buffer salts in the samples. These techniques are typically followed by a reversed-phase HPLC.
Procedure:
| (1) | Place 20 μl amino acid standard solution or hydrolyzed samples in a vial and dry in a vacuum oven at 65 °C for 2 h. | ||||
| (2) | Add 30 μl of methanol–water–TEA (2:2:1), dissolve and vacuum-dry at 65 °C for 10 min. | ||||
| (3) | Add 30 μl of the derivatizing reagent methanol–water–TEA-PITC (7:1:1:1 [v/v]), vortex for 30 s and leave to stand at room temperature for 20 min. | ||||
| (4) | Vacuum-dry the resulting solution at 65 °C for 15 min. | ||||
| (5) | Prior to injection, add 150 μl of diluents, consisting of 5 mM sodium phosphate with | ||||
| (6) | 5% acetonitrile, pH 7.4 and vortex for 15 s. | ||||
Chromatography condition:
There is a wide variety in chromatography conditions, which can be chosen for amino acid separation, depending on the apparatus, column, and goals.
Amino acid concentration:
Identified amino acid concentration is determined according to their peaks area in relation to its specific standard. Protein quality needs to take the amino acid compostion as well as the digestibility of the protein into account to evaluate the nutritional value to humans (FAO, Citation2013). FAO has recommended replacing the protein digestibility-corrected amino acid score with the digestible indispensable amino acid score.
5.2. Lipid analyses
Lipids are a diverse group of compounds consisting of tri-, di- and monoacylglycerols, free fatty acids, phospholipids, sterols, and vitamins. From a nutritional standpoint, total lipid analyzes are mostly important because they serve as a major source of fuel energy for the body. Moreover, it is important to specify the concentration of the different types of lipids present in foods due to their effect on several aspects: health, physical and sensory properties, and, also, shelf life stability. In general, all lipid analyses start with lipid extraction following specific analyses. Unsaturated lipids tend to oxidize very quickly. When tests that follow total lipids extraction are requested, it is recommended to grind samples at low temperature, and add an antioxidant (20–50 ppm BHT) to the extracted lipids, to flush containers with nitrogen gas and to avoid dried sample storage or exposure to heat or light.
5.2.1. Total lipophilic compounds
Total lipid analyzes are based on separation of the lipophilic compounds from the water soluble compounds in a sample by organic solvent extraction. Extraction efficiency depends on the similarity in the polarity between the lipids and the solvent. Because different lipids have different polarities, it is impossible to find an ideal solvent to extract all the lipid components without affecting all the other components in the sample. It is recommended to use a non-polar solvent with a low boiling point. Acetone, with 0.355 relative polarity and boiling point of 56.2 °C, can be chosen. Hydrophilic compounds, such as glycolipids and lipoproteins, will not be well extracted in the hydrophobic solvent. To overcome this problem, acid hydrolysis is required in order to disconnect the complexes of lipids from proteins and carbohydrates. Moreover, a semi-continuous solvent extract can be used, which increases the extraction efficacy to nearly 100%. The recommended procedure is gravimetric (Association of Officiating Analytical Chemists, Citation1996).
Sample preparation:
The sample should be dried (60 °C or freeze-dried) and grounded (at low temperature). For hydrolysis of lipoproteins, glycolipids and phospholipids, the sample should be heated at a minimum volume of 3 N HCl for 1 h and dried once more.
Procedure:
| (1) | Put 5.0 g dried grounded sample into a cellulose thimble and placed in the extraction chamber of the Soxhlet apparatus. | ||||
| (2) | Add acetone into a flask, weighed in advance, connect it to the lower part of the Soxhlet apparatus, and connect a condenser above it. | ||||
| (3) | Heat the flask for 12 extraction cycles. | ||||
| (4) | Cool the system, and evaporate organic solvent. | ||||
| (5) | Dry the flask and the thimble and weigh them. | ||||
Calculation:
Calculate the total lipids as percentage of dry sample weight.
5.2.2. Fatty acids composition and content
Fatty acids composition and content has a large impact on the nutritional value and the functional properties of foods. Alpha-linolenic acid (omega-3) and linoleic acid (omega-6) are known as essential fatty acids. Along with most of the polyunsaturated fatty acids, these acids are beneficial to the body, as they are required for building healthy cell membranes, assisting in development and function of the central and peripheral nervous system, and protecting against cardiovascular diseases. In addition, their composition influences food taste, odor and texture.
Fatty acids analyses consist of three phases: (1) lipid extraction, (2) volatilization of the fatty acids to fatty acid methyl esters (FAME), and (3) separation, identification, and quantification of the FAME by chromatography.
Sample preparation:
Lipid extraction: Use the method as described above (Section 4.2.1), for preventing oxidation of the unsaturated fatty acids add 20–50 ppm BHT to the extract. Volatilization of the fatty acids to fatty acid methyl esters (FAME), according to Jonas-Levi et al. (Citation2015).
| (1) | Put 150 μl lipid extract into an evaporation bulb, add 20 ml methanol 3% H2SO4, and boil for 1 h. | ||||
| (2) | After cooling, transfer all liquids to a 50 ml volumetric flask, wash the bulb with 3 ml petroleum ether, and add it to the volumetric flask. | ||||
| (3) | Add 10 ml distilled water, mix, and add another10 ml distilled water, and wait until phases separate. | ||||
| (4) | Collect upper phase, which contains the FAME, to a new flask. | ||||
| (5) | Add some sodium sulfate for water residues absorption. | ||||
| (6) | If necessary, store in a sealed glass bottle at −20 °C. | ||||
Separation, identification and quantification:
For reliable identification and quantification, use first a FAME standard for analysis in GC-MS or GC-FID chromatography.
Procedure:
Inject 1 μl of fatty acid methyl esters standard and 1–2 μl sample to a gas chromatograph with flame ionization detector with a Supleco 2560 100 m × 0.25 mm × 0.2 μm column (Sigma-Aldrich, St Louis, USA). The oven temperature program should be set to 5 min at 140 °C, heating to 240 °C at a rate of 4 °C per min, followed by 20 min constant temperature at 240 °C. Set the detector temperature at 260 °C, H2 40 ml/min splitless. Use nitrogen as the carrier gas (400 ml/min). Use an external mixed standard of C4-C24 fatty methyl acids to identify the fatty acid peaks and retention times.
Calculation:
The identification of a FAME is done according to the retention time of a standard, while the quantification is in relation to the picks area. There are two possibilities for fatty acids amount calculation:
Relative amount of a fatty acid () is calculated as the area of the specific fatty acid (
) divided to the total area of all the fatty acids (
) in the chromatogram multiplied by 100.
Fatty acid concentration is calculated as the area of the fatty acid () multiplied by the concentration of a specific standard (
) divided by the area of the standard fatty acid (
).
5.3. Carbohydrate analyses
Carbohydrates are divided into two main groups, carbohydrates for energy supply and structural polysaccharide – chitin. The energy storing carbohydrates are composed of the immediate metabolic available sugars, glucose and trealose, which are located mainly in the hemolymph, their analysis was described before (Hartfelder et al., Citation2013) along with the energy storage carbohydrate – glycogen. The simple sugars are responsible for the sweetish taste of honey bee brood.
5.3.1. Total carbohydrates
Total carbohydrates include digestible and indigestible sugars. The procedure is based on full hydrolysis of the carbohydrates, turning them into monosaccharides, following Sumner’s test for reducing sugars.
Sample preparation – hydrolysis:
| (1) | Weigh 1.000 g sample, add 80 ml 1 N HCl. | ||||
| (2) | Boil for 2 h under reflux, and cool to room temp. | ||||
| (3) | Transfer sample to a 100 ml volumetric flask, adjust pH to 7.5 with NaOH, add distilled water to 100 ml, and mix. | ||||
Glucose standard curve:
Dilute the glucose to at least six different concentrations from blank up to 0.0125%.
Procedure:
| (1) | Add 2 ml of the tested compounds (glucose, sample and blank) into a glass test tube (≥5 ml, suitable for spectrophotometer). | ||||
| (2) | Add 2 ml Sumner’s reagent and mix. | ||||
| (3) | Boil 5 min at 100 °C, and cool on ice. | ||||
| (4) | Evaluate the absorbance at 550 nm after resetting the spectrophotometer on “zero sugar” concentration. | ||||
Calculation:
| (1) | Build a standard curve graph – optic absorbance at 550 nm to glucose concentration. | ||||
| (2) | Add a linear trendline with its equation and a R2 value to the graph. | ||||
| (3) | Calculate the sugar concentration (equivalent to glucose) in the samples, according to their optical density and the trendline. | ||||
5.3.2. Fibrous material
The fibrous material in honey bee brood comes from Chitin, a nondigestible carbohydrate from the insect exoskeleton. It is a long polymer of acetylated glucosamine units linked by beta-1,4 glycosidic bonds. The determination of total fiber is determined by an enzymatic gravimetric procedure, based on the AOAC method (Prosky, Asp, Schweizer, Devries, & Furda, Citation1988).
Sample preparation:
For the procedure use dry fat-free samples as described above (Section 6.2.1).
Gooch crucible preparation:
| (1) | Add 0.5 g Celite filter aid to every gooch, the Celite should cover the entire filter surface. | ||||
| (2) | Dry at 130 °C for 1 h. | ||||
| (3) | Allow cooling in a desiccator and weigh. | ||||
Procedure:
Enzymatic hydrolysis:
| (1) | Weigh 1.0 g into a 250 ml beaker and add 50 ml 20 mM phosphate buffer pH-6. | ||||
| (2) | Add 100 μl heat stable alpha-amylase and boil for 15 min. Gently stir once every 5 min. | ||||
| (3) | Cool to 60 °C, adjust the pH to 7.5 by adding 0.5 M NaOH and add 50 μl protease. Cover the beaker and incubate 30 min at 60 °C, stir gently every 5 min. | ||||
| (4) | Adjust pH to 4.5 by 0.5 M HCl and add 100 μl amyloglucosidase. Cover the beaker, incubate 30 min at 60 °C, stir gently every 5 min and cool to RT. | ||||
Fiber precipitation and filtration:
| (5) | Measure the solution volume and add 4 volumes of 95% EtOH. Allow it to precipitate over night at RT. | ||||
| (6) | Stir the solution gently and filter it through the gooch in a vacuum system. | ||||
| (7) | Wash all residues from the beaker through the gooch with 78% EtOH. | ||||
| (8) | Wash with 15 ml 95% EtOH. | ||||
| (9) | Wash with 15 ml acetone. | ||||
| (10) | Dry the gooches at 130 °C for 2 h, cool in a desiccator and weight. | ||||
Calculation:
Be aware that the sample you used for fiber analysis is lipid free and dry. To calculate the fiber percentage from the dry sample (with the lipids), the complete sample weight before lipid extraction needs to be calculated.
where WS is the Sample weight (g) (complete sample weight before lipids extraction); WLfS is the Lipid free sample weight (g) (sample weight after lipids extraction); CL is the Lipids concentration (%); CF is the Fibers concentration in a dry fat free sample (%); WF is the Fibers weight (g); CM is the Mineral concentration (%).
5.4. Calories
A calorie (Cal) is the amount of energy needed to raise the temperature of one gram of water by one degree (Celsius or Kelvin) in one atmosphere of pressure. When referring to food and nutrition, it is common to use the value, kcal. Two types of measurements are used in determining food energy: (1) measurement of total energy stored in the chemical bounds of a material, by a bomb calorimeter, and (2) estimation of energy available from digestion of food.
5.4.1. Bomb calorimeter
A bomb calorimeter is used to determine the enthalpy of combustion for organic compounds. It is used to measure the heat created by a sample burned under an oxygen atmosphere in a closed vessel, which is surrounded by water, under controlled conditions. There are different bomb calorimeter versions and sizes, but the principle is the same for all.
Sample preparation:
Samples must be dried in advance. It is recommended to compress the sample into a bloc.
Procedure:
| (1) | Weigh ~1.0 g of sample or standard (benzoic acid) into a crucible, and place it inside a stainless steel container. | ||||
| (2) | Attach a nickel or iron fuse from the sample to the ignition wire and seal the container. | ||||
| (3) | Fill it with 30 bar of oxygen and then put the container into a Dewar. | ||||
| (4) | Add a known weight of water (W) and close the calorimeter. | ||||
| (5) | Let the temperature stabilize (T1). | ||||
| (6) | Press the ignition unit to generate combustion. | ||||
| (7) | Let the temperature stabilize (T2). | ||||
Calculation:
Correction factor
where CF is the Correction factor; T2 is the Temperature after combustion (C); T1 is the Temperature before combustion (C); W is the Water weight (g); 6318 is the Calories in standard, cal/1 g benzoic acid.
Sample calories
where Scal is the Calories in sample (cal/g); T2 is the Temperature after combustion (C); T1 is the Temperature before combustion (C); W is the Water weight (g); CF is the Correction factor; Sw is the Sample weight (g); SJ is the Joules in sample (j/g = Scal × 4.184).
5.4.2. Estimation of energy available to be digested in food
For estimating the energy available to be digested in food, the information about total proteins, total digestible carbohydrates and total lipids is needed.
where Cald is the Calories available to be digested in the portion (cal); L is the Lipids amount in the sample (g); P is the Protein amount in the sample (g); L is the Carbohydrate amount in the sample (g).
5.5. Vitamins
Vitamins are needed for the normal and healthy metabolism of the body. Lack of vitamins can lead to serious diseases and death. Vitamins are divided into two groups according to their chemical characteristic, the fat soluble vitamins (A, D, E, K) and the water soluble (C, B family and some miscellaneous compounds). This separation into groups is important for sample preparations. Many articles and books are written about analytical determination of vitamins, Blake (Citation2007) has reviewed the subject, while Collin and Blum (Citation2005) give specific analytical methods for all vitamins and provitamins.
5.5.1. Fat soluble vitamins
Fat soluble vitamins are very easily oxidized and changed, therefore it is necessary to avoid expose to light and heat, and the analysis must be immediately after separation. Internal standard is required in vitamin analyses due to their sensitivity. Sample preparation includes saponification and solvent extraction. The use of HPLC grade solvents is recommended.
Sample preparation:
This procedure is according to Salo-Väänänen et al. (Citation2000).
Saponification:
| (1) | Put 1 g of homogenized sample into a Pyrex tube. | ||||
| (2) | Add 5 ml of 2% ascorbic acid, 10 ml of ethanol and 1 ml of internal standard (0.2 mg of vitamin). | ||||
| (3) | Flush with nitrogen and vortex. | ||||
| (4) | Add 4 ml of KOH. | ||||
| (5) | Flush with nitrogen and seal the tube. | ||||
| (6) | Boil for 20 min. Mix every few min. | ||||
| (7) | Cool the sample on ice for 10 min. | ||||
| (8) | Add 10 ml 10% NaCl. | ||||
Extraction:
| (9) | Add 20 ml extraction solvent, n-hexane – ethyl acetate (8:2) mix for 2 min. | ||||
| (10) | Allow the phases to separate. | ||||
| (11) | Transfer the organic phase to a 100 ml tube. | ||||
| (12) | Repeat this extraction procedure (section 15–17) three times, combine the organic phase. | ||||
Washing:
| (13) | Wash the extract with 20 ml of 5% NaCl, | ||||
| (14) | Transfer the organic phase to a 100 ml bottle, | ||||
| (15) | Add 5 ml ethanol and 5 ml n-hexane, mix and evaporate. | ||||
| (16) | Dissolve sample in n-hexane and transfer to HPLC analysis tube, | ||||
| (17) | Evaporate and dissolve again in 1 ml n-hexane prior to analysis. | ||||
5.5.1.1. Tocopherols, b-carotene, and all-trans-retinol analysis
HPLC method for the determination of tocopherols, b-carotene, and all-trans-retinol is summarized in Table . Condition as according to Salo-Väänänen et al. (Citation2000): step gradient using an mPorasil column (10 μm, 30 cm × 3.9 mm, Waters) with a silica guard column (GuardPak Silica, Waters), adjust temperature of the column oven to 30 °C, injection volume 75 μl.
Table 2. HPLC method for determination of tocopherols, b-carotene, and all-trans-retinol: step gradient and detector program (Salo-Väänänen et al., Citation2000).
5.5.1.2. Vitamin D3 analysis
Use a HPLC system with a UV detector set at 265 nm, and a Vydac TP 54 column (5 mm, 25 cm, 4.6 mm, The Separations group) with an ODS quard column (Nova-Pak C18, Waters). The temperature of the column oven should be set to 25 °C. The mobile phase: 93% methanol and 7% water. The flow rate of the mobile phase: 1 ml/min, and the injection volume 75 ml. (Salo-Väänänen et al., Citation2000).
5.5.2. Water soluble vitamins
Sample preparation:
A suitable sample preparation may be the most important factor for accurate results. The water soluble vitamins are separated into groups for sample preparation according to Leporati et al. (Citation2005).
5.5.2.1. Vitamins B1, B2, B6, and Niacin (Vitamin B3)
| (1) | Grind and homogenate samples. | ||||
| (2) | Transfer 1.0 g of sample into a 50 ml brown glass flask. | ||||
| (3) | Add 25 ml of 0.1 M HCl (for hydrolysis). | ||||
| (4) | Boil in water bath for 30 min (with frequent mixing). | ||||
| (5) | Allow sample to cool, and adjust to 50 ml with 2 M ammonium acetate. | ||||
| (6) | Shake and centrifuge at 12,000 ×g for 10 min. | ||||
| (7) | Filter 1 ml of sample on 0.45 micrometer filter. | ||||
5.5.2.2. Pantothenic acid (Vitamin B5)
| (1) | Grind and homogenate 4.0 g of sample and transfer into a 100 ml brown flask. | ||||
| (2) | Add 50 ml of acetate buffer (pH 5.6) and autoclave at 121 °C for 15 min. | ||||
| (3) | Allow cooling. | ||||
| (4) | Adjust to 100 ml with 0.3 M ammonium formate, then mix on a Vortex. | ||||
| (5) | Centrifuge at 12,000 × g for 10 min. | ||||
| (6) | Filter through a 0.45 micrometer membrane. | ||||
| (7) | Perform sample clean-up by solid-phase extraction (Section 5.5.2.4). | ||||
5.5.2.3. Folic acid (Vitamin B9)
| (1) | Grind and homogenize 2.5 g of sample and transfer into a 50 ml brown flask. | ||||
| (2) | Add 10 ml of water and 25 ml of 0.05 M sodium phosphate–sodium citrate/ascorbate buffer, pH 8.0 to the sample. | ||||
| (3) | Hydrolyze in a boiling bath for 10 min. | ||||
| (4) | Allow cooling and add 0.2 g of papain and 0.1 g of di-alpha-amylase and incubate at 40 °C for 2 h. | ||||
| (5) | Allow cooling and adjust to 50 ml with 0.3 M ammonium formate. | ||||
| (6) | Mix on a Vortex | ||||
| (7) | Centrifuge at 12,000 × g for 10 min. | ||||
| (8) | Filter through a 0.45 micrometer membrane. | ||||
| (9) | Perform sample clean-up by solid-phase extraction (Section 5.5.2.4). | ||||
5.5.2.4. Sample clean-up by solid-phase extraction (SPE)
3 ml Supelco LC–SAX cartridge:
| (1) | Condition with 2 ml of conditioning solution (sodium acetate (20 mM) and sodium sulfate (20 mM), adjusted to pH 5.3 with acetic acid). | ||||
| (2) | Load 1 ml of sample solution. | ||||
| (3) | Wash twice with 1 ml of the first washing solution (sodium sulfate (0.1 M) and sodium chloride (0.5 M), adjusted to pH 5.3 with acetic acid). | ||||
| (4) | Wash with 1 ml of the second washing solution (sodium sulfate (0.5 M) and sodium chloride (1 M), adjusted to pH 5.3 with acetic acid). | ||||
| (5) | Elute with 1 ml of elution solution (sodium sulfate (0.5 M) and sodium chloride (1 M), adjusted to pH 2.5 with trifluoroacetic acid). | ||||
5.5.2.5. Vitamin C
Vitamin C extraction is according to Behrens and Madère (Citation1987) and Chebrolu, Jayaprakasha, Yoo, Jifon, and Patil (Citation2012).
| (1) | Homogenize 3.0 g sample in a motor-driven glass homogenizer in 15 ml cold 17% metaphosphoric acid. | ||||
| (2) | Centrifuge at 20,000 g for 10 min. | ||||
| (3) | Transfer clear supernatant and use for analysis. | ||||
Determination of ascorbic acids can be carried out according to Scherer, Rybka, Ballus, Meinhart, and Godoy (Citation2012). Use a HP liquid chromatography equipped with degasser, quaternary pump, autosampler adjusted to 20 μl volume injection, RP-C18 column (3 µm particle size, 150 × 4.6 mm I.D., kept at 25 °C) and a UV–visible diode array detector. The mobile phase should consist of 0.01 mol/l KH2 PO4 buffer solution (pH 2.60 adjusted with o-phosphoric acid), using an isocratic elution procedure with a flow rate of 0.5 ml/min. Detect at 250 nm.
5.5.2.6. All soluble vitamins (except vitamin C)
All soluble vitamins (except vitamin C) can be analyzed by a HPLC system (Moreno & Salvadó, Citation2000) using reversed-phase Nova-Pack C18 (150 × 3.9 mm, 4 μm) column. The mobile phase of the HPLC system should consist of a 0.05 M ammonium acetate (solvent A) – methanol (solvent B) gradient as follows: in the range 0–1.5 min, 92.5:7.5; at 1.6 min, 84:16; at 15 min, 70:30. The mobile phase flow-rate should be adjusted to 1 ml/min. Inject 40 μl sample. Monitor column effluents at 270 nm.
5.6. Minerals
Minerals are needed for the health and function of the body. They comprise macrominerals (Na, Cl, K, Ca, P, Mg, S) and others, including trace minerals, which are needed in much smaller amounts. Ash content or ash analysis refers to the total inorganic materials in a sample, whereas mineral content or analysis refers to the amount of a specific mineral in a sample.
5.6.1. Ash analyses
Ash analysis provides information of the total mineral content in a sample; it may also be used as the first step in preparing samples for analysis of specific minerals. Two main analytical procedures are used to determine ash content of foods: dry ashing and wet ashing.
5.6.1.1. Dry ashing
This procedure is carried out in a crucible. Various types of crucibles are available for ashing food samples, including quartz, Pyrex, porcelain, steel and platinum. The most widely used are those made from porcelain; they are relatively inexpensive, can be used up at high temperatures (<1,200 °C), are easy to clean, and are resistant to acids, although not to alkaline. Be cautious, porcelain cracks easily under rapid temperature change.
Sample preparation:
The sample should be dried at 105 °C for 1.5 h or at 60 °C overnight or it can be freeze-dried before being grounded. It is generally recommended to extract the fat before dry ashing, but according to previous experience it is not needed for bee brood ash analysis.
Procedure:
Put 5.0–10.0 g dried samples into a crucible and ash it in a furnace at 550 °C for 12 h (AOAC, 1990). Take care to dry, burn, and weigh the crucible before weighing the sample in it.
Calculation:
where WAsh is the Ash weight (g); WDry is the Samples dry weight (g).
5.6.1.2. Wet ashing
Wet ashing is primarily used in the preparation of samples for subsequent analysis. It completely oxidizes the organic matrix to CO2 and water and leaves the mineral in a clear acidic solution. Wet ashing occurs in strong acids as oxidizing agents and heated about 350 °C. Special care must be taken when working with strong acids. Work with acids needs to be done in a chemical hood, gloves replaced and contact lenses avoided. The acid used for wet ashing depends on the subsequent analysis performed; therefore a specific procedure of sample preparation is described for any analysis.
5.6.2. Mineral analyses
There are several options for mineral analysis: (1) ion selective electrodes (ISE), an appealing method due to its simplicity, speed, and ease of use; (2) atomic absorption spectrometry (AAS), the accepted method in food analysis; and (3) the accepted method for phosphorus determination.
All methods for mineral analyses are quite sensitive, thus care must be taken by using pure deionised water, and particularly clean tools, soaked overnight in a 10% nitric acid solution and then rinsed three times with deionised water. Moreover, it is recommended to identify the minerals in a blank sample, which had been exposed to the same treatments and solvents for the other samples, although without the tested compounds.
5.6.2.1. Ion-selective electrodes
The principle of the ion-selective electrodes (ISE) method is as pH meters, but with special electrodes to determine the concentration of specific ions. The most common commercial electrodes are: ammonium, barium, calcium, cadmium, copper, lead, mercury, potassium, sodium, silver, bromide, chloride, cyanide, fluoride, iodide, nitrate, nitrite, perchlorate, sulfide and thiocyanate. The explanation of how to perform this method can be summarized easily: two electrodes, a reference electrode and ion selective electrode are inserted into an aqueous extract of the sample. The concentration of a specific mineral is determined from a calibration curve of voltage vs. the logarithm of concentration. There are two possible confounding factors using the ISE method: (1) interference from other types of ions. This problem can be reduced by adjusting pH, complexing or precipitating the interfering ions; and (2) presence of non free-ions, for example when the ions are in complexes with chelating agents or polymers. In most cases this can be prevented by ashing the sample, as described above (Section 5.6.1).
5.6.2.2. Atomic absorption spectrometry
Atomic absorption spectrometry (AAS) is one of the most effective ways of determining specific minerals; it can be used to quantify the entire range of minerals in foods in ppm concentrations (Association of Officiating Analytical Chemists, Citation1996).
Sample preparation:
Acidic digestion:
| (1) | Take 5–10 g of sample, digest with a mixture of concentrated nitric acid, sulphuric acid, and perchloric acid (10:0.5:2, v/v), in a 250 ml Kjeldahl flask. | ||||
| (2) | Dilute the digest to 100 ml and analyze. | ||||
| (3) | Analyze samples directly. | ||||
| (4) | Make sure standards have the same acid concentration as samples. | ||||
If calcium is being determined, add 0.5% lanthanum to samples and standards.
Ashing:
| (1) | Ash 5–10 g of sample as described above (Section 5.6.1). | ||||
| (2) | Dilute the ash to a known volume and analyze. | ||||
| (3) | Ashed samples can be kept in a desiccator until use. | ||||
5.6.2.3. Phosphorus analysis by a spectrophotometric method
P (phosphorus) is generally measured by a spectrophotometric method after its formation to a phosphomolybdate complex at 650 nm (Association of Officiating Analytical Chemists, Citation1996).
ANSA reagent solution:
| (1) | In a 100-ml volumetric flask dissolve 2.0 g sodium sulfite (Na2SO3) in approximately 80 ml of reagent water. | ||||
| (2) | Add 0.25 g of 1-amino-2-napthol-4-sulfonic acid. | ||||
| (3) | Dissolve and dilute to the mark. | ||||
| (4) | Prepare a second solution by dissolving 15 g sodium bisulfite (NaHSO3) in 300 ml of reagent water. | ||||
| (5) | Mix the two solutions in a dark plastic container. | ||||
| (6) | Degas with helium. Store refrigerated and discard when color changes and it becomes darker. | ||||
Sample preparation:
| (1) | Mineralize 5.0 g sample in 7.0 ml of HNO3 (65%) for 24 h in a Kjeldahl flask. | ||||
| (2) | Add 2.0 ml of H2O2 (30%). | ||||
| (3) | Heat at 100 °C for 60 min. | ||||
| (4) | Continue heating at 200 °C for 120 min. | ||||
| (5) | If necessary cool, mix and continue heating at 200 °C until the solution is clear. | ||||
| (6) | Cool and dilute to 50.0 ml with water in a 50 ml volumetric flask. | ||||
Procedure:
| (1) | Mix 1 ml of sample with 0.6 ml molybdate reagent. | ||||
| (2) | Add 0.2 ml ANSA solution. | ||||
| (3) | Mix and incubate at RT for 10 min. | ||||
| (4) | Measure absorbance at 650 nm. | ||||
5.7. Antioxidant activity
Antioxidants are molecules that inhibit the oxidation of other molecules. They play a significant role in our health, as they decrease oxidative damage in our food as well as in our body. One of the main mechanisms of antioxidants is to be oxidized by themselves, producing a chemically stable oxidized molecule. By way of this mechanism the antioxidants act as a reducing agent, which can be quantified by the Ferric-reducing antioxidant power (FRAP) assay.
5.7.1. Antioxidant power by Ferric-Reducing Antioxidant Power (FRAP) assay
Anti-oxidant reducing power can be estimated as described earlier (Jonas-Levi et al., Citation2015).
| (1) | Add 10 μl samples, standards or blank to a 96 well plate. | ||||
| (2) | Add 200 μl reaction mixture (300 mM acetate buffer pH-3.6, 10 mM 6-tripyridyl-s-triazine and 20 mM FeCl3). | ||||
| (3) | Mix and immediately measure the optical density at 595 nm. | ||||
| (4) | Repeat measurement every 5 min during 1 h. | ||||
5.7.2. Antioxidant enzymes
Antioxidant enzymes are an important part of the natural body defense against reactive oxygen species, in this way they can act in the digestive system before degradation. Enzymes are sensitive macro-molecules that can easily lose their activity. A few simple rules can assure enzyme activity: enzymes should not be heated, they have to be kept on ice until reaction begins, mixing should not be done vigorously, which could produce unnecessary sheer stress; and enzymes should not be exposed to strong acid bases or organic solvents. For comparison between enzyme activities in various samples, it is common to divide the enzyme activity by protein concentration, receiving specific enzyme activity. Protein concentration can be determined by Bradford assay as described by Hartfelder et al. (Citation2013). For reliable results blanks are required. Few different blanks should be done for every test: without enzyme, without substrate, and if possible with a denaturated enzyme.
Samples preparation and enzyme activities for three antioxidant enzymes as described by Jonas-Levi et al. (Citation2015).
| (1) | Put 200 mg soft tissue (fresh weight) into 1 ml K-phosphate buffer 50 mM, pH 7.0. | ||||
| (2) | Drain liquids and soft tissue. | ||||
| (3) | Mix gently. | ||||
| (4) | Centrifuge (4,000 g) for 5 min and remove firm material from the extraction mixture. | ||||
5.7.2.1. Catalase activity
Catalase activity can be determined by the decomposition of H2O2 over time, measured at 240 nm.
| (1) | In a UV suitable cuvette put 1 ml K-phosphate buffer 50 mM pH 7.0. | ||||
| (2) | Add 10 μl sample extract. | ||||
| (3) | Mix gently. | ||||
| (4) | Reset the spectrophotometer (240 nm) on the reaction mixture. | ||||
| (5) | Add 10 μl 3% H2O2, mix by pipetting. | ||||
| (6) | Measure absorption immediately. | ||||
| (7) | Continue measuring for 5 min. | ||||
5.7.2.2. Peroxidase activity
Peroxidase activity can be determined using pyrogallol as substrate and purpurgallin as product.
| (1) | Add 5 μl samples into a 250 ml polypropylen 96 well microplate suitable for absorbance microplate readers. | ||||
| (2) | Add 200 μl reaction mixtures (10 mM potassium phosphate buffer pH 6.0, 0.03% hydrogen peroxide and 0.5% pyrogallol (w/v)). | ||||
| (3) | Measured optic density at 420 nm during 8 min. | ||||
5.7.2.3. Superoxide dismutase activity
Superoxide dismutases (SODs) are a class of closely related enzymes that catalyze the breakdown of the superoxide anion into oxygen and hydrogen peroxide. Superoxide dismutase activity can be quantified, based on the competitive inhibition of nitroblue tetrazolium reduction by the superoxide radical.
| (1) | Into a glass tube suitable for spectrophotometer, add 1.8 ml Phosphate buffer 50 mM pH- 7.8, 2 mM EDTA, 0.1 ml methionin 200 mM, 2 ml nitroblue tetrazolium 55 mM, 50 ml Triton X-100. | ||||
| (2) | Add 25 μl sample. | ||||
| (3) | Mix gently. | ||||
| (4) | Add 38 μl Riboflavin 53 mM, mix. | ||||
| (5) | Shake under strong light for 10 min. | ||||
| (6) | Measure at 560 nm. | ||||
Calculation of antioxidant enzyme activities (catalase, peroxidase and SOD)
where -The remainder between optic density of the blank and the optic density of the sample;
-The remainder between end reaction time and beginning reaction time, second or minute.
5.8. Antinutrients
Antinutrients are compounds that interfere with the absorption of nutrients. They act in two main mechanisms: (1) by interfering with the digestive enzymes in vivo, like protease inhibitors, lipase inhibitors and amylase inhibitors. This type of antinutrient is common in plants against insects, but no such inhibitors were reported in insects such as bees, or pollen; (2) by binding nutrients, and not allowing them to be absorbed. Adedunatan (Citation2005) reported presence of small amounts of phytate and tannins in several insects, which are antinutrients in higher concentrations.
6. Sensory analyses of edible honey bee brood
In many developing countries, eating insects is a common practice and each type has its own taste, aroma and texture. Honey bee brood has a nutty and slightly sour flavor with a crunchy texture when eaten cooked or dried. There are few studies exploring the flavor and texture characteristics of edible insects. In this section, we describe methods originated from research done on different sorts of edible insects, and practiced on honey bee brood (Bednářová, Borkovcová, Mlček, Rop, & Zeman, Citation2013; Cai, Koziel, & O’Neal, Citation2007; Caparros Megido et al., Citation2014; Kiatbenjakul, Intarapichet, & Cadwallader, Citation2015). The samples in some cases are raw insects, but in other cases can be processed such as cooked, baked or boiled.
6.1. Volatile compound analysis
There are three main extraction methods to be used for static sampling of volatile organic compounds (VOCs) from the honey bee brood. The methods are: Direct solvent extraction, solvent assisted flavor evaporation (SAFE) and headspace analysis using solid-phase microextraction (SPME). The first two methods deal with liquid extraction using solvent and the third method is gas extraction from the headspace above the sample. The methods should keep three important demands for a good extraction: (1) essential compounds that contribute to the aroma should not be excluded from the extraction, (2) the conditions applied in the extraction procedure should not change the VOC structure and (3) non-volatile compounds that may affect the separation in the column should be removed. In each method, the advantages and disadvantages are shortly discussed.
Sample preparation:
Take honey bee larvae, prepupae or pupae from the beehive as a whole and store at −80 °C until the analyses. Optional for longer storages: Dry the material completely under freeze-drier for 48 h, following a crushing step in a fine mixer to get a powder. The advantage in using freeze dry is to maintain the nutritional and sensorial quality of the source material (Jonas-Levi et al., Citation2015).
6.1.1. Direct solvent extraction method
A direct extraction of honey bee pupae with solvent is a simple procedure that requires the knowledge of the solvent properties to be able to achieve maximum yield of volatiles. It is advised to spike the sample with internal pure standard VOCs in order to assess the recovery percentage in the extracted sample to injection. The method is based on non-insect sample, but should work just as well with bees.
| (1) | Mix 10 gram of pupae sample (fresh or powder) thoroughly with 30 ml solvent (solvent: dichloromethane, diethyl ether, tert-butyl methyl ether or hexane) for an hour. | ||||
| (2) | Filter the solution using Whatman paper #1. | ||||
| (3) | Transfer the mixture solvent-sample to a separating funnel and collect the organic phase. | ||||
| (4) | Collect the residues with 15 ml of the solvent twice, collect the organic phase and add it to the previously collected solution. | ||||
| (5) | Dry the solution with salt Na2SO4 and concentrate the sample using slow stream of nitrogen gas. | ||||
Pros: Simple method, can achieve part of the VOCs exist in the sample.
Cons: A risk that not all the VOCs are recovered depending on the solvent choice and long time for drying using the N2 gas.
6.1.2. Liquid extraction by SAFE method
This method involves the use of a distillation unit designed by Engel, Bahr, and Schieberle (Citation1999). The system contains the feeding the funnel of the sample, heating part and condensing part with liquid nitrogen. The unit is connected to high vacuum pressure (10–3 Pa). The following procedure is based on a method by Kiatbenjakul et al. (Citation2015) on water-bugs.
| (1) | Weigh pupae sample (as whole or powder) and blend it with 20 ml deodorized distilled water in a 250 ml Teflon bottle. | ||||
| (2) | Add 30 ml solvent mixture of pentane: diethyl ether (1:1 v/v). | ||||
| (3) | Homogenize the solution at 3,000 rpm for 15 min and collect the organic phase. | ||||
| (4) | Pour the collected solution with the VOCs to the SAFE unit. | ||||
| (5) | Dry the SAFE extract using Na2SO4 salt and concentrate the sample to 200 μl with nitrogen gas. | ||||
| (6) | Inject 1 μl to the GC-MS for further identification and quantification of the VOCs. | ||||
Pros: The method overcomes other liquid extraction methods due to higher extraction yields. In addition the method used vacuum to lower the evaporation temperatures, which results in less chance to form new volatile compounds.
Cons: Time consuming and not all the VOCs from the sample are extracted to the solvent. There is a risk of losing VOCs to the vacuum inlet if the condensation is not quick enough.
6.1.3. Headspace analysis using SPME
Solid phase microextraction (SPME) is a recent and simple method to adsorb VOCs to a fiber and thermally desorb it into a GC-MS. More details about the method can be read in the Beebook chapter “Standard methods for chemical ecology research in Apis mellifera” (Torto et al., Citation2013). The method is based on a study by Cai et al. (Citation2007) on aroma compounds from beetles.
Procedure:
| (1) | Weigh insect (fresh or powder) into a 20 ml vial with a polytetrafluoroethylene (PTFE)-lined silicone septum. | ||||
| (2) | Allow the vial to equilibrate at 30 °C for 24 h before sampling with SPME fiber. | ||||
| (3) | Sample the vial by piercing the septum with the SPME needle and exposing the SPME fiber to the gases in the vial. | ||||
| (4) | Desorb the fiber into the GC-MS port at 260 °C for 40 min using an autosampler system. | ||||
Pros: The method is not invasive and collects most of the VOCs in the headspace above the sample according to the fiber sensitivity.
Cons: Costly as the fiber needs to be replaced every 100 samples. To obtain a broader spectrum of the VOCs, different types of fibers can be used.
6.1.4. Volatile compound identification and quantification
The VOCs are analyzed using gas chromatography mass spectrometry (GC-MS) that is capable to separate the compounds in a column based on polarity and identify them based on mass to charge ratio. More information regarding the GC-MS technique can found in the Beebook chapter “Standard methods for chemical ecology research in Apis mellifera” (Torto et al., Citation2013).
Analysis operating conditions:
| • | The VOCs are separated using either a polar capillary column (e.g., DB-Wax, 30 m, 0.25 mm id) or nonpolar column (e.g., BP5, 30 m, 0.25 mm id). | ||||
| • | The GC oven is programmed to rise from 35 °C to 240 °C at 4 °C min−1. | ||||
| • | The MSD conditions are: capillary direct interface temperature, 280 °C; ionization energy, 70 eV; mass range, 35–350 amu; electron multiplier voltage (Autotune + 200 V); scan rate, 5.27 scans/s. | ||||
6.2. Taste profile using electronic-tongue
The electronic-tongue (e-tongue) is based on potentiometric chemical sensors that respond to interactions with many taste substances in specific, non-specific and overlapping signals (Kobayashi et al., Citation2010). The sensors can analyze both positively and negatively charged taste molecules. There are a couple of different e-tongues systems available today. The e-tongue has been used in many studies with food and pharmaceutical applications (Kobayashi et al., Citation2010). Multivariate statistical analysis and principle component analysis is mostly used to describe differences in the overall taste profile among different sample groups.
Sample preparation:
| (1) | Weigh whole pieces of honey bee pupae and put them in a tray with an aluminum layer covering the sample. Keep some holes in the layer to allow evaporation to occur. | ||||
| (2) | Put the tray inside a freeze dry machine and run it until there is no change in sample weight. | ||||
| (3) | Mix the dry sample with fine mixer to obtain powder. Dissolve a fixed amount of powder in warm (30 °C) distilled water, filter it with paper and fill the measuring cups up to a volume of 70 ml. | ||||
All the procedure steps are done automatically by the e-tongue instrument e.g., SA402B Insent, Japan (Figure ). The following conditions need to be set in the operating software.
| (1) | Prepare reference solution (30 mM KCl and 0.3 mM tartaric acid). The sample reading is measured against the reference solution | ||||
| (2) | Measure the sensor output of the samples for 30 s. | ||||
| (3) | Clean the sensors (300 ml ethanol + 100 ml 1 M HCl (for negative) and 10 ml 1 M KOH + 7.46 gr KCl (for positive) + x ml distilled water up to 1 l) for 90 s. | ||||
| (4) | Wash the sensors in a reference solution for 90 s twice and then measure a stable reading from a reference solution before continuing to the next sample. | ||||
| (5) | Repeat every sample at least four times and use the last three samples to calculate a mean. | ||||
Figure 3. The electronic tongue (Insent SA402B, Japan) analyzing taste profiles of different honey bee pupae samples.
6.3. Texture analyses
Texture properties of insects can be analyzed on raw material or processed food products. A texture analyzer measures different physical characters such as: firmness, hardness, crunchiness, crispiness, etc.
Figure 4. Texture properties on raw or processed food products including bee brood e.g., bread, protein bars, cakes. The texture analyzer measures different physical characters such as: firmness, hardness, crunchiness, crispiness, etc.
6.3.1. Raw material
| (1) | Place a fresh piece of pupae in a plastic cup in the center table of the texture analyzer. | ||||
| (2) | Measure the firmness, defined as the maximum positive force and hardness, defined as the total work during the test. | ||||
| (3) | Set the operation conditions as followed: extension rate to about 20 mm/min and stop at 10 mm depth. Use cylinder probe with 5 mm diameter. | ||||
| (4) | Be careful to not crush or squeeze the delicate sample too fast, but to slowly penetrate the sample and measure changes in resistance. | ||||
6.3.2. Processed food product
| (1) | Use the raw material, dry it using an oven and mix it into a powder in a fine mixer or freeze the material with liquid nitrogen and crush it into a powder. | ||||
| (2) | Use the bee powder for processed food: bread, snacks, cakes, paste, etc. The insect powder replaces some of the original ingredients and the impact on texture is measured. | ||||
| (3) | In case of bread – take 30 × 30 × 20 mm sample size (Figure ). | ||||
| (4) | Use a disk probe with 30 mm diameter. | ||||
| (5) | Analyze the texture using a Texture Profile Analysis (TPA) – a double compression test for determining the textural properties of foods. The sample is compressed twice to mimic the feeling of samples when they are chewed in the mouth. Several parameters can be received from the same experiment: firmness, hardness, elasticity (length of base of area 2), cohesiveness (area 2/area 1), chewiness (firmness × elasticity × cohesiveness) and adhesiveness (negative work during the work). | ||||
| (6) | Set the operation conditions: 60 mm/min extension rate, 50% depth compression. | ||||
6.4. Sensory analysis of honey bee brood by trained and non-trained panels
Sensory panel are important tool in the overall sensory analyses of edible insects, including bee brood. Using human senses, it is possible to describe the sensory experience of eating certain insects in terms of aroma, taste, texture and sometimes visual appearance. There are many different types of sensory tests. Here we describe two kinds: intensity evaluation and hedonic test (Bednářová et al., Citation2013; Caparros Megido et al., Citation2014; Kiatbenjakul et al., Citation2015). The tests are performed in sensory booths under controlled temperature and humidity conditions (usually 20 °C ± 2 °C). Red light can be used to mask the effect of color from the insect samples.
6.4.1. Trained sensory panel – intensity evaluation
Selection and training:
| (1) | Recruit a group of panellists that pass a threshold test for basic taste and smell intensity, and that are willing to participate in eating insects. Select about 15 people for the panel, describe the panel (gender and age). | ||||
| (2) | The second part includes basic training to get the panellists familiar with the type of test and common taste, aroma and texture definitions. | ||||
| (3) | Train the panel for the odor descriptive terms arising from honey bee brood samples. The panel has to reach a consensus for a list of attributes for both aroma and taste. For example, nine attributes of giant water bug odors were selected in consensus agreement between eleven panelists. Among the odor attributes were floral, pineapple like, fruity and fishy (Kiatbenjakul et al., Citation2015). | ||||
| (4) | Assign each attribute with a reference that can be used during the following training meeting. For example, sweetness and saltiness tastes are evaluated using sugar and NaCl solutions at varied concentrations as standards (Benjamin & Gamrasni, Citation2015). | ||||
| (5) | Lastly, the panel conducts “real” like tests with intensity scales to get used to the type of test and the samples. | ||||
Test procedure:
| (1) | Take 1 g of sample in a plastic cup assigned with a three digit random number. | ||||
| (2) | Ask the panelist to evaluate the aroma intensity using an anchored scale between 0 (none) to 15 (extremely strong). A reference can be used during the test to assist with ranking the intensity. | ||||
| (3) | Between samples the participant need to drink water and eat salt-free cracker to avoid carry over between samples. | ||||
| (4) | Analyze the results from triplicate sensory tests using statistics software (Radar charts, analysis of variance analysis ANOVA or principle component analysis PCA). | ||||
6.4.2. Non-trained sensory panel- hedonic test
Sensory acceptance is very crucial for the success of introducing edible insects to the future food market. Non trained people (more than 100) are used as public judges for “liking” evaluation without previous experience or training with insects. Two types of samples can be used in the hedonic test – fresh samples or processed food products. This method is commonly used in other food products like soft cheese (Gomes et al., Citation2011).
Before the test starts, each participant needs to be informed about the safety and the potential allergenicity of the samples.
| (1) | Provide a sample to each participant without any information about the attributes. | ||||
| (2) | Ask the participant to rate the sample in a 10 point scale from 0 (very dislike) to 10 (very like). | ||||
| (3) | Between samples provide the participant with water and salt-free cracker to avoid carry over between samples. | ||||
7. Gastronomic applications and potential of edible honey bee brood
In many developing countries, eating insects is a common practice and each type has its own taste, aroma and texture. Honey bee brood has some unique organoleptic qualities, which presents many possibilities for gastronomic applications.
7.1. Flavor
Honey bee brood has a range of flavors which can vary depending on preparation technique. Semi-structured sensory analyses of honey bee larvae have yielded descriptors such as: “raw nuts”, “hazelnut”, “brazil nut”, “avocado”, “nutty”, “herbal”, “vegetal”, “liver” for raw and steamed; and “meaty”, “chicken-y”, “bacon”, “mushroom”, “liver” for fried or roasted. The honey bee pupae have similar flavor characteristics, but can also develop a more bitter and animal taste as they become more developed, as well as a firmer and, just before becoming imago, a more chewy texture. One descriptive sensory analysis of honey bee drone brood has been conducted, with sensory differences between larvae and pupae demonstrated as the primary axis of variance (Evans et al., Citation2016).
7.2. Texture
The textural properties of honey bee brood give it both some of its challenges and its rewards. When not frozen, honey bee brood is quite fragile, and can rupture easily, especially if having already been frozen. This softness, however, is also part of their gastronomic potential, and if preserved well it can bring a surprising and unique element to a dish. Raw larvae at room temperature are soft and plump. In the mouth, they can be popped with slight pressure from the tongue, with a mouth-coating liquid within. Raw pupae at room temperature are slightly more firm as a result of their later developmental stage and so resist slightly more pressure than the larvae, though they still contain a similarly viscous interior.
7.3. Culinary transformations
Honey bee brood is a versatile ingredient in the kitchen. It can be used whole or blended, and can be processed using wet or dry heat, acid or fermentation techniques.
7.3.1. Wet heat (steaming, simmering, poaching)
At the appropriate temperature, these methods gently coagulate the proteins in the honey bee brood yielding a plump and soft but solid texture; though at inappropriate temperatures (for example, steaming too quickly or boiling) the brood can become hard and grainy. These methods tend to bring out the herbal, vegetal and nutty notes, as well as a light but distinct savouriness, and seems to be more common in traditional applications for honey bee brood, for example simmering in soup at the end of cooking, or steaming in egg dishes (Figures and ).
Figure 5. Kheang Nor Mai Preaw Kai Peung: soup from north-east Thailand with sour fermented bamboo shoots and weaver ant eggs, here also made with (less traditional) honey bee larvae, made by Ranee Udtumthisarn in Copenhagen.
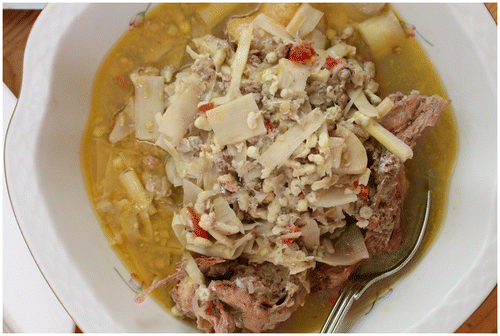
Figure 6. Kai Jiew Mod Dang: Chicken eggs scrambled with garlic, chilli, shallots, scallions, fish sauce, and weaver ant eggs, here also made with (less traditional) honey bee larvae, made by Ranee Udtumthisarn in Copenhagen.
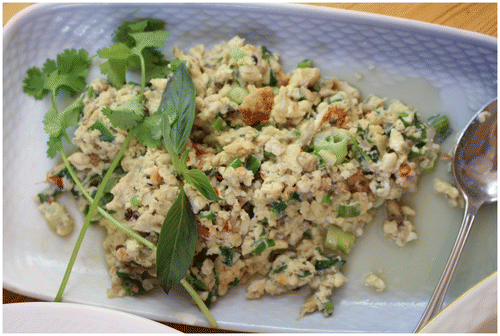
7.3.2. Dry heat (frying, roasting, baking, drying)
These methods often create crispy and crunchy textures and can bring out the stronger “meaty”, “bacon-y”, “liver” and “mushroom” flavors due to the caramelising Maillard reactions that give toasty flavors and brown colors. These methods are not as common in traditional applications as wet heat methods. They yield fast and satisfying results, though some of their aromatic complexity is lost or transformed (Figures and ). Heat dried honey bee brood can also be transformed to a fine powder using an electric blender and used directly or mixed with any other flour as an additive in e.g., bread, vegetable dish or soup (Krell, Citation1996).
Figure 7. “Peas ‘n’ bees”, a dish developed at the Nordic Food Lab: fresh pea soup, bee larvae (some poached, some fried), blanched peas, lovage and fermented bee pollen (“bee bread”).
Figure 8. Honey bee larvae granola, developed at the Nordic Food Lab: oats, seeds of sunflower, pumpkin and flax, coated in a blended mixture of bee larvae and honey and baked until golden brown, with whole dried larvae and pupae added at the end for texture and flavor.
7.3.3. Acid
This is a traditional technique used for pickling as well as in the South American technique for ceviche, a dish of seafood cured or “cooked” with citrus juice. Though its application to honey bee brood is not traditional, the technique firms up the exterior while preserving the liquid interior, depending on the curing time, and create a delicious textural contrast (Figure ).
Figure 9. Honey bee larvae ceviche, a dish developed at the Nordic Food Lab: bee larvae cured in rhubarb vinegar, garnished with purple oxalis leaves and stems, freeze-dried raspberries, and lemon verbena.
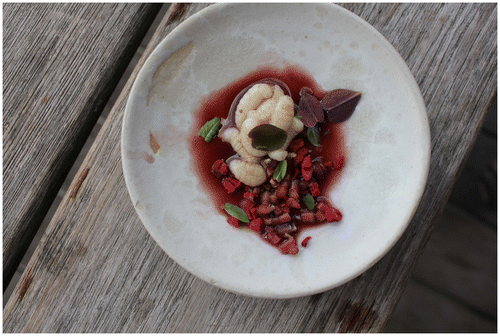
7.3.4. Fermentation
Fermentation using salt and sometimes grains molded with Aspergillus oryzae to produce exogenous enzymes (in Japanese cuisine known as koji) yields a salt-rich umami sauce which can be used as an analog to soy sauce or fish sauce to add a savory element to dishes. In this case the fermented sauce uses honey bee brood as its source of protein (less traditional), generating amino acids when broken down by the enzymes, and thus has the particular qualities of honey bee brood – a light, transparent golden color, with nutty, vegetal and delicate meaty aromas. Another example of bee brood involved in fermentation would be the South African mead “iQhilika”.
8. Conclusion
From production through to consumption via examples of nutrient analyses, the aim of this chapter was to contribute to the growing field of entomophagy by introducing honey bee brood as a realistic addition to a more sustainable food industry. The methods described are far from exhaustive, but should facilitate more research into e.g., the nutritional value of honey bee, drone and worker, brood. Once again, the near omnipresence of honey bees around the world and its long documented relationship with man could potentially accelerate the acceptance of insects as a foodstuff. Drone brood removal as a part of a sustainable Varroa sp. control will add on to the branding of drone brood and could revitalize the industry by providing new sources of revenues to beekeepers.
Disclosure statement
No potential conflict of interest was reported by the authors.
Acknowledgements
The COLOSS (Prevention of honey bee COlony LOSSes) Association aims to explain and prevent massive honey bee colony losses. It was funded through the COST Action FA0803. COST (European Cooperation in Science and Technology) is a unique means for European researchers to jointly develop their own ideas and new initiatives across all scientific disciplines through trans-European networking of nationally funded research activities. Based on a pan-European intergovernmental framework for cooperation in science and technology, COST has contributed since its creation more than 40 years ago to closing the gap between science, policy makers and society throughout Europe and beyond. COST is supported by the EU Seventh Framework Program for research, technological development and demonstration activities (Official Journal L 412, 30 December 2006). The European Science Foundation as implementing agent of COST provides the COST Office through an EC Grant Agreement. The Council of the European Union provides the COST Secretariat. The COLOSS network is now supported by the Ricola Foundation - Nature & Culture.
Notes
Please refer to this paper as: Jensen, A B, Evans, J, Jonas-Levi, A, Benjamin, O, Martinez, I, Dahle, B, Roos, N, Lecocq, A, Foley, K (2019) Standard methods for Apis mellifera brood for human food. In V Dietemann, P Neumann, N Carreck and J D Ellis (Eds), The COLOSS BEEBOOK, Volume III, Part I: standard methods for Apis mellifera hive products research. Journal of Apicultural Research 58(2): http://dx.doi.org/10.1080/00218839.2016.1226606
Related Research Data
References
- Adedunatan, S. A. (2005). Nutritional and antinutritional characteristics of some insects foraging in Akure forest reserve Ondo state, Nigeria. Journal of Food Technology, 3, 563–567.
- Ambrose, J. T. (1992). Management for honey production. In J. M. Graham (Ed.), The hive and the honey bee. Hamilton, Illinois: Dadant Publications, Dadant & Sons.
- Association of Officiating Analytical Chemists. (1996). Official methods of analysis (16th ed.). Washington, DC: Author.
- Bednářová, M., Borkovcová, M., Mlček, J., Rop, O., & Zeman, L. (2013). Edible insects-species suitable for entomophagy under condition of Czech Republic. Acta Universitatis Agriculturae et Silviculturae Mendelianae Brunensis, 61, 587–593.10.11118/actaun201361030587
- Behrens, W. A., & Madère, R. (1987). A highly sensitive high-performance liquid chromatography method for the estimation of ascorbic and dehydroascorbic acid in tissues, biological fluids, and foods. Analytical Biochemistry, 165, 102–107.10.1016/0003-2697(87)90206-5
- Benjamin, O., & Gamrasni, D. (2015). Electronic tongue as an objective evaluation method for taste profile of pomegranate juice in comparison with sensory panel and chemical analysis. Food Analytical Methods., 9, 1726.
- Blair, A., Ritz, B., Wesseling, C., & Freeman, L. B. (2014). Pesticides and human health. Occupational and Environmental Medicine,. doi:10.1136/oemed-2014-102454
- Blake, C. J. (2007). Analytical procedures for water-soluble vitamins in foods and dietary supplements: A review. Analytical and Bioanalytical Chemistry., 389, 63–76.10.1007/s00216-007-1309-9
- Boes, K. E. (2010). Honey bee colony drone production and maintenance in accordance with environmental factors: An interplay of queen and worker decisions. Insectes Sociaux, 57, 1–9.10.1007/s00040-009-0046-9
- Brodschneider, R., & Crailsheim, K. (2010). Nutrition and health in honey bees. Apidologie, 41, 278–294.10.1051/apido/2010012
- Büchler, R., Andonov, S., Bienefeld, K., Costa, C., Hatjina, F., Kezic, N., ... Wilde, J. (2013). Standard methods for rearing and selection of Apis mellifera queens. In V.Dietemann, J.D.Ellis, & P.Neumann (Eds.), The COLOSS BEEBOOK, Volume I: standard methods for Apis mellifera research. Journal of Apicultural Research, 52(1), doi:10.3896/IBRA.1.52.1.07
- Cai, L., Koziel, J. A., & O’Neal, M. E. (2007). Determination of characteristic odorants from Harmonia axyridis beetles using in vivo solid-phase microextraction and multidimensional gas chromatography-mass spectrometry-olfactometry. Journal of Chromatography A, 1147, 66–78.10.1016/j.chroma.2007.02.044
- Calderone, N. W. (2005). Evaluation of drone brood removal for management of Varroa destructor (Acari: Varroidae) in colonies of Apis mellifera (Hymenoptera: Apidae) in the Northeastern United States. Journal of Economic Entomology, 98, 645–650.10.1603/0022-0493-98.3.645
- Caparros Megido, R., Sablon, L., Geuens, M., Brostaux, Y., Alabi, T., Blecker, C., ... Francis, F. (2014). Edible insects acceptance by Belgian consumers: Promising attitude for entomophagy development. Journal of Sensory Studies, 29, 14–20.10.1111/joss.2014.29.issue-1
- Chebrolu, K. K., Jayaprakasha, G. K., Yoo, K. S., Jifon, J. L., & Patil, B. S. (2012). An improved sample preparation method for quantification of ascorbic acid and dehydroascorbic acid by HPLC. LWT–Food Science and Technology, 47, 443–449.
- Collin, K., & Blum, R. (2005). Method of analysis of vitamins, provitamins and chemically well defined substances having a similar biological effect-1st part “tel quel”. FEFANA-EU Additives & Premixtures Association Publication, Brussels.
- Dainat, B., Kuhn, R., Cherix, D., & Neumann, P. (2011). A scientific note on the ant pitfall for quantitative diagnosis of Varroa destructor. Apidologie, 42, 740–742.10.1007/s13592-011-0071-3
- de Foliart, G.R. (2002) The human use of insects as a food resource: A bibliographic account in progress (no. 28, pp. 1–51). Oceania. Retrieved from http://labs.russell.wisc.edu/insectsasfood/the-human-use-of-insects-as-a-food-resource/
- de Graaf, D. C., Alippi, A. M., Antúnez, K., Aronstein, K. A., Budge, G., De Koker, D., ... Genersch, E. (2013). Standard methods for American foulbrood research. In V. Dietemann, J. D. Ellis, & P. Neumann (Eds.), The COLOSS BEEBOOK, Volume II: standard methods for Apis mellifera pest and pathogen research. Journal of Apicultural Research, 52(1). doi:10.3896/IBRA.1.52.1.11
- de Miranda, J. R., Bailey, L., Ball, B. V., Blanchard, P., Budge, G., Chejanovsky, N., ... van der Steen, J. J. M. (2013). Standard methods for virus research in Apis mellifera. In V. Dietemann, J. D. Ellis, & P. Neumann (Eds.), The COLOSS BEEBOOK, Volume II: standard methods for Apis mellifera pest and pathogen research. Journal of Apicultural Research, 52(4). doi:10.3896/IBRA.1.52.4.22
- DeGrandi-Hoffman, G., Eckholm, B. J., & Huang, M. H. (2013). A comparison of bee bread made by Africanized and European honey bees (Apis mellifera) and its effects on hemolymph protein titers. Apidologie, 44, 52–63.10.1007/s13592-012-0154-9
- Delaplane, K. S., Dag, A., Danka, R. G., Freitas, B. M., Garibaldi, L. A., Goodwin, R. M., & Hormaza, J. I. (2013). Standard methods for pollination research with Apis mellifera. In V. Dietemann, J. D. Ellis, & P. Neumann (Eds.), The COLOSS BEEBOOK, Volume I: standard methods for Apis mellifera research. Journal of Apicultural Research, 52(4) doi:10.3896/IBRA.1.52.4.12
- Dietemann, V., Nazzi, F., Martin, S. J., Anderson, D., Locke, B., Delaplane, K. S., ... Ellis, J. D. (2013). Standard methods for varroa research. In V. Dietemann, J. D. Ellis, & P. Neumann (Eds.), The COLOSS BEEBOOK, Volume II: standard methods for Apis mellifera pest and pathogen research. Journal of Apicultural Research, 52(1). doi:10.3896/IBRA.1.52.1.09
- Duay, P., Jong, D., & Engels, W. (2003). Weight loss in drone pupae (Apis mellifera) multiply infested by Varroa destructor mites. Apidologie, 34, 61–65.10.1051/apido:2002052
- Engel, W., Bahr, W., & Schieberle, P. (1999). Solvent assisted flavour evaporation-a new and versatile technique for the careful and direct isolation of aroma compounds from complex food matrices. European Food Research and Technology, 209, 237–241.10.1007/s002170050486
- European Food safety Authority. (2007). Scientific opinion of the Panel on Food additives, Flavorings, Processing aids and Materials in Contact with Food (AFC) on a request from the Commission on the safety in use of bees wax. The EFSA Journal, 615, 1–28.
- European Food safety Authority. (2015). Scientific committee: Risk profile related to production and consumption of insects as food and feed. The EFSA Journal, 13, 4257–4372. doi:10.2903/j.efsa.2015.4257
- European Union. (2004a). Regulation (EC) No 1935/2004 of the European Parliament and of the Council of 27 October 2004 on materials and articles intended to come into contact with food and repealing Directives 80/590/EEC and 89/109/EEC.
- European Union. (2004b). Regulation (EC) No 852/2004 of the European parliament and of the council of 29 April 2004 on the hygiene of foodstuffs.
- Evans, J. (2013). Insect gastronomy. Cereal Magazine., 3, 62–71.
- Evans, J. (2014). Observations from the frontier of deliciousness MAD Dispatches: what is cooking? (pp. 80–91). Copenhagen: MAD.
- Evans, J., Müller, A., Jensen, A. B., Dahle, B., Flore, R., Eilenberg, J., Frøst, M. B. (2016, In press). An exploratory descriptive sensory analysis of honey bee drone brood from Denmark and Norway. Journal for Food and Feed.
- FAO. (2013). Dietary protein quality evaluation in human nutrition ( Report of an FAO Expert Consultation, FAO Food and Nutrition Paper n.92). Rome: FAO. Retrieved from http://www.fao.org/ag/humannutrition/35978-02317b979a686a57aa4593304ffc17f06.pdf
- Finke, M. D. (2005). Nutrient composition of bee brood and its potential as human food. Ecology of Food and Nutrition, 44, 257–270.10.1080/03670240500187278
- Forsgren, E., Budge, G. E., Charrière, J.-D., & Hornitzky, M. A. Z. (2013). Standard methods for European foulbrood research. In V. Dietemann, J. D. Ellis, & P. Neumann (Eds.), The COLOSS BEEBOOK: Volume II: Standard methods for Apis mellifera pest and pathogen research. Journal of Apicultural Research, 52(1). doi:10.3896/IBRA.1.52.1.12
- Free, J. B., & Williams, I. H. (1975). Factors determining the rearing and rejection of drones by the honey bee colony. Animal Behaviour, 23, 650–675.10.1016/0003-3472(75)90143-8
- Fries, I., Chauzat, M.-P., Chen, Y.-P., Doublet, V., Genersch, E., Gisder, S., ... Williams, G. R. (2013). Standard methods for nosema research. In V. Dietemann, J. D. Ellis, & P. Neumann (Eds.), The COLOSS BEEBOOK: Volume II: Standard methods for Apis mellifera pest and pathogen research. Journal of Apicultural Research, 52(1). doi:10.3896/IBRA.1.52.1.14
- Gary, N. E. (1992). Activities and behavior of honey bees. In J. M. Graham (Ed.), The hive and the honey bee. Hamilton, IL: Dadant Publications, Dadant & Sons.
- Gessain, M., & Kinzler, T. (1975). Miel et insectes à miel chez les Bassari et dáutres populations du Sénégal Oriental [Honey and honey making insects in the Bassari and other populations of Eastern Senegal]. In R. Pujol (Ed.), L’homme et l’annimal (pp. 247–254). Paris: Premier Colloque d’Éthnozoologie.
- Gomes, A. P., Cruz, A. G., Cadena, R. S., Celeghini, R. M., Faria, J. A., Bolini, H. M., Pollonio, M. A., & Granato, D. (2011). Manufacture of low-sodium Minas fresh cheese: Effect of the partial replacement of sodium chloride with potassium chloride. Journal of Dairy Science, 94, 2701–2706.10.3168/jds.2010-3774
- Harbo, J. R. (1986). Effect of population size on brood production, worker survival and honey gain in colonies of honey bee. Journal of Apicultural Research, 25, 22–29. doi:10.1080/00218839.1986.11100687
- Hartfelder, K., Gentile Bitondi, M. M., Brent, C., Guidugli-Lazzarini, K. R., Simões, Z. L. P., Stabentheiner, A., ... Wang, Y. (2013). Standard methods for physiology and biochemistry research in Apis mellifera. In V. Dietemann, J. D. Ellis, & P. Neumann (Eds.), The COLOSS BEEBOOK, Volume I: standard methods for Apis mellifera research. Journal of Apicultural Research, 52(1). doi:10.3896/IBRA.1.52.1.06
- Haydak, M. H. (1970). Honey bee nutrition. Annual Review of Entomology, 15, 143–156.10.1146/annurev.en.15.010170.001043
- Hocking, B., & Matsumura, F. (1960). Bee World, 41, 113–120. doi:10.1080/0005772X.1960.11096777
- Hrassnigg, N., & Crailsheim, K. (1998). The influence of brood on the pollen consumption of worker bees (Apis mellifera L.). Journal of Insect Physiology, 44, 393–404.10.1016/S0022-1910(98)00022-5
- Human, H., Brodschneider, R., Dietemann, V., Dively, G., Ellis, J. D., Forsgren, E., ... Zheng, H.-Q. (2013). Miscellaneous standard methods for Apis mellifera research. In V. Dietemann, J. D. Ellis, & P. Neumann (Eds.), The COLOSS BEEBOOK, Volume I: standard methods for Apis mellifera research. Journal of Apicultural Research, 52(4). doi:10.3896/IBRA.1.52.4.10
- Imdorf, A., Rickli, M., Kilchenmann, V., Bogdanov, S., & Wille, H. (1998). Nitrogen and mineral constituents of honey bee worker brood during pollen shortage. Apidologie, 29, 315–325.10.1051/apido:19980402
- Jensen, A. B., Aronstein, K., Flores, J. M., Vojvodic, S., Palacio, M. A., & Spivak, M. (2013). Standard methods for fungal brood disease research. In V. Dietemann, J. D. Ellis, & P. Neumann (Eds.), The COLOSS BEEBOOK: Volume II: Standard methods for Apis mellifera pest and pathogen research. Journal of Apicultural Research, 52(1). doi:10.3896/IBRA.1.52.1.13
- Johansson, T. S. K., & Johansson, M. P. (1978). Providing honey bees with water. Bee World, 59, 54–64. doi:10.1080/0005772X.1978.11097693
- Jonas-Levi, A., Benjamin, O., & Martinez, J. I. (2015). Does a parasite infestation change the nutritional value of an insect? Varroa mites on honey bees as a model. Journal of Insects as Food and Feed, 1, 141–147.
- Kiatbenjakul, P., Intarapichet, K. O., & Cadwallader, K. R. (2015). Characterization of potent odorants in male giant water bug (Lethocerus indicus Lep. and Serv.), an important edible insect of Southeast Asia. Food Chemistry, 168, 639–647.10.1016/j.foodchem.2014.07.108
- Klunder, H. C., Wolkers-Rooijackers, J., Korpela, J. M., & Nout, M. J. R. (2012). Microbiological aspects of processing and storage of edible insects. Food Control, 26, 628–631. doi:10.1016/j.foodcont.2012.02.013
- Kobayashi, Y., Habara, M., Ikezazki, H., Chen, R., Naito, Y., & Toko, K. (2010). Advanced taste sensors based on artificial lipids with global selectivity to basic taste qualities and high correlation to sensory scores. Sensors, 10, 3411–3443.10.3390/s100403411
- Krell, R. (1996) Value-added products from beekeeping. FAO Agricultural Services Bulletin No. 124. Rome: Food and Agriculture Organization of the United Nations.
- Leporati, A., Catellani, D., Suman, M., Andreoli, R., Manini, P., & Niessen, W. M. A. (2005). Application of a liquid chromatography tandem mass spectrometry method to the analysis of water-soluble vitamins in Italian pasta. Analytica Chimica Acta, 531, 87–95.10.1016/j.aca.2004.10.006
- Macevilly, C. (2000). Bugs in the system. Nutrition Bulletin, 25, 267–268.
- Mbata, K. J. (1995). Traditional use of arthropods in Zambia. I. The food insects. Food Insects Newsletter, 8, 5–7.
- Meixner, M. D., Pinto, M. A., Bouga, M., Kryger, P., Ivanova, E., & Fuchs, S. (2013). Standard methods for characterising subspecies and ecotypes of Apis mellifera. In V. Dietemann, J. D. Ellis, & P. Neumann (Eds.), The COLOSS BEEBOOK, Volume I: standard methods for Apis mellifera research. Journal of Apicultural Research, 52(4). doi:10.3896/IBRA.1.52.4.05
- Moreno, P., & Salvadó, V. (2000). Determination of eight water- and fat-soluble vitamins in multi-vitamin pharmaceutical formulations by high-performance liquid chromatography. Journal of Chromatography A, 870, 207–215.10.1016/S0021-9673(99)01021-3
- Neumann, P., Moritz, R., & Mautz, D. (2000). Colony evaluation is not affected by drifting of drone and worker honey bee (Apis mellifera L.) at a performance testing apiary. Apidologie, 31, 67–79.10.1051/apido:2000107
- Onore, G. (1997). A brief note on edible insects in Ecuador. Ecology of Food and Nutrition, 36, 277–285.10.1080/03670244.1997.9991520
- Oonincx, D. G. A. B., Van Itterbeeck, J., Heetkamp, M. J. W., Van Den Brand, H., Van Loon, J. J. A., & Van Huis, A. (2010). An exploration on greenhouse gas and ammonia production by insect species suitable for animal or human consumption. PLoS ONE, 5(12), 1–7. e14445.
- Payne, C. L. (2015). Wild harvesting declines as pesticides and imports rise: The collection and consumption of insects in contemporary rural Japan. Journal of Insects as Food and Feed, 1, 57–65.10.3920/JIFF2014.0004
- PerkinElmer. (1996). Analytical methods for atomic absorption spectroscopy. Retrieved from http://www.lasalle.edu/~prushan/Intrumental%20Analysis_files/AA-Perkin%20Elmer%20guide%20to%20all!.pdf
- Prosky, L., Asp, N. G., Schweizer, T. F., Devries, J. W., & Furda, I. (1988). Determination of insoluble, soluble, and total dietary fiber in foods and food products: Interlaboratory study. Journal of the Association of Official Analytical Chemists, 71, 1017–1023.
- Ramos-Elorduy, J., Moreno, J. M. P., Prado, E. E., Perez, M. A., Otero, J. L., & de Guevara, O. L. (1997). Nutritional value of edible insects from the state of Oaxaca, Mexico. Journal of Food Composition and Analysis, 10, 142–157.10.1006/jfca.1997.0530
- Rumpold, B., & Schlüter, O. (2013). Nutritional composition and safety aspects of edible insects. Molecular Nutrition and Food Research, 57, 802–823.10.1002/mnfr.v57.5
- Ruttner, F. (1988). Biogeography and taxonomy of honey bees (284 pp.). Berlin: Springer.10.1007/978-3-642-72649-1
- Salo-Väänänen, P. S., Ollilainen, V., Mattila, P., Lehikoinen, K., Salmela-Mölsä, E., & Piironen, V. (2000). Simultaneous HPLC analysis of fat-soluble vitamins in selected animal products after small-scale extraction. Food Chemistry, 71, 535–543.10.1016/S0308-8146(00)00155-2
- Scherer, R., Rybka, A. C. P., Ballus, C. A., Meinhart, A. J. T., & Godoy, H. T. (2012). Validation of a HPLC method for simultaneous determination of main organic acids in fruits and juices. Food Chemistry, 135, 150–154.10.1016/j.foodchem.2012.03.111
- Schmidt, J. O., & Buchmann, S. L. (1992). Other products of the hive. In J. M. Graham (Ed.), The hive and the honey bee (pp. 927–988). Hamilton, IL: Dadant & Sons.
- Seeley, T. D. (2002). The effect of drone comb on a honey bee colony’s production of honey. Apidologie, 33, 75–86.10.1051/apido:2001008
- Seeley, T. D., & Mikheyev, A. S. (2003). Reproductive decisions by honey bee colonies: Tuning investment in male production in relation to success in energy acquisition. Insectes Sociaux, 50, 134–138.10.1007/s00040-003-0638-8
- Segeren, P. (2004). Beekeeping in the tropics. Agrodok 32 (90 pp.). Wageningen: Agromisa Foundation.
- Standifer, L. N., Moeller, F. R., Kauffeld, N. M., Herbert, Jr., E. W., & H.Shimanuki (1977) Supplemental feeding of honey bee colonies. Agriculture Information Bulletin 43 (pp. 8). United States Department of Agriculture, Washington, DC.
- Taoukis, P. S., & Labuza, T. P. (1989). Applicability of time-temperature indicators as shelf life monitors of food products. Journal of Food Science, 54, 783–788.10.1111/jfds.1989.54.issue-4
- Torto, B., Carroll, M. J., Duehl, A., Fombong, A. T., Gozansky, K. T., Nazzi, F., ... Teal, P. E. A. (2013). Standard methods for chemical ecology research in Apis mellifera. In V. Dietemann, J. D. Ellis, & P. Neumann (Eds.), The COLOSS BEEBOOK, Volume I: standard methods for Apis mellifera research. Journal of Apicultural Research, 52(4). doi:10.3896/IBRA.1.52.4.06
- van Huis, A., Van Itterbeeck, J., Klunder, H., Mertens, E., Halloran, A., Muir, G., & Vantomme, P. (2013) Edible insects: future prospects for food and feed security (p. 201). Rome: FAO. Retrieved from http://www.fao.org/docrep/018/i3253e/i3253e.pdf
- Wu, J. Y., Anelli, C. M., & Sheppard, W. S. (2011). Sub-lethal effects of pesticide residues in brood comb on worker honey bee (Apis mellifera) development and longevity. PLoS ONE, 6, e14720.10.1371/journal.pone.0014720
- Yhoung-Aree, J., Puwastien, P., & Attig, G. A. (1997). Edible insects in Thailand: An unconventional protein source? Ecology of Food and Nutrition, 36, 133–149.10.1080/03670244.1997.9991511
- Zhi-Yi, L. (1997). Insects as food in China. Ecology of Food and Nutrition, 36, 201–207.10.1080/03670244.1997.9991515