
Abstract
This article presents managed honey bee colony loss rates over winter 2018/19 resulting from using the standardised COLOSS questionnaire in 35 countries (31 in Europe). In total, 28,629 beekeepers supplying valid loss data wintered 738,233 colonies, and reported 29,912 (4.1%, 95% confidence interval (CI) 4.0–4.1%) colonies with unsolvable queen problems, 79,146 (10.7%, 95% CI 10.5–10.9%) dead colonies after winter and 13,895 colonies (1.9%, 95% CI 1.8–2.0%) lost through natural disaster. This gave an overall colony winter loss rate of 16.7% (95% CI 16.4–16.9%), varying greatly between countries, from 5.8% to 32.0%. We modelled the risk of loss as a dead/empty colony or from unresolvable queen problems, and found that, overall, larger beekeeping operations with more than 150 colonies experienced significantly lower losses (p < 0.001), consistent with earlier studies. Additionally, beekeepers included in this survey who did not migrate their colonies at least once in 2018 had significantly lower losses than those migrating (p < 0.001). The percentage of new queens from 2018 in wintered colonies was also examined as a potential risk factor. The percentage of colonies going into winter with a new queen was estimated as 55.0% over all countries. Higher percentages of young queens corresponded to lower overall losses (excluding losses from natural disaster), but also lower losses from unresolvable queen problems, and lower losses from winter mortality (p < 0.001). Detailed results for each country and overall are given in a table, and a map shows relative risks of winter loss at regional level.
The COLOSS monitoring group has been active in studying honey bee colony losses through national surveys of beekeepers since 2008, and now consists of over 30 countries regularly taking part in this central activity of the COLOSS research association. This short article is the fourth in a series of bulletins presenting summary results from the annual colony winter loss survey of the COLOSS monitoring group (Brodschneider et al., Citation2016, Citation2018; Gray et al., Citation2019). Each such survey is carried out via a network of national co-ordinators organising sample selection and using a self-administered standardised questionnaire developed by the monitoring group (van der Zee et al., Citation2013), which is reviewed and improved each year as it is felt necessary or desirable. This standardisation enables comparison of results between countries and also over time. Here we examine colony loss rates over winter 2018/19, from the survey carried out in spring 2019.
In addition to reporting winter loss rates for each participating country and for the overall data set across all the participating countries, here we also examine possible association of the effect of queen age or re-queening on the probability of winter loss. Earlier articles examined the effects of operation size, migration, and of six specific sources of forage (Brodschneider et al., 2016, 2018; Gray et al., 2019), both overall for all countries taking part and individually at country level.
To study winter loss rates, beekeepers were asked to state the number of colonies wintered, and how many of these colonies after winter (a) were alive but had unsolvable queen problems (e.g., a missing queen, laying workers, or a drone-egg laying queen), (b) were dead or reduced to a few hundred bees and (c) were lost through natural disaster (from various possible causes). The overall proportion of colonies lost was found by calculating the sum given by (a + b + c), which was then divided by the number of colonies going into winter. The data files from each country were checked for consistency of loss data using established checks reported in Brodschneider et al. (Citation2018). Responses with insufficient or illogical answers were excluded, but the number of such responses is, in general, relatively small and has been declining over the last few years owing to several factors: greater awareness of these issues on the part of the national co-ordinators, efforts made to give clearer guidance to the beekeepers completing the questionnaire, data checks now built in to the online survey platform used by a large number of the participating countries, and more filtering of inconsistent answers being done at national level before data submission. Hence the quality of data sent for central processing is improving.
A strength of these studies is in the number of beekeepers and colonies represented over many countries, giving greater power to the statistical analysis. In this article the results derive from 28,629 beekeepers in 35 countries (compared to 36, 30 and 29 countries in the previous three surveys in 2018, 2017 and 2016, respectively). A notable addition to the countries providing data for winter 2018/19 is Iran, from where 1,653 beekeepers submitted data on 230,093 colonies. This expands the limited number of non-European countries participating in the COLOSS monitoring: the others are Algeria and Israel, which have participated consistently over the years, and Mexico, which joined relatively recently. Some other countries do carry out similar work independently of this COLOSS monitoring group.
In total, 28,822 responses were received from beekeepers, of which 28,629 (99.3%) satisfied checks for consistency of colony loss data provided, the largest number yet represented in these surveys. These 28,629 beekeepers collectively managed 738,233 colonies going into winter, a considerable increase on the 544,879 colonies studied in the previous monitoring group survey. This time, 29,912 (4.1%) colonies were reported lost due to unsolvable queen problems, 79,146 (10.7%) colonies were reported dead after winter and 13,895 (1.9%) colonies were reported as lost due to natural disaster (), with an overall loss rate of 16.7%. These are similar to the results from the 2018 survey (4.8% of colonies reported lost due to unsolvable queen problems, 10.0% reported dead after winter and 1.5% reported as lost due to natural disaster) which found an overall loss rate of 16.4%. For the present study, considering the European countries only, and also the countries belonging to the European Union (EU countries, including the UK, which was a member state over winter 2018/2019), respectively, the results were as follows: 26,690 and 23,618 beekeepers had valid loss data, wintering 466,839 and 381,813 colonies, 3.8% in each case were reported as lost due to queen problems, 9.8% in each case were reported dead/empty after winter, and 0.94% and 0.90% for the European and EU countries, respectively were reported lost due to natural disaster, giving overall loss rates of 14.5% in each case, a little lower than for the overall data set. The rates of loss resulting from queen problems and natural disasters are consistent with those in the previous years of study (Gray et al., Citation2019).
Table 1. Winter 2018/19 survey results, showing number of respondents with valid loss data, corresponding number of colonies going into winter, honey bee colony mortality rate and rates of loss due to queen problems and natural disasters (each with 95% confidence intervals (CIs)).
The overall loss rates for winter 2018/19 vary considerably between countries, as we have found in all of our studies so far (, ). The highest loss rate of 32.0% was in Slovenia, and (as for the previous winter; Gray et al., 2019) the lowest loss rate was in Bulgaria, at 5.8%. Slovenia also had one of the highest loss rates in winter 2017/18. The next highest loss rate for winter 2018/19 was for Serbia, at 25.4%, while the highest ones after that, between 20% and 25%, were for Spain, Croatia, Iran, Greece and Portugal, in descending size of loss rate. In contrast, Serbia had one of the lowest loss rates (7.4%) the previous winter. A relatively high rate of loss (22.1%) over winter 2018/19 was observed in Iran in this first year of its monitoring survey. Over the previous winter of 2017/18, several more countries had loss rates above 25%. Spain has been observed to be consistently among those countries with high winter loss rates, however in the regions with more than a few participating beekeepers this time the loss rates were not especially high, as seen in the map (). Portugal is a more recent participant in these surveys, but seems also to suffer from a high winter loss rate, a finding which may be confirmed in further surveys. Further investigation of the reasons for high losses in Spain, Portugal and Slovenia would be worthwhile. Scotland and Italy had moderately high loss rates (18.9% and 16.5%, respectively) in this survey, but in general the Western European countries had lower loss rates, unlike during the previous winter. As well as for Bulgaria, low loss rates (up to 10%) were also observed for Finland, Israel, Norway, England, Denmark and Wales, mostly Northern countries. The loss rate for France was only slightly above this level, at 10.2%.
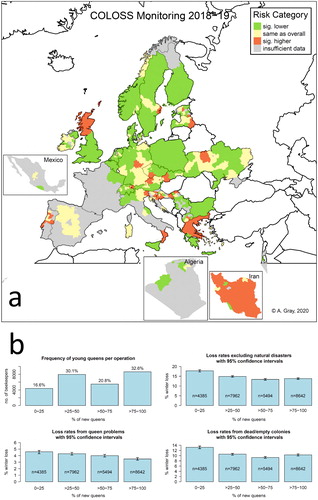
Figure 1. (a) Map with traffic-light colour coding showing relative risk of overwinter colony loss at regional level for participating countries.
Notes: Regions with a relative risk of loss (loss rate divided by the loss rate over all regions) that is significantly higher/lower than 1 are shown in red/green, respectively. Regions with a relative risk not significantly different from 1 are shown in yellow. Where no data were available or data were available from fewer than 6 beekeepers in a region within a participating country, this was treated as insufficient for reliable calculation and the region is shown in grey. Countries not present in the study are indicated in white (blank areas in the map). Information on region was not available for Poland, nor Malta (a small country), which were coloured at country level, as was Bulgaria (as numerous regions were represented but none with more than 5 beekeepers). Island groups/regions are also coloured as one region provided at least 6 responses were available.
(b) Barplots of results for percentage of young queens: distribution of beekeepers across each category of response (top-left), loss rates and 95% confidence intervals for each category of response for total losses excluding natural disasters (top-right), losses from queen problems (bottom-left) and losses from dead/empty colonies (mortality rate; bottom-right). Non-overlapping confidence intervals indicate categories that have significantly different loss rates.
Rates of loss from natural disasters ranged from none in Wales (with a low number of respondents) to 5.7% in Portugal, with the next highest at 3.8% in Iran. In most countries, these rates were below 1% and almost all were below 3%. Portugal also had the highest loss rate due to natural disasters during the previous winter (winter 2017/18); it was even higher that winter in fact, at 10%.
Winter losses due to queen problems varied between 1.3% in Bulgaria (also the lowest in winter 2017/18 at 1.1%) to a rather high 18.1% in Slovenia (also the highest in winter 2017/18 at 20.3%) and Scotland was next highest at 10.9% (compared to 7.9% the previous year). For comparison, in winter 2016/17 this type of loss rate for Slovenia was found to be the lowest observed. Therefore, although overall our studies are finding the loss rate from queen problems relatively constant at 4–5%, there can be great fluctuation in this rate for individual countries from year to year. Apart from losses due to natural disasters, usually rather low, and losses due to queen problems, we also observe losses due to mortality (dead or empty colonies). The lowest mortality rate was for Israel, at 2.1%, and the highest was for Serbia, at 23.9%. Croatia also had a high mortality rate, of 20.4%. The low mortality in Israel may be explained by the fact that most of the participating beekeepers are professionals.
Bulgaria participated for the first time in the survey conducted in spring 2018, and it was observed that the beekeepers participating were professional beekeepers, possibly not typical of the whole beekeeper population. In the survey of spring 2019, reported here, there were only two beekeepers from Bulgaria with small numbers of colonies. This may explain to some extent why the reported loss rates in Bulgaria are all very low, as larger beekeeping operations are known to have lower winter loss rates (e.g., Brodschneider et al., Citation2016, Citation2018; Gray et al., Citation2019; see also below).
The effects of several potential risk factors for winter losses were considered individually, by fitting univariate quasi-binomial generalised linear models (van der Zee et al., 2013). Firstly, on the overall data set we examined the effects of operation size and migration of colonies. In this analysis we did not consider winter losses due to natural disasters, so we modelled the risk of loss arising from a dead/empty colony or from an unresolvable queen problem. For operation size, in which we compared operations with up to 50 colonies, 51–150 colonies and over 150 colonies, we found once more a highly significant effect (p < 0.001), indicating a lower loss rate for beekeeping operations with over 150 colonies. However, the size of this effect was relatively small (loss rates in each group were 15.1%, 15.6% and 14.0%, respectively for smaller to larger numbers of colonies). The effect of migration was also highly significant (p < 0.001), with loss rates of 15.1% and 14.2% for those responding “Yes” and “No,” respectively (and 9.4% for the “Don’t know”s, a relatively small group). The differences between the categories were all significant, so we conclude that the “No” category has lower losses than the “Yes” group. While the results for operation size are consistent with those in Brodschneider et al. (2016, 2018) and Gray et al. (2019), the results for migration do vary from year to year and also between countries. For example, in Gray et al. (2019) those who did migrate their colonies at least once in the season had lower losses overall than those not migrating. This may suggest that the effect of operation size is related to management, while the effect of migration depends on seasonal or local environmental factors.
Additionally, we examine the effect of new queens on colony winter losses. Among other factors, queen vitality has been shown to be closely related to colony health or failure (Akyol et al., Citation2008; vanEngelsdorp et al., Citation2013; Giacobino et al., Citation2016). One of the biological influences is likely to be the age of queen bees going into winter. The percentage of young queens in wintered colonies was found by van der Zee et al. (Citation2014) to be significantly linked to winter loss, as was the extent of queen problems in summer. To examine the effect of queen age, to some extent at least, we consider the percentage of colonies going into winter with a new queen (queens bred in the year before winter, 2018 in this investigation). Beekeepers were asked “How many of the wintered colonies had a new queen in 2018?,” and the percentage of colonies with new queens going into winter was then calculated for each beekeeping operation. The results were filtered to remove “Don’t know” responses and any in which the stated number of new queens was higher than the stated number of colonies going into winter.
Of 28,629 beekeeper responses with valid loss data, 26,483 (92.5%) also had valid data relating to new queens, representing 687,502 colonies wintered. Of these 687,502 colonies going into winter, 377,998 (55.0%) had a new queen. The percentage of new queens was similar for the countries geographically in Europe (56.3%) and for the EU countries (56.0%). These figures reflect the new queens introduced by hive management, although the actual numbers of new queens could be higher as a result of supersedure unrecognised by beekeepers.
For the overall data set, the actual percentage of new queens was used as a covariate in the model to explain the risk of colony loss at operation level, and as the effect of new queens on the risk of colony loss may not be linear, additionally percentage of new queens was categorised into four classes, namely 0–25% inclusive, above 25% and up to 50% inclusive, above 50% and up to 75% inclusive and above 75%, labelled as categories 1, 2, 3 and 4, respectively. This categorical variable was used as a factor in the fitted model for the risk of colony loss. The effect of the latter factor was also considered for each country, in models to explain the risk of colony loss due to dead or empty colonies, and loss due to irresolvable queen problems, and also for both sources of colony loss.
The percentage of new queens varied per operation from 0 to 100%, with a median of 57.1%, and, of the four categories of percentage of young queens, category 4 (above 75%) was most common (8642 beekeepers), followed by category 2 (7962 beekeepers), category 3 (5494 beekeepers) and category 1 (up to 25%) was least common (4385 beekeepers); see also , top-left.
Overall, the risk of colony winter loss decreases as percentage of new queens increases (p < 0.001). For example, estimates (and 95% confidence intervals) for the loss rate for operations with percentages of new queens of 0%, 57.1% (the median value) and 100% are 16.9% (16.4–17.4%), 14.6% (14.4–14.8%) and 13.1% (12.7–13.4%), respectively, and these are all significantly different. Using percentage of new queens as a four-category factor, the effect of the factor on risk of winter loss was also highly significant (p < 0.001), with estimated loss rates of 17.8% (17.2–18.3%) for category 1, 14.9% (14.5–15.3%) for category 2, 13.4% (12.9–13.8%) for category 3 and 13.8% (13.4–14.2%) for category 4. The conclusion is that the loss rate is significantly lower for more than 50% new queens than for above 25% and up to 50% new queens, which in turn is significantly better than for up to 25% new queens (, top-right). The size of the effect of percentage of new queens on the risk of winter loss is larger than for operation size (see above).
Considering losses due to queen problems only (, lower-left), again differences in loss rates are highly significant (p < 0.001), with estimated loss rates of 4.6% (4.3–4.8%), 4.3% (4.1–4.5%), 4.0% (3.8–4.2%) and 3.5% (3.3–3.7%), respectively for categories 1, 2, 3 and 4 of percentage of new queens. We conclude that for queen problem losses, losses are lowest with more than 75% new queens, and losses are lower with above 50% and up to 75% new queens than with 25% or fewer new queens. The effects are small but statistically significant. For losses from dead or empty colonies, differences in loss rates are also highly significant (p < 0.001), with estimated loss rates of 13.2% (12.7–13.7%), 10.6% (10.2–10.9%), 9.3% (9.0–9.7%) and 10.3% (9.9–10.7%) for categories 1, 2, 3 and 4 of new queens, respectively. We conclude that for winter mortality, losses are significantly lower with above 25% new queens. shows these results graphically.
Results per country are shown in . While the findings are not uniform across all countries, in many countries we tend to observe that the estimated loss rate or probability of loss decreases for apiaries with a higher percentage of new queens. However, the differences in the loss rates between the four categories or classes were not always statistically significant. This is likely, in some cases at least, to be due to a limited number of beekeepers in one or more of these classes representing the percentage of new queens in wintered colonies. Where significant results were found, in all three cases (for losses from dead/empty colonies, for losses from queen problems, and for total losses from these causes), lower loss rates mostly correspond to a higher percentage of new queens.
It should be noted that proportions of wintered colonies with a new queen are not strictly comparable between all beekeepers, as beekeeping operations vary considerably in size. However, overall, across many beekeeping operations of varying size we have found that operations with higher percentages of young queens experienced significantly lower loss rates during the winter of 2018/19. The effect is widely observed, for overall winter losses excluding natural disasters, and separately for queen problem losses and for losses from dead/empty colonies. Due to our methodology, it is not possible to say whether the lost colonies are the ones that had the older queens, however our findings suggest that replacing the queen in more than 50% of a beekeeper’s colonies is best. Young queens may be better in colony build-up, due to greater fertility or better health status, often being less likely to contract diseases, and in general producing more healthy bees. Young queens often originate from colony splitting hive management practices or regular queen replacement practice, which may both be an indication of good hive management in general. The finding is in accordance with previous studies, although these did not differentiate between losses related to queen problems and dead colonies (Genersch et al., Citation2010; van der Zee et al., Citation2014). The annual replacement of old queens therefore is a practical recommendation for beekeepers to help improve their colony winter loss rate. Replacing at least half of a beekeeper’s queens each year can be justified from our results. However, this could incur considerable cost in larger-scale beekeeping. The biological mechanisms behind the better survival of colonies with new queens also require scientific study in order to be better understood.
Concerning colony losses, the accuracy of the estimated loss rates depends on the accuracy and representativeness of the data reported by the beekeepers. There are competing influences at work in this regard. Some beekeepers will be more motivated to participate if they feel that their own losses are high or in a season when losses generally are thought to be high, and less interested in participation in other years. Some other beekeepers are motivated when they can report scarce losses and tend to hide higher losses. In some other cases beekeepers experiencing high losses may be concerned that, if they report their true level of losses, they will be identified, even if they are responding anonymously, and may fear that their colonies will be subject to unwanted investigation by extension workers or official bee inspectors. This may be true even when, for reporting purposes, losses for all beekeepers in a region or country are aggregated. In practice we hope that these competing effects balance out. It should be recognised that in this uniquely large long-term international study of colony losses any biases are likely to persist over time, as the methodology used each year is the same. It is therefore important, in order to achieve unbiased results, to continue to work towards a high and representative response from beekeepers in every country conducting this colony loss monitoring.
Acknowledgements
The colony loss monitoring group which carried out this study is a core project of the COLOSS research association (prevention of honey bee colony losses), which supports regular workshops facilitating research discussions and collaboration between group members. COLOSS is supported by the Ricola Foundation – Nature and Culture and Véto-pharma. The authors thank very much all the beekeepers who gave their time to complete the COLOSS questionnaire providing the data for this work, and the additional COLOSS members who contributed to survey organisation, data collection and/or data processing. The authors are also grateful to various national funding sources for their support of some of the monitoring surveys, including, in the Republic of Serbia, MPNTR-RS, through Grant No. III46002, Slovenian Research Program P1-0164, and “Zukunft Biene 2” (grant number 101295/2) in Austria. In Macedonia, the technical support was provided by the MacBee association (www.macbee.mk) and its member Miroljub Golubovski. The authors acknowledge the financial support by the University of Graz for open access.
Disclosure statement
No potential conflict of interest was reported by the authors.
References
- Akyol, E., Yeninar, H., Korkmaz, A., & Çakmak, I. (2008). An observation study on the effects of queen age on some characteristics of honey bee colonies. Italian Journal of Animal Science, 7(1), 19–25. https://doi.org/10.4081/ijas.2008.19
- Brodschneider, R., Gray, A., Adjlane, N., Ballis, A., Brusbardis, V., Charrière, J.-D., Chlebo, R., Coffey, M. F., Dahle, B., de Graaf, D. C., Dražić, M. M., Evans, G., Fedoriak, M., Forsythe, I., Gregorc, A., Grzęda, U., Hetzroni, A., Kauko, L., Kristiansen, P., … Danihlík, J. (2018). Multi-country loss rates of honey bee colonies during winter 2016/2017 from the COLOSS survey. Journal of Apicultural Research, 57(3), 452–457. https://doi.org/10.1080/00218839.2018.1460911
- Brodschneider, R., Gray, A., van der Zee, R., Adjlane, N., Brusbardis, V., Charrière, J.-D., Chlebo, R., Coffey, M. F., Crailsheim, K., Dahle, B., Danihlík, J., Danneels, E., de Graaf, D. C., Dražić, M. M., Fedoriak, M., Forsythe, I., Golubovski, M., Gregorc, A., Grzęda, U., … Woehl, S. (2016). Preliminary analysis of loss rates of honey bee colonies during winter 2015/16 from the COLOSS survey. Journal of Apicultural Research, 55(5), 375–378. https://doi.org/10.1080/00218839.2016.1260240
- Genersch, E., von der Ohe, W., Kaatz, H., Schroeder, A., Otten, C., Büchler, R., Berg, S., Ritter, W., Mühlen, W., Gisder, S., Meixner, M., Liebig, G., & Rosenkranz, P. (2010). The German bee monitoring project: A long term study to understand periodically high winter losses of honey bee colonies. Apidologie, 41(3), 332–352. https://doi.org/10.1051/apido/2010014
- Giacobino, A., Molineri, A., Cagnolo, N. B., Merke, J., Orellano, E., Bertozzi, E., Masciangelo, G., Pietronave, H., Pacini, A., Salto, C., & Signorini, M. (2016). Queen replacement: The key to prevent winter colony losses in Argentina. Journal of Apicultural Research, 55(4), 335–341. https://doi.org/10.1080/00218839.2016.1238595
- Gray, A., Brodschneider, R., Adjlane, N., Ballis, A., Brusbardis, V., Charrière, J.-D., Chlebo, R., F. Coffey, M., Cornelissen, B., Amaro da Costa, C., Csáki, T., Dahle, B., Danihlík, J., Dražić, M. M., Evans, G., Fedoriak, M., Forsythe, I., de Graaf, D., Gregorc, A., … Soroker, V. (2019). Loss rates of honey bee colonies during winter 2017/18 in 36 countries participating in the COLOSS survey, including effects of forage sources. Journal of Apicultural Research, 58(4), 479–485. https://doi.org/10.1080/00218839.2019.1615661
- van der Zee, R., Brodschneider, R., Brusbardis, V., Charrière, J.-D., Chlebo, R., Coffey, M. F., Dahle, B., Drazic, M. M., Kauko, L., Kretavicius, J., Kristiansen, P., Mutinelli, F., Otten, C., Peterson, M., Raudmets, A., Santrac, V., Seppälä, A., Soroker, V., Topolska, G., Vejsnaes, F., & Gray, A. (2014). Results of international standardised beekeeper surveys of colony losses for winter 2012-2013: Analysis of winter loss rates and mixed effects modelling of risk factors for winter loss. Journal of Apicultural Research, 53(1), 19–34. https://doi.org/10.3896/IBRA.1.53.1.02
- van der Zee, R., Gray, A., Holzmann, C., Pisa, L., Brodschneider, R., Chlebo, R., Coffey, M. F., Kence, A., Kristiansen, P., Mutinelli, F., Nguyen, B. K., Noureddine, A., Peterson, M., Soroker, V., Topolska, G., Vejsnaes, F., & Wilkins, S., (2013). Standard survey methods for estimating colony losses and explanatory risk factors in Apis mellifera. In V. Dietemann, J. D., Ellis, & P. Neumann, (Eds.), The COLOSS BEEBOOK, Volume I: Standard methods for Apis mellifera research. Journal of Apicultural Research, 52(4). https://doi.org/10.3896/IBRA.1.52.4.18
- vanEngelsdorp, D., Tarpy, D. R., Lengerich, E. J., & Pettis, J. S. (2013). Idiopathic brood disease syndrome and queen events as precursors of colony mortality in migratory beekeeping operations in the eastern United States. Preventive Veterinary Medicine, 108(2-3), 225–233. https://doi.org/10.1016/j.prevetmed.2012.08.004