
 ?Mathematical formulae have been encoded as MathML and are displayed in this HTML version using MathJax in order to improve their display. Uncheck the box to turn MathJax off. This feature requires Javascript. Click on a formula to zoom.
Abstract
Honey bees have a sting which allows them to inject venomous substances into the body of an opponent or attacker. As the sting originates from a modified ovipositor, it only occurs in the female insect, and this is a defining feature of the bee species that belong to a subclade of the Hymenoptera called Aculeata. There is considerable interest in bee venom research, primarily because of an important subset of the human population who will develop a sometimes life threatening allergic response after a bee sting. However, the use of honey bee venom goes much further, with alleged healing properties in ancient therapies and recent research. The present paper aims to standardize selected methods for honey bee venom research. It covers different methods of venom collection, characterization and storage. Much attention was also addressed to the determination of the biological activity of the venom and its use in the context of biomedical research, more specifically venom allergy. Finally, the procedure for the assignment of new venom allergens has been presented.
Métodos estándar para la investigación del veneno de Apis mellifera
Las abejas melíferas tienen un aguijón que les permite inyectar sustancias venenosas en el cuerpo de un oponente o atacante. El aguijón es un ovipositor modificado que solo se manifiesta en el insecto hembra, siendo este una característica que define a las especies de abejas que pertenecen al subclado de himenópteros llamada Aculeata. Hay un interés considerable en la investigación del veneno de abeja, principalmente debido a que un porcentaje importante de la población humana desarrollará una respuesta alérgica - a veces mortal - a la picadura de abeja. Sin embargo, el uso del veneno de la abeja melífera abarca mucho más, con presuntas propiedades curativas en terapias antiguas e investigaciones recientes. El presente trabajo tiene como objetivo estandarizar métodos seleccionados para la investigación del veneno de las abejas melíferas. Cubre diferentes métodos de recolección, caracterización y almacenamiento de veneno. También se prestó mucha atención a la determinación de la actividad biológica del veneno y su uso en el contexto de la investigación biomédica, más específicamente la alergia al veneno. Finalmente, se ha presentado el procedimiento para la asignación de nuevos alérgenos de veneno.
西方蜜蜂蜂毒研究标准方法
蜜蜂可以使用螫针将毒液注射到对手或攻击者的体内。蛰针起源于改良的产卵器, 因此只存在于雌性昆虫中, 也是膜翅目针尾组昆虫的决定性特征。人们对蜂毒研究有很大的兴趣, 这主要是因为相当一部分人在被蜜蜂蛰到后会产生过敏反应, 严重时会危及生命。然而, 蜂毒的使用不止于此, 在古代疗法和最新的研究中据称具有治愈作用。本文旨在对蜂毒研究中选定的方法进行规范, 涵盖了蜂毒收集、表征和储存的不同方法。蜂毒的生物学活性的测定及其在生物医学研究(更具体讲是蜂毒过敏)中的用途也引起了人们的极大关注。最后, 介绍了给新的蜂毒过敏原定名的流程。
1. Introduction
Honey bees belong to a subclade of Hymenopteran insects called Aculeata, with the defining feature that the ovipositor has been modified into a sting (Moreau, Citation2013). Thus, the apparatus that originally served for egg laying has been modified into a structure that delivers venom. While some of the aculeate species have a predatory lifestyle and use the venom for prey capture purposes, bees shifted to a diet of pollen and nectar and only used their sting for individual defense or defense of the colony. This can be accomplished by killing other insects or by inflicting pain in higher organisms, including humans. Only species that belong to the families Vespidae (wasps), Apidae (bees) and Formicidae (ants) sting humans frequently (de Graaf et al., Citation2009; King & Spangfort, Citation2000). Venom is produced in epidermal glands (venom glands) that are derived from the female accessory reproductive glands and is stored in a venom sac/reservoir until release (Bridges & Owen, Citation1984). The earliest efforts to unravel the composition of honey bee venom date back to the work of Langer in 1897, who found that it consists of active and hemolytic basic components (Zalat et al., Citation1999). Today honey bee worker bee venom is one of the best characterized among the Hymenopteran insects with more than 100 identified proteins and peptides (Ali, Citation2014; Benton & Morse, Citation1968; Dotimas & Hider, Citation1987; van Vaerenbergh et al., Citation2014) and some biogenic amines.
While the toxic activity of Hymenoptera venoms is only of medical importance in case of massive sting events, their allergenic properties are of more important concern for human health. In man, early exposure to bee venom evokes IgG1, IgG2 and to a lesser extent IgG4 antibody responses, whereas long-term exposure often found in beekeepers drives the immunity to an IgG4 type of humoral response (Larché et al., Citation2006; Muller, Citation2005). However, some people develop a venom allergy, which is an IgE-mediated type 1 hypersensitivity of non-atopic origin (de Graaf et al., Citation2009). The treatment of allergic symptoms depends on the severity of the allergic reaction. Large local reactions are treated with topical/systemic corticosteroids and anti-histamines, and by cooling the swollen area. In case of systemic reactions, also auto-injectable adrenaline should be used as emergency medication (Ruëff et al., Citation2011). To provide protection from future stings, venom immunotherapy (VIT) is the only effective and potentially life-saving treatment for patients with the most severe grades of allergy (Müller, Citation1966; von Moos et al., Citation2013). The VIT procedure consists of subcutaneous injections of venom extract in two phases: the incremental and the maintenance dose phase.
Many research papers on honey bee venom are devoted to the diagnosis and therapy of sting allergy. Bee venom has been used as a therapeutic agent in Eastern Asia since at least the second century BC (Yin & Koh, Citation1998). Although still controversial, its use in the so-called meridian therapy receives some attention, for instance in the context of bee venom acupuncture, a kind of herbal acupuncture where extracted and processed bee venom is administered on acupoints for stimulation (Cha et al., Citation2004). In addition, recent studies reported the beneficial role of bee venom in cancer therapy among others (for review see Oršolić, Citation2012). Although the authors of this article wish to distance themselves from any alleged properties of bee venom that are insufficiently substantiated scientifically, we believe that any bee venom research benefits from an improving standardization of methods. The present paper describes standard methods for bee venom collection, determination of its composition and biological activity, the purification of its compounds and its use in the context of venom allergy research.
2. Worker bee venom collection
2.1. Electric stimulation
The main method for bee venom collection is by stimulating bees with an electrical current as first described by Markovic and Mollnar (Citation1954) and thereafter by Palmer (Citation1961) and others (Benton et al., Citation1963; Gunnison, Citation1966; Morse & Benton, Citation1964a; Nobre, Citation1990). All modern and effective devices for collection of bee venom employ this principle. The main benefit of this method is that after the release of bee venom, bees do not lose their sting and stay alive, and are able to operate normally (Morse & Benton, Citation1964b; Palmer, Citation1961). Therefore, this is considered the safest bee venom collection method. The best results in collecting bee venom are obtained in the peak season: summer-autumn. The highest amount of bee venom can be produced during summer – bees’ active season. The next best season for collection is autumn, and the lowest amounts are produced during the spring period.
Devices for bee venom collection have continuously been improved, and according to Bogdanov (Citation2017) they mostly consist of four parts:
Battery of 12–15V and 2 Amp; AC 25V; 1200 Hz powered by, or directly plugged into the power grid;
Electrical impulse generation with frequency from 50 to 1000 Hz, duration of 2–3 sec and pauses of 3–6 sec;
Electrical stimulator – surface that consists of stretched uninsulated wires, at a distance of 3–4 mm from each other;
Glass slide on which the bee venom is secreted.
The electrical stimulator should be designed in such a way that the distance between the active conductors and the glass slide does not allow bees to be stuck or trapped between them. The active wires must be cleaned after the end of each working day – dried bee venom is not electro-conductive and interferes with the device. The efficiency of the device can decrease down to 10% if the wires are not cleaned and maintained. Especially important concerning electrical stimulation are the parameters of the electrical impulses that work on the bees: maximum voltage, pulse width, maximum current that can pass through a bee.
In order to best limit potential damage to bees, the power must be gauged continuously, and limited to a harmless level. The maximum voltage of the pulse needs to be kept in proportion to ensure that it is harmless, and should be maintained at this level through the full device work cycle. The electrical impulses that stimulate bees must be extremely short to avoid irreversible bee health deterioration. It is best if the bee venom collector is able to work autonomously, using a battery power source. Any unnecessary external wiring will needlessly irritate bees.
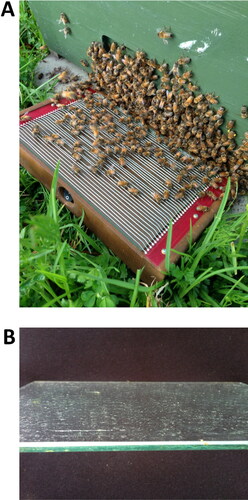
There are two ways to collect bee venom – external and internal, based on where the device is located. When the device is placed inside the hive, the whole colony becomes stressed, work is interrupted, and the temperature inside the hive rises to dangerous levels. This could be very harmful during summer. The less invasive and suggested way of bee venom collection is placing the device outside the hive, by the entrance, which avoids most negative impacts ().
Figure 1. Bee venom collector Beewhisper 5.0 is based on the electric stimulation protocol (http://www.beewhisper.com). In (A) it is shown how the equipment is put in front of the hive entrance. After completion of the collection cycle, the venom that has been deposited on the glass slide (B) can be scraped down.
Bee venom collection has no impact on bees’ survivability during winter. Honey production might be lower by about 10% if bee venom collection is done daily and more than three to four hours per day. Weekly, a break of two to three days should be introduced. The bee venom collected for a period of a few hours of uninterrupted stimulation is less than the amount collected for the same time, but with breaks included. The optimal time for electro-stimulation is 30–60 min, while the optimal break time is 45–90 min. Tests have been conducted during which electro-stimulation has been introduced for a four-hour period, with short one--minute breaks every 30 min, required to collect the venom. The result is that bee venom secretion drops exponentially with time, with the peak being in the first 30 min. In the last 30 min, the amount falls to 10% of the peaks collected. Some brands have an apparatus with a function to automatically power down after, for instance, 45 min.
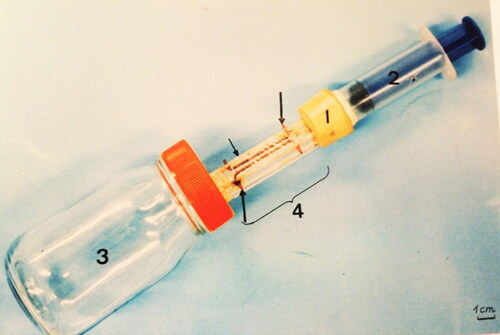
An apparatus for venom collection have been constructed by Abreu et al. (Citation2000) to collect venom from single specimen (). It consists of an acrylic tube with a section area equal to 0.66 cm2. A plastic PVC film replaces its base, in which are arranged two parallel copper wires, leaving between them a space of 0.5 cm. The system is powered by a 12-volt battery. The worker bee is induced to penetrate the acrylic tube and due to lack of space, can just walk through it without flying. At the time that its legs touch simultaneously the two copper wires, it receives an intermittent shock for 10 sec, corresponding to an electrical current of 29 mA. At this current intensity, bees respond by stinging the plastic bottom, without losing their sting apparatus.
Figure 2. Manufactured device used to extract venom from individual honey bees; 1 = cork; 2 = piston; 3 = glass container; 4 = acrylic tube; smaller arrow = plastic; larger arrows = copper wire.
Here we present, by way of example, the operational procedure guidelines of Extract and Box Limited, New Zealand, which commercializes devices for venom collection at the hive entrance.
2.1.1. Equipment sanitization
Wash glass slides (= collection plate) with degreaser dish soap, air dry.
Wipe glass slides and electro-stimulation wires with isopropyl alcohol to sterilize.
2.1.2. Precipitation and temperature check
Do not collect bee venom in the presence of dew or with anticipated rain. Only collect bee venom using the hive entrance placement technique when the ambient temperature is above 12 °C. These parameters are based around the natural tendencies of the hive colony and are established to reduce any harm caused to the colony.
2.1.3. Collection
Place collector at entrance of hive.
Activate collector when guard bees have advanced onto the electro-stimulation wires.
Collect venom by scraping the dried venom (powder) from the glass slide using a sharp scraper.
Remove the plastic wrap from the plates, scrape down the dried venom from the glass using a sharp scraper and weigh the collected venom powder. With the dispatch packaging selection of a 15 ml amber glass bottle you can further reduce light exposure of the venom sample. Within the transfer tank system you can reduce the atmospheric oxygen by displacing the air and create a nitrogen blanket. It is also possible to add further moisture controls by including the placement of a food grade silica sachet in the dispatch bottle while in the transfer packaging process. Remove the bottle from the tank and label it for dispatch. Record in processing, log the date, weight, sites collected from and issue a batch number. Depending on the equipment dimensions, the intensity of the swarm and season, it is possible to collect an average of 1 g per hive in 40 min (e.g., strong swarms, in summer) (Benton et al., Citation1963).
2.2. Reservoir disruption
The reservoir disruption protocol is designed for venom collection at a laboratory scale (Schmidt, Citation1995). It is one of the methods that avoid unwanted processes to occur between venom deposition on the glass plate and the collection as seen in the electric stimulation protocol (drying, oxidation, degradation).
2.2.1. Reservoir dissection
After collection, anesthetize the insects at low temperature (–20 °C) (see the corresponding BEEBOOK chapter; Human et al., 2013) . This will induce bees to go dormant (state of torpor, hibernation-like). According to Wieser (Citation1973) cold temperatures can temporarily immobilize adult honey bees by reducing the amplitude of neuron action potentials.
Keep the insects in petri dishes on ice.
Remove the sting apparatus along with the venom reservoirs by pulling them out of bee bodies with two fine-tipped tweezers as shown in .
Figure 3. Steps of dissection and separation of the venom reservoirs from the sting apparatus. (A) Pull venom reservoir together with sting apparatus out of the bee's body using a fine-tipped tweezers; (B) with the two structures completely removed from the bee’s body, but still stuck together, use two tweezers (or one micro scissors and one tweezers) to separate one from another.
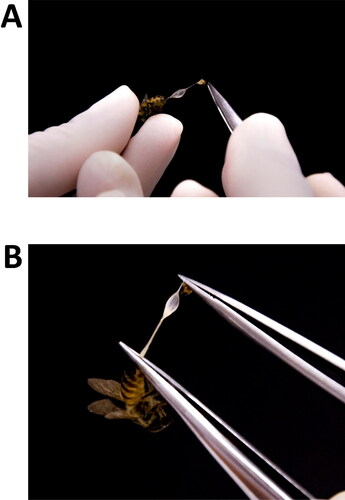
Use the same tweezers to carefully separate the venom reservoirs (or sacs) from the sting apparatus. For a detailed description of the honey bee anatomy please refer to Carreck et al. (Citation2013).
Rinse the reservoirs, still attached with the tweezers, soon after dissection very carefully and quickly in 10 ml to 50 ml of distilled and deionized water at 4 °C to avoid contamination with hemolymph and/or other secretions.
Sequentially dry each one gently (just by a light touch) on a filter paper. At this point, the reservoirs can be lyophilized in an appropriate tube or suspended in distilled and deionized water at 4 °C as described below in section 2.2.2.
Note: Depending on the purpose of the study, after washing and very gentle drying of venom reservoirs in water, they can be suspended in an aqueous solution at 4 °C, containing a cocktail of protease inhibitors (2 mM AEBSF, 0.3 µM aprotinin, 130 µM bestatin, 1 mM EDTA, 14 µM E-64 and 1 µM leupeptin, Sigma-Aldrich) in a proportion of 1:1 (reservoir: solution).
Store the suspended reservoirs (in water or aqueous solution) at –20 °C for short term (up to six months) or lyophilized at –80 °C for extended storage (more than one year).
2.2.2. Reservoir disruption and extract preparation
Using fresh reservoirs:
Suspend the freshly dissected reservoirs (20-60) in a small volume of distilled and deionized water at 4 °C in an Eppendorf tube (1.5 ml).
Macerate them using a micropestle specially designed for microtubes. The ratio of 1:1 (reservoir: solvent), whether or not containing a cocktail of protease inhibitors, is recommended.
Centrifuge the suspensions at 10,000 g for 15 min at 4 °C.
Discard precipitates and transfer supernatants (crude venom extract) to a new microcentrifuge tube. These extracts can be used as source of enzymes, proteins and other venom components.
Using lyophilized reservoirs:
Hydrate lyophilized and frozen reservoirs (at –20 or –80 °C) in the proportion described above (ratio of 1:1; reservoir: solvent).
Macerate with slight pressure using a micropestle to cause disruption.
Thaw with subsequent release of the venom to the suspension.
Proceed with the suspensions in the same way as described for fresh reservoirs.
2.3. Manual milking
Since the introduction of mass spectrometric analysis of bee venom, another sampling technique was introduced: the so-called manual milking (Peiren et al., Citation2005). Because of the extreme sensitivity of the mass spectrometry for determining the composition of the venom (for instance: Fourier transform ion cyclotron resonance mass spectrometry), the researchers wanted to avoid that the wound or the hemolymph proteins or hemocytes that were attached to the external side of the reservoir would contaminate the venom sample (van Vaerenbergh et al., Citation2014).
The procedure is very similar to the reservoir disruption, and is as follows:
Remove the sting apparatus along with the venom reservoirs by pulling them out of bee bodies with two fine-tipped tweezers.
Keep the sting submerged in sample buffer.
Simultaneously, exert pressure on the reservoir by a pinching movement between two fingers (using examination gloves) to push out the venom and to release it through the sting.
The venom is stabilized immediately upon release in sample buffer. The procedure works only with freshly dissected reservoirs and sting apparatus.
2.4. Controlling de novo venom production: reservoir emptying and replenishment
Abreu et al. (Citation2000) conducted a study on the resynthesis process of Apis mellifera venom, during three consecutive summers and two winters. To this study, worker bees at ages of 7, 14, 21, 28, 35 and 40 days, after having received electrical shocks of 29 mA (using the device for venom collection of single specimen; see section 2.1) were confined in varying numbers by age for a period of 0, 24, 48 and 96 hours after shock. Then, their venom glands were dissected for analysis of the venom protein content as well as by morpho-histological techniques. Results showed that compared to control group no change in the histology of the secretory tubules was observed over the 96 hours after the extraction of venom, neither at all ages studied nor during the summer and winter. It was demonstrated that the venom replacement that occurs over a period of 96 hours after extraction is insignificant and independent of the age of the workers as well as of the season, and besides has no association with histological changes of glandular secreting cells.
The procedure of subsequent venom samplings from the same bee specimens is as follows:
Keep brood combs containing workers about to emerge in an incubator at 33 °C for 24 h.
Remove about 600 bees from different colonies for each experiment/season.
Mark the newly emerged bees on the thorax with synthetic enamel Suvinil (see the corresponding BEEBOOK chapter; Human et al., 2013) .
Return the marked bees back to the colony.
Collect the bees at their age of interest. The highest protein content in venom of worker bees is found at the age of 28 or 21 days during summer or winter, respectively (Abreu et al., Citation2000).
Proceed the venom extraction using an extracting apparatus for single specimen at a time (see section 2.1).
Collect bees soon after having received electrical shocks in a glass container that is connected to the acrylic tube (see ).
Transfer the bees from the glass container to a laboratory cage (see the corresponding BEEBOOK chapter; Williams et al., 2013) .
Gradually collect bees in varied number, by age, at the selected time (for instance: 24 and 96 hours) post-shocks from the laboratory cages.
Perform another round of venom collection starting at step 6.
3. Honey bee queen venom collection
Qualitative and quantitative differences have been demonstrated through several studies in venoms of queens, winter and summer workers honey bees (de Abreu et al., Citation2010; Nocelli et al., Citation2007; Owen, Citation1979; Owen & Bridges, Citation1976; Schmidt, Citation1995; van Vaerenbergh et al., Citation2013; Vlasak & Kreil, Citation1984). However, there is only a limited number of papers that describe collection of venom from honey bee queens. The most recent study (Danneels et al., Citation2015) used the same manual milking method as described in section 2.3. as was designed to perform the extreme sensitive nano-liquid chromatography FT-ICR MS/MS approach. For queen venom collection, both reservoir disruption (see section 2.2) and manual milking (see section 2.3) are the methods of choice as they allow individual application.
4. Venom characteristics and composition
Efforts to characterize bee venom or to determine its composition can in itself be a research objective, for example when searching for new sting allergens or components with a biomedical application. It can also be part of a quality control in the production process that strives for a characteristic composition of the product.
The integrity of whole bee venom and of its components is highly dependent on the chosen methodology, care and handling the extract preparation and these in turn are related to the type of research work to be accomplished. Particular care should be taken to prevent possible events of oxidation, proteolysis and precipitation (by denaturation) of the components from venom extract, mainly if more refined analyses as high performance liquid chromatography (HPLC), capillary zone electrophoresis (CZE), mass spectrometry (MS) and microscopic examination will be developed. In all of these cases it is recommended to prepare the venom extract with a cocktail of protease inhibitors (see section 2.2.1) or at least using only one protease inhibitor (e.g., 1 mM PMSF). From our experience (Brochetto-Braga et al., Citation2005) 10% glycerol has proved to be an interesting protective to maintain the enzymatic activities during and after ultrafiltration chromatography gel processes.
Total protein content determination is a primary and essential part of any work involving proteinous secretion, including bee venom. However, the most common methodologies for this, like the Bradford assay and the bicinchoninic acid (BCA) assay, were already well explained in another chapter of the BEEBOOK, to which we would like to refer (Hartfelder et al., Citation2013). The same applies for the methods of proteins separation and detection in polyacrylamide gels using Coomassie Brilliant Blue and silver salts staining (Hartfelder et al., Citation2013). In this section we will focus on two common techniques used to examine the composition of bee venom: high performance liquid chromatography and mass spectrometry. The former is a common separation technique for profiling the venom composition with both analytical and preparative applications. The latter can also be used for profiling but has the advantage of identifying the venom compounds in very low concentrations, even the ones that remained undiscovered.
4.1. High performance liquid chromatography
High performance liquid chromatography (HPLC) is commonly used for separation and identification of most components of honey bee venom. The most important compounds from protein/peptide fraction are: melittin, apamine, MCDP, tertiapin and some enzymes (phospholipase A2 (PLA2), hyaluronidase). Due to the lack of reference materials with certified values of bee venom components it is very difficult to confirm the results obtained. Applying an internal standard is an absolute necessity in order to eliminate the matrix effects and to improve accuracy and precision.
The method is as follows:
Prepare 25 μg/ml cytochrome c solution (internal standard) in deionized water and use it as diluent of all samples.
Prepare the honey bee venom solutions by diluting 3 mg of the product in 10 ml of internal standard solution (see step 1).
Prepare the standard solutions of apamine, mast cell degranulating peptide, PLA2 and melittin by dissolving them in internal standard solution. The solutions will be used for calibration curves construction. The recommended concentrations of standard solutions are as follows (at least six dilutions): apamine – from 2 to 20 µg, mast cell degranulating peptide – from 5 to 30 µg, PLA2 – from 10 to 100 µg, melittin – from 30 to 300 µg. Sonicate all prepared solutions for 5 min and then filter through 0.45-µm membrane filters.
Perform HPLC analysis of prepared standard solutions and honey bee venom solutions.
Use the SynChropack C8 6.5 µm, 4.6 x 100 mm column or the column with the same parameters.
Separation conditions: linear gradient 5% B – 80% B at 30 min (eluent A – 0.1% TFA in water, eluent B – 0.1% TFA in acetonitrile: water (80:20)); flow rate = 1 ml/min, injection volume = 40 µl, separation temperature = 25 °C, λ = 220 nm.
Identify apamine, mast cell degranulating peptide, PLA2 and melittin using their retention times.
Construct the calibration curves for apamine, mast cell degranulating peptide, PLA2 and melittin using corresponding relative peak areas (peak area of an analyte divided by peak area of internal standard).
Calculate the concentrations of analyzed honey bee venom from the standard calibration curves equations.
4.2. Mass spectrometry
For a comprehensive qualitative analysis of the protein content of bee venom, liquid chromatography-mass spectrometry (LC-MS) is the method of choice (de Graaf et al., Citation2009). However, the method is compromised by the large differences in concentration of individual proteins in the venom extracts. In particular, peptides originating from mellittin and the different isoforms of phospholipase C are overly abundant in tryptic digest mixtures performed on bee venom samples. To extend the dynamic range of proteomic analysis, several methods are described to pre-fractionate proteins prior to analysis. Typically, cocktails of antibodies or other affinity reagents are used to remove highly abundant proteins. We here outline the use of a commercially available combinatorial peptide library, which act as an “equalizer”. This peptide library consists of hexapeptides coupled to beads. Saturation results in the removal of surplus abundant protein during the washing steps. Proteins recovered from the beads are separated by SDS-PAGE, cut into peptides and then analyzed via LC-MS. We describe here the use of an FT-ICR-MS mass spectrometer, though the peptide analysis can be performed on any high-resolution mass spectrometer designed for use in proteomic analysis (Orbitrap, Q-TOF). It should be emphasized that by using the peptide library approach, quantitative information on differences in protein abundancy are lost.
4.2.1. Venom sample preparation
Venom of 100–150 honey bee workers is collected as described above (see section 2). The venom is pooled, yielding a protein concentration of +/– 60 mg/ml.
4.2.2. Protein enrichment
For peptide library enrichment, the small-capacity protein enrichment kit (Proteominer, Bio-Rad Laboratories, catalog# 163-3006 and 163-3008) is used. The protocol is based on the manufacturer’s instructions. The kit contains spin columns, collection tubes and washing and collection buffers. We refer to the manufacturer’s instructions for buffer content and safety measures.
Place the spin column in a capless collection tube.
Centrifuge at 1000 g during 60 sec to remove the storage solution.
Discard the collected material, which is the flow-through (storage) solution.
Replace the bottom cap.
Add 200 μl washing buffer.
Replace the top cap.
Manually rotate the column end-to-end for five minutes.
Remove the bottom cap.
Place the column in a capless collection tube.
Centrifuge at 1000 g during 60 sec to remove buffer.
Discard collected material.
Repeat steps 4–11.
Replace the bottom cap on the spin column
Centrifuge the venom extract.
Remove any precipitate.
Pipette 200 μl of venom extract on the column.
Replace the top cap.
Rotate the column on a platform or rotational shaker.
Incubate at RT during two hours.
Remove the bottom cap.
Place the column in a capless collection tube.
Centrifuge at 1000 g for 60 sec.
Recover collected material: this contains unbound protein and might be used for other experiments.
Replace the bottom cap.
Add 200 μl of washing buffer (150 mM NaCl, 10 mM NaH2PO4, pH7) to the column.
Replace the top cap.
Rotate from end to end during five minutes.
Remove the bottom cap.
Place column in a capless collection tube.
Centrifuge at 1000 g for 30 sec.
Discard collected material.
Repeat steps 24–31 three more times.
After all wash buffer has been removed, replace the bottom cap.
Add 200 μl deionized water.
Attach the top cap.
Rotated end to end for one minute.
Remove the cap.
Place column in a capless collection tub.
Centrifuge at 1000 g for 30 sec.
Discard collected material.
Attach the bottom cap to the column.
Add 20 μl of rehydrated elution reagent (8M urea, 2% CHAPS, 5% acetic acid) to the column.
Replace the top cap.
Lightly vortex for five seconds.
Incubate column at RT.
Lightly vortex three times over a period of 15 min.
Remove the cap.
Place in a clean collection tube.
Centrifuge at 1000 g for 60 sec. This elution contains the proteins. Do not discard.
Repeat steps 41–49 two times.
Pool the elutions.
Quantify the protein content using conventional protein concentration analysis methods (Bradford or BCA method as explained in another BEEBOOK chapter; Hartfelder et al., Citation2013).
4.2.3. SDS-page
In this protocol, we describe the use of SDS-PAGE on a 10% SDS-PAGE. When interested in the small proteins < 10 kDa), a Tris-tricine-SDS-PAGE (Schägger & VON Jagow, Citation1987) is preferred.
4.2.3.1. Casting the SDS-PAGE gel
To cast an SDS-PAGE, a commercial casting stand (mini gel format) and frame can be used. Assemble the casting stand and place two glass plates separated by a spacer in the holder. Check for leaks using deionized water.
Prepare the separating gel solution by mixing 3.8 ml deionized water with 3.4 ml acrylamide/bisacrylamide (30%/0.8%w/v), 2.6 ml 1.5 M Tris (pH 8) and 0.1 ml 10% SDS. Mix this solution.
Add 100 μl 10% (w/v) ammoniumpersulfate.
Shake the solution gently.
Add 10 μl TEMED.
Shake gently.
Pipette the solution between the glass plates to approximately 2 cm below the edge of the front plate.
Pipette isopropanol into gap until overflow.
Allow the gel to polymerize 20–30 min.
Meanwhile prepare the stacking gel solution by mixing 3.975 ml deionized water with 0.67 ml acrylamide/bisacrylamide (30%/0.8%w/v), 1.6 ml 0.5 M Tris-HCl (pH 6.8) and 0.05 ml 10% SDS.
Discard the isopropanol.
Add 0.05 ml 10% ammoniumpersulfate to the stacking gel solution.
Shake gently.
Add 0.005 ml TEMED.
Shake gently.
Pipette the solution above the separation gel.
Insert the well-forming comb without trapping air under the teeth.
Wait at least for 20–30 min for gelation.
Store the gel for 2–3 h on RT to allow polymerization to complete. Alternatively, store the gel overnight at 4 °C.
4.2.3.2. Preparation for gel electrophoresis
Take out the comb.
Take the glass plates with the gel out of the casting frame and set them in the cell buffer tank.
Pour running buffer (25 mM Tris-HCl, 200 mM glycine, 0.1% SDS) into the inner chamber and continue after overflow until buffer reaches the required level in the outer chamber.
Prepare 1-ml sample buffer solution containing 10% (w/v) SDS, 10 mM dithiothreitol, 20% (w/v) glycerol, 0.2 M Tris-HCl, pH6.8 and 0.05% (w/v) bromophenolblue. This is a 5x concentrated buffer that should be diluted 5x before use.
Mix 50 μg of eluted proteins from the protein enrichment step with appropriate amount of sample buffer to a total volume of 10 μl.
4.2.3.3. Running the gel electrophoresis
Load this sample into a well, preferably the third or fourth lane. Make sure not to overflow.
Add marker protein solution in the first lane.
Cover the top and connect electrodes.
Set the voltage to 100 V. Continue electrophoresis until the blue bromophenol front reaches the bottom of the gels.
Disassemble the gel cassette and place the gel in a box for washing steps.
4.2.4. Staining and protein modification
Prepare the staining solution: dissolve 70 mg of Coommassie Brilliant Blue G-250 in 1 l of deionized water.
Stir for 2–4 h. Add 3 ml of concentrated HCl (concentrated HCl should be used in a fume hood, wear protective gloves). This solution can be stored in the dark for several weeks.
Wash the gel by adding 100 ml deionized water.
Heat for a few minutes at 50 °C (or 30 sec when using microwave oven).
Place the box with the gel on a shaker for 3–5 min.
Replace the water twice and repeat shaking.
Add Coomassie Brilliant Blue G250 solution to completely cover the gel.
Heat the box in an oven (or in a microwave oven) for 10 sec without boiling.
Place the box on a shaker until visualization of the bands (typically after 15–30 min).
Pour off the staining solution.
Add 50–100 ml double distilled water to destain the background of the gel.
Place the box on a shaker. If necessary, replace with fresh water. Alternatively, 30% methanol solution can be used.
Scan or photograph the gel.
For mass spectrometry analysis, cysteine bridges are preferably reduced and alkylated. Therefore, replace the destaining solution by reducing solution (25mM dithiothreitol/25 mM NH4HCO3).
Place 45 min at 56 °C.
Replace reducing solution by alkylating solution (55 mM iodoacetamide/25 mM NH4HCO3).
Place at RT for 45 min.
Remove the alkylating solution.
Replace by 25 mM NH4HCO3.
4.2.5. Protein digestion
Cut the gel in slices and place them in 0.5 ml Eppendorf tubes. Also gel parts without any visible protein bands are excised.
Wash the residual Coomassie staining with 150 μl of 200 mM NH4HCO3/50% acetonitrile for 30 min at 37 °C.
Dry the gel pieces in a Speedvac.
Add 12 μl of trypsin solution (0.002 μg/μl in 50 mM NH4HCO3). Use sequencing grade trypsin (e.g., modified trypsin from Promega).
Allow the trypsin solution to be absorbed by gel.
Add 25 μl of 50 mM NH4HCO3. Confirm that gel pieces are completely immersed.
Incubate overnight at 37 °C.
Collect the supernatant of each gel piece in a separate Eppendorf tube. This contains mainly hydrophilic peptides.
Extract hydrophobic peptides by two sequential incubation steps (15 min at 30 °C) with, respectively, 60 and 40 μl of 0.1% formic acid/60% acetonitrile.
Pool the extract with the corresponding hydrophilic peptide extract.
Dry the combined extracts in a speedvac.
4.2.6. Liquid chromatography-mass spectrometry
Dissolve the dried peptide extract in 15 μl 2% acetonitrile/0.1% formic acid.
Vortex.
Pipette 5 μl in a HPLC sample vial.
Analyze the sample using a 1–3h gradient using LC-MS. Most laboratories will access such a system via a core facility or specialized laboratory. Interested readers are referred to specialized literature.
4.2.7. Data analyses
The raw LC-MS data file can be processed by the freely available software tool Maxquant for database analysis. Background on the principles underlying such database searching has been covered elsewhere (Cox & Mann, Citation2008). Database searching should be performed against the NCBI protein database selecting A. mellifera as the organism.
5. Storage of venom
According to Krell (Citation1996) – since bee venom is not considered as an official drug or as a food – there are no official quality standards regarding its composition. The quantitative analyses of some of the bee venom components (e.g., melittin dopamine, histamine among others) have been an indirect way of measuring its purity and quality, and these in turn can be strongly affected by the venom storage method. Degradation of the venom components (e.g., by autolysis due to presence of proteases in the whole bee venom) can be avoided by using a drying method such as the low-temperature vacuum freeze-drying. This method can be used in both the venom obtained by electric stimulation (see section 2.1) and the freshly dissected reservoirs (see section 2.2) soon after being collected.
5.1. Short-term storage
Dried venom or venom extracts, obtained from reservoir disruption (see section 2.2) or electric stimulation (see section 2.1), followed by water/buffer resuspension, can be kept refrigerated in a well-sealed dark bottle for a few weeks (Krell, Citation1996). The addition of 10% glycerol proved to be a good strategy to protect enzymatic activities (Brochetto-Braga et al., Citation2005). However, this stability can be improved by the additional use of a cocktail of protease inhibitors as referred to earlier (see section 2.2.1).
5.2. Long-term storage
To extend the storage period (several months), both the dry venom and venom extracts should also be kept in very well sealed amber bottles, but frozen at −80 °C. The integrity of bee venom can be also achieved by lyophilization at low temperatures of the freshly dissected venom reservoirs and their subsequent freezing by up to six months (–20 °C) or years (–80 °C).
6. Determination of the biological activity of venom
6.1. Hyaluronidase activity
Honey bee venom hyaluronidase (Api m2) belongs to the family of glycosyl hydrolases (EC 3.2.1.35). Hyaluronidase (HYASE) is an enzyme capable of the hydrolysis of hyaluronic acid (HA), which is a natural adhesive of interstitial tissue and thus makes it possible to maintain the adhesive properties of cells in a compact structure. Digestion of HA causes increase of the permeability of the tissue and vascular walls, which leads to free diffusion of other allergens and toxic components of the venom. Api m 2 is the second major allergen of honey bee venom (Vetter et al., Citation1999). Approximately half of the population allergic to bee venom has IgE antibodies to hyaluronidase. Due to the similarity of the structure of bee and wasp hyaluronidase, the allergen is a major cause of cross-reactivity of IgE antibodies directed against the venoms of these insects. Because of the high importance of honey bee venom HYASE in allergy practice (venom allergy diagnosis and immunotherapy) and their high prevalence in biological fluids, tissues, venoms and toxins, it is necessary to use standard validated methods for determination of hyaluronidase activity. Several methods for determination of the enzyme activity were developed, based on a variety of techniques, including biological, physicochemical (turbidimetric (Pukrittayakamee et al., Citation1988; Queiroz et al., Citation2008; Morey et al., Citation2006; Magalhaes et al., Citation2008 ) and viscosimetric methods (Vercruysse et al., Citation1995)), chemical (colorimetric method based on Morgan-Elson reaction (Muckenschnabel et al., Citation1998)), fluorescence (Krupa et al., Citation2003; Nakamura et al., Citation1990; Zhang & Mummert, Citation2008), immunoenzymatic (ELISA) (Delpech et al., Citation1987; Stern & Stern, Citation1992), zymographic (Steiner & Cruce, Citation1992), SDS-PAGE (Ikegami-Kawai & Takahashi, Citation2002) and capillary zone electrophoresis (CZE) methods (Matysiak et al., Citation2013; Pattanaargson & Roboz, Citation1996). The literature suggests that turbidimetric and viscosimetric methods used for determining the HYASE activity are well correlated with the pharmacological activity of the enzymes when applied as a spreading factor (Humphrey & Jaques, Citation1953), which is one of the main roles of honey bee venom hyaluronidase. Both turbidimetric and viscosimetric assays are pharmacopoeial methods. In turn, the method based on CZE assay allows not only quantifying HYASE activity but also the monitoring of digestion of HA by HYASE in a wide range of time (from several minutes to several hours or days of digestion). Therefore, only these three methods are described in detail in this paper. helps to select the appropriate method for the determination of hyaluronidase activity.
Table 1. ‘Pros and cons’ to help selecting the appropriate method for the determination of hyaluronidase activity.
6.1.1. Determination of HYASE activity by CZE
The determination of hyaluronidase (HYASE) activity is based on the capillary zone electrophoresis analysis of degradation products of the hyaluronic acid (HA), formed as a result of the activity of HYASE present in an analyzed sample after half an hour of digestion at 37 °C (Matysiak et al., Citation2013). According to the literature (Hofinger et al., Citation2008; Koketsu & Linhardt, Citation2000) the degradation products of HA appear immediately after mixing of HA with hyaluronidase. In order to determine the HYASE activity, it is necessary to build a multiple regression analysis model.
Prepare at least 10 solutions of HYASE of increasing concentrations in acetate buffer (pH 4; 2 mM).
Place the resulting solution in an ultrasonic bath for 10 min.
Filter through 0.45-µm membrane filters.
Prepare a solution of HA (200 μg/g) in the acetate buffer (pH 4; 2 mM).
Mix thoroughly.
Stored at 5 °C HA solution is stable for two weeks.
Pre-incubate solutions of HYASE and solution of HA for 15 min at 37 °C.
Mix HYASE solutions with HA solution in the ratio 1:1.
Incubate half an hour at 37 °C.
Perform electrophoretic analysis of prepared mixtures.
Use 64.5 cm total length, 56 cm effective length, 75 μm ID and 360 μm OD uncoated fused-silica capillary.
Separation conditions: phosphate buffer pH = 8.10; voltage 20 kV; injection 7 sec; λ = 200,00 nm, temperature = 25 °C.
New capillary must be conditioned by rinsing with NaOH (1 M) for 20 min, then with MeOH and NaOH (0.1 M) for 10 min, respectively.
Before every analysis rinse the capillary with NaOH (1 M), MeOH, deionized water and running buffer (50 mM phosphate buffer; pH 8.1) for one minute.
After every analysis wash the capillary with HCl (0.1 M), MeOH and deionized water.
Use peak areas of three main HA degradation products (terta-, hexa- and octasaccharides of HA) as explanatory variables in the multiple regression analysis model.
Analyze solutions of the honey bee venom samples of unknown HYASE activity in the same way as in the analysis of solutions of this enzyme needed to build the multiple regression analysis model.
The regression analysis results in creating an equation of the HYASE activity of the general formula:
6.1.2. Determination of HYASE activity by turbidimetry
The method is based on turbidimetric determination of hyaluronic acid (HA) left intact by hyaluronidase (HYASE). The hexadecyltrimethylammonium bromide (CTAB), a cation surface active reagent, used in this assay stops the enzymatic digestion of HA by HYASE and produces turbidity. The degree of turbidity, developed when CTAB forms insoluble complexes with HA solution, is proportional to the amount of undigested HA in the system.
Prepare a calibration curve performing series of mixtures consisting of 0.5 ml of 200 μg/g HA solution and 0.5 ml solution of bovine testicular HYASE of various activity.
Thoroughly mix the obtained solutions.
Incubate at 20 °C for 10 min.
Add to all solutions 2 ml of 2.5% (w/v) solution of CTAB in 2% (w/v) NaOH solution.
Incubate the mixtures at 20 °C for 15 min.
Measure optical density (OD) at the wavelength of 410 nm against blank (1 ml acetate buffer, pH 4 + 2 ml of CTAB).
Analyze solutions of the honey bee venom samples of unknown HYASE activity in the same way as the solutions needed for calibration curve.
Repeat all the measurements three more times.
Calculate the average activity of the analyzed samples with the standard deviation.
6.1.3. Determination of HYASE activity by viscosimetry
The method compares the hydrolysis rate of hyaluronic acid (HA) with the rate obtained for the reference product (a comparator) using the slope ratio test. The study is performed using a Ubbelohde capillary viscometer, capillary II, with the constant viscometer value of approximately 0.1 mm2/s2.
Prepare the substrate solution dissolving 0.10 g of HA in 20 ml of distilled water.
Mix with phosphate buffer of pH 6.4.
Prepare the reference product solution dissolving an appropriate amount of HYASE in the in distilled water, so as to obtain a solution containing 0.6 IU of hyaluronidase per ml.
Prepare the test solution dissolving an appropriate amount of honey bee venom in distilled water, so as to obtain a solution containing 0.6 ± 0.3 IU hyaluronidase per ml (Hoechstetter, Citation2005).
Incubate at 37 °C.
Mix the test solution with the substrate solution at the time of t1 = 0.
Record the flow time tx of the test solution and substrate solution mixture several times during a period of ∼20 min (Hoechstetter, Citation2005; Stern & Jedrzejas, Citation2006; Zhong et al., Citation1994).
Calculate the viscosity ratio from the following formula:
where: k – viscometer constant in mm2/s2, tx – solution flow time in seconds, 0.6915– kinematic viscosity. Since the enzymatic reaction developed during measurement of the flow time, the actual response time is equal to (t1 + tx)/2. Crossed out is 1/(lnɳr) as a function of reaction time (t1 + tx)/2 in seconds. It results in a linear inter-relationship. Calculate the specific activity of HYASE in international units per milligram using the following formula:
where: Ab, A – the specific activity of HYASE in International Units per milligram for honey bee venom (test solution) and reference product, respectively; bt, br – the slope coefficients for honey bee venom (test solution) and the reference product, respectively.
Perform the measurements three times.
Calculate the average activity of honey bee venom HYASE with the standard deviation.
6.2. Phospholipase A2 activity
Phospholipase A2 (PLA2) (EC 3.1.1.4; phosphatide 2-acylhydrolase) was first identified by Neumann and Habermann (Citation1954) in honey bee venom. Besides being an important (12% by dry weight) component in this venom (Habermann, Citation1972) it is also its most important allergen (Sobotka et al., Citation1976). This enzyme catalyzes the hydrolysis of membrane phospholipids at the sn-2 position yielding lysophospholipids and arachidonic acid (Habermann, Citation1972). There are several methods for measurement of this enzyme activity, some of which are commercialized. The latter will not be described here. helps select the appropriate method for the determination of PLA2 activity.
Table 2. ‘Pros and cons’ to help selecting the appropriate method for the determination of PLA2 activity.
6.2.1. Determination of PLA2 activity by colorimetry
6.2.1.1. Pla2 colorimetric assay - method 1
The following protocol is based on measuring the pH change due to the fatty acids liberation by PLA2 activity. A pH indicator such as phenol red is used to detect these changes (Araújo & Radvanyi, Citation1987).
Set up PLA2 assays as 2.5 ml (including the sample volume) of a mixture containing the following reagents at final concentrations:
4 mM Tris-HCl pH 7.9.
100 mM NaCl.
5 mM CaCl2.2H2O.
0.2 mg/ml phosphatidylcholine dissolved in 50 mM Triton X-100.
0.088 mM phenol red as indicator.
Start reaction from each sample by adding 40 to 80 µg (0.1–0.4 ml) of total venom protein.
Make reaction blanks with no sample.
Incubate all reactions for 5 min at 37 °C.
Read absorbance at 558 nm, against blanks. One unit of activity is defined as the amount of enzyme necessary to hydrolyze 1 µmol of fatty acid/mg of total protein, based on a standard curve of known amounts of phosphatidylcholine versus absorbance at 558 nm performed under the assay conditions.
6.2.1.2. Pla2 colorimetric assay - method 2
A second method was described by Price (Citation2007) and works with inexpensive commercially available substrate for 96-well microplates. To this protocol, excepting the substrate, all reaction reagents can be mixed and stored at 4 °C. The substrate can be prepared in large amounts, aliquoted and stored at −70 °C. A single reaction mixture (total volume: 200 µl) comprises the final concentration of the following:
5 mM Triton X-100.
5 mM phosphatidylcholine (Sigma P5394 phosphatidylcholine (“>60%”), Sigma, St. Louis MO). The stock solution of phosphatidylchloline is prepared by dissolution of 160 mg/ml in methanol, stored at −70 °C, and resuspended at 45 °C immediately before using. The methanol final concentration in the assay mixture is at 5% (v/v).
2 mM HEPES pH 7.5
10 mM calcium chloride.
0.124% (w/v) bromothymol blue dye dissolved in water
Protocol outline:
Dilute samples in cold saline containing 2 mM HEPES at pH 7.5 just before starting assays (performed in triplicate).
Apply to a 96-well microplate 20 μl of each sample or buffer (2 mM HEPES at pH 7.5) as negative control.
Adjust pH and temperature to 7.5 and 37 °C, respectively.
Add 180 μl of the assay mixture.
Analyze plates immediately at 620 nm with a microplate reader apparatus, by reading at 1- min intervals.
Verify the reaction linearity by a linear regression curve using a simple program like MSExcel 2000.
Adjust the reaction rates – absorbance change per minute (averaged of assays performed in triplicate) – in relation to reaction blank.
Report the enzyme activity as: absorbance change per minute x dilution factor x 1000/mg of total protein.
6.2.2. Determination of PLA2 activity by spectrophotometry
This method, described by Jiménez et al. (Citation2003), involves a coupled assay using dilinoleoyl phosphatidylcholine (DL-PC) as substrate and lipoxygenase as the coupling enzyme. It is based on the oxidation by lipoxygenase of the linoleic acid released by the action of PLA2 on the dilinoleoyl phosphatidylcholine. According to Egmond et al. (Citation1976), the oxidation of linoleic acid by lipoxygenase produces the corresponding hydroperoxide derivative (ε234 = 25,000 M−1 cm−1) that can be measured under a continuous and spectrophotometric form by the increasing of absorbance at 234 nm. The limit of sensitivity is approximately 0.4 nmol/ml of the reaction product. The protocol includes the following steps:
Prepare substrate aqueous phosphatidylcholine:
Prepare a stock solution of dilinoleoyl phosphatidylcholine in chloroform at 12.5 mg/ml.
Dry aliquots of this solution under a N2 flow.
Disperse the obtained film to a final concentration of 1.3 mM, in 10 mM deoxycholate dissolved in 50 mM Tris buffer, pH 8.5.
Incubate the substrate solution for 10 min at 25 °C (Reynolds et al., Citation1994).
Assemble, to each assay performed in triplicate, a reaction mixture (1ml) of 50 mM Tris buffer, pH 8.5, containing the following components at final concentration:
3 mM deoxycholate.
65 µM DL-PC.
0.23 µg/ml lipoxygenase.
Start reaction with addition of samples.
Note: The linearity of this assay showed to be between 0 and 0.4 µg/ml to the concentration of the purified hog pancreatic phospholipase A (EC 3.1.1.4; 500 U/mg; Fluka, Spain) (Jiménez et al., Citation2003).
Make negative controls (blanks) without one of the two components in the assay: lipoxygenase or sample containing PLA2.
Incubate at 25 °C.
Note: Since this is a continuous spectrophotometric method, the reaction time can be established for the better response in terms of the absorbance range at 234 nm. For instance, in Jiménez et al. (Citation2003) the spectra analysis obtained for the oxidation by lipoxygenase of the linoleic acid released by the action of PLA2 on dilinoleoyl phosphatidylcholine was performed in the period of 4–20 min.
Measure the increase in absorbance at 234 nm in the assays against reaction blanks.
Report the enzyme activity as the average of the absorbance change for triplicate assays per minute/µg g of total protein.
6.2.3. Determination of PLA2 activity by fluorimetry
This improved assay described by Vivek et al. (Citation2014) is based on fluorescence due to binding of 8- anilino-1-naphthalenesulfonic acid (ANS) to a hydrophobic core (the cationic group of choline head) of substrate 1,2-dimyristoyl-sn-glycero-3-phosphocholine (DMPC). DMPC is a non-fluorogenic and non-chromogenic phospholipid substrate and ANS, a strong anion, is used as an interfacial hydrophobic probe. When ANS binds to substrate, it acts as a fluorescent molecule (Matulis & Lovrien, Citation1998). The ANS-based fluorescence assay follows PLA2 hydrolysis by direct substrate consumption and change to a hydrophilic environment, causing a decrease in relative fluorescence units (RFU).
Protocol steps:
Prepare DMPC substrate (working solution):
1 mM DMPC in methanol containing 2 mM Triton X-100 in Milli-Q water.
Spin substrate solution at 1000 g for 5 min to form uniform mixed micelles.
Prepare quench solution to stop reaction:
50 µM ANS.
2 mM NaN3.
50 mM ethylene glycol tetra acetic acid (EGTA).
Mix for a single reaction (1 ml final volume):
50 mM Tris/HCl buffer pH 7.5.
10 mM CaCl2.
10 µl of substrate (1 mM DMPC and 2 mM Triton X-100).
Pre-incubate this reaction mixture for 5 min at 37 °C.
Start reaction by adding sample ranging from 0 to 50 ng of protein.
Incubate assay for 30 min at 37 °C.
After this time, add 50 µl of quenching solution.
Vortex for 30 sec.
Incubate for 5 min at RT.
Pipette 2 µl of this mixture in a NanoDrop equipment to measure RFU using excitation with ultraviolet (UV) LED (370 ± 10 nm) and emission at 480 nm in dark conditions.
Calculate enzyme activity with the following equation:
(12) Construct LPC standard curve:
Use different LPC concentrations (0–300 µM).
Set up a reaction mixture of 0.1 ml (final volume) containing 50 mM Tris/HCl buffer pH 7.5, 10 mM CaCl2 and different concentrations of LPC.
Add Triton X-100 in the ratio of 1:2.
Incubate for 5 min at RT.
Add 50 µl of quenching solution.
Vortex for 30 sec.
Incubate for 5 min at RT.
Use 2 µl of this reaction mixture to measure RFU as described above.
Note: All reagents used in this assay are stable for up to six months at 4 °C.
6.3. Acid phosphatase activity
Acid phosphatases (AcP) (EC 3.1.3.2.) are a family of enzymes that non-specifically catalyze the hydrolysis of monoesters and anhydrides of phosphoric acid to produce inorganic phosphate at acidic pHs. These enzymes have been found and studied in venoms of ants (Schmidt & Blum, Citation1978), wasps (da Silva et al., Citation2004) ; Hoffman, Citation1977; and bees (Barboni et al., Citation1987; Georgieva et al., Citation2009; Grunwald et al., Citation2006; Hoffman, Citation1977). In honey bee (Apis mellifera) venom, the AcP is denominated Api m 3 and is considered as one of the three most potent venom allergens, together with the PLA2 and hyaluronidase.
The colorimetric assay is the most common, easy and cheapest to measure AcP activity. It has been described by Brochetto-Braga et al. (Citation2005) and runs as follows:
Set up reactions (2 ml final volume each) in triplicate by mixing:
1.9 ml of 5 mM (209 mg/100 ml) p-nitrophenyl sodium phosphate in 10 mM sodium acetate buffer, pH 5.5
0.1. ml of venom samples (7–20 µg of total protein) or only buffer to reaction blanks.
Incubate for one hour at 37 °C.
Stop reactions by adding 1 ml of 1 M NaOH.
Read absorbance at 405 nm against reaction blanks (without enzyme). The reaction product p-nitrophenol is yellow at alkaline pH and its concentration is determined with base on the Lambert-Beer's law, considering its extinction coefficient (ε405 = 16,900 M−1.cm−1).
One unit of activity is defined as the amount of enzyme needed to liberate 1 µmol of p-nitrophenol/mg of total protein, under assay conditions.
6.4. Esterase activity
Esterases (EST) (EC 3.1.1.1) are enzymes capable of hydrolyzing esters into an acid and an alcohol. They constitute a broad group of enzymes that exhibits many differences in relation to their substrate specificity, protein structure, and biological function. In insects, esterase acts extensively on several types of substrates (Turunen & Chippendale, Citation1977) and shows high polymorphism (Matthiensen et al., Citation1993). In Hymenoptera venoms the role of esterase is not known, but according to Schmidt et al. (Citation1986) they may play a role in algogenicity, but not in lethality. Benton (Citation1967) reported for the first time the presence of esterase activity in honey bee venom using α- naphthyl as substrate.
The colorimetric assay using α-naphthylacetate as substrate and FAST Garnet GBC for measuring esterase, provides a very common, easy and cheap method for determining esterase activity in honey bee venom.
Prepare mixture reaction:
1.6 mM α-naphthylacetate in 300 mM phosphate/Na buffer, pH 7.0.
Prepare stop solution:
0.1 mg/ml FAST Garnet GBC dissolved in distilled deionized water.
Set up triplicate reactions for final volume of 2.2 ml using 3-ml disposable plastic cuvettes. Otherwise, the final volume of assays as well as of samples can be reduced to half by using 1.5-ml cuvettes.
Begin pipetting samples (0.2 ml, ∼ 10 µg of total protein) or buffer to blanks, keeping cuvettes on ice.
Start reactions by adding 2 ml of mixture reaction to each cuvette.
Close lids or cover with a piece of plastic film.
Turn cuvettes up and down very gently to homogenize this solution.
Incubate assays immediately at 37 °C for one hour.
Stop reactions by adding 1 ml of 0.1 mg/ml FAST Garnet GBC solution.
Incubate 10 min at RT.
Read absorbance at 490 nm against reaction blanks.
Note: One unit of enzymatic activity is defined as the amount of enzyme needed to hydrolyze 1 µmol of α-naphthylacetate/µg of total protein, under the assay conditions. The amount of the product p-nitrophenol generated (yellow color) is determined by comparison to a standard curve performed with known quantities of this compound. The conversion of read absorbance into µmols of p-nitrophenol generated can be also accomplished considering that each 100 µmol of this compound gives a value of 0.100 at Abs 490 nm, under conditions above established.
6.5. Protease activity
Proteases or proteolytic enzymes are one of the wider and important groups of enzymes. Proteases are a sub-class of the class of hydrolases and are able to hydrolyze peptide bonds from proteins and peptides. They constitute a large family divided into exopeptidases and endopeptidases or proteinases according to the peptide bond position to be cleaved into the polypeptide chain. The serine proteases include two distinct families: those like mammalian serine proteases (chymotrypsin, trypsin and elastase) and that like bacterial subtilisin protease. Although they have an active site and a common enzyme mechanism, they differ in amino acid sequence and three-dimensional structure. In Hymenoptera venom these enzymes have been increasingly studied and characterized, due to their important effects as allergen (de Lima et al., Citation2000;; Hoffman & Jacobson, Citation1996; Winningham et al., Citation2004) and/or on the victim’s hemostatic system by acting on a variety of components of the coagulation cascade (Han et al., Citation2008). helps selecting the appropriate method for the determination of protease activity.
Table 3. ‘Pros and cons’ to help selecting the appropriate method for the determination of protease activity.
6.5.1. Determination of non-specific proteolytic activity
6.5.1.1. Non-specific proteolytic activity assay – method 1
This method described by McDonald and Chen (Citation1965; with few modifications) uses casein.
Reagents:
Substrate solution: 2% casein in 0.1 M glycine-NaOH pH 9.5 buffer. Keep it on ice.
Stop solution: 50% (w/v) trichloroacetic acid (TCA) in distilled and deionized water.
Lowry solutions freshly prepared soon before experiment: mix 2% (w/v) Na2CO3, 10% (w/v) NaOH, Na and K tartrate 2.5% (w/v) and 1% (w/v) CuSO4 in the proportion of 100:10:1:1 (v:v:v:v), respectively.
Folin reagent diluted 1: 1 (v:v) with water.
Procedure:
Assemble triplicate assays and blanks for a final volume of 1 ml, so that they can be made in 1.5-ml microcentrifuge tubes.
Add to each tube 0.5 ml of substrate solution.
Start reactions by adding samples of venom extracts containing about 20 µg of total protein, or buffer for reaction blanks.
Incubate at 37 °C for two hours.
Stop reactions with 100 µl of 50% TCA for each tube. For this step it is possible to let tubes stand overnight at 4 °C to ensure a better precipitation of unreacted sample.
Centrifuge tubes for 10 min at 5000 g.
Remove carefully 900 µl of the supernatant using a micropipette.
Bring supernatant in a new tube (5–10 ml).
Add 4.5 ml of freshly prepared Lowry solution.
Add 0.45 ml of the diluted (1:1) Folin reagent.
Mix well.
Let stand for one hour at RT.
Read absorbance at 700 nm against reactions blank in order to quantify the content of free amino acid and released peptides by proteinase action.
One unit of proteolytic activity is defined as the quantity of liberated amino acids per microgram of total protein under the assay conditions using a standard tryptophane curve as reference. Otherwise, one unit of protease activity can be defined as the amount of enzyme required to produce an increase of 0.1 in optical density at 700 nm under the defined conditions.
6.5.1.2. Non-specific proteolytic activity assay – method 2
This is a non-specific proteolytic activity assayed with a chromogenic substrate as described by Schmidt et al. (Citation1986) for Hymenoptera venoms. Azocoll, the Azo dye-impregnated collagen (Sigma) is used as a chromogenic non-specific substrate for protease activity. Upon proteolysis, soluble peptide fragments which are purple in color due to Azo dye impregnation, are released and can be detected by absorbance at 550 nm (Jiang et al., Citation2007).
For assaying Hymenoptera venom proteinases we recommend the method described by Schmidt et al. (Citation1986) that runs as follows:
Triplicate reactions are made in 2.5 ml final volume consisting of:
Venom samples (50 µg maximum).
12 mg azocoll (Calbiochem) dissolved in 2.5 ml of 0.1 M buffer (4.8 mg substrate/ml of buffer). As the pH-optimum of the venom proteases may differ, it is recommended to run the test in different pH ranges by using these different buffers: 0.1 M phosphate/Na pH 7.0; 0.1 N glycine/NaOH pH 9.2 and 0.1 N acetate/NaOH pH 4.0.
Note: In order to perform assays in 2.5 ml final volume it is better to prepare a more concentrated azocoll stock solution (e.g., 5 mg/ml). Thus, less volume of this substrate solution and sample can be used (2.4 ml and 0.1 ml, respectively, in this example).
Incubate reactions (in triplicate) and blanks (without enzyme) at 37 °C for two hours.
Note: Due to non-homogeneity of the substrate solutions, the tubes or microplates containing the reaction mixtures should be shaken throughout the incubation time to ensure maximum enzyme contact with the substrate.
Then filter each solution rapidly.
Read absorbance read at 520 nm against reactions blank.
Considering the use of the enzyme Trypsin (EC 3.4.21.4; Sigma) as reference, 1 U of protease activity is determined as units of trypsin activity by comparison with the reference.
6.5.2. Determination of serine protease activity
This method uses fluorogenic substrate for serine proteinases, bis(N-benzyloxycarbonyl-L-argininamido) rhodamine [(Cbz-Arg-NH)2-rhodamine] as described by Leytus et al. (Citation1983):
Perform protease assays with (Cbz-Arg-NH)2-Rhodamine and 7-(N-Cbz-L-argininamido)-4-methylcoumarin at 22 °C in 10 mM Hepes buffer, pH 7.5, containing 10% (v/v) dimethyl sulfoxide.
Dilute stock solutions of substrates and of enzymes into the 10 mM Hepes buffer, pH 7.5, before the assay.
Note: For all assays, the enzyme concentration (or sample total protein) should be chosen so that less than 5% of the substrate will be hydrolyzed.
Mix 0.01 ml of enzyme solution with 0.04 ml of substrate solution at the bottom of a disposable plastic cuvette.
Leave to react for 5 min.
Add 0.95 ml of 10-mM Hepes buffer, pH 7.5, containing 15% (v/v) ethanol.
Record the fluorescence immediately with a fluorescence spectrophotometer equipped with a universal digital readout.
Note: The excitation and emission wavelengths for (Cbz-Arg-NH)2-Rhodamine are 492 nm and 523 nm, respectively, both set with a bandwidth of 4 nm (Leytus et al., Citation1983). According to these authors the fluorescence spectrophotometer should be standardized with a polymethacrylate block in which are embedded Rhodamine B to ensure that the relative fluorescence is comparable in different experiments. The excitation and emission wavelengths for 7-(N-Cbz-L-argininamido)-4-methylcoumarin are 380 nm and 460 nm, respectively (Zimmerman et al., Citation1976; Citation1977), both set with a bandwidth of 4 nm.
Convert relative fluorescence units into molar concentrations of Cbz-Arg-NH-Rhodamine or 7-amino-4-methylcoumarin produced by using standard curves correlating fluorescence with molar concentrations of either Cbz- Arg-NH-Rhodamine or 7-amino-4-methylcoumarin in 10 mM Hepes buffer, pH 7.5, containing 15% (v/v) ethanol.
7. Biomedical research – venom allergy
For most people Hymenopteran stings result in a transient and cumbersome local inflammatory response characterized by a painful, sometimes itchy, local wheal rarely exceeding 2 cm in diameter, surrounded by a swelling of the subcutaneous tissue. However, mass envenomation can be life-threatening and fatal. Besides these toxic reactions, Hymenoptera venom may also trigger hypersensitivity (allergic) reactions.
The routine diagnosis and treatment of venom allergy fall out of the scope of this BEEBOOK chapter. However, thanks to new mass spectrometric approaches (see section 4.2) our understanding of the bee venom composition has improved significantly in the past decades, which in turn has given a new dynamic to the biomedical research on bee venom allergens. As the identification of novel allergens among the newly discovered bee venom compounds demands a standardization of the methodology used, it is also covered in this BEEBOOK chapter. We have selected two antibody detection tests and two procedures of the basophil activation technique that are commonly used in this type of biomedical research. In addition, the procedure for the assignment of new allergens will be explained (section 7.3).
Since working with patients and human blood samples is subject to specific legislation and regulations, in particular with respect to ethics, privacy and bio-safety, the standard methods presented here below are intended only for appropriately trained researchers working in licensed institutions. We recommend that investigators who wish to enter this type of research inquire in advance with the competent authorities about the specific circumstances applicable in their country.
7.1. Antibody detection test
Several tests for venom-specific antibody detection exist. Most commonly used are the measurement of venom-specific IgE antibodies (by enzyme-linked immunosorbent assay or Western blotting) and the intradermal venom skin test; the latter will not be covered in this BEEBOOK chapter as it is an in vivo test procedure. We will focus only on the enzyme-linked immunosorbent assay (ELISA) and the Western blotting, which are often used in the context of allergen research. The ELISA is a plate-based assay technique designed for detecting and quantifying immunogenic substances, whereas the Western blotting is an analytical technique in which the antibody binding is preceded by a separation of the proteins by gel electrophoresis.
7.1.1. Enzyme-linked immunosorbent assay
Coat Nunc MaxiSorp® flat bottom 96-well plates with 150 μl of honey bee venom (2 μg/ml, Sigma-Aldrich) in coating buffer (100 mM bicarbonate/carbonate buffer, pH 9.6) at 4 °C overnight.
Wash three times with Phosphate Buffered Saline, pH 7.4 with 0.05% Tween-20 (PBST).
Block with 50 mg/ml skimmed milk powder in PBS at RT for two hours.
Wash three times.
Perform for each serum sample a two-fold dilution series from 1:40 to 1:20480 using blocking buffer.
Incubate plates for 45 min at 37 °C.
Wash three times.
Incubate plates for 1 h at 37 °C with 150 μl of HRP-conjugated mouse anti-human antibodies (IgE or IgG4; depending on the purpose; Southern Biotech) at the dilution prescribed by the manufacturer.
Wash three times.
Add 200 μl of substrate solution (SIGMAGAST OPD, Sigma-Aldrich) to each well.
After 30 min, stop the reaction with 100 μl of stop solution (3M HCl).
Read the plates at 490 nm.
Define antibody titer as the highest dilution with a reading above the mean of the negative controls plus 1.96 SDs.
7.1.2. Western blotting
Load 12-µg proteins on a 15% SDS-PAGE gel under reducing and denaturing conditions in a discontinuous system, along with molecular weight markers (Bio-Rad).
Finish the run when the dye-front reaches the end of the gel.
Assemble the transfer sandwich and make sure no air bubbles are trapped in the sandwich. The blot membrane (polyvilylidene difluoride membrane) should be on the cathode and the gel on the anode.
Transfer the protein bands to the blot membrane in a cold-room at a constant current of 10 mA (wet transfer) or 1 A (semi-dry).
Stain the blot membrane with Ponceau S solution by simple immersion.
Wash until the protein bands are visible (if no bands appear the blotting failed).
Cut the membrane into strips.
Block with 50 mg/ml skimmed milk powder in PBS at RT for two hours.
Add 2 ml of diluted serum (1/16 diluted in blocking solution).
Incubate overnight at 4 °C.
Wash three times with blocking solution.
Incubate in 2 ml of HRP-conjugated mouse anti-human antibodies (IgE or IgG4; depending on the purpose; Southern Biotech) at the dilution prescribed by the manufacturer.
Wash three times with PBST.
Wash once with PBS.
Dissolve 3,3'-diaminobenzidine tetrahydrochloride (DAB) in 50 mM Tris, pH 7.2 at 1 mg/ml.
Immediately before use, add an equal volume of 0.02% hydrogen peroxide.
Immerse the blot membrane in the DAB staining solution until the desired development is achieved. Typical incubations are from 5 to 15 min.
7.2. Basophil activation test
Upon challenge with antigen (bee venom) of peripheral basophils of bee venom allergic patients, cross-linking of bee venom-specific IgE antibodies bound to IgE receptors (FcεRI) will activate the cells. As a consequence, expression of specific membrane markers will up-regulate and histamine (and other mediators) will be released. These membrane changes and release of histamine can easily be measured on individual basophils by flow cytometry (Bridts et al., Citation2014).
Basophils represent about 1% of the white blood cells. Immunophenotyping can be done with different markers including FcεRI, IL-3 receptor (CD123) in combination with HLA-DR, CD203c and staining of IgE bound to FcεRI (Eberlein et al., Citation2014). CD203c is the only basophil lineage marker and in combination with IgE these are the best markers to define basophils as CD203c+/IgE+. However, the CD203c density on the cell surface can be too low to differentiate cells.
Once activated, CD63 is the most useful activation marker besides CD107a and CD203c, which also up-regulate after activation. This activation cannot only be measured with membrane markers, but also with intracellular markers like phosphorylated proteins (Verweij et al., Citation2010; Citation2012) or quantification of the intracellular histamine content (Sabato et al., Citation2015).
Basophils of about 5–10% of the patients will not respond to a positive control like anti-IgE or anti-FcεRI. One can decide to stimulate with the allergen alone, which will cause basophil activation only if the patient is bee venom allergic. Nevertheless, if the allergen also gives a negative response, the procedure has to be stopped as it will yield a false negative response and results will be inconclusive.
7.2.1. Reagents
Wear gloves, lab coat, and safety glasses while handling all human blood or chemical products. Dispose of all pipettes, etc. into bagged waste collection bins. Wipe work surfaces with disinfectant before and after running tests.
7.2.1.1. Washing buffer (must be prepared sterile before use)
Prepare 20 ml washing buffer with 17 ml pure water Milli Q, 1.9 ml 10x concentrated Hank’s balanced salt solution with Ca2+ Mg2+ (HBSS: ThermoFisher Scientific: Invitrogen), 0.6 ml 7.5% NaHCO3 and 0.4 ml Hepes (1 M) (ThermoFisher Scientific: Invitrogen). Set to pH 7.4.
7.2.1.2. Lysing/fixing solution
Prepare a lysing and fixing solution by diluting 5x concentrated Lyse/Fix buffer (Becton-Dickinson cat. 558049) with pure water. Store at RT.
BD Phosflow Lyse/Fix buffer (5x concentrate: BD Biosciences catalogue #558049) is used to lyse and fix whole blood for use with intracellular staining techniques. Store at RT.
Dilute 1/5 just before use in H2O.
7.2.1.3. Phosphate buffered saline
Prepare phosphate buffered saline (PBS) by diluting 10x concentrated PBS without Ca2+ or Mg2+ (ThermoFisher Scientific: InVitrogen) with pure water. Measure pH = 7.4.
PBS is the basis of different other phosphate buffered saline solutions:
PBS-EDTA: Add 10 mM Na2EDTA to PBS (see above), pH 7.4
PBS-NaN3: Add 0.5 g/l NaN3 to PBS, pH = 7.4 (store at RT)
PBS-0.1%BSA: Mix 50 ml PBS with 0.666 ml BSA (Albumin Bovine Fraction V 7.5%; Sigma 84112), pH 7.4.
PBS-TX100: Add 0.1 ml pure Triton X-100 (Sigma-Aldrich catalogue # T8787) to 100 ml PBS, pH 7.4 (Store at RT). This solution is needed for permeabilization of the cells.
7.2.1.4. Antibodies
The following antibodies (labelled or not) can be used to activate cells or to detect membrane or intracellular markers depending on the technique. The concentrations are indicative and must be titrated before use (McLaughlin et al., Citation2008). This can be done by using different dilutions of the antibody and, using the correct flow cytometric settings, looking for the most optimal resolution in comparison with an FMO (Fluorescence Minus One) measurement as a control (Roederer, Citation2002).
CD63 is a 53 kDa Type III lysosomal protein and is expressed on the cell membrane of activated basophils. PE or FITC mouse anti-human CD63 (BD Biosciences) 20 µl per test, store at 4 °C
Mouse anti-human IgE (clone G7-18: BD Biosciences Pharmingen 35171D) is used to stimulate basophils as a positive control. Stock solution at 0.5 mg/ml. Dilute to a working solution of 10 µg/ml in HBSS with Ca++ and Mg++. Make other dilutions to construct a dose response curve.
CD203c is a type II transmembrane glycoprotein of the E-NPP family of ectoenzymes and is expressed on basophils and mast cells. CD203c is used as a basophil marker and as basophil activation marker in flow cytometric techniques. Five µl CD203c-APC (clone NP4D6: BD Biosciences) is added to 100 µl peripheral blood.
Anti-human IgE Alexa Fluor488 (algE-AF488) or mouse monoclonal anti-human IgE (clone GE-1) is used as a marker for IgE bound to the FcεRI and hence as a basophil marker together with CD203c. This clone is only available as a non-labelled antibody and must be conjugated with a fluorochrome such as Alexa Fluor. The labelling procedure is as follows:
Prepare the following solutions:
A working solution of mouse monoclonal anti-human IgE (clone GE-1,Sigma I 6510) of 5 mg/ml in NaHCO3 (0.1 M), pH= 8.3.
Prepare AlexaFluor 488 succinimidyl ester (Alexa Fluor 488 NHS: ThermoFisher Scientific, Molecular Probes A20000) according to manufacturer’s procedure. Note that stock solutions can be stored at –20 °C for maximum three months. Once reconstituted in DMSO, the solution becomes unstable and must be used immediately.
The working solution contains 1 mg in 0.1 ml dimethylsulfoxide (DMSO) and must be freshly prepared.
Mix 2 ml anti-IgE (working solution) slowly with 0.1 ml AlexaFluor 488 NHS (working solution) during one hour at RT in the dark.
Mix regularly.
Dialyse overnight with PBS at 4 °C or use a gel filtration column like Sephadex G-25 to separate conjugated antibody from free dye.
Add 0.05% NaN3.
Store at 2–8 °C.
Note: labels of antibodies can be changed, depending on the technique or flow cytometer. New labels/antibodies must be titrated and or validated in the technique used.
7.2.1.5. Diamine oxidase
Diamine oxidase (DAO) is an enzyme involved in the metabolisation of histamine (histaminase). DAO can be labelled with a fluorochrome to detect histamine in fixed and permeabilized cells like basophils and mast cells in a so-called enzyme affinity technique (Ebo et al., Citation2012). DAO-PE or DAO-V500 (BD Biosciences) must be diluted in PBS-EDTA. Every new solution must be titrated.
Diamine oxidase or histaminase (Sigma-Aldrich catalogue # D7876) has been conjugated with phycoerythrine (PE) or Horizon V500 at the laboratories of BD Biosciences.
A working solution 1:1 (DAO-PE) or 1:20 (DAO-V500) was made in PBS/EDTA. Every new batch should be titrated and measured with a flow cytometer in order to find the optimal staining concentration for intracellular histamine.
7.2.1.6. Calibration particles
Rainbow Calibration Particles 6 peaks (BD Biosciences catalogue # 556286) or 8 peaks (# 559123).
Store undiluted at 4 °C in the dark.
Mix well before use.
Dilute 3–5 drops in 1 ml buffer.
Use immediately.
Analyze according to the manufacturer’s procedure.
7.2.1.7. Allergens
Allergens can be protein extracts, recombinant proteins, chemicals or drugs (Peiren et al., Citation2006). They must be water soluble and used in non-toxic concentrations for basophils. To test toxicity, incubate basophils with different concentrations of the allergen or mouse monoclonal anti-human IgE (positive control) during 20 min at 37 °C and measure viability using propidium iodide or Live/Dead© viability/Cytotoxicity Kit for mammalian cells (ThermoFisher Scientific: Molecular Probes).
Do not use the available preparations for skin testing. These solutions contain preservatives which can inhibit basophil activation in vitro. The optimal stimulation concentration of an allergen to activate basophils must be determined in a dose response curve with well-defined patients positive to the antigen and stung controls negative without any reaction to bee allergen. Because such a response can result in a bell shape curve, in routine practice at least two concentrations should be used to define a positive result.
Bee venom can be obtained by ALK-Abello, Denmark as a lyophilized allergenic venom extract.
7.2.2. Equipment
A flow cytometer capable of measuring the available fluorochromes (installation and setup is beyond the scope of this chapter) and a warm water bath (WWB) at 37 °C are needed.
7.2.3. Sample
Although different BAT techniques are described using EDTA or even ACD or citrated blood, the best results are obtained with heparinized blood as basophil activation is calcium dependent and chelators or calcium binding products can have deleterious effect on test results.
Anti-histamines have no influence on basophil activation tests in contrast to corticoids, immune-suppressive drugs or statins.
As a sample, about 10 ml heparinized blood must be available. To obtain reproducible results, basophil activation must be executed within three to four hours after sample collection.
7.2.4. Procedure
7.2.4.1. Basophil activation technique as measured by membrane markers – method 1
All procedures must be carried out at RT and in a laminar air flow cabinet, to avoid contamination of aerogenic allergens, unless otherwise specified.
To exclude so-called non-responders, i.e., samples non-reactive to anti-IgE or allergen stimulation, available basophils are stimulated to control their reactivity.
Incubate 100 µl blood with 100 µl HBSS buffer as a negative control and anti-IgE as a positive control during 20 min at 37 °C.
Stain with aIgE-AF488 and CD203c-APC using the procedure described below and read on a flow cytometer.
When basophils do not react one can decide to stimulate with two concentrations of the allergen to exclude non-reactivity to anti-IgE.
Allergen procedure
Pre-warm all blood samples, buffers and allergens before mixing during 15 min at 37 °C in WWB.
Notes: Basophil activation results in an immediate response (within 1 min) and lasts about 20–30 min at maximum response. Prewarming all solutions at 37 °C will ensure the highest reproducibility.
Add 100 µl allergen solution to the allergen incubation tubes and buffer (HBSS) or positive control (anti-IgE) to control tubes. When needed make dilutions of the allergen to construct doses-response curves.
Add to all tubes 100 µl pre-warmed whole blood and incubate during 20 min at 37 °C in WWB.
Stop reaction by adding 1 ml PBS-EDTA.
Spin at 200 g for 10 min at 4 °C, set the brake of the centrifuge off.
Remove supernatant.
Add 20 µL aIgE-AF488, 10 µl anti-CD63-PE.
Add 5 µl anti-CD203c-APC.
Incubate on ice or at 2–8 °C for 20 min in the dark.
Lyse the red blood cells by adding 2 ml lysis solution.
Incubate for 20 min at RT.
Spin for 10 min at 250 g, RT.
Remove supernatant.
Wash by adding 2 ml PBS-EDTA.
Spin again for 10 min 250 g at RT.
Remove supernatant.
Add 300 µl PBS-NaN3
Count at least 500 basophils by flow cytometry which are defined or gated out as IgE + and CD203c+.
Store all list data before analysis with available flow cytometric software.
Define CD203c + CD63-, CD203c++CD63- and CD203c++CD63+ populations () by following the instructions of the flow cytometric software package.
Figure 4. An example of a basophil activation test in a bee venom allergic patient. In panel A single cells are isolated from cell aggregates in a forward scatter plot FCS-H (height) versus FCS-A (area). In B, High IgE positive basophils are selected and analyzed in panel C for their positivity in CD203c (basophil specific). Cells stimulated with buffer (D) and anti-IgE (F) are analyzed as a negative and positive control, respectively. CD203c++ denotes activated basophils, CD203c++CD63+ denotes degranulating cells. In panels F-I cells stimulated with bee venom (F and G) or wasp venom (H and I) are analyzed. It shows clearly a positive dose dependent reaction to bee venom and not wasp venom as expressed by the higher proportion of CD203C++CD63+ degranulating cells.
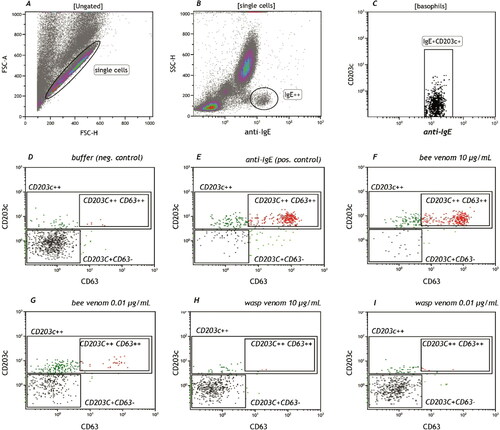
7.2.4.2. Basophil activation with intracellular staining of histamine (HistaFlow®) – method 2
All procedures are carried out at RT, in a laminar air flow cabinet when necessary, or unless otherwise specified. The procedure is almost identical to that in method 1.
Allergen procedure
Pre-warm all blood samples, buffers and allergens before mixing during 15 min at 37 °C in WWB.
Add 100 µl allergen solution to the allergen incubation tubes and buffer (HBSS) or positive control (anti-IgE) to control tubes. When needed make dilutions of the allergen to construct dose response curves.
Add to all tubes 100 µl pre-warmed whole blood and incubate during 20 min at 37 °C in WWB.
Stop reaction by adding 1 ml PBS-EDTA.
Spin at 200 g for 10 min at 4 °C, set the brake of the centrifuge off.
Remove supernatant.
Add 20 µl aIgE-AF488, 10 µl anti-CD63-PE.
Add 5 µl aCD203c-APC.
Incubate on ice or at 2–8 °C for 20 min in the dark.
Add 2 ml Phosflow Lyse/Fix work solution.
Incubate at 37 °C in WWB for 20 min.
Spin for 10 min at 500 g on RT.
Remove supernatant.
Add 2 ml 0.1% PBS-TX100.
Spin again for 10 min at 500 g at RT.
Remove supernatant.
Add 100 µl 0.1% PBS-TX100 and 10 to 40 µl (depending on titration) DAO-V500.
Stain for 45 min at 37 °C in WWB. Mix several times during stain procedure.
Add 2 ml PBS.
Spin at 500 g for 10 min at RT.
Remove supernatant.
Add 0.5 ml PBS-NaN3
Count at least 1000 basophils by flow cytometry which are defined as IgE + and CD203c+.
Store data in a FCS formatted file, which can be analyzed with flow cytometric software.
Prepare incubation tubes.
Add 200 µl allergen solution to the allergen tubes. Dilutions depend on the allergen used.
Use BAT buffer as a negative control or for FMO evaluation. Define CD203chi+CD63- basophils and CD203chi+CD63hi+ as activate basophil populations.
Define histamine content using the compensation setting described below. This setting must be unique for every sample. is an example of HistaFlow® analysis of basophils stimulated with bee venom in a bee venom allergic patient.
Figure 5. Basophils selected as in panels A-C in , were analyzed for their histamine content or DAO positivity. A and B are the necessary negative and positive controls. C-F is an example of a dose response curve in a bee venom allergic patient showing clearly that DAO positive cells (DAOpos) becoming CD63+ (x-axis) and start to release histamine (DAOrel). The dotted line is the difference between histamine positive and histamine releasing cells.
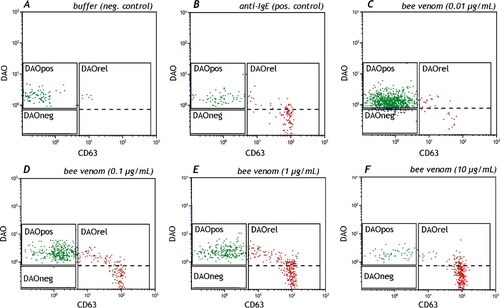
Figure 6. This figure shows the correct compensation setting as describe in . A is undercompensated, C is overcompensated and B shows the correct compensation setting.
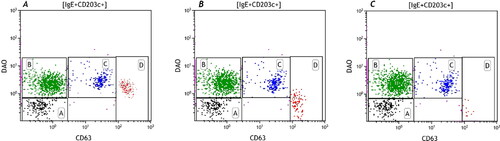
Compensation procedure
A functional assay like the HistaFlow® technique (Ebo et al., Citation2012) needs an optimal setting for measurement of histamine release. Also, we must be aware that not all basophils contain/release the same amount of histamine, hence different cell populations can be observed. By mixing the data of the four tubes in the compensation setting (Roederer, Citation2002) of the HistaFlow® technique (see ), a correct setting can be obtained. The first tube is without staining for DAO/CD63. These are the histamine negative basophils. The second tube is DAO staining alone. These are the DAO (or histamine) positive basophils. The third tube is special: DAO as well as CD63 staining AFTER fixation and WITHOUT stimulation: this will give us the optimal staining for all populations. The fourth tube is DAO and CD63 after activation (just like a positive control): This tube gives us the possibility to optimize the compensation setting (under an optimal PMT setting). By fine tuning we observe the different histamine releasing basophil populations. After running the staining procedure for each tube, we can mix them and find out the optimal setting or we measure every single tube and combine the data in one data-file using appropriate software. After analysis tubes of the same patient are evaluated with this setting. Be aware to repeat this for every patient, because the histamine content is different in every patient.
Table 4. Compensation method.
7.3. Assignment of new allergens
The IUIS Allergen Nomenclature Sub-Committee, under the auspices of the World Health Organization (WHO) and the International Union of Immunological Societies (IUIS), has devised a unified nomenclature system for purified allergens (King et al., Citation1994; Marsh et al., Citation1986; Radauer et al., Citation2014). They are phenotypically designated by the first three letters of the genus followed by a space, the first letter of the species, another space, and finally an Arabic number. Accordingly, allergens of the honey bee Apis mellifera are all named Api m x (x stands for the consecutive number).
To assign a new allergen:
Go to the homepage of the IUIS Allergen Nomenclature Sub-Committee at http://www.allergen.org and download the New Allergen Submission Form (MS Word format).
Enter the personal data of the submitter of the new allergen.
Enter the scientific name (genus and species), the family and the order of the allergen source. Thereby refer to the taxonomic system used within the UniProt (www.uniprot.org/taxonomy/) and NCBI (www.ncbi.nlm.nih.gov/sites/entrez?db=taxonomy) databases. Additionally, the common name of the allergen source can be included. For the honey bee Apis mellifera the taxonomic data should be entered as follows: Apis mellifera, Apidae, Hymenoptera.
Propose an allergen name consisting of three letters of the genus (Api for Apis), one letter of the species (e.g., m for mellifera or c for cerana) and an allergen number. Justifications for numbering can be the next available number or the existence of a homologous allergen with the same number in another species. Additionally, propose an isoallergen and a variant number. If the allergen is a new allergen in the source the isoallergen number (two digits) is 01, if the allergen is the first isoallergen to an existing allergen in the source the isoallergen number is 02 and so on. Isoallergens show a similar molecular size, identical biological function (if known) and an amino acid sequence identity above 67% (this value is only a guideline). Each isoallergen may have multiple forms of closely similar sequences, which are designated as variants.
Enter the tissue or organ of expression of the natural allergen (e.g., venom gland) and, if known, its biochemical name. Additionally, state if a recombinant protein was produced and, if so, by using which expression system. Specify at least one molecular weight data of the mature protein and state which method was used for determination (e.g., deduced from the sequence, mass spectrometry or SDS-PAGE). Additionally, if known, indicate post-translational modifications of the allergen such as glycosylation.
Provide sequence and, if available, structure (PDB; Protein Data Bank) accession numbers of the allergen. For cloned gene products indicate a nucleotide accession number (GenBank, EMBL or DDBJ) and, if available, also the accession number of the protein sequence (GenPept or Uniprot). Protein sequence accession numbers are obligatory for natural proteins that were identified by Edman degradation or mass spectrometry.
Provide the complete protein sequence in one-letter code and, if available, also the nucleotide sequence. Specify how the N-terminus of the mature protein was determined and, if available, add sequence features such as the position of a signal sequence, a propeptide sequence and of the mature sequence.
State the level of sequence confirmation (e.g., sequence coverage by MS/MS). If the sequence was obtained by a PCR strategy indicate the position of used primers by clicking to the predetermined answers. Moreover, specify a sequence reference (unpublished, a publication accessible via PubMed or a congress abstract or publication not accessible via PubMed).
Specify the allergenicity of the new allergen. Allergens are only incorporated into the official list of allergens if binding of IgE antibodies from at least five sera of patients allergic to the respective allergen source were shown or if binding of IgE from at least 5% of all tested sera of patients allergic to the respective allergen source was demonstrated. For this purpose, state if the allergic reaction of the patients from the study population to the allergen source was documented by case history or allergen challenge and if the presence of allergen-specific IgE was demonstrated by an in vitro IgE test, skin test or cellular tests. Additionally, indicate the route of exposure to the allergen (e.g., sting or inhalation), describe the experimental evidence of allergenicity by indicating the test method, the total number of tested patients and the number of patients showing a positive test with the putative new allergen. If the natural allergen was tested specify the methods used to confirm the identity and purity of the protein. Moreover, if the allergen is glycosylated, indicate the experiments that were performed to exclude that IgE exclusively binds the glycan moieties.
Submit the completed New Allergen Submission Form by email to the chairman of the IUIS Allergen Nomenclature Sub-Committee (currently Dr. Richard E. Goodman; [email protected]).
Two or more members of the executive committee will review the submission and assess whether the allergen fulfills the immunological and molecular requirements for inclusion into the nomenclature. The review process will take approximately one month.
The chairman of the executive committee will notify the submitter about the status of the proposed new allergen. If the allergen does not fulfill the requirements the reviewers may ask for more data or for further clarification. If the allergen fulfills the requirements the data will be included in the Allergen Nomenclature database.
Acknowledgements
We thank the Editors Peter Neumann and Vincent Dietemann for their insights and advice. The COLOSS (Prevention of honey bee COlony LOSSes) Association aims to explain and prevent massive honey bee colony losses. It was funded through the COST Action FA0803. COST (European Cooperation in Science and Technology) is a unique means for European researchers to jointly develop their own ideas and new initiatives across all scientific disciplines through trans-European networking of nationally funded research activities. Based on a pan-European intergovernmental framework for cooperation in science and technology, COST has contributed since its creation more than 40 years ago to closing the gap between science, policy makers and society throughout Europe and beyond. COST is supported by the EU Seventh Framework Program for research, technological development, and demonstration activities (Official Journal L 412, 30 December 2006). The European Science Foundation as implementing agent of COST provides the COST Office through an EC Grant Agreement. The Council of the European Union provides the COST Secretariat. The COLOSS network is now supported by the Ricola Foundation - Nature & Culture.
Disclosure statement
No potential conflict of interest was reported by the authors.
References
- Abreu, R. M. M., Moraes, R. L. M., Silva de., & Malaspina, O. (2000). Histological aspects and protein content of Apis mellifera L. worker venom glands: The effect of electrical shocks in summer and winter. Journal of Venomous Animals and Toxins, 6(1), 87–98. https://doi.org/https://doi.org/10.1590/S0104-79302000000100006
- Ali, E. M. (2014). Contributions of some biological activities of honey bee venom. Journal of Apicultural Research, 53(4), 441–451. https://doi.org/https://doi.org/10.3896/IBRA.1.53.4.13
- Araújo, A. L., & Radvanyi, F. (1987). Determination of phospholipase A2 activity by a colorimetric assay using a pH indicator. Toxicon, 25(11), 1181–1188. https://doi.org/https://doi.org/10.1016/0041-0101(87)90136-X
- Barboni, E., Kemeny, D. M., Campos, S., & Vernon, C. A. (1987). The purification of acid phosphatase from honey bee venom (Apis mellifera). Toxicon, 25(10), 1097–1103. https://doi.org/https://doi.org/10.1016/0041-0101(87)90266-2
- Benton, A. W. (1967). Esterases and phosphatases in honey bee venom. Journal of Apicultural Research, 6(2), 91–94. https://doi.org/https://doi.org/10.1080/00218839.1967.11100164
- Benton, A. W., & Morse, R. A. (1968). Venom toxicity and proteins of the genus Apis. Journal of Apicultural Research, 7(3), 113–118. https://doi.org/https://doi.org/10.1080/00218839.1968.11100200
- Benton, A. W., Morse, R. A., & Stewart, J. D. (1963). Venom collection from honey bees. Science (New York, NY), 142(3589), 228–230. https://doi.org/https://doi.org/10.1126/science.142.3589.228
- Bogdanov, S. (2017). Bee venom: Production, composition, quality. In: The bee venom book, Chapter 1, Bee product science. Retrieved from May 2017. http://www.bee-hexagon.net/venom/production-compostion-quality/
- Bridges, A. R., & Owen, M. D. (1984). The morphology of the honey bee (Apis mellifera L.) venom gland and reservoir. Journal of Morphology, 181(1), 69–86. https://doi.org/https://doi.org/10.1002/jmor.1051810107
- Bridts, C. H., Sabato, V., Mertens, C., Hagendorens, M. M., DE Clerck, L. S., & Ebo, D. G. (2014). Flow cytometric allergy diagnosis: Basophil activation techniques. Methods in Molecular Biology (Clifton, NJ), 1192, 147–159. https://doi.org/https://doi.org/10.1007/978-1-4939-1173-8_11
- Brochetto-Braga, M. R. ; D., Lima, P. R. M., Chaud-Netto, J., Arab, A., DA Silva, G. P., & Cursino-Santos, J. R. (2005). Enzymatic variability among venoms from different subspecies of Apis mellifera (Hymenoptera: Apidae). Sociobiology, 45(3), 797–809.
- Carreck, N. L., Andree, M., Brent, C. S., Cox-Foster, D., Dade, H. A., Ellis, J. D., Hatjina, F., & Vanengelsdorp, D. (2013). Standard methods for Apis mellifera anatomy and dissection. In V. Dietemann; J. D. Ellis, & P. Neumann (Eds.), The COLOSS BEEBOOK, Volume I: Standard methods for Apis mellifera research. Journal of Apicultural Research, 52(4), 1–40. https://doi.org/https://doi.org/10.3896/IBRA.1.52.4.03
- Cha, J. D., Jeong, S. M., Kim, G. O., Kim, G. S., & Kim, N. O. (2004). The comparison of effectiveness between acupuncture and its cotreatment with bee venom acua-acupuncture therapy on the treatment of herniation of nucleus pulpous. Journal of the Korean Acupunture and Moxibustion Society, 21, 149–158.
- Cox, J., & Mann, M. (2008). MaxQuant enables high peptide identification rates, individualized p.p.b.-range mass accuracies and proteome-wide protein quantification. Nature Biotechnology, 26(12), 1367–1372. https://doi.org/https://doi.org/10.1038/nbt.1511
- da Silva, G. P., Brochetto-Braga, M. R., Ruberti, M., Ternero, M. L., & Gobbi, N. (2004). A comparative study of protein and enzymatic activity in venoms of some common wasps (Hymenoptera:Vespidae) from São Paulo State. Sociobiology, 44(2), 271–282.
- Danneels, E. L., van Vaerenbergh, M., Debyser, G., Devreese, B. ; D., & Graaf, D. C. (2015). Honeybee venom proteome profile of queens and winter bees as determined by a mass spectrometric approach. Toxins, 7(11), 4468–4483. https://doi.org/https://doi.org/10.3390/toxins7114468
- de Abreu, R. M., Silva DE Moraes, R. L., & Camargo-Mathias, M. I. (2010). Biochemical and cytochemical studies of the enzymatic activity of the venom glands of workers of honey bee Apis mellifera L. (Hymenoptera, Apidae). Micron (Oxford, England: 1993), 41(2), 172–175. https://doi.org/https://doi.org/10.1016/j.micron.2009.09.003
- de Graaf, D. C., Aerts, M., Danneels, E., & Devreese, B. (2009). Bee, wasp and ant venomics pave the way for a component-resolved diagnosis of sting allergy. Journal of Proteomics, 72(2), 145–154. https://doi.org/https://doi.org/10.1016/j.jprot.2009.01.017
- de Lima, P. R. M., Brochetto-Braga, M. R., & Chaud-Netto, J. (2000). Proteolytic activity of Africanized honey bee (Apis mellifera: Hymenoptera, Apidae) venom. Journal of Venomous Animals and Toxins, 6(1), 64–76. https://doi.org/https://doi.org/10.1590/S0104-79302000000100004
- Delpech, B., Bertrand, P., & Chauzy, C. (1987). An indirect enzymoimmunological assay for hyaluronidase. Journal of Immunological Methods, 104(1–2), 223–229. https://doi.org/https://doi.org/10.1016/0022-1759(87)90508-4
- Dotimas, E. M., & Hider, R. C. (1987). Honey bee venom. Bee World, 68(2), 51–70. https://doi.org/https://doi.org/10.1080/0005772X.1987.11098915
- Eberlein, B., Hann, R., Eyerich, S., Pennino, D., Ring, J., Schmidt-Weber, C. B., & Buters, J. (2014). Optimizing of the basophil activation test: Comparison of different basophil identification markers. Cytometry Part B: Clinical Cytometry, 88(3), 183–189. https://doi.org/https://doi.org/10.1002/cytob.21203
- Ebo, D. G., Bridts, C. H., Mertens, C. H., Hagendorens, M. M., Stevens, W. J., & DE Clerck, L. S. (2012). Analyzing histamine release by flow cytometry (HistaFlow): A novel instrument to study the degranulation patterns of basophils. Journal of Immunological Methods, 375(1–2), 30–38. https://doi.org/https://doi.org/10.1016/j.jim.2011.09.003
- Egmond, M. R., Brunori, M., & Fasella, P. M. (1976). The steady-state kinetics of the oxygenation of linoleic acid catalysed by soybean lipoxygenase. European Journal of Biochemistry, 61(1), 93–100. https://doi.org/https://doi.org/10.1111/j.1432-1033.1976.tb10001.x
- Georgieva, D., Greunke, K., Genov, N., & Betzel, C. (2009). 3-D Model of the bee venom acid phosphatase: Insights into allergenicity. Biochemical and Biophysical Research Communications, 378(4), 711–715. https://doi.org/https://doi.org/10.1016/j.bbrc.2008.11.101
- Grunwald, T., Bockisch, B., Spillner, E., Ring, J., Bredehorst, R., & Ollert, M. W. (2006). Molecular cloning and expression in insect cells of honeybee venom allergen acid phosphatase (Api m 3)). The Journal of Allergy and Clinical Immunology, 117(4), 848–854. https://doi.org/https://doi.org/10.1016/j.jaci.2005.12.1331
- Gunnison, A. F. (1966). An improved method for collecting the liquid fraction of bee venom. Journal of Apicultural Research, 5(1), 33–36. https://doi.org/https://doi.org/10.1080/00218839.1966.11100129
- Habermann, E. (1972). Bee and wasp venoms. Science (New York, NY), 177(4046), 314–322. https://doi.org/https://doi.org/10.1126/science.177.4046.314
- Han, J., You, D., Xu, X., Han, W., Lu, Y., Lai, R., & Meng, Q. (2008). An anticoagulant serine protease from the wasp venom of Vespa magnifica. Toxicon: Official Journal of the International Society on Toxinology, 51(5), 914–922. https://doi.org/https://doi.org/10.1016/j.toxicon.2008.01.002
- Hartfelder, K., Bitondi, M. M. G., Brent, C. S., Guidugli-Lazzarini, K. R., Simoes, Z. L. P., Stabentheiner, A., Tanaka, E. D., & Wang, Y. (2013). Standard methods for physiology and biochemistry research in Apis mellifera. In V Dietemann; J D Ellis; P Neumann (Eds) The COLOSS BEEBOOK, Volume I: standard methods for Apis mellifera research. Journal of Apicultural Research, 52(1), 1–48. https://doi.org/https://doi.org/10.3896/IBRA.1.52.1.06
- Hoechstetter, J. (2005). Characterization of bovine testicular hyaluronidase and a hyaluronate lyase from Streptococcus agalactiae: Investigations on the effect of pH on hyaluronan degradation and preclinical studies on the adjuvant administration of the enzymes in cancer therapy [PhD-dissertation]. University of Regensburg.
- Hoffman, D. R. (1977). Allergens in bee venom III. Identification of allergen B of bee venom as an acid phosphatase. The Journal of Allergy and Clinical Immunology, 59(5), 364–366. https://doi.org/https://doi.org/10.1016/0091-6749(77)90019-7
- Hoffman, D. R., & Jacobson, R. S. (1996). Allergens in Hymenoptera venom XXVII: Bumblebee venom allergy and allergens. The Journal of Allergy and Clinical Immunology, 97(3), 812–821. https://doi.org/https://doi.org/10.1016/S0091-6749(96)80159-X
- Hofinger, E. S., Hoechstetter, J., Oettl, M., Bernhardt, G., & Buschauer, A. (2008). Isoenzyme-specific differences in the degradation of hyaluronic acid by mammalian-type hyaluronidases. Glycoconjugate Journal, 25(2), 101–109. https://doi.org/https://doi.org/10.1007/s10719-007-9058-8
- Human, H., Brodschneider, R., Dietemann, V., Dively, G., Ellis, J., Forsgren, E., Fries, I., Hatjina, F., Hu, F.-L., Jaffé, R., Jensen, A. B., Köhler, A., Magyar, J., Özkýrým, A., Pirk, C. W. W., Rose, R., Strauss, U., Tanner, G., Tarpy, D. R., … Zheng, H.-Q. (2013). Miscellaneous standard methods for Apis mellifera research. In V Dietemann; J D Ellis; P Neumann (Eds) The COLOSS BEEBOOK, Volume I: standard methods for Apis mellifera research. Journal of Apicultural Research, 52(4), 1–53. https://doi.org/https://doi.org/10.3896/IBRA.1.52.4.10
- Humphrey, J. H., & Jaques, R. (1953). Hyaluronidase: Correlation between biological assay and other methods of assay. The Biochemical Journal, 53(1), 59–62. https://doi.org/https://doi.org/10.1042/bj0530059
- Ikegami-Kawai, M., & Takahashi, T. (2002). Microanalysis of hyaluronan oligosaccharides by polyacrylamide gel electrophoresis and its application to assay of hyaluronidase activity. Analytical Biochemistry, 311(2), 157–165. https://doi.org/https://doi.org/10.1016/S0003-2697(02)00425-6
- Jiang, N., Tan, N. S., Ho, B., & Ding, J. L. (2007). Azocoll protease activity assay. Protocol Exchange, 8(10), 1114–1122. https://doi.org/https://doi.org/10.1038/nprot.2007.484
- Jiménez, M., Cabanes, J., Gandı́a-Herrero, F., Escribano, J., García-Carmona, F., & Pérez-Gilabert, M., (2003). A continuous spectrophotometric assay for phospholipase A2 activity. Analytical Biochemistry, 319(1), 131–137. https://doi.org/https://doi.org/10.1016/S0003-2697(03)00331-2
- King, T. P., Hoffman, D., Lowenstein, H., Marsh, D. G., Platts-Mills, T. A., & Thomas, W. (1994). Allergen nomenclature. WHO/IUIS Allergen Nomenclature Subcommittee. International Archives of Allergy and Immunology, 105(3), 224–233. https://doi.org/https://doi.org/10.1159/000236761
- King, T. P., & Spangfort, M. D. (2000). Structure and biology of stinging insect venom allergens. International Archives of Allergy and Immunology, 123(2), 99–106. https://doi.org/https://doi.org/10.1159/000024440
- Koketsu, M., & Linhardt, R. J. (2000). Electrophoresis for the analysis of acidic oligosaccharides. Analytical Biochemistry, 283(2), 136–145. https://doi.org/https://doi.org/10.1006/abio.2000.4649
- Krell, R. (1996). Venom. In: Value-added products from beekeeping. FAO Agricultural Services Bulletin no. 124, chap. 7. Food and Agriculture Organization of the United Nations Rome 1996. The Chief Editor, FAO, Rome, Italy. http://www.fao.org/3/a-w0076e/w0076e18.htm#7.9.
- Krupa, J. C., Butler, M. A., & Mort, J. S. (2003). Quantitative bead assay for hyaluronidase and heparinase I. Analytical Biochemistry, 319(2), 280–286. https://doi.org/https://doi.org/10.1016/S0003-2697(03)00295-1
- Larché, M., Akdis, C. A., & Valenta, R. (2006). Immunological mechanisms of allergen-specific immunotherapy. Nature Reviews. Immunology, 6(10), 761–771. https://doi.org/https://doi.org/10.1038/nri1934
- Leytus, S. P., Melhado, L. L., & Mangel, W. F. (1983). Rhodamine-based compounds as fluorogenic substrates for serine proteinases. The Biochemical Journal, 209(2), 299–307. https://doi.org/https://doi.org/10.1042/bj2090299
- Magalhaes, M. R., da Silva, N. J., Jr., & Ulhoa, C. J. (2008). A hyaluronidase from Potamotrygon motoro (freshwater stingrays) venom: Isolation and characterization. Toxicon: Official Journal of the International Society on Toxinology, 51(6), 1060–1067. https://doi.org/https://doi.org/10.1016/j.toxicon.2008.01.008
- Markovic, O., & Mollnar, L. (1954). Isolation of and determination of bee venom. Chemicke Zvesti, 8, 80–90.
- Marsh, D. G., Goodfriend, L., King, T. P., Lowenstein, H., & Platts-Mills, T. A. (1986). Allergen nomenclature. Bulletin of the World Health Organization, 64(5), 767–774.
- Matthiensen, A. E., Tellechea, E., & Levy, J. A. (1993). Biochemical characterization for the genetic interpretation of esterase isozymes in Micropogonias furnieri (Pisces, Sciaenidae) in the south of Brazil. Comparative Biochemistry and Physiology Part B: Comparative Biochemistry, 104(2), 349–352. https://doi.org/https://doi.org/10.1016/0305-0491(93)90378-I
- Matulis, D., & Lovrien, R. (1998). 1-Anilino-8-naphthalene sulfonate anion-protein binding depends primarily on ion pair formation. Biophysical Journal, 74(1), 422–429. https://doi.org/https://doi.org/10.1016/S0006-3495(98)77799-9
- Matysiak, J., Dereziński, P., Urbaniak, B., Klupczyńska, A., Zalewska, A., & Kokot, Z. J. (2013). A new method for determination of hyaluronidase activity in biological samples using capillary zone electrophoresis. Biomedical Chromatography: BMC, 27(8), 1070–1078. https://doi.org/https://doi.org/10.1002/bmc.2909
- McDonald, C. E., & Chen, L. L. (1965). Lowry modification of the Folin reagent for determination of proteinase activity. Analytical Biochemistry, 10, 175–177. https://doi.org/https://doi.org/10.1016/0003-2697(65)90255-1
- McLaughlin, B. E., Baumgarth, N., Bigos, M., Roederer, M. D., Rosa, S. C., Altman, J. D., Nixon, D. F., Ottinger, J., Oxford, C., Evans, T. G., & Asmuth, D. M. (2008). Nine-color flow cytometry for accurate measurement of T cell subsets and cytokine responses. Part I: Panel design by an empiric approach. Cytometry. Part A: The Journal of the International Society for Analytical Cytology, 73(5), 400–410. https://doi.org/https://doi.org/10.1002/cyto.a.20555
- Moreau, S. J. M. (2013). "It stings a bit but it cleans well": Venoms of Hymenoptera and their antimicrobial potential. Journal of Insect Physiology, 59(2), 186–204. https://doi.org/https://doi.org/10.1016/j.jinsphys.2012.10.005
- Morey, S. S., Kiran, K. M., & Gadag, J. R. (2006). Purification and properties of hyaluronidase from Palamneus gravimanus (Indian black scorpion) venom. Toxicon: Official Journal of the International Society on Toxinology, 47(2), 188–195. https://doi.org/https://doi.org/10.1016/j.toxicon.2005.10.014
- Morse, R. A., & Benton, A. W. (1964a). Mass collection of bee venom. Gleaning Bee Culture, 92(1), 42–45. 54.
- Morse, R. A., & Benton, A. W. (1964b). Notes on venom collection from honey bees. Bee World, 45(4), 141–143. https://doi.org/https://doi.org/10.1080/0005772X.1964.11097072
- Muckenschnabel, I., Bernhardt, G., Spruss, T., Dietl, B., & Buschauer, A. (1998). Quantitation of hyaluronidases by the Morgan-Elson reaction: comparison of the enzyme activities in the plasma of tumor patients and healthy volunteers. Cancer Letters, 131(1), 13–20. https://doi.org/https://doi.org/10.1016/S0304-3835(98)00196-7
- Müller, H. L. (1966). Diagnosis and treatment of insect sensitivity. Journal of Asthma Research, 3(4), 331–333.
- Muller, U. R. (2005). Bee venom allergy in beekeepers and their family members. Current Opinion in Allergy and Clinical Immunology, 5(4), 343–347.
- Nakamura, T., Majima, M., Kubo, K., Takagaki, K., Tamura, S., & Endo, M. (1990). Hyaluronidase assay using fluorogenic hyaluronate as a substrate. Analytical Biochemistry, 191(1), 21–24. https://doi.org/https://doi.org/10.1016/0003-2697(90)90380-R
- Neumann, W., & Habermann, E. (1954). Über die Phospholipase A des Bienengiftes. Hoppe-Seyler´s Zeitschrift Für Physiologische Chemie, 296(Jahresband), 166–179. https://doi.org/https://doi.org/10.1515/bchm2.1954.296.1.166
- Nobre, A. A. B. (1990). Innovations: A device to provoke venom release from honey bees. Bee World, 71(4), 151–152. https://doi.org/https://doi.org/10.1080/0005772X.1990.11099057
- Nocelli, R. C. F., Roat, T. C., & Cruz-Landim, C. (2007). Alterations induced by the juvenile hormone in glandular cells of the Apis mellifera venom gland: Applications on newly emerged workers (Hymenoptera, Apidae). Micron (Oxford, England: 1993), 38(1), 74–80. https://doi.org/https://doi.org/10.1016/j.micron.2006.03.009
- Oršolić, N. (2012). Bee venom in cancer therapy. Cancer Metastasis Review, 31, 173–194.
- Owen, M. D. (1979). Relationship between age and hyaluronidase activity in the venom of queen and worker honey bees (Apis mellifera L.). Toxicon: Official Journal of the International Society on Toxinology, 17(1), 94–98. https://doi.org/https://doi.org/10.1016/0041-0101(79)90260-5
- Owen, M. D., & Bridges, A. R. (1976). Aging in the venom glands of queen and worker honey bees (Apis mellifera L.): Some morphological and chemical observations. Toxicon: Official Journal of the International Society on Toxinology, 14(1), 1–5. https://doi.org/https://doi.org/10.1016/0041-0101(76)90113-6
- Palmer, D. J. (1961). Extraction of bee venom for research. Bee World, 42(9), 225–226. https://doi.org/https://doi.org/10.1080/0005772X.1961.11096884
- Pattanaargson, S., & Roboz, J. (1996). Determination of hyaluronidase activity in venoms using capillary electrophoresis. Toxicon: Official Journal of the International Society on Toxinology, 34(10), 1107–1117. https://doi.org/https://doi.org/10.1016/0041-0101(96)00083-9
- Peiren, N. D., de Graaf, D. C., Brunain, M., Bridts, C. H., Ebo, D. G., Stevens, W. J., & Jacobs, F. J. (2006). Molecular cloning and expression of icarapin, a novel IgE-binding bee venom protein. FEBS Letters, 580(20), 4895–4899. https://doi.org/https://doi.org/10.1016/j.febslet.2006.08.005
- Peiren, N., Vanrobaeys, F. D., Graaf, D. C., Devreese, B., van Beeumen, J., & Jacobs, F. J. (2005). The protein composition of honeybee venom reconsidered by a proteomic approach. Biochimica et Biophysica Acta, 1752(1), 1–5. https://doi.org/https://doi.org/10.1016/j.bbapap.2005.07.017
- Price, J. A. (2007). A colorimetric assay for measuring phospholipase A2 degradation of phosphatidylcholine at physiological pH. Journal of Biochemical and Biophysical Methods, 70(3), 441–444. https://doi.org/https://doi.org/10.1016/j.jbbm.2006.10.008
- Pukrittayakamee, S., Warrell, D. A., Desakorn, V., McMichael, A. J., White, N. J., & Bunnag, D. (1988). The hyaluronidase activities of some Southeast Asian snake venoms. Toxicon: Official Journal of the International Society on Toxinology, 26(7), 629–637. https://doi.org/https://doi.org/10.1016/0041-0101(88)90245-0
- Queiroz, G. P., Pessoa, L. A., Portaro, F. C. V., Furtado, M. d F. D., & Tambourgi, D. V. (2008). Interspecific variation in venom composition and toxicity of Brazilian snakes from Bothrops genus. Toxicon: Official Journal of the International Society on Toxinology, 52(8), 842–851. https://doi.org/https://doi.org/10.1016/j.toxicon.2008.10.002
- Radauer, C., Nandy, A., Ferreira, F., Goodman, R. E., Larsen, J. N., Lidholm, J., Pomes, A., Raulf-Heimsoth, M., Rozynek, P., Thomas, W. R., & Breiteneder, H. (2014). Update of the WHO/IUIS allergen nomenclature database based on analysis of allergen sequences. Allergy, 69(4), 413–419. https://doi.org/https://doi.org/10.1111/all.12348
- Reynolds, L. J., Hughes, L. L., Yu, L., & Dennis, E. A. (1994). 1-Hexadecyl-2-arachidonoylthio-2-deoxy-sn-glycero-3-phosphorylcholine as a substrate for the microtiterplate assay of human cytosolic phospholipase A2. Analytical Biochemistry, 217(1), 25–32. https://doi.org/https://doi.org/10.1006/abio.1994.1079
- Roederer, M. (2002). Compensation in flow cytometry. Current Protocols in Cytometry, 22(1), 1.14.1–1.14.20. (Editorial Board, ROBINSON, J P; Managing Editor, Chapter 1, Unit 1 14). https://doi.org/https://doi.org/10.1002/0471142956.cy0114s22
- Ruëff, F., Chatelain, R., & Przybilla, B. (2011). Management of occupational Hymenoptera allergy. Current Opinion in Allergy and Clinical Immunology, 11(2), 69–74. https://doi.org/https://doi.org/10.1097/ACI.0b013e3283445772
- Sabato, V., Faber, M., Bridts, C. H., DE Clerck, L., & Ebo, D. G. (2015). Measuring histamine content and release at single-cell level during venom allergy immunotherapy. The Journal of Allergy and Clinical Immunology, 135(4), 1089. https://doi.org/https://doi.org/10.1016/j.jaci.2014.12.1946
- Schägger, H., & VON Jagow, G. (1987). Tricine-sodium dodecyl sulfate-polyacrylamide gel electrophoresis for the separation of proteins in the range from 1 to 100 kDa. Analytical Biochemistry, 166(2), 368–379. https://doi.org/https://doi.org/10.1016/0003-2697(87)90587-2
- Schmidt, J. O. (1995). Toxinology of venoms from the honey bee genus Apis. Toxicon, 33(7), 917–927. https://doi.org/https://doi.org/10.1016/0041-0101(95)00011-A
- Schmidt, J. O., & Blum, M. S. (1978). The biochemical constituents of the venom of the harvest ant Pogonomyrmex badius. Comparative Biochemistry and Physiology Part C: Comparative Pharmacology, 61(1), 239–247. https://doi.org/https://doi.org/10.1016/0306-4492(78)90137-5
- Schmidt, J. O., Blum, M. S., & Overal, W. (1986). Comparative enzymology of venoms from stinging Hymenoptera. Toxicon: Official Journal of the International Society on Toxinology, 24(9), 907–921. https://doi.org/https://doi.org/10.1016/0041-0101(86)90091-7
- Sobotka, A. K., Franklin, R. M., Adkinson, N. F., Jr., Valentine, M., Baer, H., & Lichtenstein, L. M. (1976). Allergy to insect stings. II. Phospholipase A: The major allergen in honey bee venom. Journal of Allergy and Clinical Immunology, 57(1), 29–40. https://doi.org/https://doi.org/10.1016/0091-6749(76)90076-2
- Steiner, B., & Cruce, D. (1992). A zymographic assay for detection of hyaluronidase activity on polyacrylamide gels and its application to enzymatic activity found in bacteria. Analytical Biochemistry, 200(2), 405–410. https://doi.org/https://doi.org/10.1016/0003-2697(92)90487-R
- Stern, R., & Jedrzejas, M. J. (2006). Hyaluronidases: Their genomics, structures, and mechanisms of action. Chemical Reviews, 106(3), 818–836. https://doi.org/https://doi.org/10.1021/cr050247k
- Stern, M., & Stern, R. (1992). An ELISA-like assay for hyaluronidase and hyaluronidase inhibitors. Matrix (Stuttgart, Germany), 12(5), 397–403. https://doi.org/https://doi.org/10.1016/S0934-8832(11)80036-3
- Turunen, S., & Chippendale, G. M. (1977). Esterase and lipase activity in the midgut of Diatraea grandiosella: Digestive functions and distribution. Insect Biochemistry, 7(1), 67–71. https://doi.org/https://doi.org/10.1016/0020-1790(77)90058-0
- van Vaerenbergh, M., Cardoen, D., Formesyn, E. M., Brunain, M., van Driessche, G., Blank, S., Spillner, E., Verleyen, P., Wenseleers, T., Schoofs, L., Devreese, B. ; D., & Graaf, D. C. (2013). Extending the honey bee venome with the antimicrobial peptide apidaecin and a protein resembling wasp antigen 5. Insect Molecular Biology, 22(2), 199–210. https://doi.org/https://doi.org/10.1111/imb.12013
- van Vaerenbergh, M., Debyser, G., Devreese, B., & de Graaf, D. C. (2014). Exploring the hidden honeybee (Apis mellifera) venom proteome by integrating a combinatorial peptide ligand library approach with FTMS. Journal of Proteomics, 99, 169–178. https://doi.org/https://doi.org/10.1016/j.jprot.2013.04.039
- Vercruysse, K. P., Lauwers, A. R., & Demeester, J. R. (1995). Absolute and empirical determination of the enzymatic activity and kinetic investigation of the action of hyaluronidase on hyaluronan using viscosimetry. Biochemical Journal, 306(1), 153–160. https://doi.org/https://doi.org/10.1042/bj3060153
- Verweij, M. M., DE Knop, K. J., Bridts, C. H., DE Clerck, L. S., Stevens, W. J., & Ebo, D. G. (2010). P38 mitogen-activated protein kinase signal transduction in the diagnosis and follow up of immunotherapy of wasp venom allergy. Cytometry: Part B, Clinical Cytometry, 78(5), 302–307. https://doi.org/https://doi.org/10.1002/cyto.b.20531
- Verweij, M. M., Sabato, V., Nullens, S., Bridts, C. H., DE Clerck, L. S., Stevens, L. S., & Ebo, D. G. (2012). STAT5 in human basophils: IL-3 is required for its FcεRI-mediated phosphorylation. Cytometry: Part B, Clinical Cytometry, 82(2), 101–106. https://doi.org/https://doi.org/10.1002/cyto.b.20629
- Vetter, R. S., Visscher, P. K., & Camazine, S. (1999). Mass envenomations by honey bees and wasps. Western Journal of Medicine, 170(4), 223–227.
- Vivek, H. K., Swamy, S. G., Priya, B. S., Sethi, G., Rangappa, K. S., & Nanjunda Swamy, S. (2014). A facile assay to monitor secretory phospholipase A2 using 8-anilino-1-naphthalenesulfonic acid. Analytical Biochemistry, 461, 27–35. https://doi.org/https://doi.org/10.1016/j.ab.2014.05.024
- Vlasak, R., & Kreil, G. (1984). Nucleotide sequence of cloned cDNAs coding for preprosecapin, a major product of queen-bee venom glands. European Journal of Biochemistry, 145(2), 279–282. https://doi.org/https://doi.org/10.1111/j.1432-1033.1984.tb08549.x
- von Moos, S., Graf, N., Johansen, P., Mullner, G., Kundig, T. M., & Senti, G. (2013). Risk assessment of Hymenoptera re-sting frequency: Implications for decision-making in venom immunotherapy. International Archives of Allergy and Immunology, 160(1), 86–92. https://doi.org/https://doi.org/10.1159/000338942
- Wieser, W. (1973). Effects of temperature on ectothermic organisms. In W. Wieser (Ed.), Temperature relations of ectotherms. A speculative review. New York: Springer Verlag; pp. 1–23.
- Williams, G. R., Alaux, C., Costa, C., Csaki, T., Doublet, V., Eisenhardt, D., Fries, I., Kuhn, R., McMahon, D. P., Medrzycki, P., Murray, T. E., Natsopoulou, M. E., Neumann, P., Oliver, R., Paxton, R. J., Pernal, S. F., Shutler, D., Tanner, G., van der Steen, J. J. M., & Brodschneider, R. (2013). Standard methods for maintaining adult Apis mellifera in cages under in vitro laboratory conditions. In V Dietemann; J D Ellis; P Neumann (Eds) The COLOSS BEEBOOK, Volume I: standard methods for Apis mellifera research. Journal of Apicultural Research, 52(1), 1–36. https://doi.org/https://doi.org/10.3896/IBRA.1.52.1.04
- Winningham, K. M., Fitch, C. D., Schmidt, M., & Hoffman, D. R. (2004). Hymenoptera venom protease allergens. The Journal of Allergy and Clinical Immunology, 114(4), 928–933. https://doi.org/https://doi.org/10.1016/j.jaci.2004.07.043
- Yin, C. S., & Koh, H. G. (1998). The first documental record on bee venom therapy in Oriental medicine: 2 prescriptions of bee venom in the ancient Mawangdui books of Oriental medicine. Journal of the Korean Acupunture and Moxibustion Society, 15, 143–147.
- Zalat, S., Nabil, Z., Hussein, A., & Rahka, M. (1999). Biochemical and haematological studies of some solitary and social bee venoms. Egyptian Journal of Biology, 1, 57–71.
- Zhang, L. S., & Mummert, M. E. (2008). Development of a fluorescent substrate to measure hyaluronidase activity. Analytical Biochemistry, 379(1), 80–85. https://doi.org/https://doi.org/10.1016/j.ab.2008.04.040
- Zhong, S. P., Campoccia, D., Doherty, P. J., Williams, R. L., Benedetti, L., & Williams, D. F. (1994). Biodegradation of hyaluronic acid derivatives by hyaluronidase. Biomaterials, 15(5), 359–365. https://doi.org/https://doi.org/10.1016/0142-9612(94)90248-8
- Zimmerman, M., Ashe, B., Yurewicz, E. C., & Patel, G. (1977). Sensitive assays for trypsin, elastase, and chymotrypsin using new fluorogenic substrates. Analytical Biochemistry, 78(1), 47–51. https://doi.org/https://doi.org/10.1016/0003-2697(77)90006-9
- Zimmerman, M., Yurewicz, E., & Patel, G. (1976). A new fluorogenic substrate for chymotrypsin. Analytical Biochemistry, 70(1), 258–262. https://doi.org/https://doi.org/10.1016/S0003-2697(76)80066-8