
Abstract
Due to their foraging behavior, honey bees interact with the landscape. As a result, honey bees and their brood will be exposed to pesticides through nectar and pollen entering the hive. Although these pathways seem rather straightforward, there are several steps between the entry of nectar and pollen and its consumption by the colony. One of the aspects involved here is the time between collection and consumption of pollen in the hive. This is of importance for the actual exposure of nurse bees and larvae to pesticides in pollen. Although lab and short-term field studies indicated that bees prefer to consume freshly stored pollen, this has to our knowledge not been verified in a long-term field study under realistic environmental and apiculturist conditions. To study pollen consumption dynamics, influx and consumption were recorded at 3 or 4 day intervals over a six-week period in two colonies. It was demonstrated that throughout the experimental period, beebread consumption was high in the first 3 to 5 days after collection, over which approximately 70% was consumed. The remaining 30% was consumed within a 2 to 3 week period. Pollen consumption is swift and indicates that only limited time is available for potential degradation processes. As actual data on degradation of pesticides in stored pollen are not available, a justified worse case assumption would be that the actual exposure concentrations consumed by the nurse bees and larvae are the same as the concentrations in collected pollen.
Introduction
There are two main influxes through which a honey bee colony can be exposed to pesticides: contaminated nectar and contaminated pollen. After entering the colony, nectar is transferred from the foraging bees to the nectar collectors, an age dependent task of 18 − 23 day old bees (Seeley, Citation1995; Brodschneider et al., Citation2007). Through trophallaxis, part of the fresh nectar is distributed among all bees in the colony, but the majority is stored. Foraging bees are, by trophallaxis, directly fueled with fresh incoming nectar (Brandstetter et al., Citation1988; DeGrandi-Hoffman & Hagler, Citation2000). Some of the stored nectar in cells is consumed directly by the bees as day to day food, and part is concentrated into honey for long term storage and ultimate winter feed (Eyer et al., Citation2016).
Pollen enters the colony either as corbicular pollen loads collected by the pollen foragers or as loose pollen grains on the bodies of nectar foragers (Westerkamp, Citation1991; Paalhaar et al., Citation2008). The loose pollen may be exchanged to all bees in the colony by direct contact. This loose pollen, of which the majority comes from nectar foragers, is responsible for the well-known cross-pollination by the honey bee (Free & Williams, Citation1972; DeGrandi-Hoffman et al., Citation1984; DeGrandi-Hoffman et al., Citation1986). The corbicular pollen pellets are stored by the pollen foragers, usually in cells adjacent to the open brood. Stored pollen in cells is also referred to as “beebread”. The amount of pollen stored is determined by the presence of brood and the availability of pollen in the field (Free, Citation1967; Dreller et al., Citation1999; Dreller & Tarpy, Citation2000). In a laboratory situation, Carroll et al. (Citation2017) showed in an eight-day trial that pollen stores of 2 to 4 days of age had a significantly greater chance of being consumed than older ones. Anderson et al. (Citation2014) also recorded over a five-day monitoring period a preferential consumption of stored pollen within three days of collection.
As a consequence of these different feed influxes, storage, and consumption routes, the exposure routes through contaminated nectar and pollen are different. Freshly collected nectar is partly divided between all bees and brood in the colony, posing a potential risk to all bees and brood (Nixon & Ribbands, Citation1952; Dadant, Citation1975; Crane, Citation1979). On the other hand, as nectar is constantly renewed in flower nectaries and food sources shift over the course of a day, the concentration of pesticides in the in-hive flux may decrease rapidly (Schatz & Wallner, Citation2009).
Unlike nectar, pollen is unprocessed but is preserved by added honey bee secretions and low PH (Anderson et al., Citation2014). The nurse bee cohort consumes this pollen to produce royal jelly for the larvae, queen, and young adults (Crailsheim et al., Citation1992; Rortais et al., Citation2005). Royal jelly is also fed to foragers as a trigger to collect more or less pollen (Fewell & Winston, Citation1992; Camazine, Citation1993). Although pollen is a known vehicle through which pesticides enter the colony, royal jelly itself contains hardly any residues of pesticides (Böhme et al., Citation2018). Consequently, the exposure to pesticide residues is mainly by consumption of pollen, so nurse bees will be more frequently exposed to pesticides in pollen than the rest of the bees. Johnson et al. (Citation2010), Mullin et al. (Citation2010), and Chauzat et al. (Citation2011) showed that stored pollen does contain pesticides, and therefore may pose a risk to the honey bee colony.
Unfortunately, no data about the degradation of pesticides in beebread are available. Degradation of a pesticide depends on temperature, humidity, and microbial activity (Aislabie & Lloyd-Jones, Citation1995; Castillo & Torstensson, Citation2007) and it can be assumed that the longer a pesticide is within a bee hive, the greater the degradation that will occur. The consumption dynamics of beebread, therefore, determine the actual exposure to bees.
In this study, we focus on in-hive beebread consumption dynamics over a relatively long period of approximately 6 weeks. This is because of knowledge gaps in understanding the actual exposure of the colony through beebread, particularly about the residence time of pollen in the hive. Therefore, we recorded the presence of beebread cells in a replicated six-week study in two colonies under field conditions and measured both beebread consumption and the time between influx and consumption.
Materials and methods
Test set-up
Two queen-right honey bee colonies were used for the experiment. The test colonies from the apiary of the Environmental Risk Assessment team of Wageningen Environmental Research were situated at the experimental facility ‘De Sinderhoeve’, Renkum, The Netherlands. This 11 ha test facility is situated in an area with extensive agriculture and the colonies had not previously been used in pesticide research. The colonies comprised approximately 5,600 bees, in a ten-frame hive and had been treated for Varroa destructor according to normal practice. Beebread monitoring was performed from 7 June to 28 July 2018 in colony A and from 21 June to 2 August 2018 in colony B.
Recording of beebread consumption
We modified the method used by Anderson and co-workers (2014) for recording the total beebread consumption in the field. Beebread initial storage and consumption were followed per individual cell. Per hive, all frames were checked every Monday and Thursday. To assess the beebread development, a transparent overlay sheet was placed in a fixed position on the frame, after which the beebread cells were marked using a permanent marker. Upon return to the lab, sheets of consecutive recordings were positioned on top of each other and the continuation, disappearance, and initiation of beebread cells over time were recorded. Emptied cells were not recorded, but were deduced from their presence on previous sheets. The content of these cells was therefore presumed to have been consumed in the period between recordings. In this paper, recorded data and deduced data are indicated as such.
Timeline of observations
Observations were made on Mondays and Thursdays, resulting in intermediate observation periods of 3 or 4 days. Therefore a newly recorded cell containing beebread will have been filled in the three or four day period prior to the recording. As the exact age of the beebread cannot be known, recordings are presented as nominal 4, 8, 11, 15, 18, 22, and 25 day periods post beebread initial storage.
Statistics
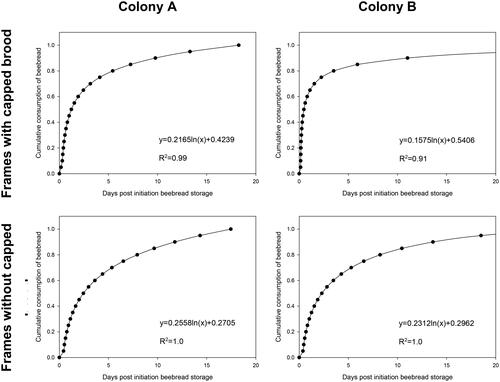
For each frame side, the mean residence time of beebread (the period between first recording to empty cell) was calculated. Data were processed using MS Excel (Office 365). Applying the logarithmic model y = aln(x)+b on the recorded data, provided the best fit. Using the resulting formulae presented in , the 75% and 95% residence times of the beebread were calculated.
Figure 1. Cumulative beebread consumption in frames with capped and non-capped brood.
Number of bees and number of capped brood cells
The numbers of bees and capped brood cells were recorded according to Delaplane et al. (Citation2013). The frames with bees and without bees were photographed. The photos were analyzed with the Image J program on bee- and capped brood coverage. A square dm2 covered by bees in one layer was assumed to contain 125 bees and a square dm2 of capped brood was assumed to contain 400 cells. Open brood was not recorded, as the number of capped brood cells is a practical tool for assessment of the brood onset.
Results
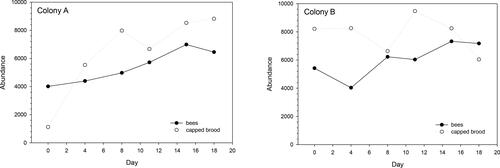
In the experimental period 2 July to 23 July for colony A and 11 June to 9 July for colony B, the colonies had on average 5,425 (n recordings: 6, sd: 1,069) and 6,036 (n recordings: 6, sd: 1,110) bees, respectively. In addition, Colonies A and B had on average 6,444 (n recordings: 6, sd: 2,634) and 7,810 (n recordings: 6, sd: 1,143) capped brood cells ().
Figure 2. Overview of the number of bees and capped brood cells per colony over time.
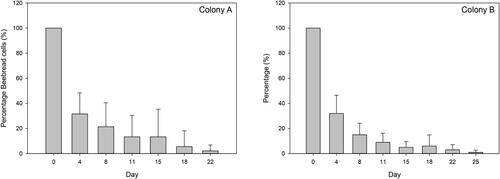
Of every 100 initially recorded cells containing beebread, in the first 4 day period after initiation, approximately 30 still contained beebread (). Over the 8 day period, the number of cells containing beebread had further diminished to about 18, and from the 15 day period, the remainder was 9 cells. This shows a steep increase of consumption of about 70% of the newly filled beebread cells over the 4 day period, while consumption comprises approximately 90% after 15 days. Note that there is considerable variation within the recorded consumption rates as is shown by the standard deviations in .
Figure 3. Overview of the average percentage remaining beebread cells over time. Error bars denote the calculated standard deviation. The total number of recorded initial cells in colony A was 2,916 in the period 7 June until 12 July 2018, while in colony B this comprised 4,753 cells in the period 21 June until 2 August 2018.
In order to quantify the cumulative beebread consumption over time, we distinguished between frames with and without capped brood (). The presence of brood in the frames affected the consumption rate by a factor of approximately 1.5 to 2. For instance, 75% consumption of beebread cells was reached within 4.5 days on frames with brood present and 6.5 days without brood present in colony A, while this was reached within 3.8 days with brood present and 7.1 days without brood present in colony B. The consumption of 95% beebread cells was reached within 11.4 days on frames with brood present and 14.2 days without brood present in colony A, while this was reached within 13.5 days with brood present and 16.9 days without brood present in colony B.
Discussion
The colonies used in this experiment were either still increasing or stabilizing their total number of bees. This is in accordance with the active brood rearing period of the honey bee colony in the Netherlands which is from March-April until October. The number of capped brood cells varied and was always higher than the number of recorded bees, which is in line with findings of Van der Steen et al. (Citation2014) and Khoury et al. (Citation2013) who reported the number of capped brood cells per adult bee to vary during the season. In spring this ratio is > 2, in summer about 1 and autumn <1. These findings are also corroborated by colony development reported in, for example, the ECOBEE project (Odoux et al., Citation2014).
The endpoint ‘average consumption of beebread cells’ showed a considerable variation, which is in line with previous observations. For instance, in the review publications of Keller et al. (Citation2005a, Citation2005b), it is stated that it takes 125 mg pollen to raise a bee and that this bee will consume an additional 39 mg in its adult life, resulting in total estimated consumption of 164 mg pollen. In contrast, Rortais et al. (Citation2005) report that a nurse bee during her 10 d nursing period consumes on average 65 mg pollen, and a worker larva in its six-day larval period consumes 5.4 mg pollen, while Crailsheim et al. (Citation1992) recorded a pollen consumption of 3.4 to 4.3 mg pollen per day per worker.
As nurse bees and larvae are the main pollen consumers in the colony, we will here focus on pollen consumption on these two cohorts. In our study, colonies A and B comprised on average 5,425 and 6,036 bees and 6,444 and 7,810 capped brood cells over the study period, respectively. In summer, the nurse bee cohort of the colony is about 25% of the total bees present (van der Steen et al., Citation2012). The capped brood period is 12 days and the larval period 6 days. Consequently, the number of larvae is half the number of capped brood cells in the case of colony homeostasis. With these data and the daily pollen consumption presented by Rortais et al. (Citation2005) the daily pollen consumption can be calculated: (n bees)*0.25)*6.5 mg pollen for the nurse bees and (n capped brood cells *0.5)*0.9 mg pollen for the larvae when no larval mortality occurs (see ). In addition, the total pollen consumption per day is given for different numbers of worker bees per colony ().
Table 1. Pollen consumption as a function of worker bees and capped brood in the colony.
Although in the current study the contents of the beebread cells were not weighed, Donkersley et al. (Citation2014) reported pollen weights of 165.9 ± 73.4 mg per cell. Unpublished measurements from previous studies of the authors varied from 125 to 150 mg per full cell. Observations of the over 7,500 cells in this study revealed that most cells were not filled completely, corresponding to an estimated 75 to 100 mg pollen per cell. On a daily basis, colony A consumed 100–120 cells while colony B consumed 97-129 cells. This results in an approximate consumption of the contents of 111 beebread cells per day, which corresponds to 111 × 75 to 100 mg = between 8,325 and 11,100 mg. This corresponds well with the calculated values in where a colony of 5,000 individuals and corresponding capped brood cells consumed 8,125 + 2,250 = 10,375 mg pollen. These data thus correspond with the calculated consumption data presented by Rortais et al. (Citation2005). Although the pollen consumption of Keller et al. (Citation2005a, Citation2005b) and Crailsheim et al. (Citation1992) is higher, it must be noted that the protein concentration in pollen can vary between 9.2% and 37.4% (Somerville & Nicol, Citation2006; Herbert & Shimanuki, Citation1978; Andrada & Tellería, Citation2005) and that larval mortality also might affect actual consumption rates.
In conclusion, our study has shown that almost 75% of the collected pollen is consumed within approximately one week. Almost all pollen (95%) is consumed within two weeks and only a small remainder is stored for a prolonged period.
A honey bee colony primarily consumes pollen via its nurse bees and larvae, which results in daily consumption of (n beesx0.25)*6.5 mg + (n capped brood cells*0.5 till 1)*0.9 mg pollen. The result is just an indication, as colonies grow in spring and decrease in the fall with corresponding changes in the ratio between brood and bees.
As pollen consumption per bee is independent of colony size, and the majority of pollen is consumed within a week of collection, there is not much time available for pesticides to be degraded. As actual data on degradation of pesticides in stored pollen are not available, a justified worse case assumption is thus that the actual exposure concentrations consumed by the nurse bees and larvae equal the concentrations in collected pollen. Note however that although the potential exposure of a honey bee colony following a single application event of a plant protection product via contaminated pollen is short, its overall exposure depends on the dynamics of agricultural practices over time.
Acknowledgements
The authors want to thank Marie-Claire Boerwinkel for her assistance in the practical phase of this study and Norman Carreck for linguistic support.
Disclosure statement
No potential conflict of interest was reported by the authors.
Additional information
Funding
References
- Aislabie, J., & Lloyd-Jones, G. (1995). A review of bacterial-degradation of pesticides. Soil Research, 33(6), 925–942. https://doi.org/https://doi.org/10.1071/SR9950925
- Anderson, K. E., Carroll, M. J., Sheehan, T. I. M., Mott, B. M., Maes, P., & Corby‐Harris, V. (2014). Hive‐stored pollen of honey bees: many lines of evidence are consistent with pollen preservation, not nutrient conversion. Molecular Ecology, 23(23), 5904–5917. https://doi.org/https://doi.org/10.1111/mec.12966
- Andrada, A. C., & Tellería, M. C. (2005). Pollen collected by honey bees (Apis mellifera L.) from south of Caldén district (Argentina): botanical origin and protein content. Grana, 44(2), 115–122. https://doi.org/https://doi.org/10.1080/00173130510010459
- Böhme, F., Bischoff, G., Zebitz, C. P., Rosenkranz, P., & Wallner, K. (2018). From field to food - will pesticide-contaminated pollen diet lead to a contamination of royal jelly? Apidologie, 49(1), 112–119. https://doi.org/https://doi.org/10.1007/s13592-017-0533-3
- Brandstetter, M., Crailsheim, K., & Heran, H. (1988). Provision of food in the honey bee before foraging. In Wiss U. Lit. Mainz & Fischer Stuttgard (Eds.), BIONA report 6, Akas (pp. 129–148).
- Brodschneider, R., Hrassnigg, N., Vollmann, J., Petz, M., Riessberger-Gallé, U., & Crailsheim, K. (2007). Liquid nutrition within a honey bee colony - who feeds. Apidologie, 38, 492. https://doi.org/https://doi.org/10.1051/apido:2007030
- Camazine, S. (1993). The regulation of pollen foraging by honey bees: how foragers assess the colony's need for pollen. Behavioral Ecology and Sociobiology, 32(4), 265–272. https://doi.org/https://doi.org/10.1007/BF00166516
- Carroll, M. J., Brown, N., Goodall, C., Downs, A. M., Sheenan, T. H., & Anderson, K. E. (2017). Honey bees preferentially consume freshly-stored pollen. PLoS One, 12(4), e0175933. doi: 10.1371/journal.pone.0173823
- Castillo, M. d. P., & Torstensson, L. (2007). Effect of biobed composition, moisture, and temperature on the degradation of pesticides. Journal of Agricultural and Food Chemistry, 55(14), 5725–5733. https://doi.org/https://doi.org/10.1021/jf0707637
- Chauzat, M. P., Martel, A. C., Cougoule, N., Porta, P., Lachaize, J., Zeggane, S., Aubert, M., Carpentier, P., & Faucon, J. P. (2011). An assessment of honey bee colony matrices, Apis mellifera (Hymenoptera: Apidae) to monitor pesticide presence in continental France. Environmental Toxicology and Chemistry, 30(1), 103–111. https://doi.org/https://doi.org/10.1002/etc.361
- Crailsheim, K., Schneider, L. H. W., Hrassnigg, N., Bühlmann, G., Brosch, U., Gmeinbauer, R., & Schöffmann, B. (1992). Pollen consumption and utilization in worker honey bees (Apis mellifera carnica): dependence on individual age and function. Journal of Insect Physiology, 38(6), 409–419. https://doi.org/https://doi.org/10.1016/0022-1910(92)90117-V
- Crane, E. E. (1979). Honey, a comprehensive study. Heinemann.
- Dadant, C. C. (1975). Beekeeping equipment. In The hive and the honey bee (pp. 303–328). Dadant and Sons.
- DeGrandi-Hoffman, G., & Hagler, J. (2000). The flow of incoming nectar through a honey bee (Apis mellifera L.) colony as revealed by a protein marker. Insectes Sociaux, 47(4), 302–306. https://doi.org/https://doi.org/10.1007/PL00001720
- DeGrandi-Hoffman, G., Hoopingarner, R., & Baker, K. (1984). Pollen transfer in apple orchards: tree-to-tree or bee-to-bee? Bee World, 65(3), 126–133. https://doi.org/https://doi.org/10.1080/0005772X.1984.11098791
- DeGrandi-Hoffman, G., Hoopingarner, R., & Klomparens, K. (1986). Influence of honey bee (Hymenoptera: Apidae) in-hive pollen transfer on cross-pollination and fruit set in apple. Environmental Entomology, 15(3), 723–725. https://doi.org/https://doi.org/10.1093/ee/15.3.723
- Delaplane, K. S., van der Steen, J., & Guzman, E. (2013). Standard methods for estimating strength parameters of Apis mellifera colonies. In V. Dietemann, J. D. Ellis & P. Neumann (Eds), The COLOSS BEEBOOK, Volume I: standard methods for Apis mellifera research. Journal of Apicultural Research, 52(1). https://doi.org/https://doi.org/10.3896/IBRA.1.52.1.03
- Donkersley, P., Rhodes, G., Pickup, R. W., Jones, K. C., & Wilson, K. (2014). Honey bee nutrition is linked to landscape composition. Ecology and Evolution, 4(21), 4195–4206. https://doi.org/https://doi.org/10.1002/ece3.1293
- Dreller, C., & Tarpy, D. R. (2000). Perception of the pollen need by foragers in a honey bee colony. Animal Behaviour, 59(1), 91–96. https://doi.org/https://doi.org/10.1006/anbe.1999.1303
- Dreller, C., Page, R. E., Jr, & Fondrk, M. K. (1999). Regulation of pollen foraging in honey bee colonies: effects of young brood, stored pollen, and empty space. Behavioral Ecology and Sociobiology, 45(3-4), 227–233. https://doi.org/https://doi.org/10.1007/s002650050557
- Eyer, M., Neumann, P., & Dietemann, V. (2016). A look into the cell: honey storage in honey bees, Apis mellifera. PLoS One, 11(8), e0161059. doi: 10.1371/journal.pone.0159269
- Fewell, J. H., & Winston, M. L. (1992). Colony state and regulation of pollen foraging in the honey bee, Apis mellifera L. Behavioral Ecology and Sociobiology, 30(6), 387–393. https://doi.org/https://doi.org/10.1007/BF00176173
- Free, J. B. (1967). Factors determining the collection of pollen by honey bee foragers. Animal Behaviour, 15(1), 134–140. https://doi.org/https://doi.org/10.1016/S0003-3472(67)80024-1
- Free, J. B., & Williams, I. H. (1972). The transport of pollen on the body hairs of honey bees (Apis mellifera L.) and bumble bees (Bombus spp. L.). The Journal of Applied Ecology, 9, 609–615. https://doi.org/https://doi.org/10.2307/2402458
- Herbert, E. W., Jr, & Shimanuki, H. (1978). Chemical composition and nutritive value of bee-collected and bee-stored pollen. Apidologie, 9(1), 33–40. https://doi.org/https://doi.org/10.1051/apido:19780103
- Johnson, R. M., Ellis, M. D., Mullin, C. A., & Frazier, M. (2010). Pesticides and honey bee toxicity - USA. Apidologie, 41(3), 312–331. https://doi.org/https://doi.org/10.1051/apido/2010018
- Keller, I., Fluri, P., & Imdorf, A. (2005a). Pollen nutrition and colony development in honey bees: part 1. Bee World, 86(1), 3–10. https://doi.org/https://doi.org/10.1080/0005772X.2005.11099641
- Keller, I., Fluri, P., & Imdorf, A. (2005b). Pollen nutrition and colony development in honey bees - Part II. Bee World, 86(2), 27–34. https://doi.org/https://doi.org/10.1080/0005772X.2005.11099650
- Khoury, D. S., Barron, A. B., & Myerscough, M. R. (2013). Modelling food and population dynamics in honey bee colonies. PloS One., 8(5), e59084. https://doi.org/https://doi.org/10.1371/journal.pone.0059084
- Mullin, C. A., Frazier, M., Frazier, J. L., Ashcraft, S., Simonds, R., & Pettis, J. S. (2010). High levels of miticides and agrochemicals in North American apiaries: implications for honey bee health. PLoS One, 5(3), e9754. https://doi.org/https://doi.org/10.1371/journal.pone.0009754
- Nixon, H. L., & Ribbands, C. R. (1952). Food transmission within the honey bee community. Proceedings of the Royal Society of London. Series B-Biological Sciences, 140(898), 43–50. https://doi.org/https://doi.org/10.1098/rspb.1952.0042
- Odoux, J.-F., Aupinel, P., Gateff, S., Requier, F., Henry, M., & Bretagnolle, V. (2014). ECOBEE: a tool for long-term honey bee colony monitoring at the landscape scale in West European intensive agroecosystems. Journal of Apicultural Research, 53(1), 57–66. https://doi.org/https://doi.org/10.3896/IBRA.1.53.1.05
- Paalhaar, J., Boot, W. J., Van Der Steen, J. J. M., Calis, J. N. M. (2008). In-hive pollen transfer between bees enhances cross-pollination of plants. Proceedings of the Section Experimental and Applied Entomology of The Netherlands Entomological Society, 19, 53–58.
- Rortais, A., Arnold, G., Halm, M. P., & Touffet-Briens, F. (2005). Modes of honey bees exposure to systemic insecticides: estimated amounts of contaminated pollen and nectar consumed by different categories of bees. Apidologie, 36(1), 71–83. https://doi.org/https://doi.org/10.1051/apido:2004071
- Schatz, F., & Wallner, K. (2009). Pflanzenschutzmittelapplikation in blühenden raps (Brassica napus) und deren auswirkungen auf die rückstandssituation in honig, nektar und pollen der honigbiene (Apis mellifera L.) [Doctoral dissertation, Thesis (Diploma]. Universität Hohenheim.
- Seeley, T. D. (1995). The wisdom of the hive; the social physiology of honey bee colonies. Harvard University Press.
- Somerville, D. C., & Nicol, H. I. (2006). Crude protein and amino acid composition of honey bee-collected pollen pellets from south-east Australia and a note on laboratory disparity. Australian Journal of Experimental Agriculture, 46(1), 141–149. https://doi.org/https://doi.org/10.1071/EA03188
- Steen, v d J., Ho-Ahin, C., & Cornelissen, B. (2014). De invloed van imidacloprid en de interactie met gereduceerd stuifmeelaanvoer op de vitaliteit en de overwintering van bijenvolken. WageningenUR Rapport 587
- van der Steen, J. J. M., Cornelissen, B., Donders, J., Blacquière, T., & van Dooremalen, C. (2012). How honey bees of successive age classes are distributed over a one storey, ten frames hive. Journal of Apicultural Research, 51(2), 174–178.
- Westerkamp, C. (1991). Honey bees are poor pollinators – why? Plant Systematics and Evolution, 177(1-2), 71–75. https://doi.org/https://doi.org/10.1007/BF00937827