
Abstract
Careful control of brood temperature is important for successful colony development in social insects. Six bumble bee colonies of six common Central European species (B. hypnorum, B. hortorum, B. argillaceus, B. pascuorum, B. humilis, B. sylvarum) were continuously monitored for several weeks. We recorded the brood temperature as well as the air temperature in the nest and outside once per minute using a homemade electronic setup. Two colonies succeeded in producing new queens and males during the measurement period while the other four colonies were attacked by parasites at some point during the equilibrium stage. We discuss the nest thermoregulation in view of species and the number of workers in the colony. The results show that the strongest colonies were able to maintain very stable brood temperature over longer periods (standard deviations below 0.5 °C), which is in agreement with previous studies. Colonies with 25 or more workers typically kept the standard deviation below 1 °C. There are two main contributions to the paper. First, we discuss the applicability of a multi-sensor monitoring setup for an outdoor study. Second, due to fast temperature sampling, we were able to observe different thermoregulation strategies that colonies may apply, including keeping the temperature above 31 °C at night and letting it rise during the day in B. argillaceus and short heating cycles in B. sylvarum.
Introduction
Bumble bees (genus Bombus from the bee family Apidae) are social insects that live in colonies consisting of a queen and workers, which can range from tens to above a hundred in numbers (Goulson, Citation2010). They are important pollinators of various plants and are considered keystone ecological species (Goulson, Citation2006). As opposed to domestic honey bees, where the colony survives the winter, in bumble bees, only young queens will survive into the next season (Goulson, Citation2010).
In spring, young bumble bee queens emerge from hibernation, find a suitable location for the nest, and start rearing up a new generation (Liczner & Colla, Citation2019). Nesting sites in the wild include abandoned burrows of small rodents, abandoned nests of birds or squirrels, artificial cavities, tussocks of grass, and brushwood (Goulson, Citation2010), as well as in man-made objects (Grad et al., Citation2010, Citation2016), with different species preferring different types of sites. An appropriate nesting site should provide shelter from adverse weather (rain, wind, and temperature extremes) and from potential predators. For successful brood development, the queen has to control the temperature in the nest (Goulson, Citation2010; Heinrich, Citation1972a, Citation1972b; Jones & Oldroyd, Citation2006). This can be achieved in two ways. Passive thermoregulation includes the use of insulating materials in the nest, such as moss, feathers, or dry grass (Jones & Oldroyd, Citation2006). On the other hand, active thermoregulation includes brooding and fanning. During cold periods (in early spring, when the queen starts building a nest, temperatures may still vary considerably and even plummet below freezing), the queen and later also the workers provide heat to the brood by the thermogenic activity of thoracic muscles (Heinrich, Citation1972a, Citation1972b; Jones & Oldroyd, Citation2006; Masson et al., Citation2017). This activity is called brooding and is resource-expensive. With outside temperatures rising in late spring and summer, adult bees may engage in fanning (Weidenmüller et al., Citation2002) to prevent overheating of the nest, which would also adversely impact brood development (Dean, Citation2016; Heinrich, Citation1994).
Literature (Hasselrot, Citation1960; Schultze-Motel, Citation1991) lists three consecutive stages of colony development. The initial period is called the upbringing (i), when the old queen is building a nest and collecting pollen for the first batch of the brood. This period ends when the first batch of workers starts to forage. The next stage is the equilibrium period (ii), where there is a large number of workers foraging and keep maintaining the nest. This period ends when young queens and males start leaving the nest to mate. The last stage is the period of decline (iii) where there is no more brood in the comb, and all the bees except for young queens will perish by the end of the season.
Bumble bee nest thermoregulation was studied by several authors. Already in the 1950s, Fye and Medler (Citation1954) performed a field study using thermocouples installed in the nests to check the daily temperature fluctuations. They studied three North American species (B. borealis, B. rufocinctus, and B. fervidus) and found that the brood temperature was about 30 °C, with the temperature fluctuating more when a smaller number of workers was present. For a nest with a large number of workers, Seeley and Heinrich (Citation1981) reported that the optimal temperature is around 30–31 °C. In a study of B. vosnesenskii and B. polaris, Heinrich (Citation1994) found out that the brood temperature can vary from 24 to 34 °C. In the literature, the temperature range in the nest is typically reported to be around 30–32 °C, however, the temperature of the comb that contains no brood can also be a couple of degrees lower (Goulson, Citation2010; Hagen, Citation1994; Livesey et al., Citation2019). The study of Livesey et al. (Citation2019) is specific, as they investigated queenless colonies. They estimated that three to seven adult workers already have the capacity to incubate the brood in the wild. In view of thermoregulation influencing the development of the brood, Heinrich (Citation1994) reported that temperatures below 30 °C were generally considered to inhibit growth and may cause developmental damage. Dean (Citation2016) studied thermal stress in B. impatiens by exposing late-stage larvae to sub-lethal heat and cold stress (16–35 °C). The stress resulted in some workers developing abnormal colour patterns, although no statistically consistent colour change response was observed. Guiraud et al. (Citation2021) studied the impact of temperature on the development of B. terrestris and found that workers that hatched from larvae at 33 °C were smaller than those that that hatched at a lower temperature. They suggest that thermal stress due to climate change can adversely affect both the colony and the ecosystem, as smaller workers are less efficient in resource collection and pollination.
Weidenmüller et al. (Weidenmüller, Citation2004; Weidenmüller et al., Citation2002, Citation2019) studied different aspects of fanning behaviour. They demonstrated that larger bumble bee colonies (of 60 or more individuals) responded to environmental perturbations faster and more efficiently than the smaller ones (Weidenmüller et al., Citation2002) and that the fanning behaviour in B. terrestris is being triggered by increased temperature and CO2 concentrations in the nest. In their experiment, the heating of the nest went up to about 30 °C. This study marks the temperature around 27.7–28.7 °C as favourable while higher temperatures resulted in increased fanning intensity (Weidenmüller, Citation2004). Due to the commercial importance of Bombus terrestris as greenhouse pollinators, conditions for keeping the colonies in climate rooms were studied, with Gurel and Gosterit (Citation2008) reporting temperatures from 24 to 30 °C and Wynants et al. (Citation2021) from 29 to 31 °C for optimal colony development. In view of external influences on the colony, Crall et al. (Citation2018) and Weidenmüller et al. (Citation2022) studied the effects of neonicotinoid and glyphosate exposure on the colony dynamics, respectively, and found that exposure impairs the nest thermoregulation in both cases.
The majority of the studies mentioned above were carried out in a laboratory setting, where the bumble bees remained in the nest during the course of the experiment. However, in some studies, bumble bees were allowed to exit the nest to allow normal foraging outings. In an example of such a setup, Schultze-Motel (Schultze-Motel, Citation1991) studied temperature fluctuations in a B. lapidarius nest, placed in a calorimeter box connected to the outside. The brood cell temperatures were maintained between 27 and 32 °C while the fluctuations of the heat loss were measured as well, typically showing a sinusoidal fluctuation throughout the day. In our previous study of several species in an outside setting (Grad & Gradišek, Citation2018), the temperature of the comb was recorded on a weekly basis using a conventional probe thermometer, which served as a reasonable estimate of the temperature ranges inside the nest. Depending on the species, the comb temperatures were between 31 and 35 °C. Following this preliminary study, we now report a detailed analysis of nest thermoregulation in six bumble bee colonies of six common Central European species, B. hypnorum, B. hortorum, B. argillaceus, B. pascuorum, B. humilis, and B. sylvarum. One colony per species was observed, six nests in total, which was the consequence of the unpredictability of the queens settling and rising a colony (ideally, the study would instead consider several colonies of the same species). The queens settled in wooden nest-boxes located in a rural setting, which was considered a reasonable approximation to the natural living conditions (above ground). This setting has previously proven successful for multi-species studies focused on sounds produced by the bumble bees (Gradišek et al., Citation2017; Heise et al., Citation2019) and nest temperature (Grad & Gradišek, Citation2018). Temperature sensors with a homemade setup were used to record temperature once per minute, we monitored both the brood temperature and temperature in the nest box. We counted the number of individuals in the nest on different dates. We discuss the results in view of the colony size and development stage and compare the thermoregulation strategies that different species took, and we discuss the applicability of the setup for field studies.
Materials and methods
Study setting
Six bumble bee colonies, one per species (identified by an experienced practitioner), were monitored in the study: B. hypnorum, B. hortorum, B. argillaceus, B. pascuorum, B. humilis, and B. sylvarum. The study took place in Petelinje, Dol pri Ljubljani, Slovenia (270 m elevation, 46.096° N latitude, 14.672° E longitude, moderate continental climate (Köppen climate classification: Cfb)), over several weeks in spring and summer of 2019. The nest-boxes were made of wood, of standard design used for this purpose (see for example Prys-Jones & Corbet, Citation1987). The size of the box was roughly 20*20*30 cm. The inner walls of the box were additionally insulated using cardboard and were filled with moss and other plant material to allow the bumble bees to build the nest. The boxes had no dedicated ventilation holes, however, the inserted sensor created a small opening by lifting the roof. The colonies were brought up by the queens that settled to the boxes in early spring after spending the winter hibernating outside. This was the limiting factor in the study, determining the number of colonies and species included, as well as the colony sizes at different points in time. According to the observations, it is possible that some of the queens returned to the boxes where they had emerged the previous season, although this falls outside of the scope of the present study.
The initial setting had nesting boxes grouped into three clusters in the garden, too far apart to use a single setup on them. Ultimately, two clusters were selected and two sensor setups were used. B. argillaceus and B. sylvarum were in one and the other four were in the other group. Both groups were located in shade, they were not exposed to direct sunlight, and were positioned about 10 m from one another.
The beginning of monitoring for each colony began after the emergence of the first workers when the comb was large enough to support the permanently inserted temperature sensor. In addition, another sensor was placed into each nest-box, above the insulation material of the nest, in order to measure the outside temperature of the nest (the ambient temperature in the nest-box). It should be noted that this setting turned out more practical than using neutral weather station data for the reference, as the ambient temperatures in the boxes are influenced by several factors, such as the elevation of the box, inclination, orientation, etc. Temperature profiles for some chosen outside sensors are shown in Figure S1 for comparison. For B. hypnorum and B. hortorum, the measurements concluded when the colony declined. For the other four colonies, the measurements concluded before they could reach the decline due to the nest infestation by the wax moth (Aphomia sociella), a common bumble bee parasite. The last couple of days of measurements after the discovery of the parasites were discarded: we checked until what point the daily temperature variations were consistent with the previous days and then removed two extra days. Following the mounting of the temperature sensors, the nest-boxes were not disturbed, apart from occasional opening and uncovering the top layer of insulation in order to visually estimate the number of individuals in the nest approximately every 10 days. This was done in the evenings when most of the workers were expected to be in the nest-box.
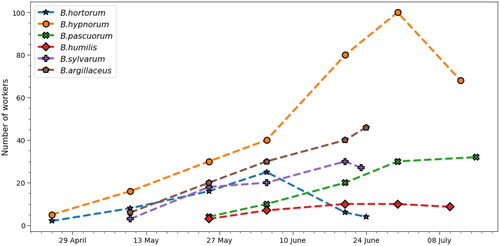
Figure 1. Number of workers estimated in each colony (Bombus sp.) at selected times. The dashed lines connect the points and should be only seen as a guide to an eye. B. hortorum and B. hypnorum colonies survived until the decline while the other four colonies show only the data until the wax moth infestation.
Hardware
We used waterproofed DS18B20 temperature sensors (Maxim Integrated, United States) which are sufficiently precise (± 0.5 °C), easy to use, and inexpensive. The sensor offset was re-calibrated using a water-ice mixture at 0 °C.
The temperature sensors were connected to a Wemos D32 microcontroller. Several sensors were connected to one pin on D32 with pull up resistor. Two D32 units were used, one for each group of nest-boxes, in order to keep the cable lengths under 2 m, as the signal strength got significantly worse for longer cables.
The data collection program was pooling the data from the sensors every 58 seconds and sending the data to the server via a REST request. The data sent was the current temperature reading and the MAC address of each sensor. To alleviate the connection problems between sensors and the data server, we installed a WiFi booster/extender between the nodes and the WiFi point, yet some dropouts still occurred from time to time.
The data on the server was stored in a MySQL database as it came, which needed cleaning before processing (sensors were reporting − 127 °C for corrupted data). At most, we ran about 50 sensors (several spare sensors in addition to the ones used for the measurements, as we did not initially know the number of colonies we would monitor during the study). The timestamps of the server were used to annotate each entry since the D32 microcontroller does not have its own real time clock.
Data processing
The temperature data were analysed using a custom-made script in Python. Due to the occasional loss of connection for individual sensors, we removed the corrupted/missing data and only analysed the data where we had both sensors of the pair (brood and reference) operational at the same time.
Results
The overview of the study is presented in . Even if the colonies of four species survived the wax moth attack (the parasites were manually removed) and some produced new queens, we only report the data before and during the temperature measurements.
Table 1. Overview of relevant dates for the colonies in the study (all dates are in 2019).
shows the trends for colony development in all six cases. The strongest colony was B. hypnorum with about 100 workers at its peak in late June. By the end of the measurements, there were still about 60 workers in the nest, however, the thermoregulation effectively stopped since there was no new brood produced by the queen. The B. hortorum colony reached its peak in early June and by the end of the month, almost all workers were gone. The other four colonies were either at a constant number or still increasing in numbers by the time the measurements ended because of the wax moth attack. The B. humilis colony was somewhat weak in numbers while the other three reached a number of workers similar to what has been observed for the corresponding species in the previous seasons at the monitoring site.
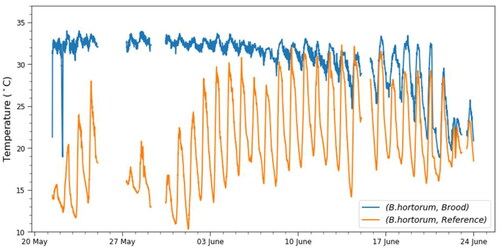
In the analysis of temperature profiles, we first look at the two spring species, B. hortorum and B. hypnorum. These two species typically conclude the colony cycle by the end of June. shows the temperature profile for the B. hortorum colony, both for the brood and for the reference sensor in the nest-box but away from the nest itself. The figure demonstrates the expected evolution of the temperature profile in the brood. In the first couple of days after the beginning of the measurements, the daily temperature variations were still clearly visible as compared to the reference sensor. In the following three weeks, the temperature of the brood was kept within a narrow temperature interval. The transition to this narrow range could either be a direct effect of more workers hatching, providing a more efficient thermoregulation, or possibly a situation where the workers mounted additional insulating material around the temperature sensor, coupling it better to the active brood. With the emergence of new queens and a decrease in the number of workers, thermoregulation stopped as there was no brood left to incubate. The temperature profile of the brood sensor in the last weeks closely followed that of the reference sensor, which suggests that the heating from the workers declined.
Figure 2. Brood and reference sensor temperature as a function of time for the Bombus hortorum colony. While the nest temperature fluctuates strongly according to the outside air temperature (orange line), brood is maintained relatively steady at temperatures between 30 and 35 °C in the first weeks, with only minor drops during the colder times of the day. For details, see the text.
The temperature profiles for B. hypnorum are shown in Figure S2. As noted above, this was by far the strongest colony by the number of workers in our study. This was reflected by the fact that the reference sensor, which was positioned in the box away from the nest itself, closely followed the temperature of the brood during the peak period. This indicates that the bees in the nest-box generated so much heat that even the air in the nest-box got heated well above the outside temperature. For a better comparison, the temperature profile for the reference sensor of B. hortorum colony that was adjacent to this nest-box is added to the same plot. Again, as in B. hortorum, the temperature of the brood was kept remarkably constant during the peak period, and we see a clear decline in thermoregulation sometime after the new queens have emerged. By the end of the measurements, there were still workers returning to the nest-box, but there was no more new brood.
The following four colonies were monitored during a shorter observation window, as the colonies of these species start developing later in spring than those of the first two. For example, the colonies of B. pascuorum are often still active well into August, according to our previous observations. Figure S3 shows the temperature profiles for the colony of B. argillaceus. In this case, it is interesting to observe that the temperature profile has a distinct pattern: it appears as if the bees maintained a minimum temperature of the brood during the night (above 30–31 °C) while they allowed the temperature to increase well above this minimum value during the day. The difference between the brood and the reference sensor was always of the order of several degrees, which means that the temperature spikes in brood temperature were not solely due to the fluctuations of the outside temperature. It should be noted that the temperature was always higher in the brood than in the rest of the nest. The colonies of B. argillaceus and B. hypnorum reached the highest temperatures in our study, with 35.1 and 36.2 °C, respectively.
Figure 3. Temperature profiles for the brood in all six colonies (Bombus sp.) for 96 hours in June. The tick at 8 June corresponds to midnight.
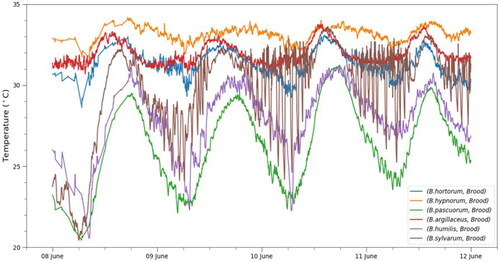
Figure S4 shows the temperature profiles for the B. pascuorum colony. The colony had only about 10 workers when the measurements started, as opposed to the three colonies previously discussed, which started stronger. The temperature of the brood was following the reference temperature closely, which indicates that the thermoregulation was weak. During the observation window, the size of the colony increased to about 30 workers but the two sensors still kept almost the same temperature profile. It is possible that the new brood pack was built away from the sensor; however, the protocol dictated that the sensors were to be kept at the initial position throughout the measurements.
Figures S5 and S6 show the temperature profiles for B. humilis and B. sylvarum, respectively. The B. humilis colony was a weak one, containing 10 workers at most. Nevertheless, the bees still managed to keep the temperature fluctuations in the brood smaller than in the reference sensor. The profiles for the B. sylvarum colony show peculiar behaviour with “heating cycles” which we will discuss in more detail below.
To make a direct comparison between all the colonies, we look at the section of the data where we have all six sensor pairs active and the colonies are in the equilibrium phase. We chose the interval from 8 June, 12h00m a.m., to 12 June, 12h00m a.m., which is four full days. shows the temperature profiles for all six colonies on the same plot, together with the box-and-whisker plots (Figure S7), which offer an alternative visualization of the data. Clearly, all colonies showed a sinusoidal trend on the daily scale, but the thermoregulation strategies varied at a closer look. B. hortorum and B. hypnorum both managed to keep the temperature within a very narrow interval, with a standard deviation of 0.88 °C and 0.48 °C respectively. For B. hortorum, the temperature interval was even narrower in the days preceding the interval we were looking at (standard deviation of 0.45 °C from 31 May to 3 June), since the colony was already transitioning between the equilibrium and decline period in this time window. B. argillaceus kept the temperature very constant during the night time, while they allowed the temperature to rise during the day. During the observed 4-day interval, this colony had the standard deviation of 0.68 °C. Thermoregulation in B. humilis and B. pascuorum was weak while the B. sylvarum colony showed a rather different pattern. During the day, the temperature followed the sinusoidal pattern as in the case with the other species, while during the night, the temperature frequently dropped considerably and was then raised up above 28 or 30 °C. These heating cycles were not uniform—they could be an hour long or shorter, and it appears they depended on the temperature drop.
It is informative to look at the correlations between the brood and the reference sensor to get a numerical estimate of how closely the brood temperature followed the ambient one. The Pearson correlation coefficients over the 4-day interval are listed in Table S1. The correlation was the strongest for B. pascuorum and B. humilis, while the value was the lowest for B. sylvarum due to their peculiar strategy. Even if thermoregulation was more efficient in the three strongest colonies (B. hortorum, B. hypnorum, and B. argillaceus), the correlation values were still above 0.8 for all three, as the brood temperature nevertheless weakly followed the ambient trends. We also calculated the correlations between the sensors by delaying the brood values for a couple of minutes. An increase in the correlation value would hint at the bees reacting to the ambient temperature change with some delay, however, the differences observed were negligible.
Purely from the colony size perspective, we can view these results as the connection between the number of workers and the efficiency of thermoregulation. The three colonies with the highest number of workers (B. hypnorum, B. hortorum, and B. argillaceus) were the most efficient while the two with the lowest number (B. humilis and B. pascuorum) were not efficient and the temperature of the brood was close to the ambient temperature for most of the time. As mentioned above, the strategy of B. sylvarum, with about 10 workers at the time, was apparently to heat the brood in intervals instead of constantly. The general trend can be observed in Figure S8, where we show the standard deviation of the brood temperature as a function of the colony size (number of workers). The standard deviation of temperature was calculated for three days around the date when the colony size estimate was made. Therefore, it was possible to obtain several points in the plot for each colony, as they were developing in time. While one would expect the colonies with more workers have a smaller standard deviation in temperature, there is no clear trend among colonies or species, which is likely a consequence of dynamics of individual colonies. The standard deviation for the colonies containing 25 or more workers (B. hypnorum and B. argillaceus over the entire observation period, as well as for B. sylvarum and B. hortorum at the peak colony size) is 1 °C or less, apart from one data point for B. pascuorum, hinting that such numbers are sufficient to provide efficient thermoregulation over longer times.
Discussion
There are two main contributions to this study. First, we discuss the applicability of the homemade setup constructed specifically for the purpose of monitoring the nest temperature. The second contribution comes from the fast temperature sampling, compared to previous studies. We were able to observe different thermoregulation strategies that colonies may apply, including keeping the temperature above 31 °C at night and letting it rise during the day in B. argillaceus and short heating cycles in B. sylvarum.
The setup proved reliable and efficient for the task. Despite the initial scepticism of how the insertion of the probe inside the brood space would affect the colony, the bees did not appear to be disturbed and kept building the brood as before. The advantage of the setup is that it allowed us to monitor the temperatures in real time, which would allow for possible quick intervention if needed (e.g., sensor gets detached because of wind or animals). As the temperature data was immediately sent to a server, there was no need for storage and we were able to sample on a minute scale. For monitoring remote colonies, where no electrical grid is readily available, considerations should be given to optimizing the power consumption as well as recording the temperature more sparsely, for example, when it changes above a certain threshold.
Recording the temperature data at the 1/minute rate provided a unique insight into the behaviour of the colony in the field. As discussed in the introduction, only a small number of studies of bumble bee thermoregulation were carried out in the field. The early study of Fye and Medler (Fye & Medler, Citation1954) took place outside but temperatures were recorded once per hour or at even longer intervals, which disallowed observation of thermoregulation strategies such as in the case of B. sylvarum, where the heating cycles take place on shorter timescales. The same problem arose in our previous study (Grad & Gradišek, Citation2018) where temperature sampling was just sporadic. In the other study that was (partially) conducted in the outside setting, Schultze-Motel (Schultze-Motel, Citation1991) reported a rather smooth temperature profile during a typical day with temperatures between 29 and 33 °C (31.7 ± 1.0 °C; mean ± SD) for a single colony of B. lapidarius containing about 80 workers, which is a thermoregulation strategy similar to the one we observed in our study for B. hortorum and B. hypnorum. In a study of nest climate regulation, Weidenmüller et al. (Weidenmüller et al., Citation2002) used a single colony of B. terrestris with a large number of workers in the field, in addition to several ones in a laboratory setting. The field colony had brood temperature undergoing minor fluctuations between 31.3 and 33.4 °C (32.3 ± 0.4 °C), which is again similar to what we observed in B. hortorum and B. hypnorum. However, the sampling rate in that experiment was once per 30 min, which again disallowed observations of possible thermoregulation strategies on shorter timescales.
Most of the more recent studies of thermoregulation were conducted in a laboratory setting using the species that are of the most interest commercially, B. terrestris. They focused on different aspects of nest control, such as artificial changes of temperature, humidity, or CO2 concentration in order to induce fanning (Weidenmüller, Citation2004; Weidenmüller et al., Citation2002, Citation2019), queenless colonies (Livesey et al., Citation2019), or development of commercial colonies kept at a constant ambient temperature (and thus not exposed to outside temperature fluctuations) (Gurel & Gostreit, Citation2008; Wynants et al., Citation2021). The results of these studies are therefore not directly comparable with ours.
In the available literature for bumble bees, we found no descriptions of strategies such as those seen in our study for B. argillaceus and B. sylvarum, although it appears that thermoregulation in these two species has not been studied yet. Since only one colony per species was observed here, these findings cannot be generalized to the species’ behavior, further field studies on several colonies are needed to establish that. We should nevertheless point out that for each of these two colonies, the thermoregulation pattern remained consistent at least over the course of two weeks in the equilibrium phase, and can therefore not be viewed only as a random observation. The general trend of larger colonies being more efficient in thermoregulation of the nest than those with a lower number of workers that we observed is consistent with several previous studies, as well as standard deviations of 1 °C or less for larger colonies with several tens of workers (Fye & Medler, Citation1954; Weidenmüller et al., Citation2002).
Conclusions
We present a field study of bumble bee nest thermoregulation for six common bumble bee species. We monitored the brood temperature and the ambient temperature in the nest box using a series of temperature sensors. We started monitoring each colony in the equilibrium period, with several workers already present. Two colonies, B. hortorum and B. hypnorum, produced new queens and we were able to follow the colonies into their decline, while the monitoring of the other four colonies was interrupted due to a wax moth infestation. The setup proved efficient for the task; it appears that the probes did not significantly disturb the colonies. The brood temperatures recorded were close to those reported in the literature for different species.
The colonies showed different strategies for thermoregulation. In agreement with previous research, the colonies with larger numbers of workers were able to maintain very stable brood temperatures, for example, the standard deviation over several days was 0.45 °C, 0.47 °C, and 0.67 °C for B. hortorum, B. hypnorum, B. argillaceus, respectively. On the other hand, B. argillaceus preferred to keep the temperature at night above 31 °C but letting it rise during the day. B. sylvarum showed yet another pattern, heating the brood in cycles after letting it cool close to the ambient temperature. To the best of our knowledge, for bumble bees, such thermoregulation patterns have not been reported yet. Even if only one colony per species was monitored, the day-to-day data over at least two weeks shows that the strategy for each species is self-consistent. Clearly, a simultaneous study of several colonies of each species is required to establish whether this behaviour is typical for the species in our study. This will be the focus of our future work.
Supplementary Figures and Tables
Download MS Word (1 MB)Brood and Reference Data
Download Zip (2 MB)Disclosure statement
The authors declare no conflict of interest.
Additional information
Funding
References
- Crall, J. D., Switzer, C. M., Oppenheimer, R. L., Ford Versypt, A. N., Dey, B., Brown, A., Eyster, M., Guérin, C., Pierce, N. E., Combes, S. A., & de Bivort, B. L. (2018). Neonicotinoid exposure disrupts bumble bee nest behavior, social networks, and thermoregulation. Science (New York, N.Y.), 362(6415), 683–686. https://doi.org/10.1126/science.aat1598
- Dean, C. A. E. (2016). Developmental timing of pupation and analysis of colour pattern response to thermal stress in Bombus impatiens (Hymenoptera: Apidae) [Master thesis]. University of Illinois at Urbana-Champaign.
- Fye, R. E., & Medler, J. T. (1954). Temperature studies in bumblee domiciles. Journal of Economic Entomology, 47(5), 847–852. https://doi.org/10.1093/jee/47.5.847
- Goulson, D. (2006). The demise of the bumble bee in Britain. Biologist, 53(6), 294–299.
- Goulson, D. (2010). Bumble bees: Behaviour, ecology and conservation. Oxford University Press (OUP).
- Grad, J., & Gradišek, A. (2018). Bumble bee brood temperature and colony development: A field study. Acta Entomologica Slovenica, 26(2), 219–232.
- Grad, J., Gogala, A., Kozmus, P., Jenič, A., & Bevk, D. (2010). Pomembni in ogroženi opraševalci – Čmrlji v Sloveniji (Important and endangered pollinators: Bumble bees in Slovenia). Čebelarska zveza Slovenije (The Slovenian Beekeeping Association).
- Grad, J., Oštir, T., & Jenič, A. (2016). Redkejše vrste čmrljev v Sloveniji: Značilnosti čmrljev in zanimivosti (Rare bumble bee species in Slovenia: Bumble bees Characteristics and interesting things). Celjska Mohorjeva družba.
- Gradišek, A., Slapničar, G., Šorn, J., Luštrek, M., Gams, M., & Grad, J. (2017). Predicting species identity of bumble bees through analysis of flight buzzing sounds. Bioacoustics, 26(1), 63–76. https://doi.org/10.1080/09524622.2016.1190946
- Guiraud, M., Cariou, B., Henrion, M., Baird, E., & Gérard, M. (2021). Higher developmental temperature increases queen production and decreases worker body size in the bumble bee Bombus terrestris. Journal of Hymenoptera Research, 88, 39–49. https://doi.org/10.3897/jhr.88.73532
- Gurel, F., & Gostreit, A. (2008). Effects of temperature treatments on the bumble bee (Bombus terrestris L.) colony development. Akdeniz Üniversitesi Ziraat Fakültesi Dergisi, 21(1), 75–78.
- Hagen, E. v. (1994). Hummeln: Bestimmen, ansiedeln, vermehren, schuetzen. Naturbuch Verlag.
- Hasselrot, T. B. (1960). Studies on Swedish bumble bees (genus Bombus Latr.): Their domestication and biology. Opuscula Entomologica: Supplementum, 17, 1–192.
- Heinrich, B. (1972a). Physiology of Brood Incubation in the Bumble bee Queen, Bombus vosnesenskii. Nature, 239(5369), 223–225. https://doi.org/10.1038/239223a0
- Heinrich, B. (1972b). Temperature regulation in the bumble bee Bombus vagans: A field study. Science (New York, N.Y.), 175(4018), 185–187. https://doi.org/10.1126/science.175.4018.185
- Heinrich, B. (1994). Bumble bee economics. Harvard University Press. Fifth Printing.
- Heise, D., Miller, Z., Harrison, E., Gradišek, A., Grad, J., Galen, C. (2019). Acoustically tracking the comings and goings of bumble bees. SAS 2019 - 2019 IEEE Sensors Applications Symposium, Conference Proceedings.
- Hintermeier, H., & Hintermeier, M. (1997). Bienen, Hummeln, Wespen im Garten und in der Landschaft (2. Auflage). Bayerischer Landesverband für Gartenbau und Landespflege.
- Jones, J. C., & Oldroyd, B. P. (2006). Nest thermoregulation in social insects. In Advances in insect physiology (Vol. 33, pp. 153–191). Academic Press.
- Liczner, A. R., & Colla, S. R. (2019). A systematic review of the nesting and overwintering habitat of bumble bees globally. Journal of Insect Conservation, 23(5–6), 787–801. https://doi.org/10.1007/s10841-019-00173-7
- Livesey, J. S., Constable, C., Rawlinson, W. G., Robotham, A. M., Wright, C., Hampshire, A. E., Klark, E. G., Borrows, W. A., Horsell, D., & Cresswell, J. E. (2019). The power and efficiency of brood incubation in queenless microcolonies of bumble bees (Bombus terrestris L.). Ecological Entomology, 44(5), 601–609. https://doi.org/10.1111/een.12736
- Masson, S. W. C., Hedges, C. P., Devaux, J. B. L., James, C. S., & Hickey, A. J. R. (2017). Mitochondrial glycerol 3-phosphate facilitates bumble pre-flight thermogenesis. Scientific Reports, 7(1), 13107. https://doi.org/10.1038/s41598-017-13454-5
- Prys-Jones, O. E., & Corbet, S. A. (1987). Bumle bees. Naturalists’ handbooks 6. Cambridge University Press.
- Schultze-Motel, P. (1991). Heat loss and thermoregulation in a nest of the bumble bee Bombus lapidarius (Hymenoptera, Apidae). Thermochimica Acta, 193, 57–66. https://doi.org/10.1016/0040-6031(91)80174-H
- Seeley, T. D., & Heinrich, B. (1981). Regulation of temperature in nests of social insects. In B. Heinrich (Ed.), Insect thermoregulation (pp. 159–234). John Wiley.
- Weidenmüller, A. (2004). The control of nest climate in bumble bee (Bombus terrestris) colonies: Interindividual variability and self-reinforcement in fanning response. Behavioural Ecology, 15(1), 120–128.
- Weidenmüller, A., Chen, R., & Meyer, B. (2019). Reconsidering response threshold models—short-term response patterns in thermoregulating bumble bees. Behavioral Ecology and Sociobiology, 73(8), 1–13. https://doi.org/10.1007/s00265-019-2709-5
- Weidenmüller, A., Kleineidam, C., & Tautz, J. (2002). Collective control of nest climate parameters in bumble bee colonies. Animal Behaviour, 63(6), 1065–1071. https://doi.org/10.1006/anbe.2002.3020
- Weidenmüller, A., Meltzer, A., Neupert, S., Schwarz, A., & Kleineidam, C. (2022). Glyphosate impairs collective thermoregulation in bumble bees. Science (New York, N.Y.), 376(6597), 1122–1126. https://doi.org/10.1126/science.abf7482
- Witte, G. R., & Seger, J. (1999). Hummeln brauchen bluehendes Land. Westarp Wissenschaften-Verlags-Gesellschaft mbH.
- Wynants, E., Lenaerts, N., Wäckers, F., & Van Oystaeyen, A. (2021). Thermoregulation dynamics in commercially reared colonies of the bumble bee Bombus terrestris. Physiological Entomology, 46(1), 110–118. https://doi.org/10.1111/phen.12350