
Abstract
The eastern honey bee (Apis cerana) is of great importance for ecosystems and agriculture in Asia, whose diversity has yet to be explored. Previous studies have found a high diversity of A. cerana in mountainous areas or islands. To better understand the morphological diversity of A. cerana, we focused on the eastern Qinghai-Tibet Plateau (QTP), a region with high mountains, Weizhou Island, Yongxing Island and Hainan Island, much of which lacks systematic investigation of honey bee diversity. Five sampling sites in the plain were also selected as references. A total of 140 colonies of A. cerana were collected from 9 localities in QTP, 3 localities in islands, and 5 localities in plain. We used standard morphometry and geometric morphometrics to assess the level of diversity, in which principal component analysis and discriminant analysis were conducted. The results revealed the A. cerana populations from QTP and islands were differentiated from the plain populations. Moreover, two populations from QTP and one from Yongxing Island showed significant divergence. Our study provided insights into the A. cerana diversity and provides information for the effective conservation of A. cerana genetic resources in China.
Introduction
Pollinators are an integral part of ecosystems because of their essential role in maintaining ecosystem function, wild plant reproduction and crop production (Allen-Wardell et al., Citation1998; Kremen et al., 2007). It is estimated that 87.5% of angiosperm species need pollinators (Ollerton et al., Citation2011), while pollination enhances the economic value of world agriculture by an additional US$235–577 billion in 2015 prices annually (Potts et al., Citation2016). Honey bees are the preferred pollinators for most plants due to their biology and characteristics (Hung et al., Citation2018; National Research Council, Citation2007).
The eastern honey bee, Apis cerana, whose natural distribution covers a large variety of geographic regions, ranging from hot to cold temperate climates, from lowlands to high-altitude mountainous areas and from humid coast to arid or semi-arid midlands (Hepburn & Radloff, Citation2011), is one of the most important honey bee species in Asia. A. cerana has high genetic and phenotypic variations occurring in different spatial scales, which led to the division into several subspecies or ecotypes (Radloff et al., Citation2010; Ruttner, Citation1988). Previous research found native honey bees have persistent colony-level behavioral adaptations to the local climate. For example, A. cerana populations in Qinghai-Tibet Plateau (QTP) and tropical Hainan Island show strong nectar collection and strong pollen collection capacity, respectively (China National Commission of Animal Genetic Resources, Citation2011), reflecting their adaptation to different environments. And in apiaries, colonies with local queens survived obviously longer than colonies with introduced queens (Büchler et al., 2014). Overall, native bees outperformed introduced bees in terms of both ecological and economic value. Therefore, it is particularly important to protect the diversity of A. cerana, whose population has declined in recent decades (Theisen-Jones & Bienefeld, Citation2016). To protect this, it calls for a better understanding and effective protection of its biodiversity. For this, the crucial prerequisites we need are the classification status and detailed differentiation of A. cerana. The first comprehensive multivariate statistical analysis of this species was published by Ruttner (Citation1988) based on morphological data, which stated that A. cerana has four subspecies: A. c. cerana, A. c. indica, A. c. japonica, A. c. himalaya. The other two comprehensive studies of A. cerana across its full geographical range have been conducted by Smith et al. (Citation2000) using mitochondrial DNA and Radloff et al. (Citation2010) using morphometric characteristics, who identified 4 major groups of haplotypes and 6 morphoclusters of A. cerana, respectively. Compared with the western honey bees (A. mellifera), which were divided into nearly 30 subspecies (Engel, Citation1999; Ruttner, Citation1988), A. cerana classification is unclear. And all these 3 studies classified the majority of A. cerana in China as one group.
However, China occupies an extremely vast territory, having various and complex geographic environments and climate zones with a high degree of biodiversity. Previous researchers have studied ecotypes of A. cerana in China and classified A. cerana into nine ecotypes, including Hainan, Yungui Plateau, Tibet, Aba, Changbai mountains, south Yunnan, north China, south China, and central China (China National Commission of Animal Genetic Resources, Citation2011). Zhu et al. (Citation2022) divided A. cerana in China into 14 morphological clusters, including Hainan, southern Yunnan, Changbai mountains, Taiwan, Bomi (southeastern Tibet), Aba, Batang, Derong, Yajiang, Chuandian, Chuangui, Northwest, Southern and Northern. There also have been several studies with Chinese A. cerana populations suggesting large genetic differences, some of which are at the subspecies level (Chen et al., Citation2018; Ji et al., Citation2020; Li et al., Citation2019; Liu et al., Citation2016, Citation2022; Tan et al., Citation2016; Xu et al., Citation2013; Yin & Ji, Citation2013; Zhao et al., Citation2014) or high morphological variation (Liu et al., Citation2022; Peng et al., Citation1989; Radloff et al., Citation2010; Tan et al., Citation2003, Citation2006; Zhou et al., Citation2016; Zhu et al., Citation2017), even among populations from small geographic regions. Overall, these researches indicate great diversity of A. cerana in China, which still remains to be explored further.
Advances in understanding the drivers of divergence between honey bee populations have provided clues for further exploration. Notably, Chen et al. (Citation2018) found that geographical isolation such as high mountains and islands is the driving force for populations differentiation. Therefore, the QTP and islands in the South China Sea become interesting candidates. QTP lies in the southwest of China, with an average altitude of 4,000 meters above sea level. Since A. cerana is mainly observed below 3,500 meters (Yu et al., Citation2019), the eastern and southern parts of QTP could be suitable for the residence of A. cerana. This area is also considered an important biodiversity hotspot (Myers et al., Citation2000) that is a priority area that requires pollinator protection (Teichroew et al., Citation2017). The islands, including Hainan, Weizhou and Yongxing, located at the southern end of China in the tropical monsoon climate zone, are rich in flowering plants. Hainan Island, the second largest island in China, has a high degree of bee diversity (Chen et al., Citation2018; Ji et al., Citation2020). Weizhou Island and Yongxing Island are small in size (total areas of 27.74 and 2.13 km2 respectively). All these 3 islands are located in the South China Sea, with nectar sources to support populations of honey bee. As islands, they are geographically isolated and considered areas worth investigating. We hypothesize that these regions have potentially new A. cerana populations that are differentiated from known populations.
The methods for morphological studies of honey bees mainly include standard morphometry (SM) and geometric morphometrics (GM). As a traditional method, standard morphometry uses 36 morphometric characters and provided good discrimination among honey bee subspecies and populations (Ruttner, Citation1988). Geometric morphometrics in bees utilizes the wing shape, that is, landmark coordinates which are superimposed by translation, scaling and rotation in order to remove the effect of size (Bookstein, Citation1991; Rohlf & Marcus, Citation1993). Compared with the SM method, GM is only based on forewings as a new and labor-saving approach, without the requirements of other body parts. And now, geometric morphometrics were proven to be effective and widely used in the taxonomy of A. mellifera (Francoy et al., Citation2008; Kandemir et al., Citation2011; Miguel et al., Citation2011; Oleksa & Tofilski, Citation2015; Tofilski, Citation2008) and A. cerana (Frunze et al., Citation2022; Ji et al., Citation2020; Liu et al., Citation2022; Zhou et al., Citation2016).
In this study, we collected samples from QTP, Hainan Island, Yongxing Island and Weizhou Island, including regions that were previously thought to lack A. cerana populations. Furthermore, traditionally well-known populations were also sampled for comparison. To understand the variation among the samples, we used both standard morphometry and geometric morphometrics to explore the current situation of A. cerana population differentiation in the studied areas.
Materials and methods
The sampling of Apis cerana bees
A. cerana samples were collected from 17 regions (, Table S1). Of these, 12 regions are located in QTP, Hainan Island, Weizhou Island and Yongxing Island, and 5 reference populations are located in areas of relatively low and flat terrain in southern and eastern China. The sampling sites for the references span a large area of ∼600 km from north to south and ∼1,200 km from east to west.
Figure 1. Locations of A. cerana sampling sites.
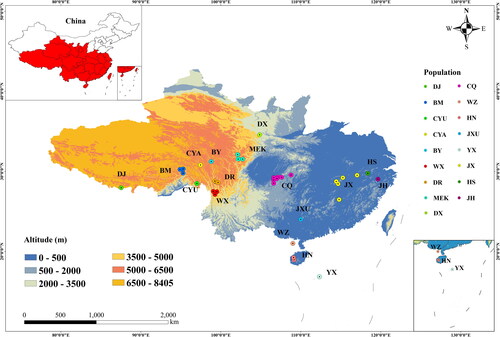
Worker bees were collected from colonies from wild nests or human-made hives populated with wild-caught swarms. A total of 140 colonies were collected, with five to ten colonies for each sampling site. For each colony, no less than 30 worker bees were collected and preserved in ethanol. Samples were deposited in the Institute of Apicultural Research, Chinese Academy of Agricultural Sciences.
Data acquisition
Ten worker bees per colony were dissected for morphometric analysis according to the methods described by Ruttner (Citation1988), and the dissected body parts were photographed by a LEICA DMS300 digital microscope. For the standard morphometry method, a total of 33 morphometric characters, corresponding to Ruttner (Citation1988) numbers of (1) to (3), (5) to (18), and (21) to (34), and two more characters, number of hamuli (Nh) and cubital index (Ci), were measured (Table S2). For the geometric morphometrics method, 19 landmarks on the forewings described by Meixner et al. (Citation2013) were identified.
TPS software series (Rohlf, Citation2008a, Citation2008b) were adopted to acquire 19 landmarks and size-related characters. Since the 19 landmark coordinates include the vertex coordinates of the wing venation angles, this paper used the landmark coordinates and a custom script in R statistical software (version 4.2.0) (Vienna, Austria) to get the angles. Then a subjective empirical classification of the pigmentation was done, classified into 10 grades ranging from 0 to 9 (from dark to light). Characters of hair were measured with a stereo microscope (ZEISS Stemi 508).
Morphometric analysis
For SM method, colony mean values were calculated for each character. For the GM method, the landmarks were aligned using the Procrustes fit method in R statistical software using the gpagen function in geomorph package (version 4.0.4) and then averaged across colonies. All further analyses were performed using the average values in R statistical software.
Principal component analysis (PCA) and linear discriminant analysis (LDA) of colony means were performed using geomorph and MASS (version 7.3-56) packages and plotted using ggplot2 (version 3.4.0) and factoextra (version 1.0.7) packages. The standard morphometry analysis was performed including all measured characters except (1) due to missing data. Relationships between the 33 morphometric characters and longitude, latitude and altitude were analyzed with the Pearson correlation using the Hmisc package (version 4.7-1). Multiple comparisons were corrected using the Bonferroni method.
Results
Standard morphometry analysis
A principal component analysis was performed to compare the 12 populations from QTP and islands to the 5 reference populations from plains (Figure S1). The island populations occupy the negative axis of PC1 and the positive axis of PC2, with little overlap with other populations. The QTP populations occupy the center and right of the PC1 axis, and the reference populations occupy the center of the PC1 axis and the negative axis of PC2. The island populations, some QTP populations and the reference populations are basically distinguishable from one another, while CYU, another QTP population, overlaps with the reference.
Further examination of the PCs shows PC1 accounted for 33.36% of the total variance while PC2 and PC3 accounted for 9.38% and 7.20%, respectively. PC1 was mainly associated with size-related characters (17), (7), (15), (16), (13), (18), (6), (11), (5), (12), (9) and (10); PC2 was mainly associated with color-related characters (33), (32), (34), cubital index and wing venation angle A4 (21); PC3 was mainly associated with angle-related characters (30) and (27) (Table S3). The characters with high importance were visualized as the quality of representation values in Figure S2. Out of the top five characters, 3 were size-related and 2 were color-related (Figure S2a), and all three pigmentation characters are among the top 10 characters (Figure S2b). The means and standard deviations of the 33 characters for each sampling site are given in Table S4.
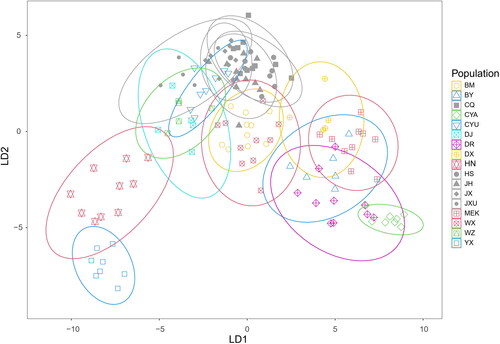
A discriminant analysis of the same dataset was also performed. LD1 (37.20% of total variance) were plotted against LD2 (18.47%) in . It could be seen that the reference populations (CQ, JX, HS, JH and JXU) were clustered closely together and overlapped with CYU from QTP. Two of the three islands, YX and HN, formed two separate clusters in the lower left corner of the plot, while the third island, WZ, slightly overlaps with DJ from QTP. The QTP populations, which occupied lots of positions in the center and right of LD1 axis and the positive axis of LD2 in the plot, indicate the obvious morphological differences. It was also noticed that the 5 reference populations were packed tightly together and formed much more compact clusters than other populations, indicating less intra-region variation in the reference populations and larger intra-region variation in the QTP and island populations.
Figure 2. Discriminant analysis plot of A. cerana populations based on colony means of 32 characters measured (LD1 vs. LD2), with confidence ellipses at 95%. Each symbol represents one colony. All reference populations (CQ, HS, JH, JX, and JXU) are shown in gray with different shapes for different populations.
Next, we explored the Pearson correlations among the 33 morphometric characters and longitude, latitude and altitude. We observed most hair-related characters and size-related characters are significantly positively correlated with the latitude or altitude, and significantly negatively correlated with the longitude (|r| > 0.25, p < 0.05, Table S5), suggesting with increasing latitude or altitude, the size of wings and body and the length of hairs increase, and with increasing longitude, the body size and wing size decrease. All the color-related characters, including (32), (33) and (34), are significantly positively correlated with the longitude and are significantly negatively correlated with the latitude and altitude, indicating with decreasing longitude or increasing latitude and altitude, the color of tergites become darker.
Geometric morphometrics analysis
We performed principal component analysis on the average wing morphology of the 17 populations, and obtained values for 34 principal components (the number of landmarks times the number of dimensions minus the degrees of freedom [4 for 2D], which is 19*2 − 4 = 34). In Figure S3, where principal component 1 (27.86%) is plotted against principal component 2 (12.69%), the QTP populations occupy the left and middle of the scatter plot, the reference populations occupy the middle, and the island populations occupy the right. And part of QTP populations, island populations and reference populations overlapped with each other.
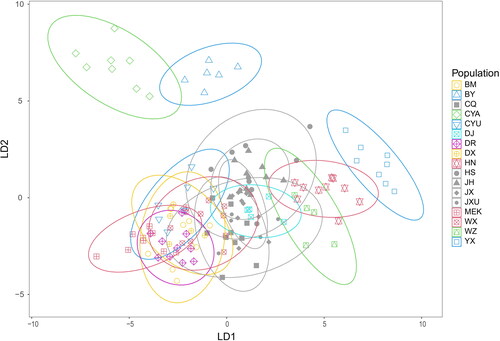
showed a scatter plot of discriminant analysis of 34 principal component values in PCA of GM, in which LD1 (27.86%) is plotted against LD2 (16.85%). And the same as Figure S3, the QTP populations occupy the left and middle of the scatter plot, the reference populations occupy the middle, and the island populations occupy the right while the three kinds of populations have large overlaps with each other. It was obvious that YX formed a separate cluster on the right of the plot, and CYA and BY formed two separate clusters in the top left corner.
Figure 3. Discriminant analysis plot of A. cerana populations based on wing shape (LD1 vs. LD2), with confidence ellipses at 95%. Each symbol represents one colony. All reference populations (CQ, HS, JH, JX, JXU) are shown in gray with different shapes for different populations.
Discussion
Our study gained a new understanding of A. cerana populations in China. We made special efforts to collect samples from the QTP, which we hypothesize to have a high diversity according to previous studies (Chen et al., Citation2018; Ji et al., Citation2020; Liu et al., Citation2022; Tan et al., Citation2016; Zhu et al., Citation2017, Citation2022). However, these studies either only include two to four commonly known sampling sites in the QTP, or sampling sites are skewed toward a certain region such as Sichuan Province, one of six provinces where the QTP is located, leaving many regions in QTP unexplored. In order to overcome the limitation of the lack of samples on bee diversity in the QTP, the sampling regions were further expanded in this study. Notably, we were able to collect samples from BY, a region that was previously reported to be free of A. cerana (Zhu et al., Citation2017). In addition, island samples, which are also isolated populations, are collected. We collected island samples in Hainan Island (HN), Weizhou Island (WZ) and Yongxing Island (YX). Among them, there have been a lot of studies on A. cerana in Hainan Island, which was considered a distinct ecotype (Wang et al., Citation2021; Zhao et al., Citation2014, Citation2017; Zhou et al., Citation2018), and very few studies in WZ and YX. To our knowledge, this is the first study to report the existence of A. cerana in BY, and the first morphometrical characterization of populations of CYA, CYU, DJ, BY, WZ and YX.
This study found the high morphometrical variation of A. cerana from QTP and islands, which can be distinguished by both standard morphometry analysis and geometric morphometrics analysis. Forty-five colonies from 5 plain regions in China were selected as reference populations, including CQ from an adjacent region of QTP and JXU from an adjacent region of islands. The reference populations are chosen in such a way that they covered a large area of south and east China, where the terrain is relatively flat and the altitudes are relatively low, without major physical barriers. Both SM and GM analyses showed large variation in QTP and island populations. The reference populations formed much more compact clusters, while QTP or island populations formed clusters with relatively less or no overlaps with each other, indicating the observed morphological differences within the reference populations were significantly smaller than those within QTP populations or island populations ( and ), even though the distribution range of the reference populations is about the same as that of QTP populations and much larger than that of island populations. In addition, the large overlaps among QTP populations reflect our dense sampling sites along the edge of QTP, because the smaller the distance between sample sites is, the less distinct the morphoclusters are (Radloff & Hepburn, Citation1998).
Our analyses identified three new morphological clusters that were previously unknown. Previous studies divided A. cerana in China into 9 ecotypes and 14 morphological clusters respectively (China National Commission of Animal Genetic Resources, Citation2011; Zhu et al., Citation2022). Four of these populations are also used in this study, including HN (Hainan ecotype, Hainan cluster), DR (Derong cluster), MEK (Aba ecotype, Aba cluster), and BM (Bomi cluster), which are considered to have a high differentiation and could also serve as valuable references. In , the discriminant analysis indicated YX formed a more distinctive cluster even than HN. In , the three most obvious clusters are formed by CYA, BY and YX. All these indicated that the morphology of honey bees in CYA, BY and YX had higher morphometric differentiation than others and could probably be new morphological clusters.
Our results further support the hypothesis that physical barriers are one of the main driving force of population differentiation (Chen et al., Citation2018), as indicated by the high variation of isolated populations located in islands or mountainous areas. These barriers may cause population differentiation through the reduction of gene flow. Genetic studies to quantify gene flow among the populations are needed to gain a further understanding of the differentiation of A. cerana populations.
In this study, we used characters of length, pigmentation, and angels. In the PCA of SM, characters of pigmentation showed high weight inPC2 and moderate weight in PC1 (Figure S2, Table S3). Previous studies have used pigmentation to distinguish between A. cerana and other bee species (Hadisoesilo et al., Citation1995; Lo et al., Citation2010; Oldroyd et al., Citation2006). However, the role of color in the classification of A. cerana subspecies remains unclear. Ruttner et al. (Citation1978) and Ruttner (Citation1988) described the measurement standard for measuring pigmentation, which was traditionally developed for A. mellifera. Rinderer et al. (Citation1989) found neither A. cerana nor A. koschevnikovi followed the exact patterns indicated for A. mellifera. Wang et al. (Citation2006) and Wang (Citation2007) made new criteria for scutellum, tergites and labrum for A. cerana, but we found it is not applicable to many of our samples in this study. Meanwhile, many studies did not include pigmentation characters. Another drawback of pigmentation characters is the subjectivity of measurement, especially when a new sample does not fit readily into any of the existing patterns. A recent study by Qiu et al. (Citation2023) promoted the use of wing morphological geometrics because wing vein angles were less associated with environmental factors. Here, our results support this approach in that the main pattern revealed by SM and GM is in accordance.
We observed correlations between morphometrical characters and environmental factors. Correlations of hair length, wing size, body size and pigmentation with latitude or altitude are observed, which is consistent with previous observations in A. cerana (Hepburn et al., Citation2001; Tan et al., Citation2003, Citation2006; Verma et al., Citation1994; Zhu et al., Citation2017, Citation2022). This could be related to the capability of nectar collection in low temperature environments, with greater resistance to the cold, foraging range (Greenleaf et al., Citation2007). It is worth noting that correlations were also observed between longitude and some morphometrical characters, however, this could be the result of the strong correlation between longitude and altitude (r = −0.81, p < 0.001) in our sampling sites. The terrain of China is high in the west and low in the east (You & Yang, Citation2013), resulting in the QTP samples collected at high altitudes with low longitude, and island or reference samples at low altitudes with high longitude.
At present, it is urgent to protect the native colonies of A. cerana in China. In the past decades, the number and distribution of A. cerana in China have declined by more than 75% (Yang, Citation2009), possibly due to parasites, pesticides, lack of flowers and the introduction of A. mellifera. One more thing to note is that the local A. cerana resources in different regions may also be at risk. Many colonies or queens of A. cerana from other regions were introduced by beekeepers for economic benefits, which may lead to the loss of local populations and therefore the loss of desirable traits adapted to the local environment. Previous studies highlighted the importance of promoting the use of endemic honey bee populations in apiculture (De la Rúa et al., Citation2013; Harpur et al., Citation2013). Here, we also call for the promotion of the use of local A. cerana populations. Studies found there are many small populations of A. cerana in QTP, whose effective population size is generally lower than 500 colonies (Yu et al., Citation2019; Zhu et al., Citation2017), making these populations unique and precious genetic resources but with a high risk of extinction. Honey bee populations in Weizhou Island and Yongxing Island are also small, due to the very small size of the islands. Our study showed the high level of morphological diversity of A. cerana from QTP, Hainan Island, Weizhou Island and Yongxing Island. Therefore, these particular A. cerana populations need to be protected as valuable genetic resources.
Conclusions
Through multivariate statistical analyses of both standard morphometry and geometric morphometrics, this study characterizes A. cerana populations to provide insights into the differentiation of A. cerana in China. We sampled A. cerana in a more comprehensive region in China, including areas where previously thought to be free of A. cerana, or where A. cerana is not previously morphologically analyzed, and large morphometrical variations were observed in the studied areas, especially CYA, BY and YX. The results of this study provide information that could elucidate the differentiation of A. cerana in different environments and could be used for the effective protection of A. cerana diversity in China.
Supplementary Material
Download MS Word (58.4 MB)Figure S3
Download JPEG Image (189.4 KB)
Figure S2c
Download JPEG Image (199.4 KB)
Figure S2b
Download JPEG Image (566.6 KB)
Figure S2a
Download JPEG Image (501.3 KB)
Figure S1
Download JPEG Image (299.2 KB)
Acknowledgments
The authors thank Yuyang Shen, Lijiao Gao and Gulinuer Tulaxi for their laboratory assistance, and beekeepers and local helpers for their help in collecting the samples.
Disclosure statement
No potential conflict of interest was reported by the authors.
Additional information
Funding
References
- Allen-Wardell, G., Bernhardt, P., Bitner, R., Burquez, A., Buchmann, S., Cane, J., Cox, P. A., Dalton, V., Feinsinger, P., Ingram, M., Inouye, D., Jones, C. E., Kennedy, K., Kevan, P., Koopowitz, H., Medellin, R., Medellin-Morales, S., Nabhan, G. P., Pavlik, B., … Walker, S. (1998). The potential consequences of pollinator declines on the conservation of biodiversity and stability of food crop yields. Conservation Biology, 12(1), 8–17.
- Bookstein, F. L. (1991). Morphometric tools for landmark data: Geometry and biology. Cambridge University Press.
- Büchler, R., Costa, C., Hatjina, F., Andonov, S., Meixner, M. D., Le Conte, Y., Uzunov, A., Berg, S., Bienkowska, M., Bouga, M., Drazic, M., Dyrba, W., Kryger, P., Panasiuk, B., Pechhacker, H., Petrov, P., Kezić, N., Korpela, S., & Wilde, J. (2014). The influence of genetic origin and its interaction with environmental effects on the survival of Apis mellifera L. colonies in Europe. Journal of Apicultural Research, 53(2), 205–214. https://doi.org/10.3896/IBRA.1.53.2.03
- Chen, C., Wang, H., Liu, Z., Chen, X., Tang, J., Meng, F., & Shi, W. (2018). Population genomics provide insights into the evolution and adaptation of the eastern honey bee (Apis cerana). Molecular Biology and Evolution, 35(9), 2260–2271. https://doi.org/10.1093/molbev/msy130
- China National Commission of Animal Genetic Resources. (2011). Animal genetic resources in China: Bees. China Agriculture Press.
- De la Rúa, P., Jaffé, R., Muñoz, I., Serrano, J., Moritz, R. F. A., & Bernhard Kraus, F. (2013). Conserving genetic diversity in the honeybee: Comments on Harpur et al. (2012). Molecular Ecology, 22(12), 3208–3210. https://doi.org/10.1111/mec.12333
- Engel, M. S. (1999). The taxonomy of recent and fossil honey bees (Hymenoptera: Apidae; Apis). Journal of Hymenoptera Research, 8(2), 165–196.
- Francoy, T. M., Wittmann, D., Drauschke, M., Müller, S., Steinhage, V., Bezerra-Laure, M. A. F., De Jong, D., & Gonçalves, L. S. (2008). Identification of Africanized honey bees through wing morphometrics: Two fast and efficient procedures. Apidologie, 39(5), 488–494. https://doi.org/10.1051/apido:2008028
- Frunze, O., Kim, J.-E., Kim, D.-W., Kang, E.-J., Kim, K., Park, B.-S., & Choi, Y.-S. (2022). Morphometric characterization of newly defined subspecies Apis cerana koreana (Hymenoptera: Apidae) in the Republic of Korea. Korean Journal of Applied Entomology, 61(3), 399–408. https://doi.org/10.5656/ksae.2022.05.0.027
- Greenleaf, S. S., Williams, N. M., Winfree, R., & Kremen, C. (2007). Bee foraging ranges and their relationship to body size. Oecologia, 153(3), 589–596. https://doi.org/10.1007/s00442-007-0752-9
- Hadisoesilo, S., Otis, G. W., & Meixner, M. (1995). Two distinct populations of cavity-nesting honey bees (Hymenoptera: Apidae) in South Sulawesi. Indonesia. Journal of the Kansas Entomological Society, 68(4), 399–407.
- Harpur, B. A., Minaei, S., Kent, C. F., & Zayed, A. (2013). Admixture increases diversity in managed honey bees: Reply to De la Rúa et al. (2013). Molecular Ecology, 22(12), 3211–3215. https://doi.org/10.1111/mec.12332
- Hepburn, H. R., & Radloff, S. E. (2011). Honeybees of Asia. Springer. https://doi.org/10.1007/978-3-642-16422-4
- Hepburn, H. R., Radloff, S. E., Verma, S., & Verma, L. R. (2001). Morphometric analysis of Apis cerana populations in the southern Himalayan region. Apidologie, 32(5), 435–447. https://doi.org/10.1051/apido:2001142
- Hu, X. J., Zhou, S. J., Xu, X. J., Yu, Y. L., Hu, J. J., Zhang, Z. Y., Qi, W. Z., Wang, B., Yuan, C. Y., Xi, F. G., & Zhou, B. F. (2022). Morphological differentiation in the Asian honey bees (Apis cerana) in China. Acta Entomologica Sinica, 65(7), 912–926. https://doi.org/10.16380/j.kcxb.2022.07.013
- Hung, K.-L. J., Kingston, J. M., Albrecht, M., Holway, D. A., & Kohn, J. R. (2018). The worldwide importance of honey bees as pollinators in natural habitats. Proceedings of the Royal Society B: Biological Sciences, 285(1870), 20172140. https://doi.org/10.1098/rspb.2017.2140
- Ji, Y., Li, X., Ji, T., Tang, J., Qiu, L., Hu, J., Dong, J., Luo, S., Liu, S., Frandsen, P. B., Zhou, X., Parey, S. H., Li, L., Niu, Q., & Zhou, X. (2020). Gene reuse facilitates rapid radiation and independent adaptation to diverse habitats in the Asian honeybee. Science Advances, 6(51), eabd3590. https://doi.org/10.1126/sciadv.abd3590
- Kandemir, İ., Özkan, A., & Fuchs, S. (2011). Reevaluation of honeybee (Apis mellifera) microtaxonomy: A geometric morphometric approach. Apidologie, 42(5), 618–627. https://doi.org/10.1007/s13592-011-0063-3
- Kremen, C., Williams, N. M., Aizen, M. A., Gemmill-Herren, B., LeBuhn, G., Minckley, R., Packer, L., Potts, S. G., Roulston, T., Steffan-Dewenter, I., Vazquez, D. P., Winfree, R., Adams, L., Crone, E. E., Greenleaf, S. S., Keitt, T. H., Klein, A.-M., Regetz, J., & Ricketts, T. H. (2007). Pollination and other ecosystem services produced by mobile organisms: A conceptual framework for the effects of land-use change. Ecology Letters, 10(4), 299–314. https://doi.org/10.1111/j.1461-0248.2007.01018.x
- Li, Y., Chao, T., Fan, Y., Lou, D., & Wang, G. (2019). Population genomics and morphological features underlying the adaptive evolution of the eastern honey bee (Apis cerana). BMC Genomics, 20(1), 869. https://doi.org/10.1186/s12864-019-6246-4
- Liu, F., Shi, T., Huang, S., Yu, L., & Bi, S. (2016). Genetic structure of Mount Huang honey bee (Apis cerana) populations: Evidence from microsatellite polymorphism. Hereditas, 153(1), 8. https://doi.org/10.1186/s41065-016-0010-4
- Liu, N., Liu, H., Ju, Y., Li, X., Li, Y., Wang, T., He, J., Niu, Q., & Xing, X. (2022). Geometric morphology and population genomics provide insights into the adaptive evolution of Apis cerana in Changbai Mountain. BMC Genomics, 23(1), 64. https://doi.org/10.1186/s12864-022-08298-x
- Lo, N., Gloag, R. S., Anderson, D. L., & Oldroyd, B. P. (2010). A molecular phylogeny of the genus Apis suggests that the giant honey bee of the Philippines, A. breviligula Maa, and the plains honey bee of southern India, A. indica Fabricius, are valid species. Systematic Entomology, 35(2), 226–233. https://doi.org/10.1111/j.1365-3113.2009.00504.x
- Meixner, M. D., Pinto, M. A., Bouga, M., Kryger, P., Ivanova, E., & Fuchs, S. (2013). Standard methods for characterising subspecies and ecotypes of Apis mellifera. Journal of Apicultural Research, 52(4), 1–28. https://doi.org/10.3896/IBRA.1.52.4.05
- Miguel, I., Baylac, M., Iriondo, M., Manzano, C., Garnery, L., & Estonba, A. (2011). Both geometric morphometric and microsatellite data consistently support the differentiation of the Apis mellifera M evolutionary branch. Apidologie, 42(2), 150–161. https://doi.org/10.1051/apido/2010048
- Myers, N., Mittermeier, R. A., Mittermeier, C. G., da Fonseca, G. A. B., & Kent, J. (2000). Biodiversity hotspots for conservation priorities. Nature, 403(6772), 853–858. https://doi.org/10.1038/35002501
- National Research Council. (2007). Status of pollinators in North America. The National Academic Press. https://doi.org/10.17226/11761
- Oldroyd, B. P., Reddy, M. S., Chapman, N. C., Thompson, G. J., & Beekman, M. (2006). Evidence for reproductive isolation between two colour morphs of cavity nesting honey bees (Apis) in south India. Insectes Sociaux, 53(4), 428–434. https://doi.org/10.1007/s00040-005-0889-2
- Oleksa, A., & Tofilski, A. (2015). Wing geometric morphometrics and microsatellite analysis provide similar discrimination of honey bee subspecies. Apidologie, 46(1), 49–60. https://doi.org/10.1007/s13592-014-0300-7
- Ollerton, J., Winfree, R., & Tarrant, S. (2011). How many flowering plants are pollinated by animals? Oikos, 120(3), 321–326. https://doi.org/10.1111/j.1600-0706.2010.18644.x
- Peng, Y. S., Nasr, M. E., & Locke, S. J. (1989). Geographical races of Apis cerana Fabricius in China and their distribution. Review of recent Chinese publications and a preliminary statistical analysis. Apidologie, 20(1), 9–20. https://doi.org/10.1051/apido:19890102
- Potts, S. G., Imperatriz-Fonseca, V., Ngo, H. T., Aizen, M. A., Biesmeijer, J. C., Breeze, T. D., Dicks, L. V., Garibaldi, L. A., Hill, R., Settele, J., & Vanbergen, A. J. (2016). Safeguarding pollinators and their values to human well-being. Nature, 540(7632), 220–229. https://doi.org/10.1038/nature20588
- Qiu, L., Dong, J., Li, X., Parey, S. H., Tan, K., Orr, M., Majeed, A., Zhang, X., Luo, S., Zhou, X. J., Zhu, C., Ji, T., Niu, Q., Liu, S., & Zhou, X. (2023). Defining honeybee subspecies in an evolutionary context warrants strategized conservation. Zoological Research, 44(3), 483–493. https://doi.org/10.24272/j.issn.2095-8137.2022.414
- Radloff, S. E., Hepburn, C., Hepburn, H. R., Fuchs, S., Hadisoesilo, S., Tan, K., Engel, M. S., & Kuznetsov, V. (2010). Population structure and classification of Apis cerana. Apidologie, 41(6), 589–601. https://doi.org/10.1051/apido/2010008
- Radloff, S. E., & Hepburn, H. R. (1998). The matter of sampling distance and confidence levels in the subspecific classification of honeybees, Apis mellifera L. Apidologie, 29(6), 491–501. https://doi.org/10.1051/apido:19980602
- Rinderer, T. E., Koeniger, N., Tingek, S., Mardan, M., & Koeniger, C. (1989). A morphological comparison of the cavity dwelling honeybees of Borneo Apis koschevnikovi (Buttel-Reepen, 1906) and Apis cerana (Fabricius, 1793). Apidologie, 20(5), 405–411. https://doi.org/10.1051/apido:19890505
- Rohlf, F. J. (2008a). tpsDIG, version 2.32. Stony Brook.
- Rohlf, F. J. (2008b). tpsUtil, version 1.81. Stony Brook.
- Rohlf, F. J., & Marcus, L. F. (1993). A revolution morphometrics. Trends in Ecology & Evolution, 8(4), 129–132. https://doi.org/10.1016/0169-5347(93)90024-j
- Ruttner, F. (1988). Biogeography and taxonomy of honeybees. Springer. https://doi.org/10.1007/978-3-642-72649-1
- Ruttner, F., Tassencourt, L., & Louveaux, J. (1978). Biometrical-statistical analysis of the geographic variability of Apis mellifera L. I. Material and methods. Apidologie, 9(4), 363–381. https://doi.org/10.1051/apido:19780408
- Smith, D. R., Villafuerte, L., Otis, G., & Palmer, M. R. (2000). Biogeography of Apis cerana F. and A. nigrocincta Smith: Insights from mtDNA studies. Apidologie, 31(2), 265–279. https://doi.org/10.1051/apido:2000121
- Tan, K., Fuchs, S., Koeniger, N., & Zan, R. G. (2003). Morphological characterization of Apis cerana in the Yunnan Province of China. Apidologie, 34(6), 553–561. https://doi.org/10.1051/apido:2003049
- Tan, K., Meixner, M. D., Fuchs, S., Zhang, X., He, S., Kandemir, İ., Sheppard, W. S., & Koeniger, N. (2006). Geographic distribution of the eastern honeybee, Apis cerana (Hymenoptera: Apidae) across ecological zones in China: Morphological and molecular analyses. Systematics and Biodiversity, 4(4), 473–482. https://doi.org/10.1017/S1477200006002015
- Tan, K., Qu, Y., Wang, Z., Liu, Z., & Engel, M. S. (2016). Haplotype diversity and genetic similarity among populations of the Eastern honey bee from Himalaya-Southwest China and Nepal (Hymenoptera: Apidae). Apidologie, 47(2), 197–205. https://doi.org/10.1007/s13592-015-0390-x
- Teichroew, J. L., Xu, J., Ahrends, A., Huang, Z. Y., Tan, K., & Xie, Z. (2017). Is China’s unparalleled and understudied bee diversity at risk? Biological Conservation, 210, 19–28. https://doi.org/10.1016/j.biocon.2016.05.023
- Theisen-Jones, H., & Bienefeld, K. (2016). The Asian honey bee (Apis cerana) is significantly in decline. Bee World, 93(4), 90–97. https://doi.org/10.1080/0005772X.2017.1284973
- Tofilski, A. (2008). Using geometric morphometrics and standard morphometry to discriminate three honeybee subspecies. Apidologie, 39(5), 558–563. https://doi.org/10.1051/apido:2008037
- Verma, L. R., Mattu, V. K., & Daly, H. V. (1994). Multivariate morphometrics of the Indian honeybee in the northwest Himalayan region. Apidologie, 25(2), 203–223. https://doi.org/10.1051/apido:19940208
- Wang, G. (2007). Research on diversity and classification of Apis cerana from North China [Doctoral dissertation]. Shandong Agricultural University. CNKI. https://kns.cnki.net/KCMS/detail/detail.aspx?dbname=CDFD9908&filename=2007135596.nh
- Wang, G. Z., Shi, W., Zhang, X. L., Lv, L. P., & Ding, G. L. (2006). Criterion about tergum pigmentation of Apis cerana. Apiculture of China, 57(5), 7–8.
- Wang, S., Gao, J., Liu, J., & Zhao, D. (2021). Morphometric characterization of Apis cerana hainana (Hymenoptera: Apidae) in Hainan province, PR China. Journal of Apicultural Research, 60(2), 337–340. https://doi.org/10.1080/00218839.2020.1753326
- Xu, X., Zhu, X., Zhou, S., Wu, X., & Zhou, B. (2013). Genetic differentiation between Apis cerana cerana populations from Damen Island and adjacent mainland in China. Acta Ecologica Sinica, 33(3), 122–126. https://doi.org/10.1016/j.chnaes.2013.02.001
- Yang, G. (2009). The role of Apis cerana cerana in forest ecosystem in China. Apiculture of China, 60(4), 5–7.
- Yin, L., & Ji, T. (2013). Genetic diversity of the honeybee Apis cerana in Yunnan, China, based on mitochondrial DNA. Genetics and Molecular Research: GMR, 12(2), 2002–2009. https://doi.org/10.4238/2013.June.20.1
- You, L., & Yang, J. (2013). Geomorphology in China. Science Press.
- Yu, Y., Zhou, S., Zhu, X., Xu, X., Wang, W., Zha, L., Wang, P., Wang, J., Lai, K., Wang, S., Hao, L., & Zhou, B. (2019). Genetic differentiation of eastern honey bee (Apis cerana) populations across Qinghai-Tibet Plateau-Valley landforms. Frontiers in Genetics, 10, 483. https://doi.org/10.3389/fgene.2019.00483
- Zhao, W., Tan, K., Zhou, D., Wang, M., Cheng, C., Yu, Z., Miao, Y., & He, S. (2014). Phylogeographic analysis of Apis cerana populations on Hainan Island and southern mainland China, based on mitochondrial DNA sequences. Apidologie, 45(1), 21–33. https://doi.org/10.1007/s13592-013-0223-8
- Zhao, W., Wang, M., Liu, Y., Gong, X., Dong, K., Zhou, D., & He, S. (2017). Phylogeography of Apis cerana populations on Hainan island and southern mainland China revealed by microsatellite polymorphism and mitochondrial DNA. Apidologie, 48(1), 63–74. https://doi.org/10.1007/s13592-016-0450-x
- Zhou, S., Zhu, X., Xu, X., Gao, J., & Zhou, B. (2018). Multivariate morphometric analysis of local and introduced populations of Apis cerana (Hymenoptera: Apidae) on Hainan Island, China. Journal of Apicultural Research, 57(3), 374–381. https://doi.org/10.1080/00218839.2018.1455439
- Zhou, S., Zhu, X., Xu, X., Zheng, X., & Zhou, B. (2016). Assessing of geometric morphometrics analyses in microtaxonomy of the Apis cerana Fabricius (Hymenoptera: Apidae) within China. Journal of the Kansas Entomological Society, 89(4), 297–305. https://doi.org/10.2317/0022-8567-89.4.297
- Zhu, X., Zhou, S., Xu, X., Wang, J., Yu, Y., Yang, K., Luo, Q., Xu, Y., Wang, S., & Zhou, B. (2017). Morphological differentiation in Asian honey bee (Apis cerana) populations in the basin and highlands of southwestern China. Journal of Apicultural Research, 56(3), 203–209. https://doi.org/10.1080/00218839.2017.1306374
- Zhu, X., Zhou, S., Xu, X., Yu, Y., Hu, J., Zhang, Z., Qi, W., Wang, B., Yuan, C., Xi, F., & Zhou, B. (2022). Morphological differentiation in the Asian honey bees (Apis cerana) in China. Acta Entomologica Sinica, 65(7), 912–926. https://doi.org/10.16380/j.kcxb.2022.07.013