
 ?Mathematical formulae have been encoded as MathML and are displayed in this HTML version using MathJax in order to improve their display. Uncheck the box to turn MathJax off. This feature requires Javascript. Click on a formula to zoom.
Abstract
In this chapter we present a synthesis of recommendations for conducting field experiments with honey bees in the context of agricultural pollination. We begin with an overview of methods for determining the mating system requirements of plants and the efficacy of specific pollinators. We describe methods for evaluating the pollen-vectoring capacity of bees at the level of individuals or colonies and follow with methods for determining optimum colony field stocking densities. We include sections for determining post-harvest effects of pollination, the effects of colony management (including glasshouse enclosure) on bee pollination performance, and a brief section on considerations about pesticides and their impact on pollinator performance. A final section gives guidance on determining the economic valuation of honey bee colony inputs at the scale of the farm or region. Métodos estándar para la investigación de la polinización con Apis mellifera 2.0 En este capítulo presentamos una síntesis de recomendaciones para realizar experimentos de campo con abejas melíferas en el contexto de la polinización agrícola. Comenzamos con una visión general de los métodos para determinar los requisitos del sistema de apareamiento de las plantas y la eficacia de polinizadores específicos. Se describen métodos para evaluar la capacidad de las abejas para transportar polen a nivel individual o de colonias, y se presentan métodos para determinar la densidad óptima de colonias en el campo. Se incluyen secciones para determinar los efectos de la polinización después de la cosecha, los efectos del manejo de las colonias (incluido el confinamiento en invernadero) sobre el rendimiento de la polinización de las abejas, y una breve sección sobre consideraciones acerca de los pesticidas y su impacto en el rendimiento de los polinizadores. Una última sección ofrece orientaciones para determinar la valoración económica de los insumos de las colonias de abejas melíferas a escala de explotación o región. 西方 蜜 蜂 授 粉 研 究 的 标 准 方 法 2.0 在本章中, 我们提出了在农业授粉的背景下对蜜蜂进行田间实验的综合建议。我们首 先概述了确定植物交配系统需求和特定传粉昆虫功效的方法。我们描述了评估蜜蜂个 体和蜂群携带花粉能力的方法, 随后介绍了确定最佳群体田间放养密度的方法。我们 还加入了几个章节: 确定授粉的采后效应, 蜂群管理(包括温室)对蜜蜂授粉性能的影响, 以及杀虫剂及其对传粉昆虫性能的影响。最后一节给出了在农场或地区水平上确定蜜 蜂蜂群投入的经济价值的指导。
Introduction
This chapter describes field and laboratory procedures for doing experiments on honey bee pollination. Most of the methods also apply to any insect for whom pollen vectoring capacity is the question. What makes honey bee pollination distinctive is its historic emphasis on agricultural applications; hence one finds a preoccupation with matters of bee densities, behaviors, and management strategies with a view to optimizing crop yields and quality of yields. However, the same methods can also be modified to address broader questions on plant fitness and ecosystem-level interactions.
This manuscript serves as an update to an earlier BEEBOOK manuscript originally published by some members of the current author team (Delaplane et al., Citation2013).
Plant pollination requirements
The impact of any pollinator, whether in terms of agricultural production or plant fitness, is an interaction between at least two dynamics—the pollen vectoring capacity of the flower visitor and the genetic obligation, or responsiveness, of the plant to pollen deposition on its stigmas (Delaplane, Citation2012). Most of this chapter is devoted to appraising pollen vectoring capacity, but in this section, we begin with the underlying demands of the plant because this is the necessary starting point for understanding and contextualizing any pollination syndrome—the suite of flower characters derived by natural selection in response to pollinating agents, whether biotic or abiotic (Faegri & Van Der Pijl, Citation1979).
To begin, pollination is the transfer of pollen from the anthers to the stigma of flowers of the same species and is essential to the reproduction of most angiosperms (flowering plants). Pollination success is often measured in terms of percentage fruit- or seed set. Fruit- or seed-set is the ratio of ripe fruit or seeds relative to initial number of available flowers or ovules, respectively. This ratio is rarely 100% owing to such factors as normal levels of fruit abortion, suboptimal pollination conditions, herbivory, or cultural problems. In addition to pollination, two other terms are also often used. The first is pollen limitation which occurs when plant reproductive success (fruit/seed quantity and/or quality) is affected due to the deposition of insufficient, incompatible or low-quality pollen grains (Ashman et al., Citation2004). The other is pollination limitation (often interchangeably used as pollinator limitation) which occurs due to a result of scarce pollinator populations in the landscape or self-pollination capacity of the plants themselves (Fernández et al., Citation2012).
The degree to which a plant species depends on a particular pollinator is determined in part by the mating and breeding system of the plant (). Some plants can produce seeds or fruits without pollination, and understanding this process is important for understanding when the pollinator, such as the honey bee, can or cannot contribute to fruit- or seed-set and yield enhancement. Asexual reproduction through non-fertilized seeds is called apomixis or agamospermy. Apomixis happens when an embryo is formed either from an unfertilized egg within a diploid embryo sac that was formed without completing meiosis (blackberries, dandelions) or from the diploid nucleus tissue surrounding the embryo sac (some Citrus species, some mango varieties). When fruit forms without fertilization of ovules, either naturally or chemically-induced, this is called vegetative parthenocarpy (banana, pineapple, seedless cucumber). In neither apomixis nor parthenocarpy fertilization occurs, and pollination is not required. However, in some plant species pollination or some other stimulation is required to produce parthenocarpic fruits, a chief example being seedless watermelon (a type of stimulative parthenocarpy). Also, in many apomitic plants apomixis does not always occur, or occurs only partially, and sexual reproduction can also take place (Citrus species and mango).
Figure 1. Plant mating systems and pollination requirements, as determined from the results of flower bagging tests.
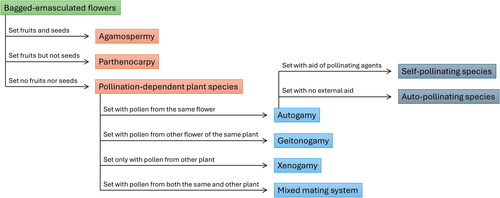
Most angiosperms, however, need pollination to set seeds and fruits, and with the exception of those whose flowers are capable of autopollinating (for example many beans, soybean, peach, peanuts) they rely on agents to vector the pollen. Angiosperms have basically two mating systems: outcrossing (xenogamy) in which pollination occurs between plants with different genetic constitutions, and selfing (autogamy) in which no mixing of different genetic material occurs other than through recombination. Outcrossing is achieved by cross pollination, resulting from the transfer of pollen between different flowers of different plants of the same species, while selfing is the outcome of pollen transfer within the same flower (self-pollination) or between different flowers of the same plant (geitonogamy). Some plant species are strictly xenogamous while others are autogamous, but mixed mating systems in which plants use outcrossing and autogamy or even outcrossing, autogamy and agamospermy are not uncommon (Rizzardo et al., Citation2012).
The extent to which an angiosperm responds to pollination and the fraction of that pollination that is selfed or out-crossed vary greatly by plant species or variety, and in any particular case a flower visitor must meet specific needs to qualify as a legitimate pollinator. In hybrid vegetable seed production, for example, an efficient pollinator has to transfer pollen from the anthers of male fertile flowers to the stigma of male sterile (female) flowers (Gabai et al., Citation2018). We describe below some field methods for determining the mating system and pollination requirements of plants and the potential pollination role of abiotic and biotic agents, focusing on the level of the individual plant rather than the plant population and drawing heavily upon the following published works (Dafni et al., Citation2005; Freitas & Paxton, Citation1996, Citation1998; Mesquida et al., Citation1988; Pierre et al., Citation2010; Sampson & Cane, Citation2000; Spears, Citation1983; Vaissière et al., Citation2011).
Determining plant mating system
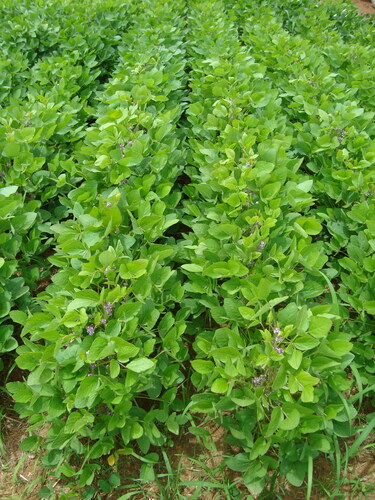
When trying to determine a plant mating system, one can use each of the methods described here as experimental treatments or select only those that appear most relevant to the plant species of interest. In all cases, a positive control in which flowers are marked but otherwise left available for open pollination is necessary to provide a reference for comparison with the manipulative treatments (). In some cases, it is also necessary to provide a negative control in which flowers are excluded from all flower visitors for the duration of their dehiscence. It is preferable to reduce background variation by applying distinct treatments to flowers of the same inflorescence, branch, or plant depending on flower abundance and size of the plant.
Figure 2. Open pollination treatment in soybean plantation: flowers are marked and left open for floral visitors.
In the following sections, the performance of a pollinator is implied by the field-scale observation of subsequent fruit- or seed-set. It is also appropriate to measure pollen vectoring capacity at the level of viable pollen on the bee and pollen deposited by the bee onto the stigma. These techniques are covered in Identifying and Evaluating Pollen Quantity and Quality Transported by Bees and Evaluating Pollen Identity, Quantity and Quality on Stigmas sections.
Testing for agamospermy (asexual reproduction through non-fertilized seeds)
This test will tell us whether a plant species sets seeds without pollination. If this is so, honey bees cannot contribute to seed- or fruit-set.
Choose a given number of flower buds prior to anthesis. The number of buds may vary with availability and ease of access, but larger samples produce more reliable results.
Protect half of these buds with pollination bags () and leave the other half unbagged as control. Pollination bags are typically made of sheer nylon or similar fine fabric that excludes insects but permits entry of air and light (but not pollen, as opposed to muslin bags, see below). They are usually semi-transparent nylon and have draw strings to secure the bag around the flower pedicel. The flower should be positioned as much as possible in the center of the bag so that the mesh does not touch the flower. Identify each treatment with weather-resistant tags. In the case of multiple flowers on an inflorescence, a swipe of acrylic paint on the pedicel works well for identifying the treatments. Testing for agamospermy can also be done in a greenhouse without exclusion bags and is thereby easier.
Before anther dehiscence (depending on the flower species this may happen prior to anthesis), remove the bag () and emasculate the flower using a fine pair of forceps to minimize injury to floral tissue. After emasculation, replace the pollination bag on the flower to prevent undesired action of pollinating agents. The bags should remain on the flowers while the stigmas are receptive and can be removed afterwards. It is important for the investigator to become familiar with the time of day or floral morphology stage that are conducive to stigma receptivity for a given plant species. Check Evaluating Stigmatic Receptivity section for studying stigmatic receptivity.
After ovule maturation is apparent in the pollinated treatments, check whether fruit has developed from the bagged and emasculated flowers. If none is present, one can conclude that the plant species does not exhibit agamospermy. If fruit does develop, it is necessary to wait until fruit ripening to check for seeds because some plants are parthenocarpic (produce fruits with no seeds and do not depend on pollination). If seeds are set, compare the number of fruits and seeds set per fruit from the emasculated and bagged flowers with those from the control treatments to estimate the proportion of seeds set by agamospermy in that particular plant species.
Figure 3. Restricted pollination treatment: a watermelon flower is bagged throughout its life to prevent honey bee visitation.
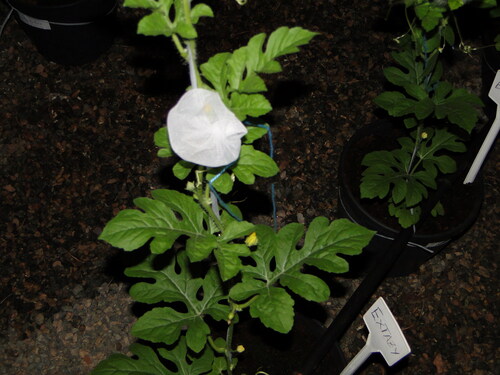
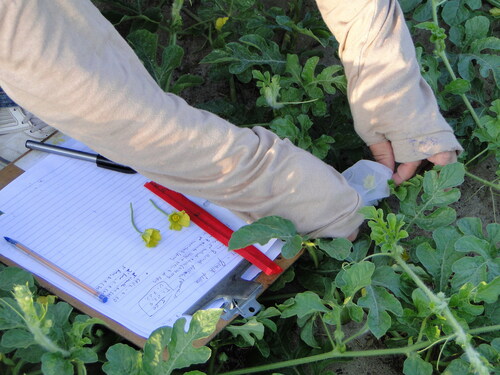
Figure 4. Unbagging watermelon flower for hand pollination.
It is important that assessments of seed- or fruit-set occur as early as possible to minimize underestimating the yield set because of losses that occur between set and harvest.
Testing for autogamy (auto- or self-pollination)
This test will tell us whether the flower can set seeds and fruits from its own pollen. In such a situation, the contribution of flower visitors may be little or none, but even in auto-pollinating plants the movements of bees inside the flower can sometimes optimize pollen transfer from anthers to the stigma and increase fruit- or seed-set. Auto-pollination or self-pollination should be distinguished from geitonogamy (see next section). Auto-pollination is associated with hermaphroditic flowers and pollen transfer within that flower that is automatic (soybean) or pollinator-optimized, whereas geitonogamy could apply to monoecious (unisexual male and female flowers on the same plant) plants in which pollen is self-compatible. However, the actions of a pollen vector are nevertheless needed.
Choose a given number of flower buds prior to anthesis. The investigator must become familiar with the flowering pattern of the model plant because flowers in some species open and close more than once, making anthesis difficult to determine. The number of buds may vary with availability and ease of access, but larger samples produce more reliable results.
Protect two-thirds of these buds with pollination bags and leave the other third unbagged as open controls, or in the case of pollinator shortage, pollinate these flowers manually with pollen from another plant of the same species. Identify each treatment with weather-resistant tags.
After anther dehiscence and when stigmas are receptive, remove the bags of half of the protected flowers (one third of the total marked buds) and hand-pollinate the stigmas with a soft brush using pollen from the anthers of the same flower. Dehiscence can usually be recognized as anthers with a split in the anther wall, pore, or flap that is exposing the pollen. After hand-pollinating, re-bag the flowers to prevent flower visitors or wind pollination. Leave bags on flowers until they are no longer receptive, then remove the bags.
At the end of the season, check whether fruit developed from the flowers that remained bagged throughout the experiment. If all or most of these flowers have developed into fruit, that means the plant species is autogamous and its flowers are capable of auto- or self-pollinating. Honey bees can contribute minimally to increasing fruit- or seed-set. If only the hand-pollinated flowers developed into fruits, this means that the plant species is autogamous, but flowers need a pollinating agent to transfer the pollen grains from their anthers to the stigmas within the flower. In this case, pollinators, such as honey bees, may be of great value. The proportion of fruit- or seed-set obtained from the bagged treatment in comparison to the hand-pollinated treatment will tell the comparative strength of autogamy in this plant species (strictly autogamous, highly autogamous, etc.). If no bagged flowers produce fruit or seeds, this means the species may be self-incompatible and probably needs cross pollen to set fruits and seeds. However, sometimes a few fruits or seeds can set even in self-incompatible plants because self-recognition can be incomplete. But in this case, there is little variation in fruit- or seed-set among the treated plants. One should not confound self-incompatibility with self-sterility resulting from inbreeding depression because in the latter case seed set varies greatly among treated flowers, ranging from low values in more inbred plants to high values in less inbred ones. Confirmation of self-incompatibility must be done by examining pollen tube growth in the pistil, a subject covered in 3.1.5.
Testing for geitonogamy (selfing within the same plant)
Some flower species do not set fruits/seeds when self-pollinated but do so when receiving pollen from other flowers of the same plant (geitonogamy). This can happen between perfect (hermaphroditic) flowers, but it is obligatory in autogamous plants which are monoecious. This test will tell us whether the flower can set seeds and fruits when receiving pollen from other flowers of the same plant. This is important information because honey bees tend to explore many flowers per plant before moving to other plants, and this behavior favors geitonogamy.
Repeat the procedures for testing for autogamy, but replace the treatment using the flower’s own pollen for a treatment using pollen from another flower on the same plant.
Conclusions are similar to those above for testing autogamy, except that if fruits or seeds developed from the geitonogamy treatment it means that the plant sets seed/fruit when pollen is transferred between its own flowers. The proportion of fruit- or seed-set obtained from the geitonogamy treatment in relation to the control treatment will tell the extent to which the plant is responsive to this mode of mating system.
Testing for xenogamy (reliance on out-crossing)
In xenogamy, or cross-pollination, the transfer of pollen to the stigma must occur between plants of same species with different genetic constitutions; the result is offspring with greater genetic diversity (hybrid vigor) than those for species exhibiting self-pollination or geitonogamy. Cross-pollination is also important because some plant varieties, genotypes, and even individuals are entirely self-incompatible and obligated to receive pollen from another variety, genotype, or individual to set fruits. Even self-fertile plants may produce more fruit or seeds of better quality when cross-pollinated than when self-pollinated, and the extent of this can be determined if outcrossing and selfing (within flower/within plant) are tested at the same time. Crops which grow from highly outcrossed seeds are often more vigorous than ones grown from inbred seeds. Finally, xenogamy is of paramount importance for the production of hybrid varieties and hybrid seeds, both of which are of increasing importance in modern horticultural and agricultural practices.
Knowing the extent to which a plant is obligated to xenogamy helps researchers and growers manage bees optimally and combine compatible cross-pollinating varieties (called pollenizers) to promote high rates of pollen transfer (Free, Citation1993; Jay, Citation1986).
Repeat the procedures for testing for autogamy, but replace the treatment using the flower’s own pollen for one using pollen from a flower of a different plant. In order to prevent using genetically related pollen (parents or siblings), do not collect pollen from plants close to the one whose flowers will be tested.
In order to identify compatible pollenizers, the experimental design requires a systematic selection and application of pollen from a number of different varieties of the same plant species. Finding compatible pollenizers is crucial for many commercially important crops such as almond, apple, and plum and is a standard feature of commercial grower guides for planning orchard plantations.
Conclusions are similar to those when testing for autogamy, except that if only the xenogamy treatment develop fruit it means that the plant species is xenogamous and its flowers need a pollinating agent to transfer pollen between flowers of different plants. In this case, honey bees can be of great value. The proportion of fruit- or seed-set obtained from the cross pollination treatment in comparison to the control will tell the extent to which the plant is reliant on a xenogamous mating scheme (strictly xenogamous, highly xenogamous, etc.).
Testing for mixed mating systems
Many plants can set fruit both from self and cross pollen, resulting in a mixed mating system that ensures fruit- or seed-set under autogamy and xenogamy, although one or another may predominate. This test will tell us the extent to which a plant is responsive to either mating scheme.
Choose a given number of flower buds prior to anthesis. The number of buds may vary with availability and ease of access, but larger samples produce more reliable results.
Protect three fourths of these buds with pollination bags and leave the other one fourth unbagged as the control. Identify each treatment with weather-resistant tags.
After anther dehiscence and when the stigmas are receptive, remove all bags and hand pollinate one third of the flowers each with its own pollen, one third with pollen from another flower of the same plant, and the final third with pollen from multiple plants. After that, bag the flowers again to prevent flower visitors or wind pollination. Leave bags on flowers until they are no longer receptive, then remove the bags.
At the end of the season, check whether any fruit developed from the bagged flowers. If all or most bagged flowers have developed into fruits that means the plant species has a mixed mating system and the proportion of fruit- or seed-set obtained from the bagged treatments in comparison to the control treatment will determine whether self-pollination, geitonogamy or xenogamy predominates. In the case of mixed breeding systems, honey bees can be highly effective pollinators.
Testing for pollinating agents and pollination deficit
Once one has learned about the plant mating system, it is of paramount importance to determine the agents capable of pollinating the flowers. Candidate pollinating agents can be abiotic (wind, water, gravity, electrostatic forces, rain) or biotic (birds, bats, insects and even mammals), but most of the time wind and insects are the major pollinators, and we will concentrate on these. It is useful to know whether a pollinating agent can meet the plant’s full potential fruit-set or only a fraction of it. In the latter case, the plant may be under a pollination deficit and its fruit or seed production sub-optimal.
Testing for wind pollination (anemophily)
This test will tell us the extent to which a flower species is wind pollinated (anemophilous). It can be exclusively anemophilous in which pollinators do not contribute to fruit- or seed-set or partially anemophilous in which case pollinators can be useful for optimizing yield, examples of which include coconut, canola, olive and castor bean.
Choose a given number of flower buds/inflorescences prior to anthesis.
Protect half of these buds/inflorescences with muslin bags (mesh large enough to allow pollen grains to pass through but not insects) and leave the other half unbagged as the control group. Identify each treatment with weather-resistant tags. The bags should remain on the flowers/inflorescences while the stigmas are receptive and can be removed afterwards.
To control for bag effects on wind transfer of pollen, include a small sticky surface on the inside and outside of the muslin bags, such as a microscope slide covered in a thin coat of petroleum jelly, with which one can compare wind-borne pollen deposition in- and outside the bags. Care must be taken in interpreting results as muslin bags may reduce the level of wind pollination. Observations should be made of the wind direction and the location of the pollen source to determine if a better arrangement of plants might affect the level of wind pollination.
A few days later check whether fruit has developed from the bagged flowers/inflorescences. If those didn’t but the unbagged controls did, one can conclude that wind plays little or no role in pollinating that species. In the case of fruit development, the proportion of fruit- or seed-set in relation to the control treatment will tell us the degree of wind dependence by that species.
If hand-selfing, geitonogamy, and cross pollination treatments are also performed, one can assess for interactions of these with wind and determine optimum combinations with wind for maximizing fruit- or seed-set. To validate the cross pollination trials it is important to ensure that compatible pollenizer varieties are flowering nearby.
Testing for biotic (honey bee) pollination – single visits
With this test one will be able to check the role of biotic pollinators, in our case the honey bee, in fruit- or seed-setting of a particular plant species. In nature, fruit-set usually happens after repeated flower visits by one or more species of pollinators, but when evaluating different candidate pollinators it is best to compare fruit-set on the basis of single flower visits; this is the most equitable way to compare innate pollen vectoring capacity among flower visitors. The investigator will bag unopened flowers, un-bag them after they open, observe a single visitor, re-bag the flower, then follow the flower’s development for subsequent fruit or seed. The flower now has a history, and the efficacy of the specific agent can be compared with others (VaissiÉre et al., Citation1996). It is good practice to have a second flower open at the same time which can be rebagged without being visited, to act as a control for bag effects, as well as a set of non-manipulated and labeled flowers as open-pollinated controls. Depending on the flower species, the standing stock of nectar or pollen may build up in the bagged flower to the extent that it may influence behavior of bees visiting newly exposed flowers. To check whether this is affecting forager behavior, the behavior of bees visiting previously bagged flowers can be compared to visitors to flowers that have not been bagged. Note that if the pollinator of interest is not present in the location at densities making those observations practical, consider supplementing the area, if appropriate.
Choose a number of flower buds prior to anthesis.
Protect these buds with pollination bags and identify with weather-resistant tags.
After the flower opens remove the bags and watch for the first visit of a honey bee. Rebag the flower after the bee leaves it. The bag should remain on the flower while it is still receptive to avoid undesired visits and should be removed afterwards. Limit observations to the same time each day and to weather conditions that are suitable for insect flight.
The following measures may be taken at the time of bee observation and retained for possible use as explanatory covariates: duration (sec) of visit, whether the bee is collecting nectar or pollen, ambient temperature, wind speed, and relative humidity.
At harvest, check whether fruit has developed from the visited flowers and compare fruit-setting results with those from bagged controls, hand-selfing, geitonogamy, cross pollination, and open-pollinated treatments to know the contribution of a single honey bee visit to the pollination needs of that species.
A modification of this method employs a direct measure of Pollinator Effectiveness after (Spears, Citation1983):
where Pi = mean number of seeds set per flower resulting from a single visit from pollinator i, Z = mean number of seeds set per flower receiving no visitation, and U = mean number of seeds set per flower resulting from unlimited visitation.
This Pollinator Effectiveness index is still a popular measure to understand pollination/pollinator efficiency of honey bees and other bee pollinators in producing fruit- and seed-sets (Landaverde-González et al., Citation2017; Martarello et al., Citation2021).
Testing for biotic (honey bee) pollination – multiple visits
Although single-visit fruit-set is a standardized measure of pollination efficiency and independent of pollinator foraging density (Dedej & Delaplane, Citation2003; Sampson & Cane, Citation2000; Spears, Citation1983) in flowers bearing many ovules (for example apple, pear, melon, pumpkin and kiwi) a single honey bee visit is usually not enough to deposit all the pollen grains needed to set the fruit or to fertilize most of its ovules. Hence, multiple visits should be measured as outlined below.
Choose a given number of flower buds prior to anthesis.
Protect these buds with pollination bags and identify with weather-resistant tags.
Randomly designate each flower as a recipient of 1, 2, 3, or 4 (or more depending on plant species) honey bee visits, remove bags after flowers open, and observe each flower for its assigned number of flower visits.
After the assigned number of flower visits is achieved, rebag the flower until it is no longer receptive, after which the bag is removed.
A few days later check whether fruit has developed from the visited flowers and compare fruit-setting results with those from bagged and hand-self, geitonogamy, cross pollination, and open control treatments to know the importance of multiple honey bee flower visits to that particular plant species. The treatment which produces the closest fruit- or seed-set to the best hand-pollinated (or open-pollinated) treatments determines how many honey bee visits are necessary to set acceptable yields.
These can be tiring and time-consuming experiments because although one can have many marked flowers within one’s visual field, it is usually not possible to observe all flowers at the same time, and bees may take a long time to visit those particular unbagged flowers especially when there are other flowers around. Some investigators get around this problem by offering freshly-cut female flowers on long extender poles to bees visiting nearby flowers in the patch (Perez-Balam et al., Citation2012; Thomson, Citation1981). This method takes some skill to avoid disturbing the natural foraging behavior of bees and is obviously only good for destructive measures such as pollen deposition on stigmas (see Evaluating Pollen Identity, Quantity and Quality on Stigmas section), but it can greatly speed up acquisition of data. In any case, observations should be done at roughly the same period each day to avoid diurnal variations in flower receptivity. Also, one must not allow a different flower visitor to land on the flower while waiting for specifically honey bee visits; otherwise that flower must be discarded and all work invested in it is lost. The observer must also minimize the variations in weather parameters during the observation periods.
An alternative approach is to use a video camera that follows groups of flowers as they open. A quantitative analysis of the recording will reveal relationships between the number of visits each flower receives and its subsequent seed set. Because flowers are not enclosed, buildup of pollen and nectar reflects natural rates. As the relationship between number of bee visits and seed set can only be determined if there is less than full set (once seed set is maximized additional visits are superfluous), it may be necessary to bag flowers after they have been video recorded for an appropriate length of time to prevent full pollination. This method has the advantage that the number of visits required for full pollination can be measured directly rather than estimated as it may be when just measuring the effect of single bee visits. The use of automated visual tracking systems offers a time efficient alternative to direct observations, with the additional advantage of reducing human bias, though their adoption is currently still limited by their technical complexity and implementation limitations (depth of the field of view, difficulty of detection in cluttered environment, etc). Visual tracking technologies continue to evolve, incorporating more sophisticated cameras and analytical algorithms (for example of setup, hardware and software, see (Bjerge et al., Citation2022; Nasir et al., Citation2021; Ratnayake et al., Citation2021; Sun & Gaydecki, Citation2021; Warburton & Jones, Citation2023).
Fruit-setting experiments at the field level
The methods listed above are useful for determining the mating and pollination requirements of a plant and the proportion of a plant’s pollen-vectoring needs met by honey bees, other visitors, wind, or self. But honey bees are commonly used as pollinators in high-density agriculture, and when designing fruit-set experiments with crops, one must be aware that cultivated plants can compensate for pollen limitation with longer flowering periods or more flowers. Similarly, fruit- or seed-set can be resource-limited. Therefore, working on the basis of individual flowers or inflorescences may over-estimate yield potentials at the basis of the crop. For these reasons, when working at the scale of agricultural production, the experimental unit should be a plot or a field, and never lower than a whole plant (Vaissière et al., Citation2011).
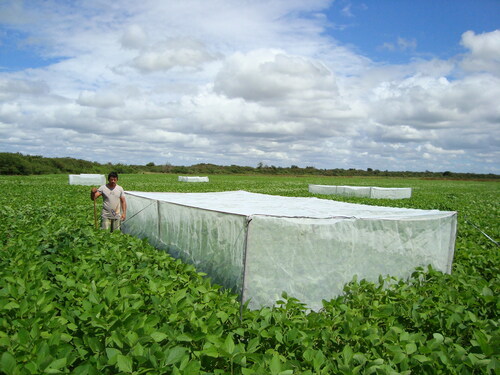
Following this argument, at the field level the whole plant or plot () is to be caged in the exclusion experiments, honey bee colonies are introduced into the areas where their effectiveness as a crop pollinator is to be tested, and fruit or seed production is compared to open fields with no supplemental honey bee introductions. One must also take into account the growth conditions and mating system of the target crop. For example, some crops are negatively affected by shading, others are male sterile and need the presence of male-fertile plants, and others are generally xenogamous and require a compatible cross-variety within the experimental cage.
Figure 5. Honey bee exclusion experiment: caged plots in soybean plantation.
Measuring pollen on bees and pollen deposition on stigmas
Pollinator performance can be evaluated with at least three organizing concepts: (1) measuring fruit- or seed-set that results after flower visitation, (2) measuring pollen load on pollinators and their pollen deposition onto stigmas, or (3) measuring plant reproductive success post-pollination, i.e., fertilization efficiency (Dafni et al., Citation2005; Ne’eman et al., Citation2010). For our purposes we are focusing on the first two concepts because reproductive success depends not only on the amount of pollen vectored by pollinators but also on additional factors such as pollen-pistil interactions and female choice (Herrero & Hormaza, Citation1996). To evaluate pollinator performance, we can study the pollen carried by bees as well as the pollen effectively deposited on the stigmas. Most of the following methods have been discussed in detail in pollination methodology books (Dafni et al., Citation2005; Kearns & Inouye, Citation1993).
Identifying and evaluating pollen quantity and quality transported by bees
The first step to identify and analyze the pollen transported by bees is to remove the pollen grains from the bees’ bodies. Several techniques are available for removing pollen grains from insects, usually mechanically by washing and vortexing the insect body (for example in 50% ethanol), removing the insect, precipitating the pollen grains by centrifugation, and using the pollen grains for further analyses (see Jones (Citation2012) for a review on pollen extraction from different insects). For studies of pollination success, the pollen packed in the corbiculae should first be removed since it is usually not available for pollination. It is sometimes possible to refine this method by only removing the pollen from the areas of the bees that have been observed to touch the stigma. For honey bees specifically, the colony forage preference can also be examined by placing pollen traps on the hives, color segregating the pollens collected and conducting further analyses for identifying the pollen grain types (Topitzhofer et al., Citation2021).
Microscopic pollen identification and making archival reference slides
Pollen from different plant species can usually be distinguished based on diagnostic traits such as pollen grain size, exine sculpturing and number and size of the apertures (pores or furrows). It is important to keep in mind when working with fresh pollen that the degree of pollen hydration affects external pollen appearance. Transmitted light microscopy is the most widely used technique for pollen identification using fresh, acetolyzed and stained pollen, but scanning electron microscopy (SEM) is also used to study surface details of the exine. In pollen reference collections, pollen grains are usually subjected to acetolysis that removes the protoplasm and leaves the exine (Erdtman, Citation1969; Kearns & Inouye, Citation1993). The acetolysis solution contains glacial acetic acid and concentrated sulfuric acid (9:1). According to Topitzhofer et al. (Citation2021), the procedure for acetolysis is as follows:
Add 0.25 g of pollen sample to 500 µl solution of glacial acetic acid.
Centrifuge and discard the supernatant.
Add 1 ml of acetolysis mixture (glacial acetic acid and concentrated sulfuric acid 9:1) to the tube containing pollen pellet.
Heat the solution at 80 °C in a water bath or heat block for 5 min, stirring thoroughly with a toothpick halfway through the incubation.
After acetolysis, pollen can be preserved for further analyses or to make archival reference slides. Pollen is usually stained to increase the contrast. Several stains (such as methyl-green or fuchsin) can be used, but Safranin O is the preferred stain for most users in palynology, staining the pollen grains pink to red depending on the amount of stain and the type of pollen analyzed (Jones, Citation2012).
Cool the solution for a minute, add 500 µL of glacial acetic acid, centrifuge and discard the supernatant.
Resuspend in distilled water, centrifuge and decant the supernatant. Repeat this step for a total of three water rinses.
Add 5–10 drops of Safranin O stain to each tube.
Next add 1000 µL of 95% ethanol, centrifuge and discard the supernatant.
Add 10–15 drops of glycerin, evaporate the ethanol for at least 2 hours at room temperature and prepare reference pollen slides.
Place 1 drop of pollen residue from the acetolyzed sample tube on the center of the microscope slide. Place a clean coverslip over the drop on the slide and seal it with nail polish or other varnishes around the edges.
Identification keys and atlases with pollen images are available both in general and for specific taxa (Kearns & Inouye, Citation1993).
Pollen identification (palynology) with molecular methods
Alternatively, pollen can be identified using molecular methods, popularly known as DNA barcoding, which involves extracting DNA from pollen grains and amplifying specific regions of the genome that are known to vary between species (Matsuki et al., Citation2008; Suyama, Citation2011). The sequences obtained are compared to reference databases to identify the plant species that best match. An extension of DNA barcoding is metabarcoding, which uses high-throughput DNA sequencing to allow for the simultaneous identification of multiple species from a mixed sample, by using primers targeting genomic regions conserved across many species to capture a broad range of taxa around regions presenting unique molecular identifiers (barcodes) to distinguish those taxa. Which region should be amplified depends on the study’s objective and the level of taxonomic resolution required (Coissac et al., Citation2012).
Those molecular techniques present the advantage of not requiring the high level of taxonomic expertise microscopic identification does. It is also easier to scale to greater sample sizes. Comparisons to microscopic identification have shown that metabarcoding tends to provide greater resolution for some plant families (Hawkins et al., Citation2015; Richardson et al., Citation2015), and might be superior at detecting rare pollens, or pollens that are difficult to identify by microscopy (Richardson et al., Citation2015). However, though metabarcoding is typically preferred for qualitative studies, quantitative analysis typically still relies on a combination of metabarcoding and microscopic identification ((Richardson et al., Citation2015), but see (Baksay et al., Citation2020)), as the amplification stage during the PCR can bias the relative abundance of sequences.
Molecular pollen identification can be useful for assessing bee cross pollination efficacy; if a bee’s corbicular pollen load contains a number of variety-specific pollens, this is evidence that the bee is foraging across pollenizers.
Sample preparation and protocol will vary according to the targeted genetic markers (e.g., ITS, ITS2, rbcL, trnL), the sequencing platform, and the source material (e.g., honey, fresh pollen, stored pollen). However, a general step-by-step protocol for metabarcoding can be outlined as follows:
Sample preservation: between sample collection and analysis, efforts should be made to minimize DNA degradation, often involving either freezing or the addition of a preservative agent.
Sample homogenization and DNA extraction:
Homogenize the sample to ensure even and optimal DNA extraction.
When possible, consider replication of the DNA extraction as backup.
Extract DNA: use a DNA extraction kit or protocol suitable for the plant material.
As always, include negative controls (no DNA) in Extraction and PCR steps to check for contamination and positive controls (known DNA) to detect issue to the workflow.
DNA quantification and quality check: Use spectrophotometry (e.g., NanoDrop) or fluorometry (e.g., Qubit) to assess DNA concentration and dilute the sample if necessary to conform to the protocol specifications.
Amplification (PCR)
Select primers targeting the specific DNA region(s) of interest for metabarcoding. The choice of the metabarcoding region (e.g., ITS, ITS2, rbcL, trnL) depends on the taxonomic groups of interest, the taxonomic resolution required, and the objectives of the research study. Consider the availability and completeness of reference databases, and preexisting information on the intragenomic variation which can lead to an overestimation of species diversity. Note that the combination of multiple regions could provide a more comprehensive picture of the pollen diversity and mitigate the limitations of individual markers.
Set up PCR reactions with the extracted DNA, selected primers, and appropriate PCR reagents. The PCR conditions (annealing temperature, number of cycles) should be optimized for the primers and target region.
Verify successful amplification using gel electrophoresis, fluorometry or using a bioanalyzer to ensure sample quality before sequencing.
Purify PCR products using a purification kit to remove unused primers, dNTPs, and other components from the PCR reaction.
Library preparation:
Barcoding: If not already included in the PCR step, tag unique barcode sequences to each sample’s PCR products to enable multiplexing (combining multiple samples in one sequencing run).
Quantify and Pool: Quantify the barcoded products and pool them in equimolar concentrations to prepare a sequencing library.
Sequencing: Choose a high-throughput sequencing platform suitable for metabarcoding, such as Illumina MiSeq or HiSeq, depending on the required read length and throughput and run according to manufacturer’s instructions.
Data processing and analysis
Quality control: use bioinformatics tools to filter out low-quality reads, trim tags and barcode sequences. Note that some citable pipelines exist for sequence processing and analysis.
OTU Clustering/ASV Delineation: Cluster the sequences into operational taxonomic units (OTUs) based on sequence similarity or delineate amplicon sequence variants (ASVs), depending on the research focus.
Sequence alignment: compare reads against reference databases specific to the targeted DNA region.
Taxonomic Assignment: Assign the best supported taxonomy to each OTU/ASV using appropriate thresholds for the required taxonomic level.
Tracking pollen identity
For some purposes in ecological research, target pollen or pollen bearing pollinia can be “tagged” to track pollinator dispersion range and pollination success. Morphological markers such as color, size and shape polymorphisms may work as long as the work is limited to a few specific taxa. Early attempts to tag non polymorphic pollen were based on the use of radioisotopes or fluorescent dyes as pollen analogues (Dafni, Citation1992). With progress in genetic engineering, “tagging” pollen grains are now increasingly common. For example, GFP-tagged pollen grains have been used to track pollen identity in transgenic plants (Hudson et al., Citation2001) and an orange fluorescent protein tagging system has been very helpful for real-time tracking of pollen grains (Rice et al., Citation2013).
Pollen quantity
Several methods can be used to evaluate the number of pollen grains attached to bees.
Hemocytometers
This is the most common method for counting pollen grains. A drop of a known volume of suspension of collected pollen is placed under the microscope and the number of pollen grains counted allowing the calculation of the total number of pollen grains in the whole volume. Hemocytometers were initially developed to count blood cells, but they can also be used to count the number of pollen grains in a standard volume of liquid containing pollen. The steps are as follows:
Collect pollen either directly from the bee corbiculae or from the pollen traps.
Suspend pollen grains in a known volume of 70% ethanol and vortex to assure homogenous mixing.
Remove a sample of pollen suspension with a pipette and place in hemocytometer.
View and count pollen grains under a microscope. Hemocytometer manufacturers provide the known volume of suspension under the viewing area and provide easy instructions for extrapolating object counts back to absolute counts in the original suspension (sample).
When the number of pollen grains is very low, a measured drop of the suspension can be placed on a lined microscope slide and all the grains counted.
Alternative methods
More expensive techniques such as electronic particle counting (Kearns & Inouye, Citation1993) and laser-based counters (Kawashima et al., Citation2007) can also be used. In some situations, it is possible to directly count pollen grains on a bee’s body with a stereomicroscope (Nepi & Pacini, Citation1993).
Pollen viability and quality
There is disparity in results among different methods for appraising pollen viability and quality; for this reason, the most robust approach is to use a combination of methods, such as those provided below, that allow a more precise estimation of pollen viability and quality (Dafni & Firmage, Citation2000).
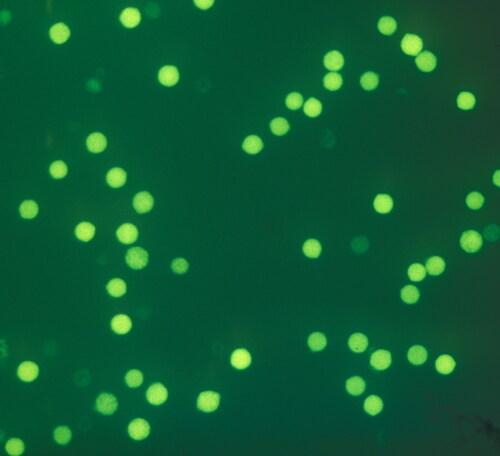
Pollen viability
One approach is to evaluate viability prior to germination. The most common test is the fluorochromatic reaction (FCR test) based in fluorescein diacetate (FDA) (Heslop-Harrison & Heslop-Harrison, Citation1970; Pinillos & Cuevas, Citation2008). This test evaluates the integrity of the plasmalemma of the pollen vegetative cell and activity of nonspecific esterases of the cytoplasm, and only viable pollen grains will fluoresce under the microscope (). Another commonly used viability test is using stains that selectively stain the “viable” pollens. For example, Alexander staining (Alexander, Citation1969) colors viable pollens crimson red while aborted pollen stains green. Aniline blue can also be used where viable pollens take up the stain and the non-viable pollens remain transparent (Mudd & Seshadri, Citation2012). Additional tests such as the use of tetrazolium dyes, X-Gal, isatin or Baker’s reagent can also be used (Dafni & Firmage, Citation2000). An automated microscopic image analysis using a combination of fluorescein and propidium iodide stains has also been used for testing pollen viability (Ascari et al., Citation2020). Another study used five different staining methods (Abdelgadir et al., Citation2012) to compare the pollen grains for viability (2,3,5-triphenyl tetrazolium chloride staining method, 2,5-diphenyl monotetrazolium bromide staining method, aniline blue–lactophenol staining method, iodine and potassium iodide staining method and fluorochromatic reaction (FCR) staining method where fluorescein diacetate was dissolved in acetone). However, in most viability tests not all the viable pollen grains are able to germinate, and consequently the percentage of pollen germination is usually lower than the percentage of viable pollen.
Figure 6. Pistachio pollen stained with FDA: viable pollen grains show bright fluorescence compared to non-viable pollen grains.
Pollen germination and pollen tube growth in vitro
The evaluation of pollen germination in vitro takes into account not only pollen viability but also pollen vigor (Shivanna et al., Citation1991; Shivanna & Johri, Citation1985). One drawback of the method is that the germination medium and germination conditions (e.g., pollen pre-hydration, temperature conditions) must be optimized for each species to avoid false negatives. Different media for in vitro pollen germination have been recommended for several species (Taylor & Hepler, Citation1997), mainly using the basic medium developed by Brewbaker and Kwack (Citation1963) in a sucrose solution with or without agar, depending on the species. The optimum method has to be tested for each species empirically. A pollen grain is considered as germinated when the length of the pollen tube is at least twice the diameter of the pollen grain.
Evaluating pollen identity, quantity and quality on stigmas
For some studies, mainly in the field, it is necessary to avoid contaminating stigmas with non-target pollen. This means it is necessary to prevent bees from visiting target flowers. Different strategies have been used (Kearns & Inouye, Citation1993), including a variety of tubes and capsules for small flowers, plastic pieces to cover just the pistils, or nylon or paper bags to enclose the flowers, the inflorescences, or whole plants before the experiment begins. Errors in flower sampling can be minimized by removing all opened flowers before the experiment begins. The main disadvantage of these enclosures is that the microenvironment in the flower (mainly temperature and humidity) can be altered and depending on the experiment this can have implications for the results. In any case, air-permeable mesh or net bags are likely to have a smaller effect on flower microenvironment than paper bags or plastic enclosures.
In some cases, emasculation might be needed to avoid self-pollination, although emasculation can affect subsequent pollinator behavior. In addition, flower emasculation can also have indirect effects on the plants such as ovule degeneration and reduced fruit sets in sweet cherries and Japanese plums (Guerra et al., Citation2010; Hedhly et al., Citation2009). The possibility of emasculating is dependent on the morphology of the flower and should be carried out carefully, especially if dealing with small flowers to avoid accidental self-pollination or damage to the flower (Hedhly et al., Citation2009). Assuming the pollen grain is viable and of good quality, it should germinate. This can be checked by staining the stigma. For example, staining methods can be used such as incubation in 3 M NaOH for 24 h, a second incubation in distilled water for 24 h and performing a two-step staining process with 0.1% Fuchsin Red solution and decolorized 0.1% aniline blue buffered with 0.1% K3HPO4 (Stavert et al., Citation2020).
Identifying pollen on stigmas
Identifying pollen deposited on stigmas can provide evidence of the percentage of conspecific pollen deposited and the likelihood of stigmas being clogged by pollen from other species. This constitutes perhaps the most unambiguous and precise measure of pollination success, sensu stricto. The stigmas can be washed in 70% ethanol and the pollen grains released can be observed using similar procedures to those described above for identifying pollen on bees. Molecular markers have also been used to identify pollen deposited on the stigma (Hasegawa et al., Citation2009).
Quantifying pollen deposited on a receptive stigma per visit or unit time
Usually, this parameter is measured by counting the number of pollen grains deposited on the stigma per visit or unit time, regardless of fertilization success. This method implies the microscopic examination of pollen germination and tube growth in the stigma and style. Different stains that stain pollen grains differentially from the surrounding stigmatic tissues can be used. Usually, the stigma is gently squashed under a coverslip after staining to better visualize the pollen grains. If needed, stigmas can be fixed in FAA (formaldehyde - acetic acid − 70% ethanol [1:1:18]), 4% paraformaldehyde, glutaraldehyde (2.5% glutaraldehyde in 0.03 mol/L phosphate buffer), 3:1 (v/v) ethanol—acetic acid, or just 70% ethanol and stored at 4 °C for later examination. However, it should be taken into account that before germination pollen needs to adhere to the stigma and hydrate. Fixing can remove non-adhered pollen grains and consequently the estimate of pollen load may be lower than if fresh stigmas were analyzed. In some cases, softening the fixed stigmas should be performed before staining and squashing; this can be done by autoclaving the samples at 1 kg cm−2 for 10 to 20 min in 5% (w/v) sodium sulfite and rinsing in distilled water. Alternatively, 1 M NaOH can be used for 1 h following a rinse in distilled water. A summary of commonly used staining and fluorescent microscopic methods for pollen is available in a study by Atlagić et al. (Citation2012).
Each of the following methods is acceptable for determining the number of pollen grains and the extent of their germination.
Epifluorescence microscopy: This is the most widely used method for visualizing pollen tubes. Stain the pollen grains and pollen tubes with aniline blue (specific for callose, a polysaccharide present in pollen tube walls and plugs produced in pollen tubes of most Angiosperms) () and observe under fluorescence microscopy. The usual mix is 0.1% (v/v) aniline blue in 0.3 M K3PO4 (Linskens & Esser, Citation1957). The observer can directly determine the percentage pollen germination on the stigma.
Light microscopy: Different methods are available that do not require epifluorescence:
Methyl green and Phloxine B (Dafni et al., Citation2005). Non-germinating grains stain dark brown-red, whereas in germinating pollen grains the empty grains stain green and the pollen tubes red.
Stain with 1% basic fuchsin: 1% fast green (4:1) (Kearns & Inouye, Citation1993). De-stain and soften the tissue in lactic acid for 12 hours and then squash the tissue under a coverslip. Pollen tubes stain maroon and the background remains white.
Acetocarmine/basic fuchsin (Kearns & Inouye, Citation1993). Add a drop of acetocarmine, followed by a drop of 3% aqueous basic fuchsin and de-stain with a drop of absolute ethanol. Pollen cytoplasm stains red.
A stain solution containing 1% Malachite green, glycerol, 1% acid fuschsin, 1% Orange G, glacial acetic acid and ethanol (Peterson et al., Citation2010).
Scanning electron microscopy: This microscopic technique can be used to visualize the whole stigmatic surface, but this is more time-consuming and complicated than light microscopy.
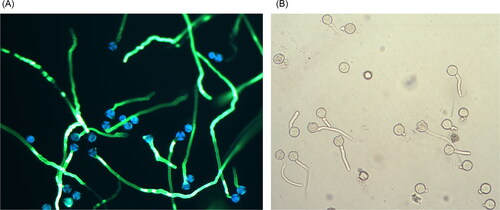
Figure 7. Pollen germination in vitro. Left (A): pollen from Japanese plum stained with aniline blue. Right (B): pollen from sweet cherry, unstained.
Evaluating stigmatic receptivity
Pollination success is dependent on stigmatic receptivity since only insect visits to receptive stigmas can be considered as effective pollination visits. A receptive stigma allows pollen grain adhesion that can be followed by pollen hydration and germination. Stigmatic receptivity can be evaluated directly by studying conspecific pollen germination (see next section) or indirectly by studying activity of enzymes (Dafni et al., Citation2005) such as esterase (with a benzidine solution), alcohol dehydrogenase (Baker’s procedure: 1 M phosphate buffer, nitroblue tetrazolium, nicotinamide adenine dinucleotide and ethanol), peroxidase (with alpha-naphthyl acetate) or the presence of exudates in wet stigmas stained with Sudan black or auramine O (Gupta et al., Citation2015; Kearns & Inouye, Citation1993).
Evaluating pollen germination and pollen tube growth in vivo
The most common procedure is to study pollinated stigmas and styles in squashed preparations stained with aniline blue (specific for callose) and observed under fluorescence microscopy (as described above for pollen counting). The tissues have to be softened, usually in 5% sodium sulfite to allow squashing, and the time of softening is species dependent; it is advisable to start processing the samples overnight and, if needed, the samples can be autoclaved at 1 kg cm−2 for 10 min in 5% (w/v) sodium sulfite or placed in 1 M NaOH for 1 h. Depending on the species, varying concentration of sodium hydroxide (from 1 N to 4 N) at different temperatures (ambient temperature overnight or 60 °C for an hour) can also be tried for softening. For staining, 0.1% (v/v) aniline blue in 0.3 M K3PO4 (Linskens & Esser, Citation1957) or fixation in ethanol:lactic acid (3:1 v/v), rinsing with distilled water and NaOH and staining with 0.1% aniline blue in 0.1% K2HPO4 (Abdelgadir et al., Citation2012) can be used and the observations made with a fluorescence microscope. Pollen tube walls and the callose plugs produced by growing pollen tubes show a distinct fluorescence signal (Kearns & Inouye, Citation1993). This test is also useful to determine the presence of gametophytic self-incompatibility in which incompatible pollen tubes get arrested during pollen tube growth in the style.
Measures of colony level pollination efficacy
The foraging activity of honey bees is dependent on within the hive (amount of brood, number of adult bees, food reserves) as well as outside environment (floral availability). Honey bees are managed at the colony level for pollination, i.e., colonies may be subject to particular management practices or manipulations to influence forager activity.
This section covers measures for assessing the pollination efficiency of honey bees at the colony level. To determine a colony’s pollination efficiency, it is generally necessary to have an understanding of the efficiency of individual foragers that are pollinating flowers in the target crop. For example, for a crop like kiwi that only produces pollen, a measure of kiwi pollen collected by a colony will indicate the portion of foragers that are visiting the crop. Similarly, in avocadoes and hybrid carrots, nectar foragers are predominantly carrying out pollination and hence pollen foragers will be of less interest.
The measures of colony performance generally fit into two types. Measures can be made on returning foragers which generally relate to the flowers that the foragers are visiting, whether they were foraging for pollen or nectar, and for some crops how effective they were at pollinating the crop. The second approach is to evaluate the behavior of foragers in the field and then attempt to determine to which colony they belong to. These types of studies are often carried out to assess the effect of colony level manipulations designed to increase the number of honey bees visiting a crop or their behavior when they are visiting the crop, e.g., to measure the effects of:
The timing of colony introductions
Placement of colonies in the crop
Colony strength (number of bees and amount of brood)
Organization of the colony, e.g., location of the brood or proportion of the brood that is uncapped
Practices to change foraging behavior, e.g., feeding pollen or syrup and using pollen traps
Competing floral sources
This section covers methods for assessing
pollen foraging
nectar foraging
colony foraging rates
fraction of side working behavior
tracing foragers back to their respective hives
Proportion of foragers from a colony visiting a crop
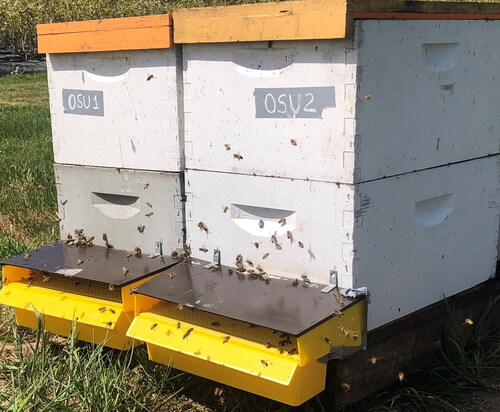
Pollen trapping
The number of foragers from a honey bee colony that is collecting pollen can be estimated using pollen traps (Goodwin, Citation1997). This is particularly relevant if the crop of interest only produces pollen (kiwi) or if pollen foragers are more efficient pollinators than nectar foragers (apple, almond) because they have a greater likelihood of contacting the stigma. Pollen traps () are devices with grids that fit across the entrance of a hive. With some designs the hive entrance is blocked and the trap forms the new entrance. Returning foragers must pass through the grid/mesh to enter the hive. Bees prefer not to pass through pollen traps if they can avoid it and will use any other gaps in a hive body as an entrance once a pollen trap is fitted. These holes need to be sealed to ensure that all bees are using the pollen trap (Topitzhofer et al., Citation2021). It is worth checking the hives frequently after the trap is fitted to make sure all bees are entering and leaving the hive through the pollen trap.
Figure 8. Pollen traps installed at entrances of hives.
As returning bees carry pollen through the trap, the grid/mesh scrapes most of the pollen pellets from their corbicula. The pellets then fall into a tray where they can be collected. The proportion of pollen pellets dislodged depends on the size and shape of the holes on the grid and the size of the pollen pellets that the bees are carrying. Pollen pellet size, and consequently the efficiency of a pollen trap may vary with both the plant species, the time of day the pollen is collected, and meteorological conditions (Synge, Citation1947; Topitzhofer et al., Citation2021). The inside of a pollen trap can become blocked over time. Depending on the design of the trap it may be difficult for hive cleaning bees to carry dead bees through the trap and for drones to move through it. When these accumulate on the inside of the trap it can reduce the ease with which foragers move through the trap and hence the foraging ability of the colony. If traps are to be used for extended periods of time they should be checked regularly for blockages.
Determining pollen trap efficiency
Pollen traps are variable in their design, so it is advisable to determine the efficiency of a trap at collecting the pollen. This can be achieved by counting the number of bees entering the trap with pollen pellets of interest and determining the percentage that are collected in an empty pollen trap drawer (Goodwin & Perry, Citation1992; Levin & Loper, Citation1984).
Number of pollen traps
Most studies require data to be collected from several colonies, as there can be large differences in the plant species that neighboring colonies are visiting. The level of replication required will depend on the amount of variation between colonies and the size of the difference to be detected. Balancing colonies with regard to the amount of brood and number of bees will reduce the amount of variation in the total amount of the pollen collected.
Analyzing pollen trap contents
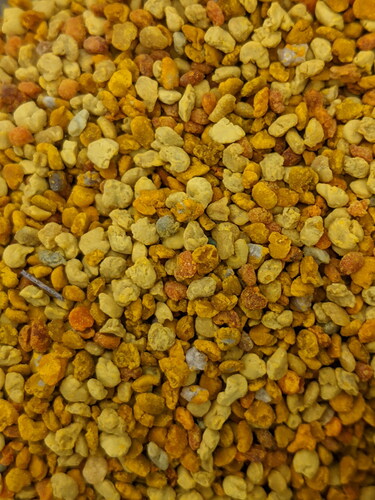
Pollen pellets from many plant species can be identified by color (). To establish the color of the pellets of interest it is best to catch bees with pollen pellets directly from the crops of interest and remove their pellets, so that they can then be used as standards for comparing with pellets collected from pollen traps. It is important to note that the color of pellets may change depending on the light by which they are viewed and when they dry (Kirk, Citation2006). Because the colors of pellets from some plant species are similar, it is often necessary to measure the size of the pollen grains that make up the pollen pellet and also examine the pollen grains’ surface features microscopically to establish whether the trap contents can be sorted by eye (see Microscopic Pollen Identification and Making Archival Reference Slides section).
Figure 9. Pollen pellets.
Because of the large amounts of pollen that may be trapped at times, it may be necessary to subsample the pollen trap contents. The contents of a trap are often layered, as bees collect pollen from different plant species at different times of day. It is therefore necessary to mix the contents of the trap thoroughly before subsampling. If determining the weight of different pollens trapped rather than the number of pellets trapped, it is necessary to first dry the samples to a constant weight as the moisture content may vary between species, time of day, and between days. Samples of pollen pellets can be stored for short periods of time at room temperature. However, they may eventually develop mold making the sample analysis difficult. It is therefore good practice to freeze samples if they are not going to be analyzed soon after collection.
Effect of pollen traps on foraging behavior and the colony
Honey bees that lose pollen pellets while moving though a pollen trap still exhibit normal behavioral repertoire associated with scraping the pollen off their legs into a cell on the comb (McDonald, Citation1968). If using high efficiency pollen traps it is important to note that they may reduce brood rearing after prolonged use (Eckert, Citation1942) and stimulate colonies to increase pollen collection (Levin & Loper, Citation1984). For this reason, pollen trapping with high efficiency traps should never extend beyond a few days to prevent impact on colony strength due to depletion of pollen stores.
Nectar collection
In some crops it is possible to estimate the number of visits that bees from a colony make to collect nectar. This is important for crops where nectar foragers are the most important pollinators (avocadoes, hybrid carrots). This can be achieved by a chemical analysis of the stored honey if the nectar from the plant of interest has a unique chemical profile e.g., avocados (Dag et al., Citation2006). This can also be achieved by analysis of the pollen contained in the honey. However, care must be taken in interpreting results, as pollen grains from some plant species are more likely to be present in honey than other species. Also, the amount of honey produced is not only affected by the amount of nectar collected by a colony, but also the amount consumed.
Proportion of bees collecting pollen in a colony
For many flowers that are visited by both pollen and nectar foragers, pollen foragers are more efficient pollinators (Free, Citation1966). Because of the close proximity of anthers and stigmas, pollen foragers are more likely than nectar foragers to touch both structures. Some bees collect both pollen and nectar on a foraging trip. The proportion of pollen and nectar foragers can be determined by observing the behavior of foraging bees. Nectar gatherers will probe the base of the petals while pollen foragers usually scrabble over the anthers.
Colony foraging rate
A colony’s foraging rate refers to the number of foraging trips a colony makes during a day. Generally, the more foraging trips bees from a colony make to a crop, the more effective the colony will be at pollinating the crop. The number of bees foraging from a colony can be estimated by counting the number of bees entering the hive (Baker & Jay, Citation1974). This is usually easier than counting bees leaving a hive, as returning foragers approach more slowly when compared to the exiting foragers. The rate of returning foragers over 1 min has been found to be correlated with different measures of colony population, including frame counts of adults and sealed brood, as well with cluster counts (Grant et al., Citation2021). The relationship between returning forager counts and frames covered with adult bees was found to be correlated across a range of ambient temperatures (16—22 °C), and blueberries fields with colonies with higher returning rate of foragers tended to have higher yield (Grant et al., Citation2021). When counting the number of returning bees over a set length of time it is important to do this without disturbing the returning bees by positioning the observer at least 2 m in front of the hive entrance or positioning the observer at the side of the entrance. Video recording will be necessary for strong colonies, because obtaining the rate of returning foragers requires replaying video at slower speeds.
Depending on the research questions the physical counts of foragers or video data may need to be backed up with samples of returning bees. Honey bees observed returning with pollen must have been foraging for pollen. However honey bees returning without pollen might be either nectar foragers or could be bees going on orientation flights. To confirm their identity (nectar foragers vs orientation) the returning bees without pollen can be captured by blocking the hive entrance for few minutes and allowing the returning bees to collect at the hive entrance. The captured bees could then be dissected to measure the weight of their crop or alternatively anesthetized and crop contents expelled (Pankiw & Page, Citation2000).
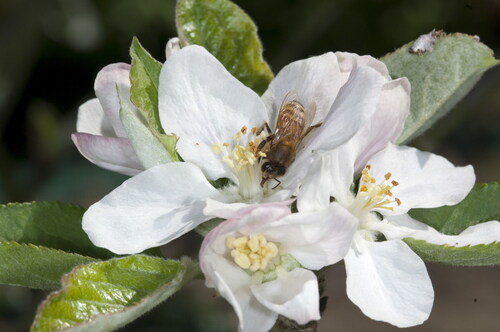
Fraction of bees side-working flowers
On some flower species (almonds, apples) the flower architecture allows bees to approach the nectaries by climbing through the anthers past the stigma (top working bees, ) or from the side of the flowers (blueberries) where they push their tongues between the base of the anthers (side working bees, ). Side working bees are less likely to touch the stigma than top working bees. The proportion of bees carrying out these behaviors varies with flower architecture and with the experience of the bees. The data are collected by modifying the methods given in Indirect Extrapolations section to report number of top working, or side working, bees for a given number of flowers or measured area of crop.
Figure 10. A top-working honey bee visiting an apple flower.
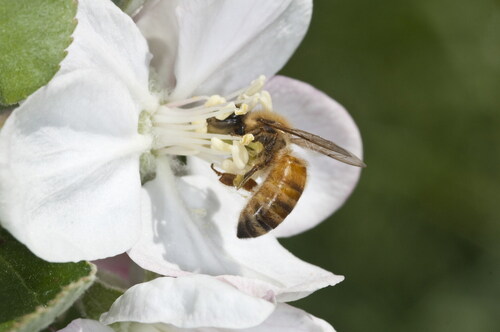
Figure 11. A side-working honey bee visiting an apple flower.
Tracing foragers to their respective hives
In certain circumstances it may be necessary to determine whether the bees in a crop or part of a crop are arriving from a particular hive or hives. This might be of interest when manipulations of colonies are carried out to alter honey bee foraging behavior that cannot be detected by just observing foragers as they return to their respective hive. This tracing method can also be used to determine where bees from a particular colony or colonies are foraging. This tracing can be achieved by following the methods described below.
Marking foraging bees in the crop
This can be achieved by catching bees in the crop, marking and releasing them, and searching for marked bees in the hives in the evening when most foragers are back home. Captured bees in the field will need to be immobilized before marking. This can be done by chilling the foragers, anesthetizing them with CO2 or with chloroform. Care needs to be taken if using CO2 for anesthetizing the bees as CO2 anesthetization has been reported to inhibit pollen collection (Brito et al., Citation2010; Ribbands, Citation1950).
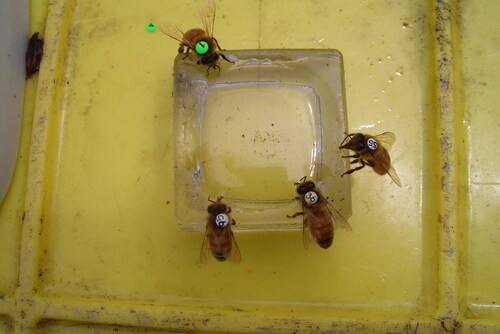
Acrylic paints can be used to mark bees if they only need to be marked for a single day as the paint may wear off after this time. Acetone based paints will last longer. By using a range of colors and positions of spots on the thorax and abdomen it is possible to individually and distinctively mark large numbers of bees. An alternative, more costly method, is to use purpose-made plastic queen tags glued on the thorax of worker honey bees (). As there are often a large number of bee colonies foraging on a specific crop, it is usually necessary to mark large numbers of bees to obtain adequate recovery rates.
Figure 12. Foragers with queen tags.
Also, color-coded ferrous tags glued to the thoracic dorsum of an individual forager in the field can be retrieved at the hive entrance with magnets (Gary, Citation1971). This technique enables studies of spatial distribution of bees in an area.
Marking bees in the hives to trace their identity in the field
Strains of bees with the visible mutation such as cordovan could be used to trace the foraging bees back to their respective hives, as it is possible to easily identify these workers in the field (Gary et al., Citation1981). Further, the bees in a colony can also be fed with radioactive elements (Levin, Citation1960) or made to walk through a marking block fitted to the entrance of a hive that marks them with colored dye (Howpage et al., Citation1998). Workers marked with any of these methods can be searched for in the field.
Determining crop-specific recommended pollinator densities
An aim of some research in agricultural pollination is to provide guidelines for stocking honey bee colonies and other managed social and solitary bees to maximize profits. There are two general approaches to designing experiments for determining optimum stocking densities and distribution of bees in the field: (1) indirect extrapolations from densities of foraging bees observed in small plots, along transects away from colonies, or in cages; or (2) direct tests of colony densities on whole fields.
Indirect extrapolations
The impact of managed bee stocking rates can be estimated indirectly by using the pollination potential of individual foragers (i.e., seed set per flower visit; Testing for Biotic (Honey Bee) Pollination – Single Visits & Testing for Biotic (Honey Bee) Pollination – Multiple Visits sections) and extrapolating the number of foraging bees and colonies required to pollinate a crop (Goodwin et al., Citation2011). This presupposes our ability to reliably measure bee densities in the crop.
Bee densities in small field plots
Appropriate bee density measures vary according to plant growth habit, planting arrangement and conformation of flowering. Examples of density measures that may be used include:
Bees per m2 or larger area (especially for vine crops)
Bees per tree (tree fruits and nuts)
Bees per flower or larger number of flowers (berries, vine crops, cotton, sunflower)
Considerations when counting bees:
Make several observations throughout the duration of the flowering period.
Subsample within a day, recording time of samples as local solar time.
Sample during weather conditions that are favorable for foraging, i.e., temperature ≥15 °C, wind <16 km/h, no rain (flowers dry) and preferably sunny.
Also sample for pollinator diversity.
Considerations in choosing sampling sites:
Use multiple sampling sites within a field.
Choose representative sites that are at least 5 m from the field edge.
Use >1 m of row in row crops.
Use plots of >1 m2 in broadcast-seeded plots and non-row crops.
Use individual branches of trees in orchards.
Use individual flowers if large enough (e.g., sunflowers).
Considerations when measuring yield are as in Plant Pollination Requirements & Measuring Harvest and Post-Harvest Effects of Pollination sections. Vaissière et al. (Citation2011) give detailed suggestions about assessing pollination needs of different types of crops. They also provide useful data collection sheets for recording bee count and yield information for crop of different growth habits.
Field-scale transects
Bee colonies or cocoons can be placed at one end of a crop field, a linear sampling transect established across the field, and the number of bees visiting flowers counted (visits per min) and seed/fruit-set assessed at points along the transect to determine whether these bee visitation and yield decline with distance from the colonies or solitary bee nesting stations (e.g., Cunningham et al., Citation2016; Manning et al., Citation2000). Cunningham et al. (Citation2016) also measured the depletion of pollen along transects in almonds, by collecting flowers that were in the process of dehiscing (i.e., flowers had at least one dehisced anther and at least one anther that had not dehisced) and determining the amount of pollen remaining in the flower by extracting pollen from all anthers in the selected flowers. This may only be useful in large areas of crops. It is good practice to repeat the trial with the colonies at the other end of the crop. For transects,
Use very long fields (>400 m).
Establish a bee density gradient by locating colonies at one end of the field only.
Use multiple sampling sites at intervals of 100–200 m away from the colonies.
Cage visitation rates
Observations on visits to flowers of a crop are sometimes made on plants within cages where bee densities can be controlled and replicated more easily than in fields (e.g., Dedej & Delaplane, Citation2003); cages often are ca. 2 m3 and constructed of Lumite® (e.g., BioQuip Products, Rancho Dominguez, CA). These tests are useful for gaining insight about the relative impact of bee visitation on the yield response of a crop. The artificial environment within a cage, however, can affect both bee behavior and plant growth, and this limits the ability to transfer findings about effects of bee density on crop yield to recommendations about colony stocking rates in normal field situations. Thus, cage tests provide only a very general idea of comparative usefulness of different colony densities and are much less useful than studies using small plots or whole fields.
Direct tests of whole fields to find the required number of colonies per hectare
A less common approach is to stock fields with different numbers of colonies or cocoons and establish whether the rates used have an effect on pollination (Arrington & DeVetter, Citation2018; Brault et al., Citation1995; Palmer-Jones & Clinch, Citation1974; Stubbs & Drummond, Citation2001; Vaissière, Citation1991). Direct comparisons of different colony densities are rare because it is difficult to obtain acceptably large numbers of replicate fields for each treatment. Past research usually involved a few fields (e.g., Eischen & Underwood, Citation1991), or a few fields repeated over a few years with treatments rotated among fields (e.g., Stern et al., Citation2004). Moreover, a number of studies have indicated that stocking rates are difficult to estimate at a landscape scale (Benjamin & Winfree, Citation2014; Gaines-Day & Gratton, Citation2016) and may not predict yield as reliably as visitation rates to flowers (Garibaldi et al., Citation2020; Mallinger et al., Citation2021).
If multiple fields are available for testing, they should be:
As similar as possible regarding cultural practices (e.g., irrigation, drainage, fertilization, pest and weed control), available pollenizers, soil type and surrounding habitat.
Far enough apart (ideally >3 km) to isolate bee populations.
The strength of honey bee or bumble bee colonies should be similar across fields.
If multiple fields are available, similar fields should be paired and bee colonies/cocoons introduced into half of the fields while the other fields serve as controls without supplemental bees. One recommendation (Vaissière et al., Citation2011) is to use ≥5 fields per treatment, with bees introduced at the onset of effective flowering (i.e., at the time of first bloom that would lead to a product).
Considerations when collecting data about pollination outcome include the following:
Use units of yield per field, plot, plant or flower as appropriate for the crop. Yield may include fruit and seed quantity and quality (see Measuring Harvest and Post-Harvest Effects of Pollination section).
Alternatively, use pollen deposition (see Evaluating Pollen Identity, Quantity and Quality on Stigmas section), or fruit- or seed-set (see Plant Pollination Requirements section). Pre-harvest measures are useful to eliminate post-pollination effects that can confound treatment effects but do not reflect outcomes typical of agricultural commerce.
It is advisable to estimate realized densities of bee foragers in fields resulting from the different numbers of colonies (see Indirect Extrapolations section).
Appraising risk of competition between plants for pollination
If the target crop blooms in synchrony with neighboring weeds or crops there is a risk that it will not be well serviced by a limited pool of pollinators. This underscores the need to monitor forager density on the target crop. It may be useful to gauge the distribution of bees among competing plants species; see the methods outlined in Proportion of Foragers from a Colony Visiting a Crop section for possible approaches. The most convenient technique may be to use pollen traps to measure the relative proportions of pollen income from different forage sources if honey bees are collecting pollen from all sources. A notable drawback associated with using pollen traps to assess competition is that honey bees do not collect appreciable pollen when foraging on some crop plants (e.g., blueberry).
A cautionary note about recommendations
Delaplane and Mayer (Citation2000) list recommended honey bee colony densities and their average for many crops based on information collected from standard pollination references and historical extension bulletins. Recommendations about the optimal number of colonies per hectare ultimately often come from experiences of growers and beekeepers who have adjusted bee densities based on trial and error over time (review of historical trends in stocking rates in the U.S. reviewed in Rucker et al. (Citation2012). A commonly recommended starting density is 2.5 colonies of standard strength (often cited as having ≥8 combs two-thirds covered with adult bees or ≥6 combs well covered with brood) per hectare. This may be adjusted knowing the relationship of crop yield with factors that affect foraging activity or pollination. Examples of such factors include:
Plant reproductive biology, including cultivar differences (specific cultivars may be more difficult to pollinate effectively, e.g., “Delicious” apples (Malus domestica) because of a high frequency of sideworking honey bees): more bees are needed for such plants.
Field size: larger fields usually need more supplemental pollinators than small fields because small fields often have greater ambient densities of local pollinators.
Prevailing weather: a region or season with historically poor weather for bee flight may warrant a higher stocking density.
Competition: the extent to which the target crop is competing with weeds or neighboring crops for a limited pool of pollinators.
Ambient densities of local pollinators.
A case study of how these particular factors have been used to adjust pollination management involves lowbush blueberry (Vaccinium angustifolium Aiton and V. myrtilloides Michx.) in the northeastern United States. The crop is difficult because it requires much pollen movement and honey bees do not “buzz pollinate” (sonicate) the ericaceous flowers, many commercial fields are large and have insufficient densities of native pollinators, weather during bloom is often poor, and bees seek pollen from sources other than blueberries. Large-scale commercial growers have tested the value of increased initial stocking densities. Through this experience the largest growers now prefer to rent colonies that are more populous than average and stock them typically at 10–12/hectare and up to 20–25/hectare in historically high-yielding areas (Danka unpub. obs.).
Measuring harvest and post-harvest effects of pollination
The economic impact of pollinators on agricultural output transcends simple yield measures and extends into harvest and post-harvest effects as well (Bommarco et al., Citation2012; Dag et al., Citation2008; Gaaliche et al., Citation2011). These include things like fruit sweetness, shape, weight, texture, and other flavor metrics (Gallai et al., Citation2009). Many of these quality criteria are affected by seed number which in turn is a result of pollination efficiency (Dag et al., Citation2008; Dag & Mizrahi, Citation2005). In fact, open pollination (and thus access to pollinators) has been shown to reduce formation of deformed fruits in important strawberry varieties (Klatt et al., Citation2014). This reduction in fruit deformation is also shown to improve crop quality and commercial value in addition to longer shelf life in these fruits (Klatt et al., Citation2014; Klatt et al., Citation2014). In fruits like apples, pollination can also benefit the overall fruit set and quality by affecting dry matter content, mineral content and storability (Samnegård et al., Citation2019). In other fruits, such as in southern highbush blueberries, cross-pollinated fruits had higher seed numbers per fruit and weighed more (Taber & Olmstead, Citation2016). Even when the fruits have only one seed each, pollination can affect fruit-quality parameters since the fruit resulting from cross-pollination might differ from those stemming from self-pollination, as has been reported in mango (Dag et al., Citation1999), avocado (Degani et al., Citation1990) and other crops. In this section, we describe major quality criteria and provide methods for their quantification. The presented protocols for assessing fruit quality are based on Kader (Citation2002). For each crop, researchers need to define which parameters are relevant in the context of pollination efficiency.
Visual appearance
Size: Fruit size can be measured with a sizing ring or calipers (). There is generally a good correlation between size and weight; size can also be expressed as number of units of a commodity per unit weight. Volume can be determined by water displacement or by calculating from measured dimensions.
Shape: Ratios of dimensions, such as diameter-to-depth ratio, are used as indices of fruit shape (for e.g., sweet pepper Dag et al., Citation2008) ().
Color: The uniformity and intensity of color are important visual qualities, as is light reflectance which can be measured by any number of dedicated meters. These devices measure color on the basis of amount of light reflected from the surface of the fruit; examples include Minolta Colorimeter, Gardner, and Hunter Difference Meters. Internal color and various internal disorders can be detected with light transmission meters. These devices measure light transmitted through the fruit. Fruit color can be evaluated on the basis of pigment content, usually a function of quantity of chlorophylls, carotenoids and flavonoids.
Defects (): Incidence and severity of internal and external defects can be evaluated on a five-point subjective scale (1 = none, 2 = slight, 3 = moderate, 4 = severe, 5 = extreme). To reduce variability among evaluators, detailed descriptions and photographs may be used as guides in scoring a given defect. An objective evaluation of external defects using computer-aided vision techniques appears promising. Internal defects can be evaluated by non-destructive techniques, such as light transmission and absorption characteristics of the fruit, sonic and vibration techniques associated with mass density, and nuclear magnetic resonance imaging.
Figure 13. Measuring guava fruit size using a digital caliper.
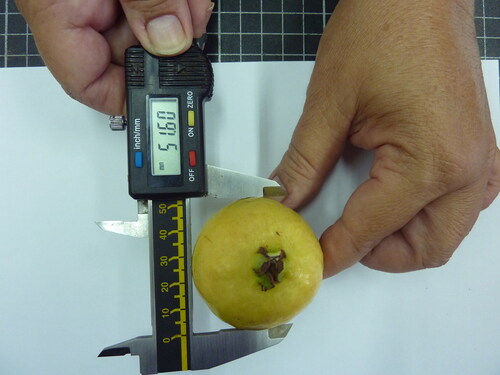
Figure 14. Left: large sweet pepper fruit from honey bee-pollinated greenhouse. Right: small fruit from a control, honey bee pollination restricted greenhouse.
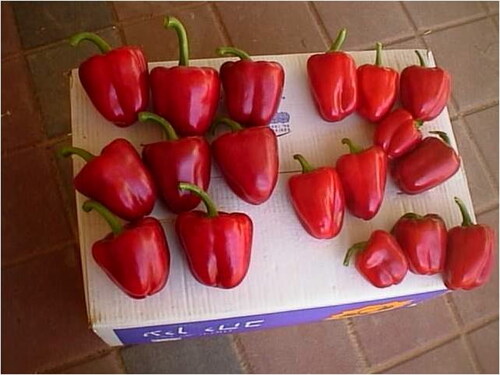
Figure 15. Left: well-shaped fruits resulting from satisfactory pollination. Right: misshapen strawberries due to poor pollination.
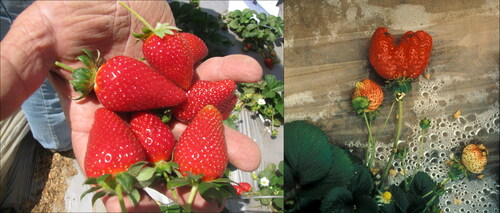
Textural quality
Yielding quality (firmness/softness): Hand-held testers can be used to determine penetration force. One example is the Magness-Taylor Pressure Tester. The plunger (tip) size used depends on the fruit and varies between 3 and 11 mm. Stand-mounted testers can determine penetration force with more consistent punch speed, one example being the UC Fruit Firmness Tester. Contractual laboratory testing is available for appraising fruit firmness with instruments such as the Instron Universal Testing machine, the Texture Testing system or by measuring fruit deformation using a Deformation Tester.
Fibrosity and toughness: Shear force can be determined with an Instron or Texture Testing system. Resistance to cutting can be determined using a Fibrometer. Fiber or lignin content can be determined by contractual lab services with various chemical analyses.
Succulence and juiciness: Any number of commercially available fruit refractometers can be used to measure water content - an indicator of succulence or turgidity.
Flavor
Sweetness: Sugar content can be determined by chemical analysis for total and reducing sugars or for individual sugars (e.g., yellow pitaya, Dag & Mizrahi, Citation2005). Total soluble solids can be used as a proxy measure of sugar content because sugars are the predominant component of fruit juice soluble solids. This parameter is measured with a fruit refractometer.
Sourness (acidity): pH of extracted juice can be quantified with a pH meter or pH indicator paper. Total titratable acidity can be derived by titrating a specific volume of the extracted juice with 0.1M NaOH to pH 8.1, then calculating titratable acidity as citric, malic, or tartaric acid, depending on which organic acid is dominant in the commodity.
Astringency is quantified by taste test or by measuring the solubility of tannin or its degree of polymerization.
Bitterness is quantified by taste test or by measuring alkaloids or the specific glucosides responsible for bitter taste.
Aroma (odor) is quantified by use of a human sensory panel in combination with identifying the specific volatile components responsible for the aroma of the fruit.
A comprehensive sensory evaluation can be used to characterize the combined sensory characteristics (sweetness, sourness, astringency, bitterness, overall flavor intensity) of the fruit.
Nutritional value
Various analytical methods are available to determine total carbohydrates, dietary fiber, proteins and individual amino acids, lipids and individual fatty acids, and vitamins and minerals in fruits and vegetables. For the most part, these analyses are specialized and require collaborations with appropriate experts.
Managing bee colonies for optimum pollination
Bee attractants
Bee attractants are designed to attract bees to crops. Several bee attractants ranging from sugar syrup to honey bee pheromones such as Nasonov pheromone, queen mandibular gland pheromone and brood pheromone have been tested to enhance bee visitation and crop yields with mixed success (Delaplane & Mayer, Citation2000; Mayer et al., Citation1989; Sagili et al., Citation2015) or no success (Ellis & Delaplane, Citation2009; Roper et al., Citation1990; Schultheis et al., Citation1994). There are several approaches to testing the effectiveness of bees in response to bee attractants, including measuring changes in the numbers of bees visiting flowers and changes in the levels of pollination (Ellis & Delaplane, Citation2009). The criteria in Fruit-Setting Experiments at the Field Level section apply, and experimental units should never drop below the level of field plot. The complicating factor in these types of trials is achieving suitable replication and controls because attractants require large areas of a crop to be treated. For this reason, the method of using cages is not suitable for studies testing bee attractants. Treated and control plots must have large separations (isolation distance) between them; otherwise there is risk that the attractant may draw bees away from the control plots, thus artificially enhancing the effect of the attractant. Dependent variables can be collected as described in Proportion of Foragers from a Colony Visiting a Crop Direct Tests of Whole Fields to Find the Required Number of Colonies per Hectare, and Appraising Risk of Competition between Plants for Pollination sections.
Manipulation of colony food resources
Feeding syrup
Colonies can be fed liquid sugar syrup (sucrose) to stimulate bees to increase the amount of pollen they collect (Goodwin, Citation1997) (). The syrup needs to be fed inside their hives, and the container needs to include flotation to minimize bee death from drowning. Feeding an average of 1 liter of syrup, with between 45 and 65% sucrose concentration, every day has been reported to result in significant increases in pollen collection (Goodwin & Houten, Citation1991). It is important that any syrup that has started to ferment in the feeder is discarded before more syrup is added. Feeding colonies outside their hives is unlikely to cause colonies to collect pollen.
Figure 16. Feeding a colony sugar syrup.
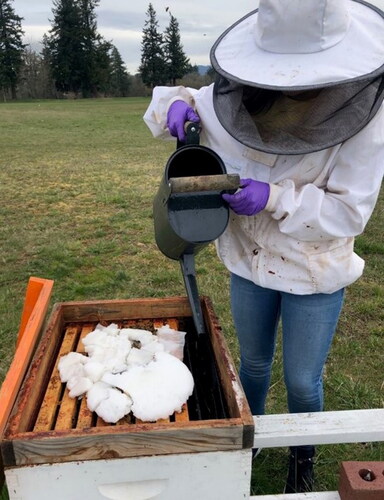
Feeding pollen or pollen substitutes
Colonies can also be fed pollen or pollen substitutes to promote colony growth. Feeding pollen has, however, been reported to decrease the amount of pollen a colony collects (Free & Williams, Citation1971). This effect does not happen in all cases (Goodwin et al., Citation1994).
Trapping pollen
Colonies installed with pollen traps had significantly higher number of pollen foragers when compared to colonies without pollen traps (Gemeda et al., Citation2018).
Testing effects of feeding regimens on pollination performance
Given that a colony’s nutrient state can affect its performance as a pollinator, feeding regimens (e.g., feeding sugar syrup or pollen; restricting pollen) can be used as experimental treatments in pollination studies. In these cases, the criteria in Fruit-Setting Experiments at the Field Level section apply. Experimental units should be no smaller than a field plot and sufficiently isolated to prevent bees drifting and confounding treatments. If space is limiting, cages can be used to contain sufficient plants with colonies assigned the different treatments. Dependent variables can be collected as described in Proportion of Foragers from a Colony Visiting a Crop Direct Tests of Whole Fields to Find the Required Number of Colonies per Hectare, and Appraising Risk of Competition between Plants for Pollination sections.
Distribution of colonies within the crop
The distribution of colonies within a crop is often a controversial issue between growers and beekeepers. This is because it is easiest for the beekeeper to drop off hives in single or several large groups. However, many growers want the hives spread evenly throughout the crop in the hope that there will be an equitable distribution of pollinators. Thus, testing colony distributions that are optimum between these competing interests may be useful. The criteria given in Fruit-Setting Experiments at the Field Level section apply, and experimental units for different hive distribution scenarios should be no smaller than a field plot and sufficiently isolated to prevent drifting of bees and confounding treatments. Dependent variables can be collected as described in Proportion of Foragers from a Colony Visiting a Crop Direct Tests of Whole Fields to Find the Required Number of Colonies per Hectare, and Appraising Risk of Competition between Plants for Pollination sections, and reported as treatment means with plot or field as experimental unit. Depending on the hive distribution patterns selected, the use of field transects may be useful as covariates or supplemental information to understand pollinator performance relative to a point source of bees. Field-Scale Transects section gives useful guidance on the use of field transects and see Cunningham et al. (Citation2016) for an example of using transects to determine optimal spatial arrangement of colonies in almonds.
Conducting pollination research in greenhouses and tunnels
Many high-value cash crops which were once cultivated exclusively in open fields are now grown in greenhouses and net-houses. This shift has been made mainly to protect plants from pests, enable out-of-season production, isolate plants for production of pure seeds, or to limit other environmental hazards (). Assessing pollination activity in an enclosure is similar to assessing it in the open field (see Measures of Colony Level Pollination Efficacy & Determining Crop-Specific Recommended Pollinator Densities sections). However, conducting pollination research in this specialized environment requires special considerations, covered below.
Figure 17. Bee hives placed for greenhouse melon pollination.
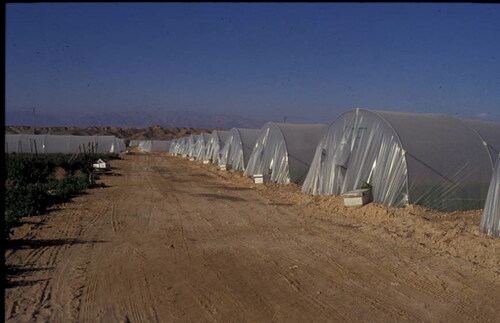
Carbon dioxide (CO2) level
CO2 enrichment has been used for many years in greenhouses to increase crop growth and yield. Since nectar production may be related to photosynthesis level, we might expect an increase in floral rewards in greenhouses with enriched CO2 (Dag & Eisikowitch, Citation2000). On the other hand, if the greenhouse is completely closed and contains high biomass, intensive photosynthesis may lead to a reduction in CO2 to lower than ambient (350 ppm) levels. There are different sensors available on the market to assess CO2 level. Sensors that use non-dispersive infrared (NDIR) technology to measure CO2 concentration in the greenhouse air are common and generally reliable. The sensor is placed near the leaf, i.e., the organ most affected by CO2 levels.
Solar radiation
In recent years, various modifications have been made to the spectral characteristics of greenhouse covers. These alterations are designed to protect greenhouse-grown crops from herbivorous insects and insect-borne viral diseases and to suppress proliferation of foliar diseases. These goals are achieved through partial or complete absorption of solar UV radiation (Raviv & Antignus, Citation2004). However, UV radiation is also essential for honey bee and bumble bee navigation (Sakura et al., Citation2012). Use of UV-absorbing sheets as well as UV-opaque covers (such Perspex and fiberglass) can therefore be detrimental to bees’ pollination activity in enclosures (Dag, Citation2008). The degree of UV absorption can be evaluated using UV sensors (10—400 nm), and opacity to UV radiation can be assessed by observing the shadow of an object in the enclosure through a UV filter; if a distinct shadow cannot be seen, then the UV radiation is diffuse.
Temperature and humidity
Relative humidity tends to be higher in greenhouses than in the open field. This high humidity directly affects floral rewards; the nectar sugar is more dilute since humidity affects rate of evaporative water loss. As a result, nectar sugar concentrations are sometimes below those preferred by honey bees, negatively affecting pollination activity (Dag & Eisikowitch, Citation1999). Furthermore, at high temperatures honey bees lose heat through the evaporative cooling that occurs when they regurgitate nectar from the honey stomach (Heinrich, Citation1980). Hence, temperature and relative humidity sensors should be placed inside the plant foliage to assess the environmental conditions to which the flower is exposed, and also somewhere above the foliage to monitor conditions to which the foragers are exposed.
Directed air flow
Greenhouses are actively ventilated by forced air ventilation or passively by opening side walls to reduce humidity and overheating that stress plants and promote foliar diseases (). Side walls and screens can also be opened to direct and regulate air flow and velocity within the greenhouse relative to the location of a hive. Air flow direction has been shown to affect honey bee pollination activity and subsequent fruit-set in the greenhouse (Dag & Eisikowitch, Citation1995), a phenomenon explained by bees’ tendency to fly upwind (Friesen, Citation1973). It is recommended that a wind speed and direction sensor (anemometer) be placed near the hive entrance as well as in the greenhouse in a central location above the plant foliage.
Figure 18. Greenhouse ventilation system.
Limited food resources
The amount of nectar and pollen provided by a crop in an enclosure is generally insufficient for long-term sustenance of honey bee colonies (Free, Citation1993). The honey bee colonies inside enclosures decline rapidly due to high mortality and collapse eventually (Butler & Haigh, Citation1956; Kalev et al., Citation2002). The adverse effects may also manifest from monofloral pollen source in the enclosure (Herbert et al., Citation1970). There are few strategies to mitigate these nutritional deficits (Dag, Citation2008). One strategy is to allow the honey bees to forage in the open (outside enclosure) and inside the enclosures on alternating days (Butler & Haigh, Citation1956). Another strategy is to use double entrance hives with one entrance leading into the enclosure and the other leading outside the enclosure to allow bees to forage and feed on the surrounding flora (Free, Citation1993). It should be noted that with these two methods there is a risk of pollen contamination, as bees may have pollen grains from several plant species on their bodies besides the target crop in the enclosure. A third possibility is to artificially feed the colony with both sugar syrup and pollen supplements/substitutes (Kalev et al., Citation2002).
Pesticides and pollinators
Negative consequences of pesticide exposure to bees pollinating crops are a serious concern. Methods to assess risk to individual bees and colonies from toxic effects of chemicals are established (OECD, Citation1998a, Citation1998b), and methods are expanding to include sublethal behavioral effects such as disorientation of foragers (see Medrzycki et al., Citation2013) and impacts on brood (OECD, Citation2013; Smith et al., Citation2020). Obviously, any environmental toxins which affect the health of a colony may impact the effectiveness of the colony as a pollinating unit by altering (especially diminishing) foraging activity due to population decline.
Further, the use of chemical attractants and repellents on a blooming crop may also impact the foraging activity of bees and thus overall pollination. The effects of such chemicals can be measured using techniques to determine bee densities in whole fields or orchards (Indirect Extrapolations or Direct Tests of Whole Fields to Find the Required Number of Colonies per Hectare sections) or, more commonly, in small plots. Similar small-plot techniques can be used to gauge any pollination-related effects from GMO crops that potentially arise from altered secretion of nectar and shedding of pollen.
Economic valuation of crop pollination by bees
Several methods have been proposed for the economic valuation of crop pollination by honey bees and wild insects (reviewed in Baylis et al., Citation2021; Melathopoulos et al., Citation2015). This value has been defined as the cost to replace pollination provided by honey bees or wild insects with other sources (e.g., hand pollination) (Allsopp et al., Citation2008), the income of crop production attributable to pollination (Gallai et al., Citation2009; Morse & Calderone, Citation2000), the net income (income - costs) of crop production attributable to pollination (Olschewski et al., Citation2006; Veddeler et al., Citation2008; Winfree et al., Citation2011), or a consumer surplus approach (Southwick & Southwick, Citation1992). Considering the studies using these methods, some focused on the effects of the total depletion of biotic pollination; however, typical management decisions only produce partial changes in biotic pollination (Fisher et al., Citation2008). Therefore, marginal values are most useful when designing management strategies. Here we describe briefly how to quantify the contribution of adding hives of honey bees to the value of crop production at the local scale, using the net income method (Olschewski et al., Citation2006; Veddeler et al., Citation2008; Winfree et al., Citation2011).
The critical variables are the increase in yield realized by the addition of X hives (). The same approach could be broadened to consider other managed bees, for example in terms of the number of non-Apis social bee colonies or the number of cocoons of solitary bees. Complications may occur when multiple species are used for pollination, as they can have non-additive effects on crop yields (Brittain et al., Citation2013). Wild bees are more difficult to incorporate into such calculations, as populations are not so readily changed as with managed species. Moreover, wild species may frequently offset the pollination by managed bees (Garibaldi et al., Citation2013) and they vary considerably in the value they provide to crop yields (Kleijn et al., Citation2015). An excellent approach to determining the relative impacts of stocking rates of managed bees and contributions of wild bees was provided by Eaton and Nams (Citation2012).
Valuation methods apply differently at different scales such as global (Gallai et al., Citation2009), national (Morse & Calderone, Citation2000), regional, subregional, or local. In Determining Yield in Response to Specific Colony Density & Response Variables and Calculations sections we focus on the local scale because this is the level at which management decisions are applied, i.e., the optimal density of hives needed for a certain crop species. At regional or larger scales, lower crop yield produced by massive losses of pollinators can generate compensatory increases in cultivated area to maintain crop production (Garibaldi et al., Citation2011) or increases in market prices of crops (Winfree et al., Citation2011), and these are treated in Economic Valuation at Larger Scales sections.
Determining yield in response to specific colony density
The reader is directed to Measures of Colony Level Pollination Efficacy & Determining Crop-Specific Recommended Pollinator Densities sections that explain these methods in detail, bearing in mind that for our immediate purpose we are interested in the change in net income given a particular increase in hive number. Considering that increased pollinator abundance should augment yield at a decelerating rate to the point that additional individuals do not further increase (e.g., pollen saturation) () or even decrease (e.g., pollen excess) yield (Chacoff et al., Citation2008; Garibaldi et al., Citation2011; Morris et al., Citation2010), valuation analysis should include a range of hive densities (i.e., from zero to high numbers). At the very least two situations are needed for comparison: fields with hives vs. fields without hives (control). Each treatment should be replicated with several fields (Prosser, Citation2010), and the number of necessary fields can be estimated using standard statistical techniques (Anderson et al., Citation2008). In brief, more fields are necessary if we desire higher statistical power or if we face highly heterogeneous conditions within and between fields. Pollination provided by wild insects should be also measured, as the effect of adding hives of honey bees on crop yield will greatly depend on the “base” level of pollination being provided by wild insects. In addition, the presence of wild insects can enhance honey bee pollination behavior (Carvalheiro et al., Citation2011; Greenleaf & Kremen, Citation2006).
Figure 19. The marginal benefit to crop yield (e.g., tonnes per ha) of each additional bee colony decreases with colony number. When this marginal benefit equals the cost generated by more yield (variable cost) plus the cost of renting a hive, the net income generated by the addition of the hive is zero and is no longer economically beneficial for the farmer.
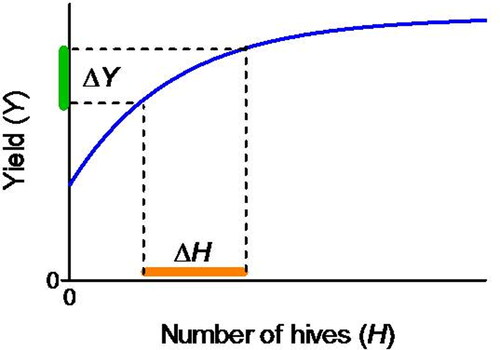
Response variables and calculations
Net income is the difference between costs from income. We are interested in the change in net income () given a particular increase in number of hives (
):
where
is the price that the farmer obtains for each metric tonne of crop,
is the increase in metric tonnes of crop because of the addition of hives (
),
is the cost of producing each tonne (i.e., variable costs such as harvest and transportation costs), and
is the cost of renting each hive. As mentioned before, at least two treatments are needed to estimate yields without honey bees and subtract them from yields with honey bees (
). In case information for several treatments is available, i.e., several densities of colonies are evaluated, a functional form of yield (
) with increased number of hives (
) can be estimated. This function should be used to obtain
values for any number of hives within the measured range ().
The data to perform this valuation should be measured at the field scale (e.g., crop yield) or obtained through questionnaires to the farmers and beekeepers (Olschewski et al., Citation2006). Fruit or seed yield (tons per ha) should be measured at ripeness or harvest. The crop price () and production costs (including the costs of renting hives) should be obtained from questionnaires.
If honey bees promote yield quality (e.g., bigger and well-formed fruits) in addition to yield quantity (), changes in crop prices (P) may occur with or without hives. In this case, the price obtained with the desired number of hives should be used in the above formula to estimate ΔP. On the other hand, if losses of honey-bee colonies are replaced with other sources of pollination (e.g., hand pollination), this change in production costs should be also accounted for in the above formula. Finally, we must account for some management inputs, such as planting hedge rows with flowering species to improve honey-bee colony health, that incur high initial costs but low costs in subsequent years. Therefore, the temporal scale of analyses, as well as equations used to estimate the net income, will depend on the management practices to be evaluated.
By now it should be evident that the quality of the data gathered has a strong influence on the resulting values for the contribution of honey bees. Several of the ideas discussed here (e.g., replication, scale) can also be applied to other objectives such as the evaluation of the impacts of adding hives on the pollination of surrounding wild vegetation or the diversity and abundance of wild pollinators.
Economic valuation at larger scales
The value of honey bee pollination at regional, national and global scale is partially revealed in the total sum expended in rental rates for honey bees. Rental rates, however, may not capture the true value of honey bees in crop pollination because some pollination may occur without rental fees, and rental fees may not reflect the overall value delivered to crops (Goodrich & Goodhue, Citation2020; Grant et al., Citation2021). Moreover, rental rates do not provide information on how prices of agricultural commodities might change with the availability of honey bee stocks, a question which has been of considerable interest (Aizen & Harder, Citation2009; Breeze et al., Citation2014).
To capture the fuller value of pollination, economists rely on marginal utility models to calculate the general social welfare accruing as the supply of pollination services changes (reviewed in Lippert et al., Citation2021). The models begin by determining the price for bee-pollinated crops in a competitive market, where price is the equilibrium point between the demand for the crops by consumers and the amount supplied by the agricultural sector. The value of pollination is then calculated under the condition of partial equilibrium, where one production variable, namely the supply of pollination, is held constant while all other factors remain constant (first described by Southwick & Southwick, Citation1992). It is assumed that pollination functions like any other agricultural input, and by increasing pollination levels, the supply of agricultural products will also increase, resulting in a lower price. Southwick and Southwick (Citation1992) suggest lower prices benefit society in two ways, (1) making the products less expensive for consumers who were willing to purchase the product at the higher price before pollination and (2) dropping the price to the point where new consumers will begin buying the products, resulting in a consumer surplus (). Consequently, the social value of pollination is typically calculated as the increase in the consumer surplus between a situation of full pollination of pollinator-dependent crops and one where pollinating bees have completely disappeared. Others have suggested that pollination can also expand social wealth by increasing the profits of the producer of pollinator-dependent crops, resulting in producer surplus (Gallai et al., Citation2009; Winfree et al., Citation2011). As Baylis et al. (Citation2021) point out, the extent to which the surplus resulting from pollination is realized by consumers, producers or a combination, depends on the elasticity of supply or demand for pollinator dependent crops. Moreover, it has been recognized that the relative impact of pollination deficit has a differential impact on the social benefits across different nations (Chaplin-Kramer et al., Citation2011; Lautenbach et al., Citation2012).
Figure 20. Consumer surplus occurs because consumers are able to purchase a product at a lower price than the highest price they are willing to pay (presented as area between the demand curve and the market price at the equilibrium quantity). If crop price rises, consumer surplus decreases. Producer surplus occurs because producers sell at a price that is higher than the lowest price they are willing to receive to sell their product (presented as the area between the supply curve and the price at the equilibrium quantity). The functional form of the supply and demand curves are only to exemplify the concept of consumer and producer surplus and need to be estimated from real data for each crop and market.
Here we discuss quantifying the extent to which available stocks of honey bees affect crop production value loss or gain at the regional scale. Changes in honey-bee stocks within a region will impact social welfare (SW) in three ways: through the aggregate net income of the crop producers in the affected area (NIr), the aggregate net income of producers outside the affected area but sharing the same market (NIo), and the consumer surplus (CS) (Winfree et al., Citation2011).
The change in net income because of a certain variation (suppose losses) in the number of hives () for producers within and outside an affected area can be estimated similarly to that given above for the local scale:
For producers within the affected area, the loss of honey bees can decrease yield () in comparison to the yield previous to the loss of honey bees (
) and increase in crop price (
). Therefore, net income can be reduced because of lower yield on the one hand, but increased because of higher prices on the other. The net outcome will depend on the relative changes in yield and crop prices. In addition, lower yield will reduce the variable costs (
) such as costs to harvest and transport crop yield. A significant decrease in the number of honey bee colonies will likely increase the cost of renting each hive (
) and modify the number of hives each producer rents (
). For producers outside the affected area, no change in yield (
) or variable costs (
) may happen, but net income is influenced by changes in crop price and probably by changes in the cost of renting a hive. Finally, it is important to note that
will be a function of the amount of crop production (tonnes) that decreases in the affected area in relation to the total production traded at the market and of the ability of producers to increase crop area to compensate for lower production (i.e., the price elasticity of supply) () (Garibaldi et al., Citation2011).
Consumer surplus occurs if consumers are willing to pay a price for the crop product that is higher than market price. Therefore, price increases resulting from honey bee losses will reduce consumer surplus (). Estimating the change in consumer surplus requires estimation of the demand curve using questionnaires or historical market data. The estimations presented here for total welfare effect of a certain variation in honey-bee numbers will also require the estimation of which can be obtained from the price elasticity of supply and the current crop prices () (for more details see Winfree et al., Citation2011). The rest of the data required are the same as discussed in Response Variables and Calculations & Economic Valuation at Larger Scales sections.
We have limited ourselves here to a brief introduction of the key factors for analyzing the value of honey bees as pollinators of agricultural crops at a regional scale. The social welfare value obtained with these models depends on the quality of the data gathered. Notably, most welfare models are based on two reference points in a production function, full pollination, or the complete disappearance of pollination, resulting in little understanding how changes in the supply of managed bees or wild bees ultimately reduce social welfare (Lippert et al., Citation2021; Melathopoulos et al., Citation2015). Correspondingly, it is important to study how the resulting values for social welfare change with variation in the assumed functional forms or parameter estimates (i.e., sensitivity analyses; the same is true for the local scale valuation presented before). Estimations of value will improve the more that the functional relationship between the supply of honey bees crop yield are better resolved. At present these relationships have only been at field scales, and only for some crops; this is a crucial knowledge deficit in our understanding of the benefits of bees to agricultural production.
Acknowledgments
We express our deepest gratitude to all who contributed to the successful completion of this revision, as well as to Dr Mark Goodwin, who contributed to the original version of this paper published in 2013. We also wish to thank the four anonymous reviewers for their insightful comments and suggestions that greatly improved the manuscript. The COLOSS (Prevention of honey bee COlony LOSSes) Association aims to explain and prevent massive honey bee colony losses. It was originally funded through the COST (European Cooperation in Science and Technology) Action FA0803. The COLOSS Association is now supported by the Ricola Foundation - Nature & Culture.
Disclosure statement
No potential conflict of interest was reported by the author(s).
References
- Abdelgadir, H. A., Johnson, S. D., & Van Staden, J. (2012). Pollen viability, pollen germination and pollen tube growth in the biofuel seed crop Jatropha curcas (Euphorbiaceae). South African Journal of Botany, 79, 132–139. https://doi.org/10.1016/j.sajb.2011.10.005
- Aizen, M. A., & Harder, L. D. (2009). The global stock of domesticated honey bees is growing slower than agricultural demand for pollination. Current Biology: CB, 19(11), 915–918. https://doi.org/10.1016/j.cub.2009.03.071
- Alexander, M. (1969). Differential staining of aborted and nonaborted pollen. Stain Technology, 44(3), 117–122. https://doi.org/10.3109/10520296909063335
- Allsopp, M. H., de Lange, W. J., & Veldtman, R. (2008). Valuing insect pollination services with cost of replacement. PLoS One, 3(9), e3128. https://doi.org/10.1371/journal.pone.0003128
- Anderson, D. R., Sweeney, D. J., & Williams, T. A. (2008). Statistics for business and economics (10th ed.). (Thomson South-Western.).
- Arrington, M., & DeVetter, L. W. (2018). Increasing honey bee hive densities promotes pollination and yield components of highbush blueberry in Western Washington. HortScience, 53(2), 191–194. https://doi.org/10.21273/HORTSCI12644-17
- Ascari, L., Novara, C., Dusio, V., Oddi, L., & Siniscalco, C. (2020). Quantitative methods in microscopy to assess pollen viability in different plant taxa. Plant Reproduction, 33(3-4), 205–219. https://doi.org/10.1007/s00497-020-00398-6
- Ashman, T.-L., Knight, T. M., Steets, J. A., Amarasekare, P., Burd, M., Campbell, D. R., Dudash, M. R., Johnston, M. O., Mazer, S. J., Mitchell, R. J., Morgan, M. T., & Wilson, W. G. (2004). Pollen limitation of plant reproduction: Ecological and evolutionary causes and consequences. Ecology, 85(9), 2408–2421. https://doi.org/10.1890/03-8024
- Atlagić, J., Terzić, S., & Marjanović-Jeromela, A. (2012). Staining and fluorescent microscopy methods for pollen viability determination in sunflower and other plant species. Industrial Crops and Products, 35(1), 88–91. https://doi.org/10.1016/j.indcrop.2011.06.012
- Baker, R. G., & Jay, S. C. (1974). A comparison of foraging activity of honey bee colonies with large and small entrances. The Manitoba Entomologist, 8, 48–54.
- Baksay, S., Pornon, A., Burrus, M., Mariette, J., Andalo, C., & Escaravage, N. (2020). Experimental quantification of pollen with DNA metabarcoding using ITS1 and trnL. Scientific Reports, 10(1), 4202. https://doi.org/10.1038/s41598-020-61198-6
- Baylis, K., Lichtenberg, E. M., & Lichtenberg, E. (2021). Economics of pollination. In G. C. Rausser & D. Zilberman (Eds.), Annual review of resource economics (Vol. 13, pp. 335–354). Annual Reviews. https://doi.org/10.1146/annurev-resource-101420-110406
- Benjamin, F. E., & Winfree, R. (2014). Lack of pollinators limits fruit production in commercial blueberry (Vaccinium corymbosum). Environmental Entomology, 43(6), 1574–1583. https://doi.org/10.1603/EN13314
- Bjerge, K., Mann, H. M. R., & Høye, T. T. (2022). Real-time insect tracking and monitoring with computer vision and deep learning. Remote Sensing in Ecology and Conservation, 8(3), 315–327. https://doi.org/10.1002/rse2.245
- Bommarco, R., Marini, L., & Vaissière, B. E. (2012). Insect pollination enhances seed yield, quality, and market value in oilseed rape. Oecologia, 169(4), 1025–1032. https://doi.org/10.1007/s00442-012-2271-6
- Brault, A. M., Oliveira, D. d., Marceau, J., Brault, A. M., Oliveira, D. d., & Marceau, J. (1995). Optimization of apple orchard pollination by honey bees in eastern Canada. Canadian Honey Council Research Symposium Proceedings, 1995, 55–104.
- Breeze, T. D., Vaissière, B. E., Bommarco, R., Petanidou, T., Seraphides, N., Kozák, L., Scheper, J., Biesmeijer, J. C., Kleijn, D., Gyldenkærne, S., Moretti, M., Holzschuh, A., Steffan-Dewenter, I., Stout, J. C., Pärtel, M., Zobel, M., & Potts, S. G. (2014). Agricultural policies exacerbate honeybee pollination service supply-demand mismatches across Europe. PLoS One, 9(1), e82996. https://doi.org/10.1371/journal.pone.0082996
- Brewbaker, J. L., & Kwack, B. H. (1963). The essential role of calcium ion in pollen germination and pollen tube growth. American Journal of Botany, 50(9), 859–865. https://doi.org/10.2307/2439772
- Brito, R. M., McHale, M., & Oldroyd, B. P. (2010). Expression of genes related to reproduction and pollen foraging in honey bees (Apis mellifera) narcotized with carbon dioxide. Insect Molecular Biology, 19(4), 451–461. https://doi.org/10.1111/j.1365-2583.2010.01003.x
- Brittain, C., Williams, N., Kremen, C., & Klein, A.-M. (2013). Synergistic effects of non-Apis bees and honey bees for pollination services. Proceedings. Biological Sciences, 280(1754), 20122767. https://doi.org/10.1098/rspb.2012.2767
- Butler, C. G., & Haigh, J. C. (1956). A note on the use of honey-bees as pollinating agents in cages. Journal of Horticultural Science, 31(4), 295–297. https://doi.org/10.1080/00221589.1956.11513880
- Carvalheiro, L. G., Veldtman, R., Shenkute, A. G., Tesfay, G. B., Pirk, C. W. W., Donaldson, J. S., & Nicolson, S. W. (2011). Natural and within-farmland biodiversity enhances crop productivity. Ecology Letters, 14(3), 251–259. https://doi.org/10.1111/j.1461-0248.2010.01579.x
- Chacoff, N. P., Aizen, M. A., & Aschero, V. (2008). Proximity to forest edge does not affect crop production despite pollen limitation. Proceedings. Biological Sciences, 275(1637), 907–913. https://doi.org/10.1098/rspb.2007.1547
- Chaplin-Kramer, R., Tuxen-Bettman, K., & Kremen, C. (2011). Value of wildland habitat for supplying pollination services to californian agriculture. Rangelands, 33(3), 33–41. https://doi.org/10.2111/1551-501X-33.3.33
- Coissac, E., Riaz, T., & Puillandre, N. (2012). Bioinformatic challenges for DNA metabarcoding of plants and animals. Molecular Ecology, 21(8), 1834–1847. https://doi.org/10.1111/j.1365-294X.2012.05550.x
- Cunningham, S. A., Fournier, A., Neave, M. J., & Le Feuvre, D. (2016). Improving spatial arrangement of honeybee colonies to avoid pollination shortfall and depressed fruit set. Journal of Applied Ecology, 53(2), 350–359. https://doi.org/10.1111/1365-2664.12573
- Dafni, A. (1992). Pollination ecology: A practical approach (Vol. 46). Oxford University Press. https://doi.org/10.2307/2807163
- Dafni, A., & Firmage, D. (2000). Pollen viability and longevity: Practical, ecological and evolutionary implications. Plant Systematics and Evolution, 222(1-4), 113–132. https://doi.org/10.1007/BF00984098
- Dafni, A., Kevan, P. G., & Husband, B. C. (2005). Practical pollination biology. Enviroquest, Ltd.
- Dafni, A., Nepi, M., & Pacini, E. (2005). Pollen and stigma biology. In A. Dafni, P. G. Kevan, & B. C. Husband (Eds.), Practical pollination biology (pp. 83–146). Enviroquest Ltd. https://www.cabdirect.org/cabdirect/abstract/20053155384
- Dag, A. (2008). Bee pollination of crop plants under environmental conditions unique to enclosures. Journal of Apicultural Research, 47(2), 162–165. https://doi.org/10.1080/00218839.2008.11101444
- Dag, A., Afik, O., Yeselson, Y., Schaffer, A., & Shafir, S. (2006). Physical, chemical and palynological characterization of avocado (Persea americana Mill.) honey in Israel. International Journal of Food Science & Technology, 41(4), 387–394. https://doi.org/10.1111/j.1365-2621.2005.01081.x
- Dag, A., & Eisikowitch, D. (1995). The influence of hive location on honeybee foraging activity and fruit set in melons grown in plastic greenhouses. Apidologie, 26(6), 511–519. https://doi.org/10.1051/apido:19950608
- Dag, A., & Eisikowitch, D. (1999). Ventilation of greenhouses increases honey bee foraging activity on melon, Cucumis melo. Journal of Apicultural Research, 38(3-4), 169–175. https://doi.org/10.1080/00218839.1999.11101007
- Dag, A., & Eisikowitch, D. (2000). The effect of carbon dioxide enrichment on nectar production in melons under greenhouse conditions. Journal of Apicultural Research, 39(1-2), 88–89. https://doi.org/10.1080/00218839.2000.11101027
- Dag, A., Gazit, S., Eisenstein, D., El-Batsri, R., & Degani, C. (1999). Effect of the male parent on pericarp and seed weights in several Floridian mango cultivars. Scientia Horticulturae, 82(3-4), 325–329. https://doi.org/10.1016/S0304-4238(99)00059-X
- Dag, A., & Mizrahi, Y. (2005). Effect of pollination method on fruit set and fruit characteristics in the vine cactus Selenicereus megalanthus (“yellow pitaya”). The Journal of Horticultural Science and Biotechnology, 80(5), 618–622. https://doi.org/10.1080/14620316.2005.11511987
- Dag, A., Zvieli, Y., Afik, O., & Elkind, Y. (2008). Honeybee pollination affects fruit characteristics of sweet pepper grown under net-houses. International Journal of Vegetable Science, 13(4), 45–59. https://doi.org/10.1300/J512v13n04_05
- Dedej, S., & Delaplane, K. S. (2003). Honey bee (Hymenoptera: Apidae) pollination of rabbiteye blueberry Vaccinium ashei var. “Climax” is pollinator density-dependent. Journal of Economic Entomology, 96(4), 1215–1220. https://doi.org/10.1603/0022-0493-96.4.1215
- Degani, C., Goldring, A., Adato, I., El-Batsri, R., & Gazit, S. (1990). Pollen parent effect on outcrossing rate, yield, and fruit characteristics of `fuerte’ avocado. HortScience, 25(4), 471–473. https://doi.org/10.21273/HORTSCI.25.4.471
- Delaplane, K. S. (2012). Understanding the impact of honey bee disorders on crop pollination. In D. Sammataro, & J. A. Yoder (Eds.), Honey bee colony health (pp. 223–228). CRC Press.
- Delaplane, K. S., Dag, A., Danka, R. G., Freitas, B. M., Garibaldi, L. A., Goodwin, R. M., & Hormaza, J. I. (2013). Standard methods for pollination research with Apis mellifera. In V. Dietemann, J. D. Ellis & P. Neumann (Eds), The COLOSS BEEBOOK, Volume I: Standard methods for Apis mellifera research. Journal of Apicultural Research, 52(4), 1–28. https://doi.org/10.3896/IBRA.1.52.4.12
- Delaplane, K. S., & Mayer, D. F. (2000). Crop pollination by bees (1st ed.). CABI Publishing. https://doi.org/10.1079/9780851994482.0000
- Eaton, L. J., & Nams, V. O. (2012). Honey bee stocking numbers and wild blueberry production in Nova Scotia. Canadian Journal of Plant Science, 92(7), 1305–1310. https://doi.org/10.4141/cjps2012-045
- Eckert, J. E. (1942). The pollen required by a colony of honeybees. Journal of Economic Entomology, 35(3), 309–311. https://doi.org/10.1093/jee/35.3.309
- Eischen, F. A., & Underwood, B. A. (1991). Cantaloupe pollination trials in the lower Rio Grande Valley. American Bee Journal, 131, 775.
- Ellis, A., & Delaplane, K. S. (2009). An evaluation of Fruit-BoostTM as an aid for honey bee pollination under conditions of competing bloom. Journal of Apicultural Research, 48(1), 15–18. https://doi.org/10.3896/IBRA.1.48.1.04
- Erdtman, G. (1969). Handbook of palynology: Morphology, taxonomy, ecology : An introduction to the study of pollen grains and spores. Munksgaard.
- Faegri, K., & Van Der Pijl, L. (1979). Principles of pollination ecology (3rd ed). Elsevier Science.
- Fernández, J. D., Bosch, J., Nieto-Ariza, B., & Gómez, J. M. (2012). Pollen limitation in a narrow endemic plant: Geographical variation and driving factors. Oecologia, 170(2), 421–431. https://doi.org/10.1007/s00442-012-2312-1
- Fisher, B., Turner, K., Zylstra, M., Brouwer, R., de Groot, R., Farber, S., Ferraro, P., Green, R., Hadley, D., Harlow, J., Jefferiss, P., Kirkby, C., Morling, P., Mowatt, S., Naidoo, R., Paavola, J., Strassburg, B., Yu, D., & Balmford, A. (2008). Ecosystem services and economic theory: Integration for policy-relevant research. Ecological Applications: A Publication of the Ecological Society of America, 18(8), 2050–2067. https://doi.org/10.1890/07-1537.1
- Free, J. B. (1966). The pollination of the beans phaseolus multiflorus and phaseolus vulgaris by honeybees. Journal of Apicultural Research, 5(2), 87–91. https://doi.org/10.1080/00218839.1966.11100139
- Free, J. B. (1993). Insect pollination of crops (2nd ed.). Academic Press. [ISBN?]
- Free, J. B., & Williams, I. H. (1971). The effect of giving pollen and pollen supplement to honeybee colonies on the amount of pollen collected. Journal of Apicultural Research, 10(2), 87–90. https://doi.org/10.1080/00218839.1971.11099676
- Freitas, B. M., & Paxton, R. J. (1996). The role of wind and insects in cashew (Anacardium occidentale) pollination in NE Brazil. The Journal of Agricultural Science, 126(3), 319–326. https://doi.org/10.1017/S0021859600074876
- Freitas, B. M., & Paxton, R. J. (1998). A comparison of two pollinators: The introduced honey bee Apis mellifera and an indigenous bee Centris tarsata on cashew Anacardium occidentale in its native range of NE Brazil. Journal of Applied Ecology, 35(1), 109–121. https://doi.org/10.1046/j.1365-2664.1998.00278.x
- Friesen, L. J. (1973). The search dynamics of recruited honey bees, Apis mellifera ligustica spinola. The Biological Bulletin, 144(1), 107–131. https://doi.org/10.2307/1540150
- Gaaliche, B., Trad, M., & Mars, M. (2011). Effect of pollination intensity, frequency and pollen source on fig (Ficus carica L.) productivity and fruit quality. Scientia Horticulturae, 130(4), 737–742. https://doi.org/10.1016/j.scienta.2011.08.032
- Gabai, A., Vaissière, B. E., Blacquiere, T., Freitas, B. M., Allsopp, M., Chabert, S., Dag, A. (2018). Protocol for using pollinators in hybrid seed production: An outline for improving pollinator effectiveness. https://research.wur.nl/en/publications/protocol-for-using-pollinators-in-hybrid-seed-production-an-outli
- Gaines-Day, H. R., & Gratton, C. (2016). Crop yield is correlated with honey bee hive density but not in high-woodland landscapes. Agriculture, Ecosystems & Environment, 218, 53–57. https://doi.org/10.1016/j.agee.2015.11.001
- Gallai, N., Salles, J.-M., Settele, J., & Vaissière, B. E. (2009). Economic valuation of the vulnerability of world agriculture confronted with pollinator decline. Ecological Economics, 68(3), 810–821. https://doi.org/10.1016/j.ecolecon.2008.06.014
- Garibaldi, L. A., Aizen, M. A., Klein, A. M., Cunningham, S. A., & Harder, L. D. (2011). Global growth and stability of agricultural yield decrease with pollinator dependence. Proceedings of the National Academy of Sciences of the United States of America, 108(14), 5909–5914. https://doi.org/10.1073/pnas.1012431108
- Garibaldi, L. A., Sáez, A., Aizen, M. A., Fijen, T., & Bartomeus, I. (2020). Crop pollination management needs flower-visitor monitoring and target values. Journal of Applied Ecology, 57(4), 664–670. https://doi.org/10.1111/1365-2664.13574
- Garibaldi, L. A., Steffan-Dewenter, I., Winfree, R., Aizen, M. A., Bommarco, R., Cunningham, S. A., Kremen, C., Carvalheiro, L. G., Harder, L. D., Afik, O., Bartomeus, I., Benjamin, F., Boreux, V., Cariveau, D., Chacoff, N. P., Dudenhöffer, J. H., Freitas, B. M., Ghazoul, J., Greenleaf, S., … Klein, A. M. (2013). Wild pollinators enhance fruit set of crops regardless of honey bee abundance. Science (New York, N.Y.), 339(6127), 1608–1611. +. https://doi.org/10.1126/science.1230200
- Gary, N. (1971). Magnetic retrieval of ferrous labels in a capture-recapture system for honey bees hymenoptera-apidae and other insects. Journal of Economic Entomology, 64(4), 961–965. https://doi.org/10.1093/jee/64.4.961
- Gary, N., Witherell, P., & Lorenzen, K. (1981). Effect of age on honey bee (hymenoptera, apidae) foraging distance and pollen collection. Environmental Entomology, 10(6), 950–952. https://doi.org/10.1093/ee/10.6.950
- Gemeda, T. K., Li, J., Luo, S., Yang, H., Jin, T., Huang, J., & Wu, J. (2018). Pollen trapping and sugar syrup feeding of honey bee (Hymenoptera: Apidae) enhance pollen collection of less preferred flowers. PLoS One, 13(9), e0203648. https://doi.org/10.1371/journal.pone.0203648
- Goodrich, B. K., & Goodhue, R. E. (2020). Are all colonies created equal? The role of honey bee colony strength in almond pollination contracts. Ecological Economics, 177, 106744. https://doi.org/10.1016/j.ecolecon.2020.106744
- Goodwin, R. M. (1997). Feeding sugar syrup to honey bee colonies to improve pollination: A review. Bee World, 78(2), 56–62. https://doi.org/10.1080/0005772X.1997.11099335
- Goodwin, R. M., Cox, H. M., Taylor, M. A., Evans, L. J., & McBrydie, H. M. (2011). Number of honey bee visits required to fully pollinate white clover (Trifolium repens) seed crops in Canterbury, New Zealand. New Zealand Journal of Crop and Horticultural Science, 39(1), 7–19. https://doi.org/10.1080/01140671.2010.520164
- Goodwin, R. M., & Houten, A. (1991). Feeding sugar syrup to honey-bee (apis-mellifera) colonies to increase kiwifruit (actinidia-deliciosa) pollen collection—effects of frequency, quantity and time of day. Journal of Apicultural Research, 30(1), 41–49. https://doi.org/10.1080/00218839.1991.11101233
- Goodwin, R. M., Houten, A. T., & Perry, J. H. (1994). Effect of feeding pollen substitutes to honey-bee colonies used for kiwifruit pollination and honey production. New Zealand Journal of Crop and Horticultural Science, 22(4), 459–462. https://doi.org/10.1080/01140671.1994.9513858
- Goodwin, R. M., & Perry, J. (1992). Use of pollen traps to investigate the foraging behavior of honey-bee colonies in kiwifruit orchards. New Zealand Journal of Crop and Horticultural Science, 20(1), 23–26. https://doi.org/10.1080/01140671.1992.10422322
- Grant, K. J., DeVetter, L., & Melathopoulos, A. (2021). Honey bee (Apis mellifera) colony strength and its effects on pollination and yield in highbush blueberries (Vaccinium corymbosum). PeerJ, 9, e11634. https://doi.org/10.7717/peerj.11634
- Greenleaf, S. S., & Kremen, C. (2006). Wild bees enhance honey bees’ pollination of hybrid sunflower. Proceedings of the National Academy of Sciences of the United States of America, 103(37), 13890–13895. https://doi.org/10.1073/pnas.0600929103
- Guerra, M. E., Wünsch, A., López-Corrales, M., & Rodrigo, J. (2010). Flower emasculation as the cause for lack of fruit set in Japanese plum crosses. Journal of the American Society for Horticultural Science, 135(6), 556–562. https://doi.org/10.21273/JASHS.135.6.556
- Gupta, R., Sutradhar, H., Chakrabarty, S. K., Ansari, M. W., & Singh, Y. (2015). Stigmatic receptivity determines the seed set in Indian mustard, rice and wheat crops. Communicative & Integrative Biology, 8(5), e1042630. https://doi.org/10.1080/19420889.2015.1042630
- Hasegawa, Y., Suyama, Y., & Seiwa, K. (2009). Pollen donor composition during the early phases of reproduction revealed by DNA genotyping of pollen grains and seeds of Castanea crenata. The New Phytologist, 182(4), 994–1002. https://doi.org/10.1111/j.1469-8137.2009.02806.x
- Hawkins, J., de Vere, N., Griffith, A., Ford, C. R., Allainguillaume, J., Hegarty, M. J., Baillie, L., & Adams-Groom, B. (2015). Using DNA metabarcoding to identify the floral composition of honey: A new tool for investigating honey bee foraging preferences. PLoS One, 10(8), e0134735. https://doi.org/10.1371/journal.pone.0134735
- Hedhly, A., Hormaza, J. I., & Herrero, M. (2009). Flower emasculation accelerates ovule degeneration and reduces fruit set in sweet cherry. Scientia Horticulturae, 119(4), 455–457. https://doi.org/10.1016/j.scienta.2008.08.020
- Heinrich, B. (1980). Mechanisms of body-temperature regulation in honeybees, apis mellifera: I. regulation of head temperature. Journal of Experimental Biology, 85(1), 61–72. https://doi.org/10.1242/jeb.85.1.61
- Herbert, E. W., Bickley, W. E., & Shimanuki, H. (1970). The brood-rearing capability of caged honey bees1 fed dandelion and mixed pollen diets2. Journal of Economic Entomology, 63(1), 215–218. https://doi.org/10.1093/jee/63.1.215
- Herrero, M., & Hormaza, J. I. (1996). Pistil strategies controlling pollen tube growth. Sexual Plant Reproduction, 9(6), 343–347. https://doi.org/10.1007/BF02441953
- Heslop-Harrison, J., & Heslop-Harrison, Y. (1970). Evaluation of pollen viability by enzymatically induced fluorescence; intracellular hydrolysis of fluorescein diacetate. Stain Technology, 45(3), 115–120. https://doi.org/10.3109/10520297009085351
- Howpage, D., Spooner-Hart, R. N., & Sheehy, J. (1998). A successful method of mass marking honey bees, Apis mellifera, at the hive entrance for field experiments. Journal of Apicultural Research, 37(2), 91–97. https://doi.org/10.1080/00218839.1998.11100960
- Hudson, L. C., Chamberlain, D., & Stewart, C. N. JR, (2001). GFP-tagged pollen to monitor pollen flow of transgenic plants. Molecular Ecology Notes, 1(4), 321–324. https://doi.org/10.1046/j.1471-8278.2001.00079.x
- Jay, S. (1986). Spatial management of honey bees on crops. Annual Review of Entomology, 31(1), 49–65. https://doi.org/10.1146/annurev.en.31.010186.000405
- Jones, G. D. (2012). Pollen extraction from insects. Palynology, 36(1), 86–109. https://doi.org/10.1080/01916122.2011.629523
- Kader, A. A. (2002). Postharvest technology of horticultural crops (3rd ed.). University of California Agriculture and Natural Resources.
- Kalev, H., Dag, A., & Shafir, S. (2002). Feeding pollen supplements to honey bee colonies during pollination of sweet pepper in enclosures. American Bee Journal, 142, 675–679.
- Kawashima, S., Clot, B., Fujita, T., Takahashi, Y., & Nakamura, K. (2007). An algorithm and a device for counting airborne pollen automatically using laser optics. Atmospheric Environment, 41(36), 7987–7993. https://doi.org/10.1016/j.atmosenv.2007.09.019
- Kearns, C. A., & Inouye, D. W. (1993). Techniques for pollination biologists. University Press of Colorado. http://www.gbv.de/dms/bowker/toc/9780870812811.pdf
- Kirk, W. D. J. (2006). A colour guide to pollen loads of the honey bee (2nd ed.). International Bee Research Association (IBRA). [ISBN 978-0860982487] https://ibra.org.uk/product/a-colour-guide-to-pollen-loads-of-the-honey-bee-2nd-revised-edn
- Klatt, B. K., Holzschuh, A., Westphal, C., Clough, Y., Smit, I., Pawelzik, E., & Tscharntke, T. (2014). Bee pollination improves crop quality, shelf life and commercial value. Proceedings. Biological Sciences, 281(1775), 20132440. https://doi.org/10.1098/rspb.2013.2440
- Klatt, B. K., Klaus, F., Westphal, C., & Tscharntke, T. (2014). Enhancing crop shelf life with pollination. Agriculture & Food Security, 3(1), 14. https://doi.org/10.1186/2048-7010-3-14
- Kleijn, D., Winfree, R., Bartomeus, I., Carvalheiro, L. G., Henry, M., Isaacs, R., Klein, A.-M., Kremen, C., M'Gonigle, L. K., Rader, R., Ricketts, T. H., Williams, N. M., Lee Adamson, N., Ascher, J. S., Báldi, A., Batáry, P., Benjamin, F., Biesmeijer, J. C., Blitzer, E. J., … Potts, S. G. (2015). Delivery of crop pollination services is an insufficient argument for wild pollinator conservation. Nature Communications, 6(1), 7414. https://doi.org/10.1038/ncomms8414
- Landaverde-González, P., Quezada-Euán, J. J. G., Theodorou, P., Murray, T. E., Husemann, M., Ayala, R., Moo-Valle, H., Vandame, R., & Paxton, R. J. (2017). Sweat bees on hot chillies: Provision of pollination services by native bees in traditional slash-and-burn agriculture in the Yucatan Peninsula of tropical Mexico. The Journal of Applied Ecology, 54(6), 1814–1824. https://doi.org/10.1111/1365-2664.12860
- Lautenbach, S., Seppelt, R., Liebscher, J., & Dormann, C. F. (2012). Spatial and temporal trends of global pollination benefit. PLoS One, 7(4), e35954. https://doi.org/10.1371/journal.pone.0035954
- Levin, M. D. (1960). A comparison of two methods of mass-marking foraging honey bees. Journal of Economic Entomology, 53(4), 696–698. https://doi.org/10.1093/jee/53.4.696a
- Levin, M. D., & Loper, G. M. (1984). Factors affecting pollen trap efficiency. American Bee Journal, 124(10), 721–723.
- Linskens, H. F., & Esser, K. (1957). Über eine spezifische Anfärbung der Pollenschläuche im Griffel und die Zahl der Kallosepfropfen nach Selbstung und Fremdung. Die Naturwissenschaften, 44(1), 16–16. https://doi.org/10.1007/BF00629340
- Lippert, C., Feuerbacher, A., & Narjes, M. (2021). Revisiting the economic valuation of agricultural losses due to large-scale changes in pollinator populations. Ecological Economics, 180, 106860. https://doi.org/10.1016/j.ecolecon.2020.106860
- Mallinger, R., Ternest, J. J., & Naranjo, S. M. (2021). Blueberry yields increase with bee visitation rates, but bee visitation rates are not consistently predicted by colony stocking densities. Journal of Economic Entomology, 114(4), 1441–1451. https://doi.org/10.1093/jee/toab111
- Manning, R., Manning, R., Boland, J., & Boland, J. (2000). A preliminary investigation into honey bee (Apis mellifera) pollination of canola (Brassica napus cv. Karoo) in Western Australia. Australian Journal of Experimental Agriculture, 40(3), 439–442. https://doi.org/10.1071/EA98148
- Martarello, N. S., Gruchowski-Woitowicz, F. C., & Agostini, K. (2021). Pollinator efficacy in yellow passion fruit (Passiflora edulis f. Flavicarpa deg., passifloraceae). Neotropical Entomology, 50(3), 349–357. https://doi.org/10.1007/s13744-020-00846-y
- Matsuki, Y., Tateno, R., Shibata, M., & Isag, Y. (2008). Pollination efficiencies of flower-visiting insects as determined by direct genetic analysis of pollen origin. American Journal of Botany, 95(8), 925–930. https://doi.org/10.3732/ajb.0800036
- Mayer, D., Britt, R., & Lunden, J. (1989). Evaluation of beescent as a honey bee attractant. American Bee Journal, 129(1), 41–42.
- McDonald, J. L. (1968). The behaviour of pollen foragers which lose their load. Journal of Apicultural Research, 7(1), 45–46. https://www.tandfonline.com/doi/abs/10.1080/00218839.1968.11100186 https://doi.org/10.1080/00218839.1968.11100186
- Medrzycki, P., Giffard, H., Aupinel, P., Belzunces, L. P., Chauzat, M.-P., Claßen, C., Colin, M. E., Dupont, T., Girolami, V., Johnson, R., Le Conte, Y., Lückmann, J., Marzaro, M., Pistorius, J., Porrini, C., Schur, A., Sgolastra, F., Delso, N. S., van der Steen, J. J. M., … Vidau, C. (2013). Standard methods for toxicology research in Apis mellifera. In V. Dietemann, J. D. Ellis & P.Neumann (Eds), The COLOSS BEEBOOK, Volume I: Standard methods for Apis mellifera research. Journal of Apicultural Research, 52(4), 1–60. https://doi.org/10.3896/IBRA.1.52.4.14
- Melathopoulos, A. P., Cutler, G. C., & Tyedmers, P. (2015). Where is the value in valuing pollination ecosystem services to agriculture? Ecological Economics, 109, 59–70. https://doi.org/10.1016/j.ecolecon.2014.11.007
- Mesquida, J., Renard, M., & Pierre, J. (1988). Rapeseed (brassica-Napus L) productivity—the effect of honeybees (apis-Mellifera L) and different pollination conditions in cage and field-tests. Apidologie, 19(1), 51–72. https://doi.org/10.1051/apido:19880104
- Morris, W. F., Vázquez, D. P., & Chacoff, N. P. (2010). Benefit and cost curves for typical pollination mutualisms. Ecology, 91(5), 1276–1285. https://doi.org/10.1890/08-2278.1
- Morse, R. A., & Calderone, N. W. (2000). The value of honey bees as pollinators of U.S. crops in 2000. Bee Culture, 128.
- Mudd, S. J., & Seshadri, A. (2012). Image analysis protocol for detecting and counting viable and inviable pollen grains. Journal of Plant Studies, 1(2), 158–167. https://doi.org/10.5539/jps.v1n2p158
- Nasir, A., Ullah, M. O., Yousaf, M. H., & Aziz, M. A. (2021). Acquisition of 3-D trajectories with labeling support for multi-species insects under unconstrained flying conditions. Ecological Informatics, 64, 101381. https://doi.org/10.1016/j.ecoinf.2021.101381
- Ne’eman, G., Jürgens, A., Newstrom-Lloyd, L., Potts, S. G., & Dafni, A. (2010). A framework for comparing pollinator performance: Effectiveness and efficiency. Biological Reviews of the Cambridge Philosophical Society, 85(3), 435–451. https://doi.org/10.1111/j.1469-185X.2009.00108.x
- Nepi, M., & Pacini, E. (1993). Pollination, pollen viability and pistil receptivity in cucurbita-pepo. Annals of Botany, 72(6), 527–536. https://doi.org/10.1006/anbo.1993.1141
- OECD (1998a). Test no. 213: Honeybees, acute oral toxicity test. In OECD guidelines for the testing of chemicals, section 2 (OECD publishing). Organisation for Economic Co-operation and Development. https://www.oecd-ilibrary.org/environment/test-no-213-honeybees-acute-oral-toxicity-test_9789264070165-en
- OECD (1998b). Test no. 214: Honeybees, acute contact toxicity test. In OECD guidelines for the testing of chemicals, section 2 (OECD publishing). Organisation for Economic Co-operation and Development. https://www.oecd-ilibrary.org/environment/test-no-214-honeybees-acute-contact-toxicity-test_9789264070189-en
- OECD (2013). Test no. 237: Honey bee (apis mellifera) larval toxicity test, single exposure. In OECD guidelines for the testing of chemicals, section 2 (OECD publishing). Organisation for Economic Co-operation and Development. https://www.oecd-ilibrary.org/environment/test-no-237-honey-bee-apis-mellifera-larval-toxicity-test-single-exposure_9789264203723-en
- Olschewski, R., Tscharntke, T., Benítez, P. C., Schwarze, S., & Klein, A.-M. (2006). Economic evaluation of pollination services comparing coffee landscapes in Ecuador and Indonesia. Ecology and Society, 11(1), 7. https://doi.org/10.5751/ES-01629-110107
- Palmer-Jones, T., & Clinch, P. G. (1974). Observations on the pollination of Chinese gooseberries variety ‘Hayward.’. New Zealand Journal of Experimental Agriculture, 2(4), 455–458. https://doi.org/10.1080/03015521.1974.10427714
- Pankiw, T., & Page, R. E. (2000). Response thresholds to sucrose predict foraging division of labor in honeybees. Behavioral Ecology and Sociobiology, 47(4), 265–267. https://doi.org/10.1007/s002650050664
- Perez-Balam, J., Quezada-Euan, J. J., Alfaro-Bates, R., Medina, S., McKendrick, L., Soro, A., & Paxton, R. J. (2012). The contribution of honey bees, flies and wasps to avocado (Persea americana) pollination in southern Mexico. Journal of Pollination Ecology, 8, 42–47. https://doi.org/10.26786/1920-7603(2012)6
- Peterson, R., Slovin, J. P., & Chen, C. (2010). A simplified method for differential staining of aborted and non-aborted pollen grains. International Journal of Plant Biology, 1(2), e13. https://doi.org/10.4081/pb.2010.e13
- Pierre, J., Vaissière, B., Vallée, P., & Renard, M. (2010). Efficiency of airborne pollen released by honeybee foraging on pollination in oilseed rape: A wind insect-assisted pollination. Apidologie, 41(1), 109–115. https://doi.org/10.1051/apido/2009056
- Pinillos, V., & Cuevas, J. (2008). Standardization of the fluorochromatic reaction test to assess pollen viability. Biotechnic & Histochemistry: Official Publication of the Biological Stain Commission, 83(1), 15–21. https://doi.org/10.1080/10520290801987204
- Prosser, J. I. (2010). Replicate or lie. Environmental Microbiology, 12(7), 1806–1810. https://doi.org/10.1111/j.1462-2920.2010.02201.x
- Ratnayake, M. N., Dyer, A. G., & Dorin, A. (2021). Tracking individual honeybees among wildflower clusters with computer vision-facilitated pollinator monitoring. PLoS One, 16(2), e0239504. https://doi.org/10.1371/journal.pone.0239504
- Raviv, M., & Antignus, Y. (2004). UV radiation effects on pathogens and insect pests of greenhouse-grown crops. Photochemistry and Photobiology, 79(3), 219–226. https://doi.org/10.1562/SI-03-14.1
- Ribbands, C. R. (1950). Changes in the behaviour of honey-bees following their recovery from anaesthesia. The Journal of Experimental Biology, 27(3-4), 302–310. https://doi.org/10.1242/jeb.27.3.302
- Rice, J. H., Millwood, R. J., Mundell, R. E., Chambers, O. D., Abercrombie, L. L., Davies, H. M., & Stewart, C. N. (2013). An orange fluorescent protein tagging system for real-time pollen tracking. BMC Research Notes, 6(1), 383. https://doi.org/10.1186/1756-0500-6-383
- Richardson, R. T., Lin, C.-H., Sponsler, D. B., Quijia, J. O., Goodell, K., & Johnson, R. M. (2015). Application of Its2 metabarcoding to determine the provenance of pollen collected by honey bees in an agroecosystem. Applications in Plant Sciences, 3(1), 1400066. https://doi.org/10.3732/apps.1400066
- Rizzardo, R. A. G., Milfont, M. O., Da Silva, E. M. S., & Freitas, B. M. (2012). Apis mellifera pollination improves agronomic productivity of anemophilous castor bean (Ricinus communis). Anais da Academia Brasileira de Ciencias, 84(4), 1137–1145. https://doi.org/10.1590/S0001-37652012005000057
- Roper, T. R., Averill, A. L., & Mahr, D. L. (1990). Does Bee-Scent(r) attract honey bees and enhance cranberry pollination? Cranberries, 54, 8–9.
- Rucker, R. R., Thurman, W. N., & Burgett, M. (2012). Honey bee pollination markets and the internalization of reciprocal benefits. American Journal of Agricultural Economics, 94(4), 956–977. https://doi.org/10.1093/ajae/aas031
- Sagili, R. R., Breece, C. R., Simmons, R., & Borden, J. H. (2015). Potential of honeybee brood pheromone to enhance foraging and yield in hybrid carrot seed. HortTechnology, 25(1), 98–104. https://doi.org/10.21273/HORTTECH.25.1.98
- Sakura, M., Okada, R., & Aonuma, H. (2012). Evidence for instantaneous e-vector detection in the honeybee using an associative learning paradigm. Proceedings of the Royal Society. Proceedings. Biological Sciences, 279(1728), 535–542. https://doi.org/10.1098/rspb.2011.0929
- Samnegård, U., Hambäck, P. A., & Smith, H. G. (2019). Pollination treatment affects fruit set and modifies marketable and storable fruit quality of commercial apples. Royal Society Open Science, 6(12), 190326. https://doi.org/10.1098/rsos.190326
- Sampson, B. J., & Cane, J. H. (2000). Pollination efficiencies of three bee (Hymenoptera: Apoidea) species visiting rabbiteye blueberry. Journal of Economic Entomology, 93(6), 1726–1731. https://doi.org/10.1603/0022-0493-93.6.1726
- Schultheis, J. R., Ambrose, J. T., Bambara, S. B., & Mangum, W. A. (1994). Selective bee attractants did not improve cucumber and watermelon yield. HortScience, 29(3), 155–158. https://doi.org/10.21273/HORTSCI.29.3.155
- Shivanna, K. R., & Johri, B. M. (1985). The angiosperm pollen: Structure and function. Wiley Eastern.
- Shivanna, K. R., Linskens, H. F., & Cresti, M. (1991). Pollen viability and pollen vigor. TAG. Theoretical and Applied Genetics. Theoretische Und Angewandte Genetik, 81(1), 38–42. https://doi.org/10.1007/BF00226109
- Smith, D. B., Arce, A. N., Rodrigues, A. R., Bischoff, P. H., Burris, D., Ahmed, F., & Gill, R. J. (2020). Insecticide exposure during brood or early-adult development reduces brain growth and impairs adult learning in bumblebees. Proceedings. Biological Sciences, 287(1922), 20192442. https://doi.org/10.1098/rspb.2019.2442
- Southwick, E., & Southwick, L. (1992). Estimating the economic value of honey-bees (hymenoptera, apidae) as agricultural pollinators in the United-States. Journal of Economic Entomology, 85(3), 621–633. https://doi.org/10.1093/jee/85.3.621
- Spears, E. (1983). A direct measure of pollinator effectiveness. Oecologia, 57(1-2), 196–199. https://doi.org/10.1007/BF00379581
- Stavert, J. R., Bailey, C., Kirkland, L., & Rader, R. (2020). Pollen tube growth from multiple pollinator visits more accurately quantifies pollinator performance and plant reproduction. Scientific Reports, 10(1), 16958. https://doi.org/10.1038/s41598-020-73637-5
- Stern, R. A., Goldway, M., Zisovich, A. H., Shafir, S., & Dag, A. (2004). Sequential introduction of honeybee colonies increases crosspollination, fruit-set and yield of “Spadona” pear (Pyrus communis L.)The Journal of Horticultural Science and Biotechnology, 79(4), 652–658. https://doi.org/10.1080/14620316.2004.11511821
- Stubbs, C. S., & Drummond, F. A. (2001). Bombus impatiens (Hymenoptera: Apidae): An alternative to Apis mellifera (Hymenoptera: Apidae) for lowbush blueberry pollination. Journal of Economic Entomology, 94(3), 609–616. https://doi.org/10.1603/0022-0493-94.3.609
- Sun, C., & Gaydecki, P. (2021). A Visual tracking system for honey bee (hymenoptera: Apidae) 3D flight trajectory reconstruction and analysis. Journal of Insect Science (Online), 21(2), 17. https://doi.org/10.1093/jisesa/ieab023
- Suyama, Y. (2011). Procedure for single-pollen genotyping. In Y. Isagi & Y. Suyama (Eds.), Single-pollen genotyping (pp. 7–15). Springer Japan. https://doi.org/10.1007/978-4-431-53901-8_2
- Synge, A. D. (1947). Pollen collection by honeybees (Apis mellifera). The Journal of Animal Ecology, 16(2), 122–138. https://doi.org/10.2307/1492
- Taber, S. K., & Olmstead, J. W. (2016). Impact of cross- and self-pollination on fruit set, fruit size, seed number, and harvest timing among 13 southern highbush blueberry cultivars. HortTechnology, 26(2), 213–219. https://doi.org/10.21273/HORTTECH.26.2.213
- Taylor, L. P., & Hepler, P. K. (1997). Pollen germination and tube growth. Annual Review of Plant Physiology and Plant Molecular Biology, 48(1), 461–491. https://doi.org/10.1146/annurev.arplant.48.1.461
- Thomson, J. (1981). Field measures of flower constancy in bumblebees. American Midland Naturalist, 105(2), 377–380. https://doi.org/10.2307/2424756
- Topitzhofer, E., Lucas, H., Carlson, E., Chakrabarti, P., & Sagili, R. (2021). Collection and identification of pollen from honey bee colonies. Journal of Visualized Experiments: JoVE, 167(167), e62064. https://doi.org/10.3791/62064
- Vaissière, B. E. (1991). Honey bee stocking rate, pollinator visitation, and pollination effectiveness in upland cotton grown for hybrid seed production. Acta Horticulturae, 288(288), 359–363. https://doi.org/10.17660/ActaHortic.1991.288.58
- Vaissière, B. E., Freitas, B., & Gemmill-Herren, B. (2011). Protocol to detect and assess pollination deficits in crops: A handbook for its use. Food and Agriculture Organization of the United Nations. https://hal.inrae.fr/hal-02805909/document
- VaissiÉre, B. E., Rodet, G., Cousin, M., Botella, L., & TorrÉ Grossa, J.-P. (1996). Pollination effectiveness of honey bees (Hymenoptera: Apidae) in a kiwifruit orchard. Journal of Economic Entomology, 89(2), 453–461. https://doi.org/10.1093/jee/89.2.453
- Veddeler, D., Olschewski, R., Tscharntke, T., & Klein, A.-M. (2008). The contribution of non-managed social bees to coffee production: New economic insights based on farm-scale yield data. Agroforestry Systems, 73(2), 109–114. https://doi.org/10.1007/s10457-008-9120-y
- Warburton, R. C., & Jones, P. L. (2023). Markerless tracking of bumblebee foraging allows for new metrics of bee behavior and demonstrations of increased foraging efficiency with experience. Apidologie, 55(1), 2. https://doi.org/10.1007/s13592-023-01036-6
- Winfree, R., Gross, B. J., & Kremen, C. (2011). Valuing pollination services to agriculture. Ecological Economics, 71, 80–88. https://doi.org/10.1016/j.ecolecon.2011.08.001