
Abstract
In a year-long research study, we delved into the thermoregulation and performance of twenty-one honey bee colonies situated in three distinct landscape settings: 1- Urban, 2- Agricultural (AG), and 3- Non-agricultural (Non-AG) environments. All colonies, consistent in size, were equipped with sensors designed to record inner hive temperature and humidity. Additionally, colonies were placed on precision electronic scales for weight monitoring. Varroa mite infestations were documented at seven different time points throughout the experiment. Colonies were genetically analyzed for subspecies and haplotype identification using the in silico DraI mtDNA COI-COII test. Our results unveiled an overall significant (p < 0.001) weight gain (5.76 kg) in colonies located within the urban setting, in stark contrast to both AG and Non-AG locations. Notably, colonies situated in the natural refuge center (Non-AG) experienced a weight loss of −0.05 kg, signaling a lack of sustainable forage resources in such a setting. Similarly, the inner hive temperature was significantly (p < 0.001) higher in the urban area (33.65 °C) with a significantly lower relative humidity (61.2%) compared to both other locations. Among the locations, the temperature variable displayed the strongest significant correlation (p < 0.001) with a positive correlation coefficient (r = 0.95). Two distinct mtDNA haplotypes were identified: C1 and C2j, characterizing the ligustica and carnica maternal origin, respectively. These haplotypes consistently demonstrated significant differences in their thermoregulation and weight gain, irrespective of the landscape compositions. The C1 haplotype displayed significantly higher weight gain alongside lower inner hive temperature and humidity levels compared to the C2j haplotype. No differences in mite infestation were observed between the various locations or haplotypes. Our data underscores the substantial impact of landscape composition on honey bee performance. It also unveils significant variations in thermoregulation and adaptation between haplotypes, shedding light on the multifaceted relationship between environmental factors, genetics, and bee colony dynamics.
Introduction
The honey bee (Apis mellifera L.), one of the most efficient pollinators of a wide range of plants and crops (Calderone, Citation2012; Robinson & Page, Citation1989), operates in complex ecosystems and is exposed to various environmental stressors and agrochemicals (Berenbaum & Liao, Citation2019; Johnson et al., Citation2010; van der Sluijs et al., Citation2013). Some environmental stressors, such as habitat loss or shift, forage poor nutritional value and unsustainability as well as transportation stress, play a central role in colony poor performance and loss (Ahn et al., Citation2012; Alburaki et al., Citation2018; Cook et al., Citation2003; Simone-Finstrom et al., Citation2016). Honey bee colonies face multiple pathogenetic and parasitic threats, particularly the veracious ectoparasite Varroa destructor, which efficiently vectors and propagates multiple deadly bee viruses such as deformed wing virus DWV, to cite one. (Alaux et al., Citation2011; Evans & Schwarz, Citation2011; Ryabov et al., Citation2017; Traynor et al., Citation2020). As such, to thrive, honey bee colonies have to withstand and overcome a complex dynamic interaction among these factors, which often act synergistically (Alburaki et al., Citation2015; Aufauvre et al., Citation2012; Tosi et al., Citation2017).
Honey bee colony thermoregulation and weight development are usually monitored using small sensors within the hive cavity and placing bee colonies on sensitive scales (Alburaki et al., Citation2017; Meikle et al., Citation2016; Stalidzans & Berzonis, Citation2013; Zacepins et al., Citation2016). Adequate colony thermoregulation is critical for honey bee health and performance. To produce a healthy brood and survive the winter season, bees must maintain both inner hive temperature and humidity at optimal levels (Mitchell, Citation2019) regardless of the outside ambient temperature. The brood nest must be kept within an optimal and narrow range of (34-35 °C), which is critical for developing a healthy brood (Abou-Shaara et al., Citation2017; Winston, Citation1987). This temperature range requires significant energy, which bees generate via thermoregulatory behaviors such as increased metabolic rate and locomotor activity, clustering, and fanning (Kronenberg & Heller, Citation1982).
Consequently, suboptimal temperature or fluctuation in the brood nest could lead to brood damage, adult bee deformation, a decline in cognition abilities, and the development of diseases (Dalmon et al., Citation2019; Jones et al., Citation2005; Meikle et al., Citation2017; Zhu et al., Citation2018). Low temperatures were also associated with the downregulation of bee immune response and increased pathogenic infections (Steinmann et al., Citation2015). Besides colony thermoregulation, other factors such as genetics and pathogenicity are closely involved in colony performance (Tarpy et al., Citation2013). For instance, a decline in the genetic diversity of managed and wild honey bee populations has been linked to poor performance and a lack of environmental adaptation (Panziera et al., Citation2022). Very few studies have investigated the local adaptation of honey bee subspecies or haplotypes to specific forage or microenvironment (Louveaux, Citation1973).
Nonetheless, one of the major factors that weigh heavily on the level of colony performance remains the quality and quantity of available forage. Such element is determined based on the landscape compositions surrounding the colonies and available to bees within the range of foraging distance estimated at 2-3 km radius (Seeley, Citation2010). Previous studies have demonstrated that colonies foraging in low agricultural areas with urban activity had better brood production and higher pollen diversity than those in moderate and high agricultural areas (Alburaki et al., Citation2017; Citation2018).
In this one-year field experiment, we investigated the effect of landscape composition on honey bee performance and thermoregulation. We compared by continuously monitoring colony weight, inner temperature, and humidity, the impacts of the land use and nature of forage on honey bee colony development and Varroa load. Subsequently, the performance and thermoregulation of two identified mtDNA haplotypes were assessed under the same field conditions.
Materials and methods
Honey bee colonies
Twenty-one honey bee packages, equal in size, were received from a local provider and transferred to new bottom-screened 10-frame Langstroth (U.S. Patent 9300, 1852) wooden hives (Betterbee, Greenwich, NY) in May 2021. The provider described the queen bees supplied with the packages as Italian queens (Apis mellifera ligustica). The Langstroth hives comprise one brood chamber, screened-bottom board for Varroa count, inner and top covers, standard entrance doors, and ten new frames with plastic foundations. Initially, all colonies were placed at the same location on the USDA-ARS campus in Beltsville - Maryland (), fed 4 liters of 1:1 sugar syrup, and observed for successful queen acceptance and oviposition. Once oviposition was confirmed, hives were randomly assigned and transferred to three different locations, seven hives per location. This study lasted eleven months, covering all seasons (spring, summer, fall, winter) from May 2021 to March 2022. All experimental colonies received similar beekeeping care with limited disturbance, and no Varroa treatment was applied during the experiment. Colonies were only fed once at the beginning of the experiment. No honey was extracted from these colonies and no winter feedings were provided either.
Table 1. Description and distribution of the studied hives and the landscape composition for each location. Identification of mtDNA haplotypes and honey bee subspecies using the in silico DraI mtDNA COI-COII test. S: structure of the COI-COII intergenic region, L: evolutionary lineage.
Landscape composition
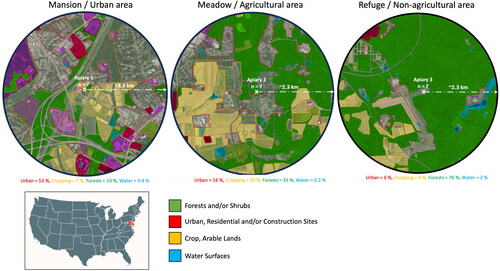
To understand the effect of landscape composition on honey bee colony performance and thermoregulation, three locations were chosen based on their forage availability and land use. All sites were in Beltsville (Maryland) and were as follows: 1- Mansion, which consisted of a high urban area in the city of Beltsville (39.032227, −76.937977), 2- Meadow, which is located in the agricultural fields of the USDA campus (39.037845, −76.876145) and 3- a non-agricultural area situated at the edge of the natural refuge center of Patuxent (39.030028, −76.815934), . The land use and composition were determined using HeiGIT OSM Landuse Landcover online tool (Schultz et al., Citation2017).
Figure 1. Landscape composition and land use at the three studied locations and apiaries (1- Mansion: Urban area, 2- Meadow: Agricultural area, 3- Refuge: Non-agricultural area). Total number of colonies per location (n = 7), (2.3 km) is the estimated foraging distance.
Humidity and temperature sensor
In each colony, an HM-1 (2nd Generation) humidity and temperature sensor from SolutionBee LLC (NC, USA), integrated into a new wooden frame, was placed in the center of the brood box. These sensors are specifically designed and adjusted to monitor the thermoregulation of honey bee hives with high precision and an operating range of temperature going from −30 °C to 60 °C. One single read per hour was recorded through these sensors for humidity and temperature for each colony from June 2021 to March 2022.
Colony weight development
Each colony was placed on self-sustained (HM-5) electronic scales (SolutionBee LLC, NC, USA), which, similar to the temperature and humidity setting, was programmed to collect a single weight read per hour. The scale dimensions can accommodate a 10-frame hive (56 cm x 42 cm x 6 cm) and record outdoor temperature from −10 °C to 60 °C with a maximum weight capacity of 150 kg and a sensitivity of ± 0.05 kg.
Varroa load
Varroa mite (Varroa destructor) infestation was recorded for each colony once a month at seven time points from June 2021 to December 2021. Varroa mite load was estimated by the mite board method, which assesses the overall Varroa mite infestation within the honey bee colonies. A sticky tray was placed at the bottom board of each colony for 72 h for Varroa mite count. Subsequently, the mite count per hive was divided by three to obtain the Varroa drop per 24 h (Branco et al., Citation2006).
Data collection
Humidity, temperature, and weight data were collected without disturbing the colonies through wireless connectivity. Data were collected monthly using an Android device on which (B-Ware, version 1.24) app was downloaded. This app is designed and made available for free by the sensor’s manufacturer (Solution Bee, LLC). The weight data was retrieved from the scales by placing the Android device close to the scale’s reader through NFC technology. In contrast, the temperature and humidity (HM-1) were retrieved through Bluetooth connectivity. The data collected through the Android device was uploaded to a cloud in the field and subsequently downloaded from the cloud in the form of Excel files (.csv) for further statistical analysis.
Haplotype identification
To confirm the Italian origin of the queens and experimental colonies, one worker bee was sampled from each studied colony mid-experiment (Sep 2021) and stored in absolute Ethanol for further molecular analysis. DNA was extracted as described in (Alburaki et al., Citation2022). The honey bee evolutionary lineages and haplotypes were determined based on the genetic structure of the intergenic region detailed in previous studies (Alburaki et al., Citation2011; Cornuet et al., Citation1991; Garnery et al., Citation1992; Citation1993; Smith et al., Citation1991). The DraI mtDNA COI-COII (DmCC) test was conducted in silico on the twenty-one COI-COII obtained sequences following the steps described in (Alburaki et al., Citation2022; Madella et al., Citation2020). Sequences of the twenty-one COI-COII haplotypes identified in this study were submitted to the National Center for Biotechnology Information NCBI.
Data curation
The data retrieved from each hive and scale (temperature, humidity, and weight) was inspected and verified first. Detected misreads, which occurred due to regular hive inspection and device errors in a few cases, were deleted from the dataset prior to analyses. Besides misreads, no outliers of any kind were removed from the dataset. As the target temperature in this study is the hive cavity and not necessarily the nest temperature, the low temperature reads in the winter time, which occurs due to displacement of the winter cluster away from the sensor, were included in the analysis. Nonetheless, and in order to exclude any potential effect of the winter reads on differences found between haplotypes, the later analysis was run with and without winter data.
Statistical analysis
All statistical analysis and figure generation were performed in the R environment (R Core Team, Citation2011) using RStudio Version (2022.12.0 + 353). This study was conducted based on three major treatment groups (Urban, agricultural, and non-agricultural areas) and seven technical replicates (hives) for each treatment group, . Four variables were investigated: 1- Weight, 2- Humidity, 3- Temperature, and 4- mtDNA haplotype. Datasets were assessed for normality with the Shapiro test. Since none of the datasets followed a normal distribution, the Kruskal-Wallis rank test and the Wilcoxon Signed rank test, both non-parametric tests, were used to assess statistical differences between variables. Kruskal-Wallis rank test for multiple comparisons and p-values were adjusted with the Benjamini-Hochberg method. Correlation analysis was conducted using “corrplot” and “ggpubr” Libraries with the Spearman method as the data failed the normality assumption conducted by the Shapiro test. Statistical analyses were conducted at a 95% confidence interval with three levels of significance: p < 0.05*, p < 0.01**, p < 0.001***. Concerning haplotype identification, the DmCC test, sequence alignment, and in silico blast were all conducted using Geneious Prime software (v.2022.0.1) (https://www.geneious.com) according to the pipeline described in previous studies (Alburaki et al., Citation2022; Madella et al., Citation2020). Figures were generated in the same environment R utilizing three main libraries: “ggplot2”, “doby” and “plyr”. All boxplots and error bars of this study represent the median, first and third quartiles, and both maximum and minimum values of variables. Error bars of the bar plots (Varroa count) represent the standard error SE.
Results
Landscape composition and classification
Analysis of the land use conducted on an estimated foraging distance of (∼2.3) km revealed that the urban location (Mansion) comprises approximately 53% urban component, 7% crop and agricultural fields, 10% forests, and 0.4% water in the form of lakes, . Forests of the studied area are predominantly composed of Oak and hickory hardwoods. The agricultural location (Meadow) is composed of 16% urban activity, 20% cropping fields, 35% forests and 0.2 water surfaces, . The non-agricultural area located at the edge of Patuxent Refuge center is composed of 6% urban land, 4% crop fields, 76% forests and 2% water surfaces, . Due to various differences in map layers and land classification between government entities and software (e.g.: some lots mentioned “No data available”), these percentages remain a rough estimation.
Colony weight development
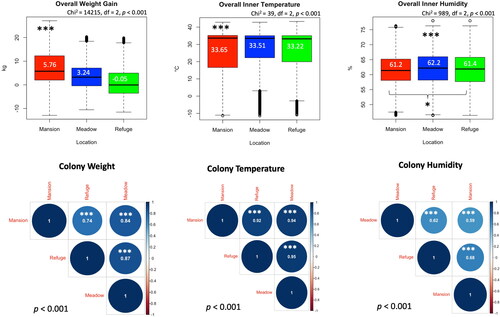
In all three locations, colonies showed significant (p < 0.001) weight variations among each other within each area, . The overall colony weight differential among locations indicates a significantly (p < 0.001) higher weight gain in the colonies located in the urban area (5.76 kg) compared to both the AG area (3.24 kg) and the Non-AG location (-0.05 kg), . The trend of the weight development among sites was assessed via a correlation analysis. The correlation analysis indicates significant positive correlations between weight progress in all three locations with r values ranging from 0.74 to 0. 87, .
Figure 2. Overall inter-colony differences of weight, temperature and humidity are displayed per location. Alphabetic letters are the colonies’ codes. Kruskal-Wallis test shows significant differences (p < 0.001) among colonies for all studied variables. Boxplots represent the median, first and third quartiles, and both maximum and minimum values. No outliers were excluded.
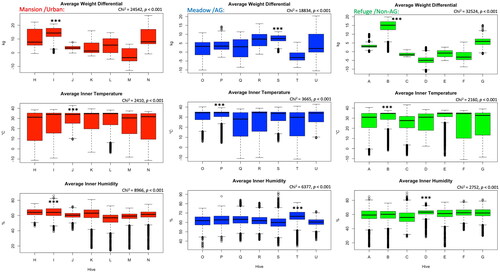
Figure 3. Inter-location comparisons of the overall colony weight gain, inner temperature and humidity. Correlations at a p < 0.001 cutoff were calculated for each studied variable (weight, temperature and humidity) among locations. Boxplot median values are displayed in white font. R value is given within each pairwise correlation circle. Kruskal-Wallis levels of significance are p < 0.05*, p < 0.001***.
Inner hive temperature
Similar to the weight development, colonies of the same location significantly (p < 0.001) varied in their inner hive temperature, . The overall average of the internal hive temperature was significantly (p < 0.001) higher in the hives of the urban area (33.65 °C) compared to hives of both AG (33.51 °C) and Non-AG (33.22 °C) areas, . Inner hive temperature, as a variable, displayed the highest significant (p < 0.001) positive correlations (r = 0.95) among locations, .
Inner hive humidity
Hives located in the urban area, which showed the highest overall inner temperature (33.65 °C), maintained a significantly (p < 0.05) lower overall relative humidity (61.2%) compared to that of the non-AG area (61.4%). The highest overall inner hive humidity was recorded at the AG area’s colonies (62.2%), which significantly (p < 0.001) differed from both other locations, . Inter-colony variances, similar to the temperature and weight, were recorded among colonies of the same location. This phenomenon is recorded regardless of the landscape nature of the locations, . Positive correlations in the regulation of the inner hive humidity were documented among locations, . However, significant (p < 0.001) R-values remain lower (0.59 − 0.62) than what was recorded in the case of temperature and weight, .
Varroa mite load
Mite load varied across months, with the highest counted mites recorded in August. Nonetheless, no significant differences in mite load were recorded among locations at any time. Similarly, the overall mite load showed no statistical difference (Chi2 = 2.6, p < 0.2) in Varroa infestation among sites, . Irrespective of the locations, mite load among hives carrying different haplotypes (C1, C2j) did not statistically differ (Chi2 = 0.01, p < 0.9), .
Figure 4. Varroa mite load in the studied colonies displayed longitudinally (month) and as overall averages per location and mtDNA haplotype. No significant differences were found at any time point.
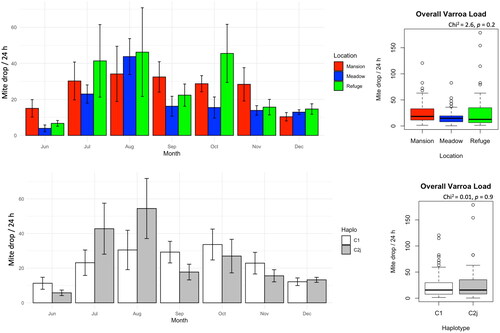
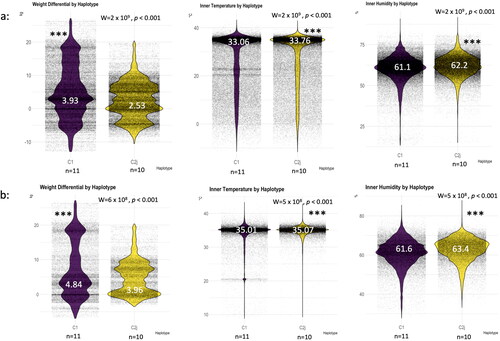
Figure 5. Haplotype thermoregulation and weight gain irrespective of the location. Overall averages of the studied variables (weight, temperature, humidity) throughout the four seasons (a), overall averages excluding the winter season (b). (n) number of haplotype/colony averaged in each category, median is given for each boxplot in white font. Wilcoxon level of significance is p < 0.001***.
mtDNA haplotype, colony performance and thermoregulation
When acquired, the provider verbally confirmed the queen’s genetic background to be of Italian origin (Apis mellifera ligustica, Haplotype C1). Upon the completion of our genetic analysis (Sep 2021), two different haplotypes (C1, C2j) were identified, which belong to two distinct subspecies, Apis mellifera ligustica (Italian bees) and A. m. carnica (Carniolan bees), respectively, . Haplotype sequences are publicly available under the NCBI accession numbers OQ161264 to OQ161284, . This finding, which occurred during the ongoing experiment, prompted us to evaluate potential differences between haplotypes’ thermoregulation and performance across apiaries. The overall data, which includes all four seasons, shows significantly (W = 2 x 10⁹, p < 0.001) higher weight gain (3.93 kg) for colonies carrying C1 haplotype compared to C2j colonies (2.53 kg), . However, in term of thermoregulation, C1 colonies show significantly (W = 2 × 10⁹, p < 0.001) lower inner temperature (33.06 °C) and humidity (61.1%) compared to their C2j counterparts (33.76 °C) and (62.2%) respectively, . Similar results were obtained by excluding data of the winter season as detailed in the Materials and Methods section, which showed higher rate of fluctuations compared to other seasons, .
Discussion
Our study assessed how landscape compositions surrounding honey bee colonies influence their performance, thermoregulation, and Varroa load. Honey bees acquire all their nutrients from available resources at foraging distance from their hive. This foraging distance may vary under different circumstances but is agreed to range between 2 and 3 km under normal conditions (Seeley, Citation2010). The biological traits investigated in this study are considered significant indicators of colony performance and well-being. Although multiple other factors, such as diseases and pathogens, are involved in colony development, the colony biomass, thermoregulation, and Varroa load provide a fair proxy to assess bees’ profitability of their surrounding landscapes and available flora. Our results showed that colonies located in the urban area provided the highest weight gain (5.76 kg) compared to their counterparts located in AG and Non-AG areas, . In Denmark, a study reported significantly higher colony weight gain in an area comprising 50% urban activity compared to locations with > 50% agriculture (Lecocq et al., Citation2015). In fact, colonies located in Non-AG area, which had access to a landscape mainly composed of 76% forest, made almost no gain in weight at all (-0.05 kg), . Similar results were obtained in a previous study in which colonies placed in non-agricultural area (Chickasaw State Park, TN, USA) with 95% forest, made the lowest weight gain compared to intensive, moderate and non-agricultural areas (Alburaki et al., Citation2017). Although it may limit exposure to agrochemical pesticides, such landscape composition cannot sustain honey bee colonies with the required forage sources across the year. Moreover, as evidenced in a previous study conducted in the Midwest USA (Alburaki et al., Citation2018), low agricultural areas with urban activity provided the highest pollen diversity and sustainability. Therefore, it is strongly recommended for beekeepers to situate their colonies in areas that include urban components for better forage diversity and sustainability.
Honey bees use different thermoregulatory behaviors to adjust non-optimal conditions within the hive (Kronenberg & Heller, Citation1982). For instance and during winter, clustering and increases in the metabolic rate are the main remedies to counter cold temperatures (Allen, Citation1959). This behavior requires significant energy obtained via higher honey consumption by bees. A well-established colony with a large bee population would be able to maintain a more stable and optimal in-hive temperature and humidity compared to a weak colony with a smaller bee cluster. Maintaining an optimal inner temperature, particularly in the brood areas, is critical to raising healthy brood and adult bees. Honey bees must maintain optimal or close to optimal nest temperature and humidity (Becher et al., Citation2009; Fahrenholz et al., Citation1989; Sadler & Nieh, Citation2011). In the case of our study, similar to the weight gain, the highest inner hive temperature (33.65 °C) was found in the colonies of the urban area, which might be expected to a certain extent as such colonies would have a larger size of bee populations enabling better inner hive thermoregulation. Notably, our recorded temperatures are not those of the honey bee clusters but rather those of the internal hive cavities. For instance, the temperature of winter bee clusters ranges between (12 − 33.5) °C with an average of 21.3 °C (Fahrenholz et al., Citation1989; Southwick, Citation1985), while active summer bees would maintain brood areas close to 35 °C at all time (Seeley, Citation2010). The relative humidity, which has a strong correlative relationship with temperature, was significantly lower (61.2%) in the colonies of the urban area which produced the highest inner hive temperature, . A recent study highlighted the fact that, similar to the internal colony temperature, honey bees actively regulate the inner hive humidity irrespective of the seasons or their state of reproduction (Eouzan et al., Citation2019). Interestingly, the tight range of humidity found in our study (61.2 − 62.2%) confirms Eouzan et al.’s finding and matches the value of (62.5%) found in Langstroth wooden colonies in a recent study comparing insulation of both polyurethane and wooden colonies during the winter season (Alburaki & Corona, Citation2021). Among the three studied variables, our data indicated that inner hive temperature is a consensual variable for bees to maintain at a narrow range regardless of the landscape composition. This is evidenced by significantly high and positive correlations found for the temperature among locations, . Varroa mite remains a major threat and leading cause of honey bee decline and mortality worldwide (Traynor et al., Citation2020). Our data showed no significant differences in Varroa load across locations, which allows us to exclude its direct involvement in the biomass and thermoregulation variances identified in this study.
Concerning haplotype thermoregulation, our results provide early indications of significant differences in the thermoregulation and performance of both identified C1 and C2j haplotypes. While statistically significant, these differences remain subtle and further investigations are needed to determine if such slight variations could impact the colony performance on the long run.
In conclusion, our data demonstrate that honey bee colonies thrive in landscapes featuring urban components, which facilitate more efficient and optimal inner hive thermoregulation. Notably, hive temperature exhibited the most significant positive correlations, regardless of other variables, underscoring its pivotal role in ensuring colony well-being. This underscores the importance of giving due attention to hive materials and insulation rates. Such considerations can minimize the energy required for maintaining hive temperature and reduce honey consumption. Furthermore, the observed differences in thermoregulation among haplotypes, as identified in this study, offer valuable insights. They may prove useful for assigning subspecies or haplotypes to different climate regions based on their evolutionary context and historical adaptations. This knowledge can contribute to more informed and targeted beekeeping practices, promoting the health and resilience of honey bee populations in diverse environments.
Disclosure statement
No potential conflict of interest was reported by the author(s).
Additional information
Funding
References
- Abou-Shaara, H. F., Owayss, A. A., Ibrahim, Y. Y., & Basuny, N. K. (2017). A review of impacts of temperature and relative humidity on various activities of honey bees. Insectes Sociaux, 64(4), 455–463. https://doi.org/10.1007/s00040-017-0573-8
- Ahn, K., Xie, X., Riddle, J., Pettis, J., & Huang, Z. Y. (2012). Effects of long distance transportation on honey bee physiology. Psyche: A Journal of Entomology, 2012, 1–9. https://doi.org/10.1155/2012/193029
- Alaux, C., Folschweiller, M., McDonnell, C., Beslay, D., Cousin, M., Dussaubat, C., Brunet, J.-L., & Le Conte, Y. (2011). Pathological effects of the microsporidium Nosema ceranae on honey bee queen physiology (Apis mellifera). Journal of Invertebrate Pathology, 106(3), 380–385. https://doi.org/10.1016/j.jip.2010.12.005
- Alburaki, M., Boutin, S., Mercier, P.-L., Loublier, Y., Chagnon, M., & Derome, N. (2015). Neonicotinoid-coated zea mays seeds indirectly affect honeybee performance and pathogen susceptibility in field trials. PloS One, 10(5), e0125790. https://doi.org/10.1371/journal.pone.0125790
- Alburaki, M., & Corona, M. (2021). Polyurethane honey bee hives provide better winter insulation than wooden hives. Journal of Apicultural Research, 61(2), 190–196. https://doi.org/10.1080/00218839.2021.1999578
- Alburaki, M., Gregorc, A., Adamczyk, J., & Stewart, S. D. (2018). Insights on pollen diversity of honey bee (Apis Mellifera L.) colonies located in various agricultural landscapes. The Southwestern Naturalist, 63(1), 49–58. https://doi.org/10.1894/0038-4909.63.49
- Alburaki, M., Madella, S., Lopez, J., Bouga, M., Chen, Y., & vanEngelsdorp, D. (2022). Honey bee populations of the USA display restrictions in their mtDNA haplotype diversity. Frontiers in Genetics, 13, 1092121. https://doi.org/10.3389/fgene.2022.1092121
- Alburaki, M., Moulin, S., Legout, H., Alburaki, A., & Garnery, L. (2011). Mitochondrial structure of eastern honeybee populations from Syria, Lebanon and Iraq. Apidologie, 42(5), 628–641. https://doi.org/10.1007/s13592-011-0062-4
- Alburaki, M., Steckel, S. J., Williams, M. T., Skinner, J. A., Tarpy, D. R., Meikle, W. G., Adamczyk, J., & Stewart, S. D. (2017). Agricultural landscape and pesticide effects on honey bee (Hymenoptera: Apidae) biological traits. Journal of Economic Entomology, 110(3), 835–847. https://doi.org/10.1093/jee/tox111
- Allen, M. D. (1959). Respiration rates of worker honeybees of different ages and at different temperatures. Journal of Experimental Biology, 36(1), 92–101. https://doi.org/10.1242/jeb.36.1.92
- Aufauvre, J., Biron, D. G., Vidau, C., Fontbonne, R., Roudel, M., Diogon, M., Viguès, B., Belzunces, L. P., Delbac, F., & Blot, N. (2012). Parasite-insecticide interactions: A case study of Nosema ceranae and fipronil synergy on honeybee. Scientific Reports, 2(1), 326. https://doi.org/10.1038/srep00326
- Becher, M. A., Scharpenberg, H., & Moritz, R. F. A. (2009). Pupal developmental temperature and behavioral specialization of honeybee workers (Apis mellifera L.). Journal of Comparative Physiology. A, Neuroethology, Sensory, Neural, and Behavioral Physiology, 195(7), 673–679. https://doi.org/10.1007/s00359-009-0442-7
- Berenbaum, M. R., & Liao, L. H. (2019). Honey bees and environmental stress: toxicologic pathology of a superorganism. Toxicologic Pathology, 47(8), 1076–1081. https://doi.org/10.1177/0192623319877154
- Branco, M. R., Kidd, N. A. C., & Pickard, R. S. (2006). A comparative evaluation of sampling methods for Varroa destructor (Acari: Varroidae) population estimation. Apidologie, 37(4), 452–461. https://doi.org/10.1051/apido:2006010
- Calderone, N. W. (2012). Insect pollinated crops, insect pollinators and US agriculture: Trend analysis of aggregate data for the period 1992-2009. PloS One, 7(5), e37235. https://doi.org/10.1371/journal.pone.0037235
- Cook, S. M., Awmack, C. S., Murray, D. A., & Williams, I. H. (2003). Are honey bees’ foraging preferences affected by pollen amino acid composition? Ecological Entomology, 28(5), 622–627. https://doi.org/10.1046/j.1365-2311.2003.00548.x
- Cornuet, J. M., Garnery, L., & Solignac, M. (1991). Putative origin and function of the intergenic region between COI and COII of Apis mellifera L. mitochondrial DNA. Genetics, 128(2), 393–403. https://doi.org/10.1093/genetics/128.2.393
- Dalmon, A., Peruzzi, M., Le Conte, Y., Alaux, C., & Pioz, M. (2019). Temperature-driven changes in viral loads in the honey bee Apis mellifera. Journal of Invertebrate Pathology, 160, 87–94. https://doi.org/10.1016/j.jip.2018.12.005
- Eouzan, I., Garnery, L., Pinto, M. A., Delalande, D., Neves, C. J., Fabre, F., Lesobre, J., Houte, S., Estonba, A., Montes, I., Sime-Ngando, T., & Biron, D. G. (2019). Hygroregulation, a key ability for eusocial insects: Native Western European honeybees as a case study. PloS One, 14(2), e0200048. https://doi.org/10.1371/journal.pone.0200048
- Evans, J. D., & Schwarz, R. S. (2011). Bees brought to their knees: Microbes affecting honey bee health. Trends in Microbiology, 19(12), 614–620. https://doi.org/10.1016/j.tim.2011.09.003
- Fahrenholz, L., Lamprecht, I., & Schricker, B. (1989). Thermal investigations of a honey bee colony: Thermoregulation of the hive during summer and winter and heat production of members of different bee castes. Journal of Comparative Physiology B, 159(5), 551–560. https://doi.org/10.1007/BF00694379
- Garnery, L., Cornuet, J. M., & Solignac, M. (1992). Evolutionary history of the honey bee Apis mellifera inferred from mitochondrial DNA analysis. Molecular Ecology, 1(3), 145–154. https://doi.org/10.1111/j.1365-294x.1992.tb00170.x
- Garnery, L., Solignac, M., Celebrano, G., & Cornuet, J. M. (1993). A simple test using restricted Pcr-amplified mitochondrial-DNA to study the genetic-structure of Apis-Mellifera L. Experientia, 49(11), 1016–1021. https://doi.org/10.1007/BF02125651
- Johnson, R. M., Ellis, M. D., Mullin, C. A., & Frazier, M. (2010). Pesticides and honey bee toxicity - USA. Apidologie, 41(3), 312–331. https://doi.org/10.1051/apido/2010018
- Jones, J. C., Helliwell, P., Beekman, M., Maleszka, R., & Oldroyd, B. P. (2005). The effects of rearing temperature on developmental stability and learning and memory in the honey bee, Apis mellifera. Journal of Comparative Physiology. A, Neuroethology, Sensory, Neural, and Behavioral Physiology, 191(12), 1121–1129. https://doi.org/10.1007/s00359-005-0035-z
- Kronenberg, F., & Heller, C. H. (1982). Colonial thermoregulation in honey bees (Apis mellifera). Journal of Comparative Physiology ? B, 148(1), 65–76. https://doi.org/10.1007/BF00688889
- Lecocq, A., Kryger, P., Vejsnæs, F., & Bruun Jensen, A. (2015). Weight watching and the effect of landscape on honeybee colony productivity: Investigating the value of colony weight monitoring for the beekeeping industry. PloS One, 10(7), e0132473. https://doi.org/10.1371/journal.pone.0132473
- Louveaux, J. (1973). The acclimatization of bees to a heather region. Bee World, 54(3), 105–111. https://doi.org/10.1080/0005772X.1973.11097464
- Madella, S., Grubbs, K., & Alburaki, M. (2020). Non-invasive genotyping of honey bee queens Apis mellifera L.: Transition of the DraI mtDNA COI-COII test to in silico. Insects, 12(1), 19. https://doi.org/10.3390/insects12010019
- Meikle, W. G., Weiss, M., Maes, P. W., Fitz, W., Snyder, L. A., Sheehan, T., Mott, B. M., & Anderson, K. E. (2017). Internal hive temperature as a means of monitoring honey bee colony health in a migratory beekeeping operation before and during winter. Apidologie, 48(5), 666–680. https://doi.org/10.1007/s13592-017-0512-8
- Meikle, W. G., Weiss, M., & Stilwell, A. R. (2016). Monitoring colony phenology using within-day variability in continuous weight and temperature of honey bee hives. Apidologie, 47(1), 1–14. https://doi.org/10.1007/s13592-015-0370-1
- Mitchell, D. (2019). Thermal efficiency extends distance and variety for honeybee foragers: Analysis of the energetics of nectar collection and desiccation by Apis mellifera. Journal of the Royal Society, Interface, 16(150), 20180879. https://doi.org/10.1098/rsif.2018.0879
- Panziera, D., Requier, F., Chantawannakul, P., Pirk, C. W. W., & Blacquière, T. (2022). The diversity decline in wild and managed honey bee populations urges for an integrated conservation approach. Frontiers in Ecology and Evolution, 10. https://doi.org/10.3389/fevo.2022.767950
- R Core Team. (2011). R: A language and environment for statistical computing. R Foundation for Statistical Computing.
- Robinson, G. E., & Page, Jr, R. E. (1989). Genetic determination of nectar foraging, pollen foraging, and nest-site scouting in honey bee colonies. Behavioral Ecology and Sociobiology, 24(5), 317–323. https://doi.org/10.1007/BF00290908
- Ryabov, E. V., Childers, A. K., Chen, Y., Madella, S., Nessa, A., vanEngelsdorp, D., & Evans, J. D. (2017). Recent spread of Varroa destructor virus-1, a honey bee pathogen, in the United States. Scientific Reports, 7(1), 17447. https://doi.org/10.1038/s41598-017-17802-3
- Sadler, N., & Nieh, J. C. (2011). Honey bee forager thoracic temperature inside the nest is tuned to broad-scale differences in recruitment motivation. The Journal of Experimental Biology, 214(Pt 3), 469–475. https://doi.org/10.1242/jeb.049445
- Schultz, M., Voss, J., Auer, M., Carter, S., & Zipf, A. (2017). Open land cover from OpenStreetMap and remote sensing. International Journal of Applied Earth Observation and Geoinformation, 63, 206–213. https://doi.org/10.1016/j.jag.2017.07.014
- Seeley, T. D. (2010). Honeybee democracy. Princeton University Press.
- Simone-Finstrom, M., Li-Byarlay, H., Huang, M. H., Strand, M. K., Rueppell, O., & Tarpy, D. R. (2016). Migratory management and environmental conditions affect lifespan and oxidative stress in honey bees. Scientific Reports, 6(1), 32023. https://doi.org/10.1038/srep32023
- Smith, D. R., Palopoli, M. F., Taylor, B. R., Garnery, L., Cornuet, J. M., Solignac, M., & Brown, W. M. (1991). Geographical overlap of two mitochondrial genomes in Spanish honeybees (Apis mellifera iberica). The Journal of Heredity, 82(2), 96–100. https://doi.org/10.1093/oxfordjournals.jhered.a111062
- Southwick, E. E. (1985). Allometric relations, metabolism and heart conductance in clusters of honey bees at cool temperatures. Journal of Comparative Physiology B, 156(1), 143–149. https://doi.org/10.1007/BF00692937
- Stalidzans, E., & Berzonis, A. (2013). Temperature changes above the upper hive body reveal the annual development periods of honey bee colonies. Computers and Electronics in Agriculture, 90, 1–6. https://doi.org/10.1016/j.compag.2012.10.003
- Steinmann, N., Corona, M., Neumann, P., & Dainat, B. (2015). Overwintering is associated with reduced expression of immune genes and higher susceptibility to virus infection in honey bees. PloS One, 10(6), e0129956. https://doi.org/10.1371/journal.pone.0129956
- Tarpy, D. R., Vanengelsdorp, D., & Pettis, J. S. (2013). Genetic diversity affects colony survivorship in commercial honey bee colonies. Die Naturwissenschaften, 100(8), 723–728. https://doi.org/10.1007/s00114-013-1065-y
- Tosi, S., Nieh, J. C., Sgolastra, F., Cabbri, R., & Medrzycki, P. (2017). Neonicotinoid pesticides and nutritional stress synergistically reduce survival in honey bees. Proceedings of the Royal Society B: Biological Sciences, 284(1869), 20171711. https://doi.org/10.1098/rspb.2017.1711
- Traynor, K. S., Mondet, F., de Miranda, J. R., Techer, M., Kowallik, V., Oddie, M. A. Y., Chantawannakul, P., & McAfee, A. (2020). Varroa destructor: A complex parasite, crippling honey bees worldwide. Trends in Parasitology, 36(7), 592–606. https://doi.org/10.1016/j.pt.2020.04.004
- van der Sluijs, J. P., Simon-Delso, N., Goulson, D., Maxim, L., Bonmatin, J.-M., & Belzunces, L. P. (2013). Neonicotinoids, bee disorders and the sustainability of pollinator services. Current Opinion in Environmental Sustainability, 5(3–4), 293–305. https://doi.org/10.1016/j.cosust.2013.05.007
- Winston, M. L. (1987). The biology of the honey bee. Harvard University Press.
- Zacepins, A., Kviesis, A., Stalidzans, E., Liepniece, M., & Meitalovs, J. (2016). Remote detection of the swarming of honey bee colonies by single-point temperature monitoring. Biosystems Engineering, 148, 76–80. https://doi.org/10.1016/j.biosystemseng.2016.05.012
- Zhu, X., Xu, X., Zhou, S., Wang, Q., Chen, L., Hao, Z., & Zhou, B. (2018). Low temperature exposure (20 °C) during the sealed brood stage induces abnormal venation of honey bee wings. Journal of Apicultural Research: 1-8, 57(3), 458–465. https://doi.org/10.1080/00218839.2017.1412575