
ABSTRACT
This study investigated meaning-making of arrows in a representation of the greenhouse effect among 14-year-old secondary school students. Data was generated during Biology lessons where 74 students discussed how they interpreted a representation from the Swedish Society for Nature Conservation, which is an NGO that produce school material . The students were divided into 33 groups, who made written notes. In addition 12 groups were videotaped and eleven of these groups were interviewed a week later. The analysis focused on meaning-making of the arrows in the representation with the starting point that the arrows were represented in two distinctive ways, colour (yellow/orange) and shape (straight/curved/wavy). The result show that the colour yellow was strongly connected to the Sun whereas orange was connected to heat. The mode waviness made meaning-making more diverse and the coupling to the colour orange triggered interpretations about heat and different emissions and gases. One implication is that arrows are interpreted in the light of everyday experiences. In order to make sense in a more scientific way the arrows need unpacking and contextualisation. The overall connection between meaning-making and representation was captured by one group as: “It is an easy representation, if you understand it”.
Introduction
When science phenomena are communicated, a variety of modalities are used, and consumers of the communication must navigate in a landscape of representational modes (cf. Olander et al. Citation2018; Kress and Van Leeuwen Citation2001; Prain and Tytler Citation2013; Treagust and Tsui Citation2014) and many of these modalities are part of school science, for example in textbooks (Bezemer and Kress Citation2008; Eilam and Gilbert Citation2014; Postigo and López-Manjón Citation2018). In addition, school science makes use of instructional material from other sources, such as YouTube, popular science magazines, TV, and information produced by public authorities, e.g. NGOs, non-governmental organisations. (Ainsworth, Tytler, and Prain Citation2020; Knain et al. Citation2017).
On the whole, the transformation of scientific explanations into school settings and, further, to students' meaning-making, may be a challenging enterprise. The relationship between object, representation, and meaning made by, for example, students could be illustrated by Peirce’s triadic model (). The model shows the relationship between the object in the world, the representation of the object, and the meaning made of the representation/object. It shows that the meaning made of the representation is not unrelated to the meaning made of the object in the real world.
Figure 1. Peirce’s triadic model of meaning-making of signs or representations according to Waldrip and Prain (Citation2013, p. 17).
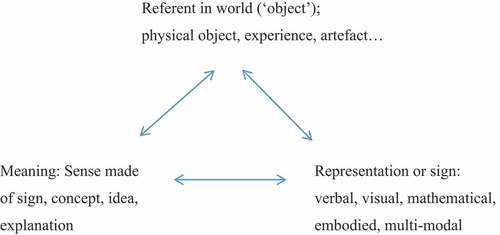
The relationship between the three parts of the model can be interpreted in several ways. The meaning made of the representation depends on the representation of course, but also on the student’s prior experiences of the object in the real world. The more experiences the student has of the real object, the easier it is for the student to make a meaning about the representation. However, this does not mean that the meaning made by the student is in accordance with the scientific purpose of the representation.
Arrows are common in scientific contexts, and they have multiple meanings e.g. as labels, for measurement, as forces, to point at specific objects, to illustrate relationships, to represent changes, and for a sequence in time and/or space (Pintó and Ametller Citation2002; Preston Citation2017; Schollum Citation1983; Wright et al. Citation2018). However, research shows that students often have difficulties in making meaning of representations in general (e.g. Kragten, Admiraal., and Rijlaarsdam Citation2013; Kragten, Admiraal, and Rijlarsdam Citation2015; Mathai and Ramadas Citation2009; McTigue and Flowers Citation2011; Renkl and Scheiter Citation2017; Stylianidou Citation2002) and of the arrows specifically (e.g. Ge and Yang Citation2019; Ge, Unsworth, and Wang Citation2017; Wright et al. Citation2018).
One example of how problematic a representation including arrows can be is shown by Stylianidou (Citation2002), who analysed a representation showing a waterpower station and how it is supplied with water from the sea through the process of water evaporation. Stylianidou found potential problems for students in their meaning-making in the arrows’ form and where they were placed, in the added text and in the combination of text and arrows.
Wright et al. (Citation2018) addressed a number of problems that students face when trying to make meaning of arrows. One problem is that, in textbooks, the form of arrows is not consistent with a specific meaning; one form of an arrow can have different meanings, and different forms of arrows can have the same meaning. A second problem identified by Wright et al. is that students rarely connect a specific form of an arrow to a specific meaning, suggesting that form does not have inherent meaning. The third problem is that an arrow might be ascribed to different meanings due to the characteristics of other arrows in the representation. Wright et al. (Citation2018) identified 21 different variants of arrows. The authors call for “a standard language for arrow usage” which would make meaning-making of arrows easier for students.
Arrows in representations are often illustrated with colours and how we interpret different colours is a complex matter according to Gage (Citation1999). The symbolism of colour has varied throughout history and varies between cultures. Colour affects us in two ways. One is the direct physical effect colour has on us, and the other is the associations we experience through a colour (Kress and Van Leeuwen Citation2002), suggesting that associations related to colour might be highly variable among cultures. However, this does not mean that colour as a symbol and carrier of meaning, is useless. As argued by Kress and Van Leeuwen (Citation2002) within groups, small or large, there might be a high consensus about the meaning of colours, suggesting colour to be an important semiotic resource within groups. For example, there seems to be an agreement around the world about using red as a symbol for hot water and blue as a symbol of cold water.
There are many characteristics of colour that can be used as a mode of communication. A colour can be characterised by value, saturation, purity, modulation, differentiation, and hue. Using these characteristics will presumably increase the number of possibilities of adding meaning to colour as a symbol (Kress and Van Leeuwen Citation2002).
As found in the research above, the arrows in themselves have inherent problems for students. However, other factors related to the students themselves are crucial for making meaning of representations. Kragten, Admiraal, and Rijlaarsdam (Citation2013) studied the performance of students in biology exams and found that cognitive task demands, prior knowledge of components in the diagrams, and the number of components in the diagrams impacted on student performance. Prior knowledge is an important factor to relate to when teaching science, as well as while making meaning of diagrams and arrows in diagrams.
In the present study, we focus specifically on the relationship between meaning made and the representation, i.e. the base of the triadic model. Our concern is about the arrows in a representation about the greenhouse effect. Climate change and the greenhouse effect have been daily topics in Swedish media in recent years. Furthermore, students’ understanding of the greenhouse effect and climate change has been studied in international research. Varela, Sesto, and García-Rodeja (Citation2020) summarise international research from 2010 to 2017 and show that there are misconceptions among students about the greenhouse effect and climate change and that students, despite instruction, have problems in understanding climate change. Meanings students make of arrows within a representation of the greenhouse effect may contribute to an understanding of how to conduct teaching of the greenhouse effect and climate change. Another reason for choosing the greenhouse effect is that representations of the greenhouse effect commonly include arrows, but research on the specific role of arrows in representations of the greenhouse effect is less developed.
Aim
The aim of this study was to investigate what meaning grade 8 students (14 years old) make of arrows in a representation of the specific context that the greenhouse effect constitutes. We addressed the following questions:
In what ways do the students describe the different arrows?
In what ways do the students make meaning of the colours of the arrows?
In what ways do the students make meaning of the shapes of the arrows?
Method
The data collection was conducted in grade 8 (14 years old) in a grade 1 to 9 school in a southern Swedish town. 74 students (35 girls, 39 boys) from three classes participated in the study.
Data were collected in two steps. The first step included data collection from all students. The second step included interviews of a subsample of students to get information on their meaning-making, specifically of the arrows in the representation.
The first step of data collection
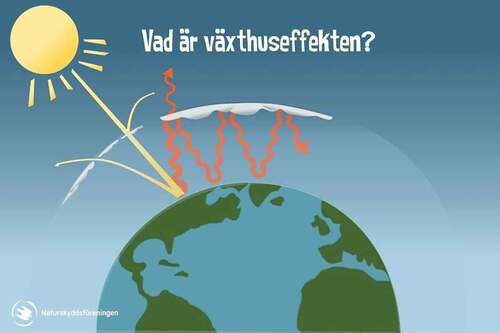
First, the students in the three classes were divided into a total of 33 groups, with two or three students in each group. All groups were given a representation of the greenhouse effect () and were asked to describe and explain how they interpreted the representation and all its details. All groups were audiotaped and handed in written explanations. In addition, 12 of the groups, four in each class, were videotaped during their work.
Figure 2. ‘What is the greenhouse effect?’ (2017, © Swedish Society for Nature Conservation).
The students’ science teacher had informed the students about the research project and that two researchers should meet them during class and collect information about their interpretations of a representation in a first step. They were also informed about our interest in interviewing some of them in a second phase of the data collection. They were informed that the selection of groups to be interviewed should be made later and if they were selected, they could approve or not. Furthermore, the students were informed that the name of the school and their own names would not be used in any contexts or reports of the results. All groups were individually asked if they approved of being audiotaped and/or videotaped. One group did not approve of being videotaped at the first data collection. Therefore, another group was asked and approved of being videotaped. The teacher was present throughout this first part of data collection.
The second step of data collection; the interviews
During the second part of the data collection, one week later, 11 of the groups were individually asked if they would like to be interviewed specifically about the arrows in the representation. During the interviews, the teacher was not present, and it was the first author who performed the interviews. Before each interview, the students were reminded about the ethical considerations we presented at the first data collection, i.e. that they could stop and leave whenever they wanted and that their names and the name of the school would not be used in any contexts. All groups approved of being interviewed.
The purpose of the interviews was to gather more detailed information about the students’ meaning-making of the arrows in the representation.
The choice of the groups for interviews was based on the first data collection; video- and audiotapes and written descriptions of the representation and its arrows. The analysis of these data revealed that student groups varied in the quality and quantity of what they had said and written about the representation. As we were interested in obtaining a range of meanings made by the representation and the arrows, we chose student groups that had well developed, as well as less developed, ways of reasoning about the representation and its arrows.
The interviews were semi-structured, with several questions aiming at achieving information about the meaning students made of each of the arrows and the shapes and colours of the arrows. Although the arrows do differ in several ways we chose to limit our study to the colours orange and yellow and to the shapes straight, curved, and wavy due to their conspicuous characters. These characters were also those mentioned by groups during the first part of the data collection. The interviews followed an interview guide and started with an open question about what meaning the students made about the representation as a whole. This was to ensure that no misunderstanding prevailed that could obscure the continuing interview. Next, were specific questions asked to gather information on what meaning the different arrows made to the students. Questions were asked about what the colour and shape of the arrows meant to the students. The questions asked were as follows: What do the arrows show? The arrows have different shapes and colours; Why do the arrows look different from each other? Why are the arrows yellow/orange/straight/wavy/curved?
In all interviews, additional follow-up questions were asked to get a clearer picture of the meaning the students made of the arrows. The interviews were conducted in the school, in a room for students’ group work, adjacent to the classroom. Each interview was videotaped and lasted for about 10 min (7–14 min).
The representation
The representation () was chosen from a webpage of the Swedish Society for Nature Conservation, a NGO, where it was used in an educational package called ‘What is the greenhouse effect?’ aimed at grade 7–9 students in Swedish schools.
The reason behind the choice of this representation was that it presents arrows of different forms. Furthermore, it is relatively clear of details other than the arrows, and finally, it does not include text that explains the meaning of the arrows.
Method of analysis
The shapes of the arrows were straight, curved, or wavy. The colours of the arrows were either yellow or orange. Accordingly, the analyses of data were based on these modes with their five characteristics (straight, curved, wavy, yellow, and orange).
Analysis in relation to the first research question ‘In what ways do the students describe the different arrows?’ uses all collected data, the 33 groups’ written documents, audiotapes, 12 videotapes from the first data collection, and 11 interviews from the second data collection. We extracted all utterances, including concepts, used by the students to describe the different arrows within the representation. A summary of the results of this analysis is found in .
Table 1. Concepts used by the student groups (n = 33) in their writings, discussions between themselves, and/or in interviews. Many of the groups used more than one concept to describe each arrow. The two first concepts in each column were the most frequently used concepts and the numbers within brackets show how many groups that used those concepts. The rest of the concepts comes in alphabetical order.
The second and third research questions ‘In what ways do the students make meaning of the colours of the arrows?’ and ‘In what ways do the students make meaning of the shapes of the arrows?’ focus on the characteristics of the arrows and use data from the 11 interviews. Explanations and descriptions used by the students to describe and make meaning of the different characteristics colour and shape were selected.
Results
In what ways do the students describe the different arrows?
The amount and kind of concepts used about the five different arrows in the representation by the students, as well as how frequently the most common concepts were used, are summarised in . The yellow straight ‘arrow’ from Sun to Earth was described with seven concepts in total, among which sunray was the most frequently used concept, followed by sunlight. There was high conformity among groups in that the ‘arrow’ was a sunray. The two curved arrows in the representation were also described as sunrays or sunlight. However, in contrast to the straight yellow arrow, many of the groups did not use any concept at all to describe the two yellow curved arrows.
The analysis further shows that the orange wavy arrow under the ‘cloud’ was described with about twice as many concepts as the other arrows. Not only was the number of concepts used about the orange arrow under the ‘cloud’ greater, but they were also of different meanings, including both different kinds of gases as well as heat and heat rays. The most frequently used concepts, in this case, were ‘sunray’ followed by ‘heat’.
The other orange wavy arrow, the one above the ‘cloud’, was described by only five different concepts but also with quite different meanings, as gas, heat, and heat rays. The most frequently used concepts were “heat” followed by ‘gas’ of some kind. Notably, this arrow was the one causing most problems for the students; 19 groups had no concept for this arrow, although a few of them said they did not know and they were given plenty of time to consider an answer.
In what ways do students make meaning of the modes colour and shape
In this section, we show results from the interviews related to the second and third research questions: ‘In what ways do the students make meaning of the colours of the arrows?’ and ‘In what ways do the students make meaning of the shapes of the arrows?’.
Meaning made of colour
Meaning made of yellow colour
The yellow colour made sense and the groups were convinced that the colour was to symbolise the Sun, i.e. something coming from the Sun, sunrays, or sunlight. As one of the groups (6) said: ‘It is difficult to understand that it is sunrays if they are not yellow’.
Meaning made of orange colour
Five of the groups had nothing to say about the orange colour (1, 2, 3, 7, and 11). Although four groups (4, 5, 8, and 9) were convinced that the orange colour meant heat, it was difficult for them to say anything about why they associated orange with heat. Group 5 said: ‘The colour of heat is often red’, adding that when you want to show coldness, you use a white or blue colour. This group was aware that those different colours symbolise different temperatures.
One group (6) said that the orange colour is to show that the orange arrows symbolise something different than the yellow arrows and suggested that the orange arrow was an emission of some kind, although the orange colour is not the obvious choice of colour for emissions. Group 10 suggested that the orange colour is more visible and, in this case, was used to show what factor is the ‘bad guy’ in this context (what ruins the climate).
In the diagram, the orange wavy arrow from Earth and the yellow curved arrow from Earth both start from the same spot, the same spot as the yellow straight arrow from the Sun reach Earth. Group 9 found this problematic in their speculation about the orange colour, meaning that:
If the purpose is to show that it is heat [about the orange arrow under the ‘clouds’], you do understand that it is heat since they are orange. It is difficult to understand that it should be … that it is sunrays if they are not yellow.
Meaning made of shape
Meaning made of curved arrows above the ‘clouds’ and from Earth
The students had great difficulties in making meaning of the curved arrows and three of the groups (4, 10, 11) said that the curved shape was to show that light was reflected in different directions. As group 11 said: ‘ … curved … because maybe it should bounce away to other places’.
The rest of the interviewed groups could not make any meaning of the curved shape and one of the groups (9) expressed some surprise, meaning that ‘Light cannot bend, can it?!’.
Wavy arrows
Waviness made meaning to six of the groups, as heat, gases, and radiation, whereas five of the groups were unable to suggest any meaning at all.
Heat
Waviness was interpreted as heat by two of the groups and as heat, radiation, and/or evaporation by two other groups. One student in group 8 showed with his hand that heat is wavy: ‘When you think about heat … ’ and then he moved his hand back and forth. A similar explanation was given by group 5, meaning that sunlight becomes heat in the atmosphere and then becomes wavy because of the wind: ‘Then, when the sunrays reach the Earth they become heat, and when the heat comes out in the air, then the wind takes it’. The same group continued by saying that the longer the light travels, the longer the wavelength becomes, comparing the short yellow arrows with the long orange wavy arrow under the ‘clouds’: “The heat there, the one that hits the Earth first (points where the sunrays hit the Earth), is so much warmer than the one that is there (pointing at the end of the orange arrow under the ‘cloud’)”. Group 4 suggested that waviness could be heat or maybe radiation (see below) and group 3, being uncertain as well, suggested waviness to show heat or evaporation.
Gas
Three of the groups had another completely different explanation to the waviness of the orange arrows, interpreting that the waviness symbolised gases of some kind. Group 1 explained that it was greenhouse gases because gases move a little back and forth: ‘If it is greenhouse gases or heat, then you don’t think it flies straight up, instead they stop a little in the air … ’, showing with his hand by waving back and forth. Group 10 suggested that the waviness of the arrows meant different amounts of emission at different occasions and from different countries. Different countries release different amounts of, for example, emission. Group 6 suggested that the emission is not stable, which explains the waviness: ‘This (the emissions) is never stable because it depends on how much we release’. One group (3) interpreted that waviness showed ‘it’ evaporating from Earth. The same group suggested that waviness could also show heat.
Radiation
Group 4 could not make any specific meaning of the waviness, although some kind of radiation was in focus, as UV-light, some other kind of radiation than ‘ordinary’ Sun, and heat.
Why different types of arrows?
The interview question about why the arrows were different in shape and colour and additional questions about shape and colour separately, gave us information about what meaning the different characteristics of the arrows conveyed to the students. However, the question about why the arrows were different also generated some other information. When students were first asked about why the arrows were different in colour and shape, the most common answer was that it was to show that the arrows symbolised different “things” (groups 1, 2, 3, and 5) and that the differences helped to clarify the diagram (group 8). In the representation, the orange wavy arrow from Earth and the yellow curved arrow from Earth both start from the same spot as the yellow straight arrow from the Sun lands on Earth. In this case we have a potential shift in meaning of the ‘arrow’ from the Sun after it reflects on the surface of Earth. Group 9 was aware of this saying that ‘the orange wavy arrow under the ‘cloud’ was sunrays that had turned into heat and continued further into the atmosphere.’
Finally, the following citation shows the reasoning of group 6 about why arrows are of different styles/characters:
It might have been more difficult for many, not everybody, but many, to notice it [the differences in the representation] as good if it had been, if … yes … both had been yellow or green … you chose yellow just because the Sun … we think about yellow when we think about the Sun … And then … then you should use another colour for emission. I do not know if it is especially orange you think about when you think about emission. It is another colour that is somewhat more [about the orange arrow under the cloud] … You notice it at least. It sticks out a little there in the picture … (group 6)
Summary of results
The arrow from the Sun to Earth made sense for the students, and they recognised this arrow as sunrays or sunlight. Although many of the groups did not write or say anything about the two curved yellow arrows, a majority recognised these arrows as sunrays or sunlight. The meaning made of the yellow colour was similar among the groups – sunlight or sunrays. Yellow was strongly associated with the Sun. The orange colour was problematic for many groups. The few groups that made some comments about the colour said that orange is associated with heat.
However, the meaning made of the wavy orange arrow within the atmosphere sticks out. The number of concepts used to describe it was twice as many as the concepts used otherwise. Most striking was the variety of the concepts, including gas, rays, and heat, and many groups used more than one concept to describe this arrow. Although the orange wavy arrow leaving the atmosphere is similar to the orange wavy arrow within the atmosphere, 19 groups did not write or say anything about it.
The curved shape of the arrows made little meaning to the groups. Only three groups said something about the curved arrows, arguing that the shape was to show that the sunrays/sunlight was reflected in different directions. Waviness also caused problems for the students, and half of the groups did not say anything about the waviness. The meanings made of waviness by the other groups were heat, different kinds of gases, radiation, and evaporation.
Discussion
Shape and colour are interwoven in the arrows in the representation of the greenhouse effect. We imagine this made it difficult for the students to separate the two characteristics, indicating that when a student said something about, for example, the colour, he/she might have been influenced by the shape, and vice versa. However, for the sake of analysis, we have chosen to separate shape and colour.
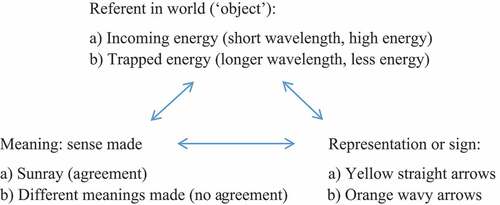
Using Peirce’s triadic model (see in introduction) our findings can be illustrated as in below. The greenhouse effect is at the top of the triangle and here we have the phenomena that the representation points out as mainly constituting the greenhouse effect: a) incoming energy and b) trapped energy. At the right corner of the base of the triangle is the representation with its arrows of different colours and shapes. The left corner of the base of the triangle constitutes what we focus on in this study, the meanings made of the arrows in the representation. From the results of our study, we conclude that there is a high agreement among students about the yellow arrows (a) from the Sun; students make the same meaning. The orange wavy arrows (b) in the representation, on the other hand, trigger high disagreement (heat, sunrays, gases etc.) about what meaning they afford.
Figure 3. Summary of results as application of Peirce’s triadic model (see fig 1, introduction)
We start with colour and its relation to radiation. Radiation (visible light) from the Sun comes in all different wavelengths, from blue-violet light carrying short wave high energy to red light carrying long wave low energy. Accordingly, when talking about warm and cold colours, yellow-red colours could be denoted as cold colours due to their low energy content, whereas blue-violet colours could be denoted as warm colours. Although many experiments conducted in Europe and the United States have shown that interpretation of colours varies greatly, in everyday life, people in these cultures tend to see yellow-red colours as warm and blue-green colours as cold. The warmth from the yellow Sun and yellow-orange fire and glow and the cold appearance of the blue-green sky and sea has probably influenced colour symbolism, at least in western culture (Gage Citation1999). Some of the students are perhaps also aware of the warm and cold colours used in art, design, and clothes. Thus, the orange colour of the arrows affords a symbol easy for the students to associate with warmth, which is correct according to scientific theory; the orange wavy arrow from Earth is longwave radiation. Thus, the orange colour of the arrows affords a reasonable symbol for warmth. The yellow colour of the sunrays in the representation could naturally also be associated with warmth. However, no student group said or wrote anything about sunrays/sunshine being warm On the other hand, if the ‘arrow’ from the Sun had had another colour (e.g. blue), this would likely have confused the students.
Another likely aspect of the symbolism of the colours of the representation is that we experience the radiation from the Sun as warmer than the radiation emitted from Earth. This contradicts the choice of colours for the two different kinds of radiation. Yellow is not as warm as orange. In the colour circle, yellow has its’ place between orange and green, a cold colour, whereas orange has its’ place between red and yellow. However, the affordances of an orange arrow from the Sun (and yellow arrows from Earth) would have been quite problematic compared to ‘common sense’ and probably had made little meaning. The Sun is too strongly associated with yellow to make a change in colour possible.
In their study of what meaning students made of representations of an energy pyramid with and without arrows showing the flow of energy, Ge and Yang (Citation2019) problematise the choice of yellow (sunlight), orange (lost heat, warmth, from the different trophic levels), and red (chemical energy transferred between trophic levels) arrows within the representation. They speculate that if red is seen as the warmest colour among the students, in their everyday life, this might confuse the students when, in the representation, the red arrow is illustrating chemical energy, which has nothing to do with heat. Furthermore, the heat leaving the ecosystem from the trophic levels is illustrated with orange, which is a less warm colour than red (Ge and Yang Citation2019).
Regarding waviness, the affordance of the wavy arrows is that it represents longwave radiation, which is in accordance with the scientific explanation of the phenomenon. Many groups understood that the wavy arrows did symbolise a radiation of some kind. This is close to the finding of Wright et al. (Citation2018), who found that most students associated ‘a thin wavy arrow with the concept of light energy’ (p. 12). Radiation and sometimes the representation of radiation (wavy arrows) is quite common in media and in our daily life; for example, in the context of x-rays, cell phones, and sunbathing. In Ge and Yang’s (Citation2019)study, however, the heat radiation from the trophic levels is symbolised with a straight arrow.
The yellow curved arrows are sun radiation reflected on the surface of the earth and on the atmosphere. However, the fact that the arrows are curved affords no help to the students. Instead, as indicated by one of the groups, the curve might confuse students, which can be detrimental if students already have a correct prior knowledge of the phenomenon.
The importance of prior experiences to be able to make meaning of existing scientific representations is well established (Ge and Yang Citation2019; Ge, Unsworth, and Wang Citation2017; Kragten, Admiraal, and Rijlarsdam Citation2015; Kragten, Admiraal., and Rijlaarsdam Citation2013). Kragten, Admiraal., and Rijlaarsdam (Citation2013) show that the importance of prior knowledge of the subject is crucial to perform well on a task involving a diagram. We have no data on the prior knowledge of individual students in the present study, so we can only speculate about whether prior knowledge could explain some students’ interpretations of the arrows. The students in the present study had undergone teaching in the topic. Still, some of the students were unable to make meaning of the arrows that are in accordance with the scientific meanings. This was the case for the orange wavy arrows, that were interpreted by some groups as gases. Did those groups use their personal experiences to make meaning of the orange wavy arrows in the representation? If this is the case, it shows that prior experience, in all forms, might be used by students to make sense of representations that include unknown content. It is possible to suggest that the meanings made of the waviness of the orange arrow have their roots in, for example, the sight of the trembling air above a warm asphalt road. The same could be said about gas moving back and forth in the wind. The sight of smoke (e.g. from a chimney, cigarette, or burning match) being moved by the wind is quite familiar. As expressed by Waldrip and Prain (Citation2013): ‘This [the learning demands on students] implies that all attempts by learners to understand or explain concepts in science entail representational work in that they have to use their current cognitive and representational resources to make sense of science concepts that are new to them’.
Obviously, students have difficulties in making meaning of the arrows in the representation of the greenhouse effect in this study. Eilam and Gilbert (Citation2014) call for the development of ‘meta representational competence’ and Wright et al. (Citation2018) pointed out that if there is no standard language in the use of arrows, meta representational competence will be difficult to develop. Students and teachers would certainly benefit from a standard arrow language; the time and effort students and teachers would have to engage in making meaning of individual representations could instead be used for more meaningful purposes. Until then, prior experiences will be the most important guidance for a student, as one student in our study concluded: ‘It is an easy representation, if you understand it’.
Acknowledgments
We thank the Swedish Society for Nature Conservation for permission to use the representation, and two anonymous reviewers for their highly valuable comments.
Disclosure statement
No potential conflict of interest was reported by the author(s).
Additional information
Funding
References
- Ainsworth, S., R. Tytler, and V. Prain. 2020. “Learning by Construction of Multiple Representations Van Meter, P., List, A., Lombardi, D., and Kendeou, P.” In Handbook of Learning from Multiple Representations and Perspectives. New York, NY: Routledge 92–106 .
- Bezemer, J., and G. Kress. 2008. “Writing in Multimodal Texts: A Social Semiotic Account of Designs for Learning.” Writing Communications 25 (2): 166–195. doi:10.1177/0741088307313177.
- Eilam, B., and J. K. Gilbert. 2014. “The Significance of Visual Representations in the Teaching of Science.” In Science Teachers Use of Visual Representations, edited by B. Eilam, and J. K. Gilbert, 3–28, Cham: Springer.
- Gage, J. 1999. Color and Meaning. Berkely and Los Angeles: University of California Press.
- Ge, Y.-P., and H. Yang. 2019. “Do We Need Arrows in Representing an Energy Pyramid?” International Journal of Science and Mathematics Education 17 (7): 1301–1316. doi:10.1007/s10763-018-9929-4.
- Ge, Y.-P., L. Unsworth, and K. H. Wang. 2017. “The Effects of Explicit Visual Cues in Reading Biological Diagrams.” International Journal of Science Education 39 (5): 605–626. doi:10.1080/09500693.2017.1297549.
- Knain, E., T. Fredlund, A. Furberg, K. Mathiassen, K. B. Remmen, and M. Ødegaard. 2017. “Representing to Learn in Science Education: Theoretical Framework and Analytical Approaches.” Acta Didactica Norge 11 (3): 11. doi:10.5617/adno.4722.
- Kragten, M., W. Admiraal., and G. Rijlaarsdam. 2013. “Diagrammatic Literacy in Secondary Science Education.” Research in Science Education 43: 1785–1800. doi:10.1007/s11165-012-9331-0.
- Kragten, M., W. Admiraal, and G. Rijlarsdam. 2015. “Students’ Ability to Solve Process-diagram Problems in Secondary Biology Education.” Journal of Biological Education 49 (1): 91–103. doi:10.1080/00219266.2014.888363.
- Kress, G., and T. Van Leeuwen. 2001. Multimodal Discourse: The Modes and Media of Contemporary Communication. London: Arnold Publishers.
- Kress, G., and T. Van Leeuwen. 2002. “Colour as a Semiotic Mode: Notes for a Grammar of Colour.” Visual Communication 1 (3): 343–368. doi:10.1177/147035720200100306.
- Mathai, S., and J. Ramadas. 2009. “Visuals and Visualisation of Human Body Systems.” International Journal of Science Education 31 (3): 439–458. doi:10.1080/09500690802595821.
- McTigue, E. M., and A. C. Flowers. 2011. “Science Visual Literacy: Learners’ Perceptions and Knowledge of Diagrams.” The Reading Teacher 64 (8): 578–589. doi:10.1598/RT.64.8.3.
- Naturskyddsföreningen (n.d.) Vad är växthuseffekten? Retrieved 2018-02-10 from https://www.naturskyddsforeningen.se/klimatforandringar
- Olander, C., P.-O. Wickman, R. Tytler, and Å. Ingerman. 2018. “Representations as Mediation between Purposes as Junior Secondary Science Students Learn about the Human Body.” International Journal of Science Education 40 (2): 204–226. doi:10.1080/09500693.2017.1407464.
- Pintó, R., and J. Ametller. 2002. “Students’ Difficulties in Reading Images. Comparing Results from Four National Student Groups.” International Journal of Science Education 24 (3): 333–341. doi:10.1080/09500690110078932.
- Postigo, Y., and A. López-Manjón. 2018. “Images in Biology: Are Instructional Criteria Used in Textbook Image Design?” International Journal of Science Education 41 (1): 1–20.
- Prain, V., and R. Tytler. 2013. Constructing Representations to Learn in Science, edited by V. Prain, R. Tytler, P. Hubber, and B. Waldrip., 67–82. Rotterdam: Sense Publishers.
- Preston, C. M. 2017. “Effect of a Diagram on Primary Students’ Understanding about Electric Circuits.” Research in Science Education 49 (5): 1433–1456. doi:10.1007/s11165-017-9662-y.
- Renkl, A., and K. Scheiter. 2017. “Studying Visual Displays: How to Instructionally Support Learning.” Educational Psychology Review 29 (3): 599–621. doi:10.1007/s10648-015-9340-4.
- Schollum, B. 1983. “Arrows in Science Diagrams: Help or Hindrance for Pupils?” Research in Science Education 13 (1): 45–59. doi:10.1007/BF02356692.
- Stylianidou, F. 2002. “Analysis of Science Textbook Pictures about Energy and Pupils’ Reading of Them.” International Journal of Science Education 24 (3): 257–283. doi:10.1080/09500690110078905.
- Treagust, D., and C. Tsui. 2014. “General Instructional Methods and Strategies.” In Handbook of Research in Science Education, edited by N. G. Lederman and S. K. Abell, 303–320. New York: Routledge.
- Varela, B., V. Sesto, and I. García-Rodeja. 2020. “An Investigation of Secondary Students’ Mental Models of Climate Change and the Greenhouse Effect.” Research in Science Education 50 (2): 599–624. doi:10.1007/s11165-018-9703-1.
- Waldrip, B., and V. Prain. 2013. “Teachers’ Initial Response to a Representational Focus.” In Constructing Representations to Learn Science, edited by R. Tytler, V. Prain, P. Hubber, and B. Waldrip, 1–14. Rotterdam: Sense publishers.
- Wright, K., J. Cardenas, P. Liang, and D. Newman. 2018. “Arrows in Biology: Lack of Clarity and Consistence Points to Confusion for Learners.” CBE-Life Sciences Education 17 (1): 1–13. doi:10.1187/cbe.17-04-0069.