
ABSTRACT
There is widespread misuse of statistics in research, particularly in the life sciences, which is one of the contributing factors to reproducibility concerns in research. However, the formal quantitative training that life sciences research trainees receive is often quite limited. Our survey of statistics requirements in undergraduate life sciences programmes offered by the top research-intensive universities in Canada, the U15 Group of Canadian Research Universities, confirmed that training in statistics tends to be limited and more general in nature. To help raise awareness and address these limitations, this paper shares findings of this statistics requirements survey and describes the evidence-based framework for a second-year undergraduate course at the University of Toronto, which was introduced to integrate statistics instruction with the life sciences research process. We hope these insights will inform future quantitative course offerings, and ultimately, better prepare students to effectively engage with statistics in life sciences research.
Introduction
Over the last few decades, life sciences research has become progressively more data-intensive. High quality quantitative research, which is reinforced by sound interpretation of data and appropriate application of statistical methods, is fundamental to the advancement of science. Poor quality research, on the other hand, can produce misleading and false scientific conclusions, waste resources, and hinder scientific progress (Freedman, Cockburn, and Simcoe Citation2015). The low reproducibility rate of research in the life sciences is becoming increasingly alarming. A recent meta-analysis concluded that over 50% of all preclinical biomedical research findings are irreproducible, in part due to the improper understanding, use and reporting of statistical methods (Baker Citation2016; Freedman, Cockburn, and Simcoe Citation2015). The misuse of statistics permeates all stages of research, from literature reviews to communication of results. Small sample sizes, unsuitable study designs and sampling strategies, data fishing, errors in interpretation of data and statistical results such as p-values and effect sizes, use of inappropriate statistical procedures, and questionable treatment of outliers all contribute to an increased risk of producing inaccurate and unreliable research findings (Head et al. Citation2015; Thiese, Arnold, and Walker Citation2015). These problems stem from gaps in statistical training, failure of peer reviewers to recognise or identify statistical errors, cognitive biases, and a lack of statistical support (Munafo et al. Citation2017; Peng Citation2015). The fact that misconceptions about statistics are so prevalent, even among experienced researchers, highlights the need for improved training in this important field (Garfield and Ben‐Zvi Citation2007).
In this paper, we focus on the key principles of our approach to undergraduate statistics education for life scientists based on the needs of life science researchers. We evaluate current statistics requirements in undergraduate life sciences programmes offered by top research-intensive universities in Canada (U15 Group of Canadian Research Universities Citation2021) and present design elements from our second-year undergraduate statistics course, which may serve as a model for institutions seeking to bridge the gap between the fields of statistics and life sciences education. This paper also includes insights from a multidisciplinary team-teaching paradigm, based on the authors’ experiences in basic life sciences and statistics education. We hope that these insights will help motivate curriculum reform, inform effective statistical teaching practices for life science disciplines, and help address some of the concerns about research reproducibility.
Limited statistics requirements for undergraduate life science students
The importance of data and statistical literacy has surged in light of the increasing volume and complexity of scientific data available across scientific disciplines. Data from a previous systematic review on physiology studies suggest that a sound understanding of statistical concepts is essential for individuals who are engaging in scientific research (Weissgerber et al. Citation2016). We sought to explore whether undergraduate Canadian life sciences students involved in research and innovation are receiving this necessary quantitative training in their programmes by examining statistical training requirements among departments from the U15 Canadian Research Institutions (see Supplemental Data; 612 programmes across 392 departments). Among these departments, 78.9% of programmes required at least one statistics course for programme completion, while nearly half of the programmes (i.e. 45.2%) required only one statistics course ()). Notably, many of these statistics courses were introductory in nature, with 58.6% of the courses being offered in the second year of undergraduate training (). For the purposes of this analysis, a programme was classified as having a statistics requirement if a required course in the programme contained any mention of the following keywords in the course title or description: quantitative analysis, statistics, statistical, R/python/other statistical software AND data, study design, biostatistics, data analysis. However, statistics could have also been peripherally taught in other programme courses that do not include this vocabulary in the course descriptions. This represents a limitation of this survey as those courses would not have been captured.
Figure 1. Statistics requirement in life science programs of U15 Universities A. A systematic search demonstrated that 21.1% of programs do not require statistics courses (n = 70) and that 45.2% of programs only require one statistics course (n = 150). B. The majority (58.6%) of required or elective statistics courses are at the second-year (i.e. level 2) of undergraduate training (n = 194). Detailed methodology for panels A and B are described in the Supplemental Data.
Research suggests that students often discontinue their statistics training after their initial exposure, and thus are unable to identify analytical mistakes or recognise when statistical methods are outside of their scope of knowledge (Peng Citation2015). Our finding that the majority of programmes offered by U15 institutions require at most one statistics course and around 21.1% require none ()), suggests that students are largely unprepared to use statistics effectively in their research. Statistical course work in some programmes was invariably separated from biology course work and was often generalised across a wide range of fields (e.g. economics, agriculture, medicine, sociology, engineering). In these scenarios, students have more difficulty applying their statistical knowledge in the life sciences setting (Metz and Ebert-May Citation2008), and struggle to see the relevance of statistics to them and their fields of study. As such, these types of courses often fail to address the statistical needs of life scientists given notable variation in study designs, sampling strategies and sample sizes, and varied natures of data across the disciplines these courses serve.
Attempts have been made to create authentic life sciences contexts in statistical training. One study combined statistics and life sciences education by building data analysis exercises and statistical concepts into undergraduate second-year introductory biology lab courses. After administering a survey (n = 186) that assessed understanding of introductory statistics concepts, the authors found a 25% improvement in students’ knowledge of statistics after the course, as well as retention of knowledge one year after the course was taken (Metz and Ebert-May Citation2008). It is important to note that this study merely showed an improvement from minimal baseline knowledge and did not study whether students were able to apply this knowledge to solve more complex problems. This is problematic because students may still be unable to critically examine the literature or apply these concepts to design studies and collect data, then analyse and interpret their data in the research setting.
Alternatively, a Midwestern University in the United States implemented a new Faculty Learning Community (FLC) that offered statistical training to life science faculty, to enable them to implement quantitative concepts in their biology courses (Parker et al. Citation2016). The authors demonstrated that the FLC resulted in increased knowledge and confidence in teaching but did not study the impact that the FLC had on the students. Thus, it is possible that faculty members, despite being more confident in quantitative methods, still did not have the necessary statistics and statistical pedagogical content knowledge (Shulman Citation1986) to teach their students effectively as statistics is its own field that requires extensive specialisation. One possible solution that would help embed appropriate statistics training within life sciences education is for faculty from basic science departments to collaborate with statistics faculty to ensure that courses adequately prepare students to understand the underlying principles in both disciplines (Freeman et al. Citation2008; Goldstein and Flynn Citation2011; Miller, Walston, and Jungck Citation2010).
Eaton, LaMar, and McCarthy (Citation2020) discuss a series of influential reports calling for reforms to biology education to enhance the students’ quantitative skills and assert that ‘the future of reform in quantitative life sciences education lies in the development of interdisciplinary collaborations between mathematics/statistics, education and biology’. Some collaboration is already taking place. For instance, Rylands et al. (Citation2013) conducted semi-structured interviews of faculty at 11 Australian and 2 USA universities about building quantitative skills (QS) in life sciences students whether or not there was collaboration across disciplines to support the development of QS. There were collaborations across life science and mathematical sciences by faculty in all but one of the universities studied, with faculty from 7 universities mentioning more formal structures to build and sustain multidisciplinary curriculum and teaching collaborations. Current collaborations include approaches as simple as informal dialogues between life sciences and statistics faculty (Rylands et al. Citation2013), to broader discussions and activity through networks and communities of practice (Eaton, LaMar, and McCarthy Citation2020), development and adoption of relevant modules and texts (Ayalew et al. Citation2022; Feser, Vasaly, and Herrera Citation2013), and more formal multidisciplinary collaborations (Matthews et al. Citation2010; Miller, Walston, and Jungck Citation2010).
Little has been published about the impact of similar strategies on Canadian undergraduate students. Building on the successes of the approaches employed at universities and colleges elsewhere, the Department of Statistical Sciences and the Human Biology Program at the University of Toronto partnered to introduce a joint introductory second-year undergraduate statistics course for life science students. This course was co-developed and co-taught by an immunologist and a statistician, and course design aligned with the evidence-based best practices in statistics education that are outlined in the American Statistical Association-endorsed Guidelines for Assessment and Instruction in Statistics Education (GAISE) College Report (GAISE College Report ASA Revision Committee Citation2016). In the following section we provide recommendations based on the authors’ experiences with the course development process and team-teaching approach, while describing course learning outcomes, activities, and assessment strategies.
Contextualising statistical training by bridging the gap between life sciences researchers and statisticians
Recommendation 1: Assess the field-specific needs of life science researchers
The life sciences have broadly been characterised as various disciplines such as biology, physiology, pharmacology, ecology and evolution, biochemistry, and immunology. Embedded within these fields of study are heterogeneous types of studies, including clinical studies involving patient data, as well as in vitro or in vivo approaches involving cell cultures and animal models. There may be typical data structures, experimental designs, sample sizes and technical replications in the students’ area(s) of research. Moreover, there may be disciplinary traditions in the way data are presented and analysed. So, these considerations should be taken into account when developing the course.
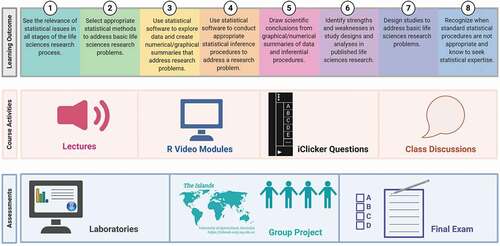
We propose that prior to implementation of undergraduate statistical training, a needs assessment be conducted to inform which statistical concepts and skills are of utmost importance for specific life science research disciplines and what students need to know and be able to do upon successful completion of the course (questions posed on our needs assessment survey are included in the Supplemental Data, which may be useful for individuals considering conducting their own needs assessment to inform reform or design of similar courses). As a result of this needs assessment that we conducted with faculty from participating life sciences programmes when designing this course, it was decided that the primary purpose of this course was to prepare students to conduct quantitative research. Thus, students needed to learn how to engage with statistical principles across all stages of the scientific research, including articulating the research question, designing the study, deciding on sampling strategy and measurements, collecting data and using software to summarise and analyse their data, and interpreting results and communicating their findings. This aligns well with the GAISE recommendation to teach statistical thinking by teaching statistics ‘as an investigative process of problem-solving and decision-making’ (GAISE College Report ASA Revision Committee Citation2016). Further, cultivating an awareness of the prevalence of statistical errors in research, and the ability to think critically about published research and their own decisions as they conduct studies were also important goals of this course. Participating departments also hoped their students would be familiar with a wide range of data summaries and statistical inference procedures upon successful completion of this course. We used this feedback to finalise the course learning outcomes and inform learning activities and assessments ().
Figure 2. Course model for Statistics and Scientific Inquiry in the Life Sciences. Course learning outcomes were designed to mirror the scientific inquiry process, and were mapped to course activities and assessments to enable dissemination, practice and application of statistical principles in a collaborative classroom environment.
Recommendation 2: Design course learning outcomes to reflect the scientific inquiry process
Based on the needs of participating programmes, the course learning outcomes touched on each stage of the life science inquiry process – including identifying the problem, planning the study, collecting data, conducting data analysis, and interpreting the results (). Statistical issues arise at every stage of this process (Wild and Pfannkuch Citation1999). Failure of researchers to use statistics knowledge and skills appropriately at any of these stages can lead to misleading and unreliable findings. Undergraduate students, some of whom will become future researchers, should learn the correct statistical practices at each inquiry stage, and be able to recognise limitations arising from study designs or analyses, such that they can conduct their own research appropriately and critically assess other work. We recommend that instructors design specific learning outcomes that demonstrate sound statistical practices at each stage of inquiry, but also highlight common statistical errors researchers make so that students will be able to avoid such errors and recognise these errors in other work. highlights our course learning outcomes, which reinforce important considerations that need to be made at each of the stages of scientific inquiry. Some of these considerations are discussed below, and several of the common errors made at each stage are summarised in .
Table 1. Common statistical errors in scientific inquiry. Examples of common statistical errors made at each stage of the scientific inquiry process from the literature.
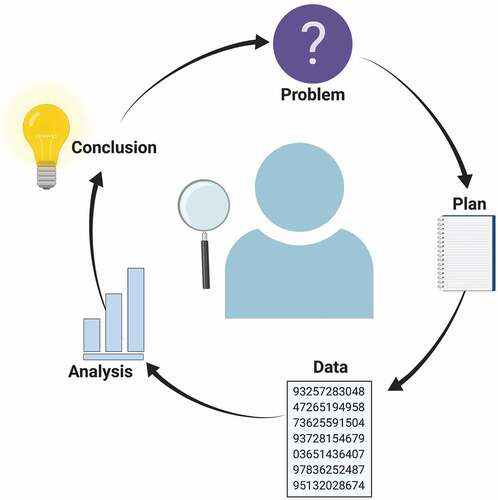
Figure 3. The relevance of statistics at all stages of the scientific inquiry process. Scientific inquiry relies on identification of a scientific problem worth studying, after identification of gaps in the scientific literature. A plan is constructed, with clear identification of a study hypothesis, study design and methodologies. Data collection ensues and is later compiled and analysed using data summaries, and descriptive and inferential statistics. Conclusions can be made, enabling contribution of knowledge to the life sciences field of interest. These data and conclusions can then be used as foundations for establishment of new plans for study.
Identifying the problem
To identify a problem, researchers must read existing literature to explore current findings and potential gaps in knowledge to inform their research question. While doing so, they must be critical of what they read so that they are not guided by false leads and so that they do not replicate inappropriate methods (Abdullah et al. Citation2015). Students should therefore learn to analyse scientific literature critically, so that they can recognise strengths and weaknesses in the experimental designs, data collection methods, statistical analyses, and interpretation of studies (Janick-Buckner Citation1997). To stimulate this critical analysis, instructors could use examples from peer-reviewed life science papers and critically analyse those studies in collaboration with their students to generate an authentic learning context (Rauschert et al. Citation2011).
Planning the study
To gain understanding in proper study design, students should ideally understand the different kinds of sampling methods (both probability-based and non-probability-based) and the appropriate contexts in which they should be used (Williamson Citation2003). Students ought to also recognise the advantages and disadvantages of different study designs (i.e. observational versus experimental studies) and be able to recognise which study designs are appropriate based on the context (Ercan et al. Citation2007). Furthermore, they should also be able to identify and control potential confounds and recognise the importance of using homogenous comparison groups (Allen-Mersh Citation1997).
Collecting the data
During the data collection stage, researchers often make the mistake of not reporting sample drop-outs, converting continuous data types into categorical ones, and using misleading graphical representations (Ercan et al. Citation2007; Lang Citation2004; Murphy Citation2004). Mistakes such as these can lead to a loss of statistical power and misinterpretation of data. Therefore, it is crucial that instructors highlight the correct treatment and documentation of sample dropouts/outliers, the strengths and weaknesses of different types of data summaries and visualisations, and other common mistakes that should be avoided during this stage.
Analysing the data
Although many researchers receive training in conducting data analysis (as this is often the focus of introductory statistical courses), they are often not aware of context-specific applications of certain tests (Weissgerber et al. Citation2016). As a result, many researchers have the tendency of using the same analyses seen in similar studies, although they may not be appropriate for their datasets. Researchers often also fail to assess the assumptions for statistical inference procedures, such as independence and normality of data distribution in t-tests and ANOVA (Lazic Citation2010; Thiese, Arnold, and Walker Citation2015). Therefore, it is important that students obtain a solid grasp on the usage of parametric versus non-parametric tests, the recognition of independence (or dependence) in their data based on study design and sampling methods, and fulfilment of other requirements before they conduct a statistical test or procedure.
Interpretation of data
Lastly, students should be capable of correctly interpreting data. Researchers may provide contradictory interpretations of statistical tests, by saying that a mean of x is higher than the mean of y even when the difference is not significant (Ercan et al. Citation2007). Students should therefore understand the meaning of statistical significance and the correct ways of interpreting it. Specifically, Wasserstein and colleagues (Wasserstein and Lazar Citation2016) describe p-values and what they do and do not tell us as researchers. A couple of the common misinterpretations of p-values that arise in life science research include researchers confusing statistical significance with clinical significance or correlating small p-values with larger effect sizes (Ranganathan, Pramesh, and Buyse Citation2015). Courses should thus aim to address the differences between these phenomena and create course activities and assessments that encourage students to practice their understanding of these concepts.
Recommendation 3: Design course activities that help students enhance their statistical and computational thinking skills
Careful planning is needed to ensure constructive alignment between course learning outcomes, course activities and assessments (Biggs Citation1996). A potential challenge is that students in the life sciences often perceive statistics as a set of tools that can be applied to their chosen field of interest, rather than a distinct scientific discipline. This may lead to the perception that statistics courses are less valuable than core courses in their field, although statistics is critical to research in their chosen field. Learning statistics is also challenging, as it is subject to misconceptions, and it requires a potentially different approach to teaching and learning (Garfield and Ben‐Zvi Citation2007). Thus, course activities should be informed by evidence-based best practices in statistics education (GAISE College Report ASA Revision Committee Citation2016) to scaffold students through the complex statistical ideas, and provide opportunities for them to grapple with statistical concepts, practice regularly and communicate about their acquired statistical knowledge and skills (). We highlight a few of the course activities that were designed with GAISE (GAISE College Report ASA Revision Committee Citation2016) in mind to help students achieve the learning outcomes and enhance their statistical and computational thinking skills.
Our lectures are very interactive. Statistical concepts are explained, motivated by research studies and data, and students engage in problem-solving and small group and class discussions in lectures. Use of primary scientific literature that focuses on practical application of statistical techniques typically serves as a valuable segue for encouraging students to engage in statistics training, so we build class activities around published research and figures. Students gain experience thinking critically about study designs and the appropriateness of data summaries and statistical procedures through participation in these class activities. Students also participate during lectures by using personal response systems (e.g. Macmillan Learning iClicker; https://www.iclicker.com). McGowan and Gunderson (Citation2010) conducted a study on the effectiveness on clicker use in statistics courses and found some evidence that it may improve learning when carefully integrated into the course. We ask 3–5 clicker questions each lecture to target misconceptions, stimulate discussion, provide students with formative feedback, and confirm student understanding to inform just-in-time teaching to enhance student learning. Students who take our course are expected to be able to use statistical software to address research questions upon completion of the course. They will be conducting quantitative research in later lab courses, and some students will take on roles on research teams during their undergraduate studies and beyond. This means it is critical that they gain hands-on experience using statistical software to work with data in the course. There are a number of different software options available for statistical analyses, each with its advantages and disadvantages (Finch, Gordon, and Patrick Citation2021). We decided to proceed with R (R Core Team, Citation2020), an open source language for statistical computing, since it is widely used in life sciences research and among life sciences educators (Del Toro et al. Citation2022; Finch, Gordon, and Patrick Citation2021; Guzman et al. Citation2019), and is freely available to students outside the course. RStudio (RStudio Team, Citation2020), also free, open-source software, provides a flexible, user-friendly interface to work in R. Scientists with R expertise have access to an extensive library of packages and resources designed for various analyses and data presentation styles, and these resources are continually evolving to meet field-specific needs of R users. While developing programming ability is important in the training of statisticians, students who are inexperienced with coding, including basic scientists, often are intimidated by the complexity of statistical programming languages such as R. Students find each of statistics and programming on their own challenging, so the use of software must be very carefully integrated into the course (Guzman et al. Citation2019). To support student learning of the R programming language in our course, students were assigned weekly interactive R video modules that aligned with statistical concepts taught in lecture (White and Waugh Citation2018). These enabled students to learn R at their own pace, while prompting them with integrated checkpoint questions to ensure the retention of new coding skills. These modules introduced the R syntax needed to produce specific summaries, and conduct analyses, motivated by life sciences research. Students also had the opportunity to gain hands-on experience with the software in their statistics laboratories (highlighted in detail in the next section), and R code for all the output discussed in lecture was shared with students, and they were encouraged to reproduce output from lecture, and to experiment with some of the settings, outside class.
We used a cloud-based solution in our course (e.g. RStudio Cloud, https://rstudio.cloud/) to avoid the challenges associated with the installation and configuration of R and RStudio on students’ personal machines (Çetinkaya-Rundel and Rundel Citation2018). Furthermore, students were required to use Rmarkdown, an authoring platform in RStudio where users can save and execute R code within their written documents (https://rmarkdown.rstudio.com/). The use of software such as R and Rmarkdown not only streamlines the student workflow for course assignments but can also help address some of the reproducibility concerns that currently exist within life sciences research (Baumer et al. Citation2014). Therefore, the ability to code can enhance reproducibility and saves time. However, this is only true if researchers are taught how to effectively write and annotate code, such that other investigators can review their work, and reuse their code to reproduce their analyses (Çetinkaya-Rundel and Rundel Citation2018). This training can happen within an introductory statistics course, even if students have little to no previous experience with coding or the software. Baumer et al. (Citation2014) share their experiences integrating use of R and RStudio in introductory statistics courses offered at two very different American postsecondary institutions and the results of a small survey study of students who took the course at one of these institutions (n = 56 respondents). Although students expressed initial frustration with the use of Rmarkdown, this decreased during the term as they gained more experience with the software and the majority (71%) of respondents preferred the Rmarkdown workflow over copy-and-pasting results and figures into a word processing document. Integrating statistical software such as R and user-friendly interfaces such as RStudio (RStudio Team Citation2020) into our courses is not only feasible with appropriate student support, but doing so will prepare our students for their future quantitative activities, equipping them with the tools and workflow to conduct them in a way that promotes reproducibility. Therefore, these types of software likely to become a cornerstone for statistics education and practice in the life sciences.
Recommendation 4: Integrate authentic assessments into the course that customise statistics instruction
Aligning statistics with real-life problems through laboratory exercises
Integrating hands-on data analysis opportunities into general statistics courses allow instructors to align course content with the needs of students in different fields of study. In our course, laboratory exercises were developed based on published life sciences research papers and their associated datasets (). These papers included in vitro, in vivo and clinical studies, across a variety of fields (i.e. immunology, physiology, biology, pharmacology, biochemistry). Students were tasked with producing appropriate numerical and graphical data summaries and conducting appropriate inference procedures with justification and interpretation of results. Furthermore, students attempted to reproduce some of the published figures, test statistics and p-values in papers and evaluated the appropriateness of the statistical methods used.
Including authentic research data in our courses aligns with the GAISE recommendation to integrate ‘real data with a context and purpose’ (GAISE College Report ASA Revision Committee Citation2016). Brearley and colleagues (Brearley et al. Citation2018) emphasise the importance of integrating ‘real and relevant’ data in teaching statistics in health science as well, ideally from a published research articles, and they discuss the challenges associated with obtaining and using real data to teach statistics in health sciences. They also suggest potential data sources, including the Teaching of Statistics in the Health Sciences (TSHS) Resources Portal available at https://www.causeweb.org/tshs/. The TSHS Resources Portal includes both data and associated teaching resources for teaching statistics in health sciences. Importantly, many scientific journals have also started to move towards ‘open access’ approaches, enabling the use of acquired field-specific datasets as educational materials. Such journals include the New England Journal of Medicine (NEJM), The Public Library of Science (PLoS), BMC Medicine/Biology, and Cell Reports – which can provide a range of accessible basic science, clinical, and epidemiological research. Another option is for individual departments to facilitate the tailoring of statistics training for their students by defining core competencies and contributing field-specific datasets and exercises for educational purposes. These materials could be integrated into existing courses to increase the interest in statistics among undergraduate life scientists and help convince them of the relevance and value of statistics and training in statistics to their field.
Group research project
After formally learning statistics through courses, students should be prepared to disseminate knowledge to others in their field of research (Weissgerber et al. Citation2016). Hands-on activities and demonstrations allow students to construct their own understanding of statistics concepts by actively engaging the course material. We integrated a group research project into our course that enabled students to use statistics to address a life sciences research question that was both of interest to them as well as informed by life sciences research.
Using the The Islands platform (Bulmer and Haladyn Citation2011), students worked in groups to design and implement a research study that relied on identifying a life sciences/biology-related research question based on a review of the literature. Groups proposed, and then later implemented, a plan to explore that research question by sampling from the virtual population on The Islands and conducting their study from start to finish. Emphasis was placed on encouraging students to think critically about their sampling approaches, study design, tools used for measurements, data collection, data presentation and statistical analyses, and the communication of results.
Recommendation 5: Model scientific collaboration through multidisciplinary team teaching
Implementation of our course in its current form, including the bridging of two distinct fields – statistics and life sciences education – was largely achieved through a team teaching approach. Team teaching is a collaborative teaching approach in which two or more educators jointly develop, plan and deliver course materials and assessments (Anderson and Speck Citation1998; Crawford and Jenkins Citation2018; Letterman and Dugan Citation2004). In our course, team teaching between an immunologist and a statistician promoted a connection between both instructors as well as their respective disciplines, enabling us to provide a variety of rich learning experiences and opportunities for students as described above. An important outcome of team teaching in our context was the ability of the instructors to rely on one another as specialists in their respective disciplines as partners in the teaching of this multidisciplinary course – this not only provided an increased sense of security from shared responsibility, but also enhanced the professional development of both instructors, offering opportunities for collaborative reflection, insights, and growth.
The literature also suggests that students can benefit from participation in team taught courses (Benjamin Citation2000; Dehnad et al. Citation2021; Letterman and Dugan Citation2004). Specifically, team teaching builds greater curricular coherence when bridging distinct disciplines and creates a stronger sense of academic community. In our course, this multidisciplinary team teaching model also allowed for effective modelling of scientific discourse and collaboration, where students were able to gain new insights from multiple perspectives and to think critically about these perspectives. Focusing on student perspectives of this team-teaching approach, Dehnad et al. (Citation2021) conducted a literature review on this team-teaching model with basic scientists and clinicians teaming up to teach in medical sciences. Across all the studies reviewed, students had favourable views on this teaching model, reporting that it helped them ‘perceive the relationship between basic and clinical sciences, they were more engaged in the learning process, the simultaneous presence of the two teacher[s] provided them with a good model of inter-professional relationship and communication skills they would need in real life situations’ (Dehnad et al. Citation2021). However, this team teaching model is not without potential pitfalls. Given the active hands-on involvement of both instructors in this model, this is very time consuming, and any misalignment between instructors’ motivations, teaching values, or competencies may lead to contradictions and be confusing, and even unsettling, to students (Dehnad et al. Citation2021). These potential pitfalls stress the importance of coordination and coherence of the team.
According to Meeuwissen et al. (Citation2021), a key requirement for the effectiveness of multidisciplinary teaching teams is the instructors’ abilities to learn from one another. It’s also critical there is shared responsibility and that the instructors be ‘motivated to working in integrated education and share similar values, despite their distinct professional background’ (Meeuwissen et al. Citation2021). Organizational buy-in and support for these types of multidisciplinary educational endeavours is critical to the success of the team-teaching model as well (Dehnad et al. Citation2021; Meeuwissen et al. Citation2021; Rylands et al. Citation2013).
Conclusion
The field of statistics is its own scientific discipline that is critical to quantitative research in the life sciences, yet a survey of statistical requirements among select Canadian universities demonstrate that students in most undergraduate life sciences programmes receive limited formal training in this field. The quality of statistics education in the life sciences could be improved by collaborations between life sciences and statistics faculty to ensure that courses prepare students to read, critically evaluate and publish papers with consideration of sample size, study design, sampling, data presentation and statistical analysis and interpretation in their respective fields. Our recommendations for improving statistics training for undergraduate researchers include the following strategies: 1. Assess the field-specific needs of life science researchers; 2. Design course learning outcomes to reflect the scientific inquiry process; 3. Design course activities that help students enhance their statistical and computational thinking skills; 4. Integrate authentic assessments into the course that customise statistics instruction; and 5. Model scientific collaboration through multidisciplinary team teaching. We hope that our course framework enables other institutions to offer similar courses that prepare students to effectively engage with statistics in life sciences research.
Author contributions
L.T. evaluated statistics requirements in life sciences programmes of U15 Canadian universities and wrote the manuscript. B.J.G.W. and J.S. provided critical advice and wrote/edited the manuscript.
Supplemental Material
Download PDF (106.4 KB)Disclosure statement
No potential conflict of interest was reported by the author(s).
Supplementary material
Supplemental data for this article can be accessed online at https://doi.org/10.1080/00219266.2022.2118810
Additional information
Funding
References
- Abdullah, C., J. Parris, R. Lie, A. Guzdar, E. Tour, and N. Pelaez. 2015. “Critical Analysis of Primary Literature in a Master’s-Level Class: Effects on Self-Efficacy and Science-Process Skills.” CBE Life Sciences Education 14 (3): ar34. doi:10.1187/cbe.14-10-0180.
- Allen-Mersh, T. 1997. Cancer: Principles and Practice of Oncology. V. T. Devita Jr, S. Hellman, and S. A. Rosenberg eds, 286× 220 mm Illustrated 1996. Philadelphia, Pennsylvania: Lippincott-Raven.£ 160. In: Oxford University Press.
- Anderson, R. S., and B. W. Speck. 1998. ““Oh What a Difference a Team Makes”: Why Team Teaching Makes a Difference.” Teaching and Teacher Education 14 (7): 671–686. doi:10.1016/S0742-051X(98)00021-3.
- Ayalew, M., D. Hylton, J. Sistrunk, J. Melton, K. Johnson, and E. Voit. 2022. “Integration of Biology, Mathematics and Computing in the Classroom through the Creation and Repeated Use of Transdisciplinary Modules.” Primus 32 (3): 367–385. doi:10.1080/10511970.2020.1861140.
- Baker, M. 2016. “1,500 Scientists Lift the Lid on Reproducibility.” Nature 533 (7604): 452–454. doi:10.1038/533452a.
- Baumer, B., M. Cetinkaya-Rundel, A. Bray, L. Loi, and N. J. Horton. 2014. “R Markdown: Integrating a Reproducible Analysis Tool into Introductory Statistics.” Technology Innovations in Statistics Education 8(1): 10.5070/T581020118.
- Benjamin, J. 2000. “The Scholarship of Teaching in Teams: What Does It Look like in Practice?” Higher Education Research & Development 19 (2): 191–204. doi:10.1080/072943600445646.
- Biggs, J. 1996. “Enhancing Teaching through Constructive Alignment.” Higher Education 32 (3): 347–364. doi:10.1007/BF00138871.
- Brearley, A. M., C. Bigelow, L. M. Poisson, S. C. Grambow, and A. S. Nowacki. 2018. “The TSHS Resources Portal: A Source of Real and Relevant Data for Teaching Statistics in the Health Sciences.” Technology Innovations in Statistics Education 11 (1). doi:10.5070/T5111034506.
- Bulmer, M., and J. K. Haladyn. 2011. “Life on an Island: A Simulated Population to Support Student Projects in Statistics.” Technology Innovations in Statistics Education 5 (1). doi:10.5070/T551000187.
- Çetinkaya-Rundel, M., and C. Rundel. 2018. “Infrastructure and Tools for Teaching Computing Throughout the Statistical Curriculum.” The American Statistician 72 (1): 58–65. doi:10.1080/00031305.2017.1397549.
- Crawford, R., and L. E. Jenkins. 2018. “Making Pedagogy Tangible: Developing Skills and Knowledge Using a Team Teaching and Blended Learning Approach.” Australian Journal of Teacher Education (Online) 43 (1): 127–142. doi:10.14221/ajte.2018v43n1.8.
- Dehnad, A., M. Jalali, S. Shahabi, P. Mojgani, and S. Bigdeli. 2021. “Students’ View on Supportive co-teaching in Medical Sciences: A Systematic Review.” BMC Medical Education 21 (1): 1–13. doi:10.1186/s12909-021-02958-4.
- Del Toro, I., K. Dickson, A. S. Hakes, and S. L. Newman. 2022. “Early Undergraduate Biostatistics & Data Science Introduction Using R, R Studio & the Tidyverse.” The American Biology Teacher 84 (3): 124–129. doi:10.1525/abt.2022.84.3.124.
- Eaton, C. D., M. D. LaMar, and M. McCarthy. 2020. “21st Century Reform Efforts in Undergraduate Quantitative Biology Education.” Letters in Biomathematics 7 (1): 55–66-55–66.
- Ercan, I. Y., B. Yang, Y. Ozkaya, G. Cangur, S. Ediz, and B. Kan. 2007. “Misusage of Statistics in Medical Research.” European Journal of General Medicine 4 (3): 128–134.
- Feser, J., H. Vasaly, and J. Herrera. 2013. “On the Edge of Mathematics and Biology Integration: Improving Quantitative Skills in Undergraduate Biology Education.” CBE—Life Sciences Education 12 (2): 124–128. doi:10.1187/cbe.13-03-0057.
- Finch, S., I. Gordon, and C. Patrick. 2021. “Taking the aRghhhh Out of Teaching Statistics with R: Using R Markdown.” Teaching Statistics 43 (S1): S143–S147. doi:10.1111/test.12251.
- Freedman, L. P., I. M. Cockburn, and T. S. Simcoe. 2015. “The Economics of Reproducibility in Preclinical Research.” PLoS Biology 13 (6): e1002165. doi:10.1371/journal.pbio.1002165.
- Freeman, J. V., S. Collier, D. Staniforth, and K. J. Smith. 2008. “Innovations in Curriculum Design: A multi-disciplinary Approach to Teaching Statistics to Undergraduate Medical Students.” BMC Medical Education 8: 28. doi:10.1186/1472-6920-8-28.
- GAISE College Report ASA Revision Committee. 2016. “GAISE College Report ASA Revision Committee,‘Guidelines for Assessment and Instruction in Statistics Education College Report 2016.” (American Statistical Association)http://www.amstat.org/education/gaise .
- Garfield, J., and D. Ben‐Zvi. 2007. “How Students Learn Statistics Revisited: A Current Review of Research on Teaching and Learning Statistics.” International Statistical Review 75 (3): 372–396. doi:10.1111/j.1751-5823.2007.00029.x.
- Goldstein, J., and D. F. B. Flynn. 2011. “Integrating Active Learning & Quantitative Skills into Undergraduate Introductory Biology Curricula.” The American Biology Teacher 73: 454–461. doi:10.1525/abt.2011.73.8.6.
- Guzman, L. M., M. W. Pennell, E. Nikelski, D. S. Srivastava, and S. L. Eddy. 2019. “Successful Integration of Data Science in Undergraduate Biostatistics Courses Using Cognitive Load Theory.” CBE—Life Sciences Education 18 (4): ar49. doi:10.1187/cbe.19-02-0041.
- Head, M. L., L. Holman, R. Lanfear, A. T. Kahn, and M. D. Jennions. 2015. “The Extent and Consequences of p-hacking in Science.” PLoS Biology 13 (3): e1002106. doi:10.1371/journal.pbio.1002106.
- Janick-Buckner, D. 1997. “Getting Undergraduates to Critically Read and Discuss Primary Literature.” Journal of College Science Teaching 27 (1): 29–32.
- Lang, T. 2004. Twenty Statistical Errors Even You Can Find in Biomedical Research Articles. Citeseer.
- Lazic, S. E. 2010. “The Problem of Pseudoreplication in Neuroscientific Studies: Is It Affecting Your Analysis?” BMC Neuroscience 11: 5. doi:10.1186/1471-2202-11-5.
- Letterman, M. R., and K. B. Dugan. 2004. “Team Teaching a cross-disciplinary Honors Course: Preparation and Development.” College Teaching 52 (2): 76–79.
- Matthews, K. E., P. Adams, M. Goos, and J. Jungck. 2010. “Using the Principles of BIO2010 to Develop an Introductory, Interdisciplinary Course for Biology Students.” CBE—Life Sciences Education 9 (3): 290–297. doi:10.1187/cbe.10-03-0034.
- McGowan, H. M., and B. K. Gunderson. 2010. “A Randomized Experiment Exploring How Certain Features of Clicker Use Effect Undergraduate Students’ Engagement and Learning in Statistics.” Technology Innovations in Statistics Education 4 (1). doi:10.5070/T541000042.
- Meeuwissen, S. N., W. H. Gijselaers, I. H. Wolfhagen, and M. G. A. Oude Egbrink. 2021. “Working beyond Disciplines in Teacher Teams: Teachers’ Revelations on Enablers and Inhibitors.” Perspectives on Medical Education 10 (1): 33–40. doi:10.1007/s40037-020-00644-7.
- Metz, A. M., and D. Ebert-May. 2008. “Teaching Statistics in Biology: Using inquiry-based Learning to Strengthen Understanding of Statistical Analysis in Biology Laboratory Courses.” CBE Life Sciences Education 7 (3): 317–326. doi:10.1187/cbe.07-07-0046.
- Miller, J. E., T. Walston, and J. Jungck. 2010. “Interdisciplinary Training in Mathematical Biology through team-based Undergraduate Research and Courses.” CBE Life Sciences Education 9 (3): 284–289. doi:10.1187/cbe.10-03-0046.
- Munafo, M. R., B. A. Nosek, D. V. M. Bishop, K. S. Button, C. D. Chambers, N. P. du Sert, U. Simonsohn, E.-J. Wagenmakers, J. J. Ware, and J. P. A. Ioannidis. 2017. “A Manifesto for Reproducible Science.” Nature Human Behaviour 1 (1): 0021. doi:10.1187/cbe.19-02-0041.
- Murphy, J. R. 2004. “Statistical Errors in Immunologic Research.” The Journal of Allergy and Clinical Immunology 114 (6): 1259–1263. quiz 1264 10.1016/j.jaci.2004.09.023.
- Parker, L. C., A. M. Gleichsner, O. A. Adedokun, and J. Forney. 2016. “Targeting Change: Assessing a Faculty Learning Community Focused on Increasing Statistics Content in Life Science Curricula.” Biochemistry and Molecular Biology Education 44 (6): 517–525. doi:10.1002/bmb.20974.
- Peng, R. 2015. “The Reproducibility Crisis in Science: A Statistical Counterattack.” Significance 12: 30–32. doi:10.1111/j.1740-9713.2015.00827.x.
- Ranganathan, P., C. S. Pramesh, and M. Buyse. 2015. “Common Pitfalls in Statistical Analysis: “No Evidence of Effect” versus “Evidence of No Effect”.” Perspectives in Clinical Research 6 (1): 62–63. doi:10.4103/2229-3485.148821.
- Rauschert, E. S. J., J. Dauer, J. L. Momsen, and A. Sutton-Grier. 2011. “Primary Literature across the Undergraduate Curriculum: Teaching Science Process Skills and Content.” Bulletin of the Ecological Society of America 92: 396–405. doi:10.1890/0012-9623-92.4.396.
- R Core Team. 2020. R: A Language and Environment for Statistical Computing. Vienna, Austria: R Foundation for Statistical Computing. .
- RStudio Team. (2020). RStudio: Integrated Development for R. RStudio, PBC, Boston, MA. http://www.rstudio.com/.
- Rylands, L., V. Simbag, K. E. Matthews, C. Coady, and S. Belward. 2013. “Scientists and Mathematicians Collaborating to Build Quantitative Skills in Undergraduate Science.” International Journal of Mathematical Education in Science and Technology 44 (6): 834–845. doi:10.1080/0020739X.2013.783239.
- Shulman, L. S. 1986. “Those Who Understand: Knowledge Growth in Teaching.” Educational Researcher 15 (2): 4–14. doi:10.3102/0013189X015002004.
- Thiese, M. S., Z. C. Arnold, and S. D. Walker. 2015. “The Misuse and Abuse of Statistics in Biomedical Research.” Biochemia medica 25 (1): 5–11. doi:10.11613/BM.2015.001.
- U15 Group of Canadian Research Universities. (2021). https://u15.ca/our-members.
- Wasserstein, R. L., and N. A. Lazar. 2016. “The ASA statement on p-values: context, process, and purpose .” The American Statistician 70 (2): 129–133 doi:10.1080/00031305.2016.1154108.
- Weissgerber, T. L., V. D. Garovic, J. S. Milin-Lazovic, S. J. Winham, Z. Obradovic, J. P. Trzeciakowski, and N. M. Milic. 2016. “Reinventing Biostatistics Education for Basic Scientists.” PLoS Biology 14 (4): e1002430. doi:10.1371/journal.pbio.1002430.
- White, B. J., and J. Waugh (2018). Scientific Data Analysis with R. https://rscidata.utoronto.ca/.
- Wild, C. J., and M. Pfannkuch. 1999. “Statistical Thinking in Empirical Enquiry.” International Statistical Review 67 (3): 223–248. doi:10.1111/j.1751-5823.1999.tb00442.x.
- Williamson, G. R. 2003. “Misrepresenting Random Sampling? A Systematic Review of Research Papers in the Journal of Advanced Nursing.” Journal of Advanced Nursing 44 (3): 278–288. doi:10.1046/j.1365-2648.2003.02803.x.