
 ?Mathematical formulae have been encoded as MathML and are displayed in this HTML version using MathJax in order to improve their display. Uncheck the box to turn MathJax off. This feature requires Javascript. Click on a formula to zoom.
Abstract
The solvation process of crystals is a complex parameter, especially for pharmaceuticals where the reproducible production of a consistent product is paramount. The solvation of a novel carbapenem CS-023 crystals with an ethanol/water system was challenging to determine. The solvation data were widely dispersed when the ethanol/water-solvated crystals were washed with the crystallization solvent, requiring a suitable washing and drying method to be devised. To this end, the industry-standard washing and drying method were scrutinized, and a plausible drying mechanism was established. Firstly, an azeotropic solvent such as 96 wt% ethanol (although in this experiment, 96 v/v% ethanol was employed) was used as the washing solvent. Then, a new polymorph of CS-023, Form C (CS-023·EtOH·3H2O), was successfully identified. Form C was observed to produce steadily under a 40–70 v/v% ethanol solution. The relationship between Form C and Form A (CS-023·5/2EtOH·1/2H2O), which was previously obtained under 80 v/v% ethanol, was investigated next. Form A underwent solvent-mediated transformation to Form C under 40–70 v/v% ethanol.
1. Introduction
Crystal polymorphism of the active pharmaceutical ingredient (API) is one of the most critical problems in the development of drugs. Different polymorphs are different in solubility, dissolution rate, and storage stability, which results in a difference in the bioavailability of drugs. This situation means the pharmaceutical industry’s stable production of a favorite polymorph is critical. Thus, the polymorphism of the drug substance is carefully designed. For example, there was a case where a metastable polymorph did not appear by the purification of the API solution. Namely, the stabler polymorph suddenly appeared by removing a byproduct (a dimer) in the synthesis of the API (Machiya et al. Citation2009). A similar phenomenon has been reported by Okamoto et al. (Citation2004). They newly found the stable polymorph at the final stage of developing a polymorph as the candidate of API crystal form. The late appearance of new polymorphs was due to the higher purification of the API solution, namely the removal of an intermediate in the API synthesis by 0.4% or less from the solution. Further complicated phenomena have been reported, such as the disappearing polymorphs (Dunitz & Bernstein Citation1995; Bučar et al. Citation2015) and the reappearing polymorphs (Henck Citation2001; Morissette Citation2003; Barsky Citation2008). However, these problems are basically with the appearance of polymorphs or/and the transformation of polymorphs.
Another problem may occur from the point of view of industrial crystallization. We must produce the same component of API crystal. Then the quasi-polymorph control is essential. For example, the crystal water or/and solvent do not always form a stable interaction with the host API molecules. The four mono-solvates of cinacalcet hydrochloride were all unstable when removed from the mother liquor and de-solvated to a polymorph, Form II (Braun Citation2008). Non-stoichiometric hydration and solvation are sometimes experienced, as discussed by Mimura H. about an API hydrate (Mimura Citation2002). The risk of the de-solvation during the washing of a solvate API crystal was revealed by Julien Douillet et al. (Citation2012). In the latter case, the washing solvent, differing from the crystallization solvent, induced a solvent-mediated transformation of the target solvate to the non-solvate. However, the transformation was kinetically and sufficiently controlled by a super design of washing solvent. Holding water in the washing solvent at or below 0.09 wt% slowed the transformation rate. This result indicates that the stability of the solvate is severely affected by the crystallization solvent or washing solvent. Furthermore, a fundamental and severe difficulty remains in that it is difficult to identify even the chemical composition of the solvate polymorph during crystallization.
In our previous paper (Matsuura et al. Citation2021), we obtained a hydrate polymorph of the antibiotic carbapenem CS-023, Form H (CS-023 (4H2O)) from an aqueous solution. We also got a solvate polymorph, Form A (CS-023 (5/2ethanol (EtOH) 1/2H2O) by the poor solvent crystallization using ethanol as a poor solvent. Form A was obtained from an 80% ethanol solution that directly added pure ethanol into the aqueous CS-023 synthesis reaction solution. However, when the ethanol content of the crystallization solvent was changed, the product crystals became unstable in the structure with the powder x-ray diffraction (XRD) and the solvate composition.
The present paper shows how the new polymorph is identified and characterized.
2. Materials and Methods
2.1. Materials
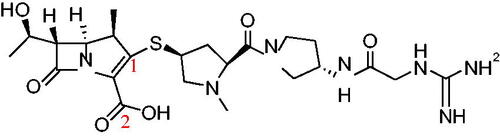
Carbapenem (CS-023), with the chemical structure shown in , was supplied by Daiichi Sankyo Co., Ltd. (Tokyo, Japan) (Kawamoto Citation2003; Shibayama Citation2007). The purity was determined to be 99.5% using a reverse-phase column based on the HPLC analysis and was used without further purification. Analytical reagent grade ethanol (EtOH) was purchased from Wako Pure Chemical Industries (Osaka, Japan). Ultrapure water was prepared in the laboratory.
Figure 1. Chemical structure of CS-023.
2.2. Poor Solvent Crystallization and Drying of Crystals
2.2.1. Batch crystallization and drying of crystals
The CS-023 crystals (Form H: CS-023·4H2O) (Matsuura et al. Citation2021) were prepared from the aqueous solution and were used as a starting material in the present crystallization.
Poor solvent crystallization was observed at a constant temperature of 25 °C, and ethanol was used as a poor solvent. In the crystallization case under 80 v/v% ethanol (Matsuura et al. Citation2021), 10 g of CS-023 was dissolved in 400 mL of water, and 1600 mL of ethanol was rapidly added under stirring. As the CS-023 solubility in water was 25.9 g/L at 25 °C, a large volume of water was required to dissolve 10 g of CS-023. On the other hand, the solubility of CS-023 in 80 v/v% ethanol was even lower (0.277 g/L) at 25 °C. Therefore, we can consider a sizable initial supersaturation ratio of 18.1 to recover a large amount of crystal. Crystals appeared immediately (within 60 sec), and after 15 min, the crystals were filtered, washed with ethanol, and dried at 25 °C and 6.2 kPa. The recovered crystals were Form A (Matsuura et al. Citation2021). Poor solvent crystallization was also observed under 20 to 70 v/v% ethanol. The crystals recovered in the poor solvent crystallization were filtered with a 1.0 μm-cellulose filter (ADVANTEC No.5) and washed with a crystallization solvent of three double volumes of crystals. Then, the crystals were dried with a shelf dryer at 25–60 °C under 0.04 kPa. The amount of water and ethanol in the solid was determined using Karl Fisher titrator MKA-610 (Kyoto Electronics MFG. co., Ltd. Kyoto, Japan) and gas chromatography (6890 N, Agilent Technologies, CA, USA) with headspace sampler G1880 (Agilent Technologies, CA, USA). The crystals were also dried with a 100 mL mini-conical dryer at a rotation speed of 10 rpm. The packed volume of crystals was 10%.
2.2.2. Hanging drop crystallization
The hanging drop crystallization was also performed using a Hampton Research crystallization cell. A 0.04 mL droplet of aqueous 25 mg/mL CS-023 solution was hanging-placed on a siliconized cover glass. The droplet’s initial supersaturation ratio (C/Cs) was 4.8 based on the solubility of Form H at four °C. The reservoir solution was 40 v/v% ethanol. The hanging drop was incubated at four °C for 24 hours. The crystal that appeared in the droplet was put on single-crystal X-ray diffraction analysis without washing and drying. The crystal was not Form H.
2.2.3. Raman spectroscopy measurement on a single crystal
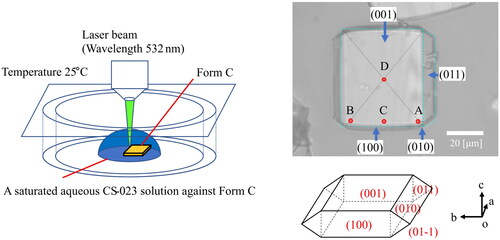
Raman spectroscopy measurements were carried out with inVia Qontor (Renishaw plc, New Mills, UK) on a single crystal of CS-023 placed in a saturated aqueous solution at 25 °C. The laser beam was focused on samples using a microscope Leica DM2700 M with a long-distance 50× objective to a beam size of about two µm diameter. The exciting laser for the sample was 532 nm in wavelength. The laser power was five mW (50 mW × 10%). Each Raman spectrum was collected with a total exposure time of 10 s (1.0 s/ time × 10 times). Raman spectra were obtained in the spectral region 274.41–2008.56 cm–1 with a resolution of 1.5–1.9 cm–1.
2.3. Characterization of Crystals
2.3.1. Powder X-ray diffraction (PXRD) analysis
The PXRD patterns were derived using Bruker D8 Advance (Bruker AXS GmbH, Karlsruhe, Germany) with Cu_Kα radiation (1.5418 Å) at 40 kV and 40 mA. The patterns were recorded between 2° and 42° considering a step of 0.02°. A domed hot-stage DHS900 (Anton Paar, Graz, Austria) was attached for the in-situ temperature and humidity diffraction measurements. Humidity was controlled using SRG-1R (SHINYEI, Kobe, Japan) at 25 °C.
2.3.2. Phase transition by absorption and emission of water and ethanol
Vapor absorption and emission isotherms of crystalline materials were determined using the DVS advantage-1 (Surface Measurement Systems Ltd., London, UK) in the relative humidity range of 0–95% at intervals of 5%.The equilibrium criterion for each step is that the weight change should be less than 0.001% for 5 min.The isotherms were determined for two types of crystals that differ in size, 29.1 and 0.24 µm. The latter particles were prepared as follows:The 1 g-solid/10 mL-90 v/v% ethanol slurry was pulverized with a wet jet mill (Nano Jet Pal JN 20, JOKOH, Co. Ltd., Tokyo, Japan). The fine particles were filtered, washed with 96 v/v% ethanol, and dried at 25 °C under 50% RH, which were then sized was determined with a laser diffraction analyzer (LA 960v2, HORIBA Ltd., Kyoto, Japan).
2.3.3. Determination of crystal structure by single-crystal X-ray diffraction
Single crystal structure analysis was performed on crystals that could grow to a size available for structure analysis. Single-crystal X-ray diffraction patterns were collected using a Graphite Monochromator (Rigaku/MSC Mercury CCD, Japan) with Mo_Kα radiation (0.7107 Å) at 150 K. All structures were solved by direct methods using SIR97 (Altomare et al. Citation1999) as implemented in the program package CrystalClear (Rigaku 2001). Refinement was carried out by full-matrix least-squares method with the SHELXL-97 (Sheldrick and Thomas Citation1997) program. All non-hydrogen atoms were refined anisotropically. The hydrogen atoms were located by the difference Fourier method. Hydrogen atoms were refined in the riding mode.
3. Results and Discussion
3.1. Crystallization of CS-023 under 20–70 v/v% Ethanol
The poor solvent crystallization of CS-023 was observed under a solvent of 20 to 70 v/v% ethanol. The crystals that appeared after a given time were washed with the crystallization solvent and dried with a shelf dryer. The solvation of crystals recovered from 70 v/v% ethanol solution was determined and summarized in , where the solvation was calculated based on the material (CS-023). Each plot corresponds to a solid recovered from the individual poor solvent crystallization. shows a wide range of solvation from 2.8 to 6.2% ethanol and 0.6 to 1.13% water.
Figure 2. The solvation of crystals washed and dried after the poor solvent crystallization in 70 v/v% ethanol. Washing with 70 v/v% ethanol. Drying: at 25–60 °C and 0.04 kPa, for 16–166 h.
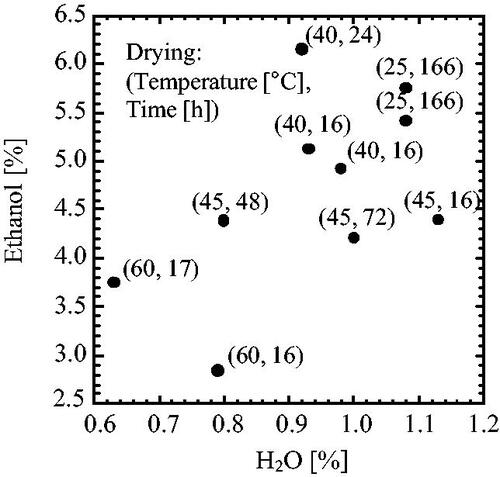
On the other hand, the solvation of Form A (CS-023·5/2EtOH·1/2H2O) previously recovered from the poor solvent crystallization conducted under 80 v/v% ethanol was unequivocally determined as 21.4% EtOH and 1.68% H2O (Matsuura et al. Citation2021). We supposed that the crystal polymorph recovered under less than 70 v/v% of ethanol was Form A, but the solvation data complicated the understanding of the crystal polymorphism. The scattering shown in suggests that a significant portion of the crystal ethanol and water may have evaporated during drying.
3.2. Hanging Drop Poor Solvent Crystallization of CS-023
The hanging drop crystallization was performed. A single-crystal was obtained by the hanging-drop method and analyzed by the single-crystal X-ray diffraction. The crystal was identified as CS-023 (1EtOH·3H2O), corresponding to 10.04% ethanol solvation and 8.5% hydration. This solvation was not the same as Form A. Therefore, the crystals recovered from less than 70 v/v% ethanol solution are not Form A. The newly identified polymorph was named Form C. The crystallographic data for Form C was tabulated in and compared with that of Form A. The hanging drop crystallization is not suitable for industrial crystallization. So, we attempted to improve the poor solvent crystallization under less than 70 v/v% ethanol solution.
Table 1. Crystallographic data on Form A and Form CTable Footnotea.
3.3. Understandings of Washing and Drying of CS-023 Crystals Recovered from 70 v/v% Ethanol Solution
presents the first trial to determine the solvation of crystals recovered by poor solvent crystallization under 70 v/v% ethanol. Both the ethanol and water solvation were scattered. It may come from the miss-washing and -drying of crystals. Drying with a shelf dryer at 25–60 °C under 0.04 kPa might be excessive.
We newly attempted the washing and drying method to improve the solvation data and establish the industrial production method. First, the crystals were washed with 75 v/v% ethanol. Then, with a mini-conical dryer, the drying was attempted under 1.6 kPa (50% relative humidity (RH)) at 25 °C. presents the drying process of crystals, where Form C’s water and ethanol solvation was co-presented as a reference. Ethanol quickly evaporated till the ethanol solvation level of Form C and then turned to a slow drying over the ethanol solvation level. On the other hand, the water dried slowly by a higher level than the hydration of Form C and was kept at a certain high level. Changing the vapor pressure to 0.04 kPa resulted in the hydration dropping to zero, but the ethanol solvation did not change.
Figure 3. Drying at 25 °C and 1.6 kPa. Washing with 75 v/v% ethanol. Reference: Intrinsic solvation of Form C: 10.04% H2O, 8.55% EtOH.
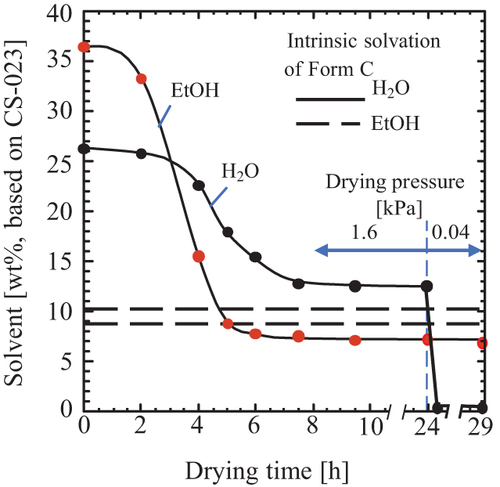
This drying behavior is explained as shown in . First, ethanol and water evaporate from the surface of crystals, where the ethanol evaporation rate is faster (Stage-a). The water-rich phase leaves on the surface of crystals (Stage-b). Then the crystal ethanol diffuses to the water-rich phase, and water reversely diffuses to the inside of the crystals (Stage-c). When the water located on the crystal surface evaporates over, those diffusions stop (Stage-d). The ethanol that remained after the vapor-pressure change must disappear with an elapsed time, as expected from .
Figure 4. Behavior of the washing solvent during the drying of crystals.
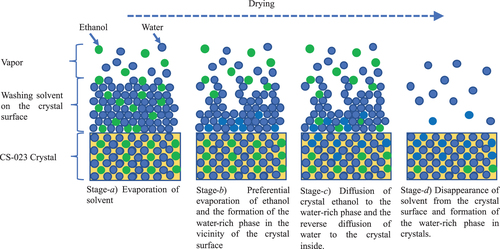
Stage-c explains that the crystal ethanol is replaced by water outside the crystals. Therefore, Stage-c is essential in understanding the crystal solvation change during washing and drying. The stage was directly observed through Raman spectrum measurement of Form C. Raman spectrum change of Form C, placed in an aqueous CS-023 solution saturated against Form C, was measured at 25 °C. The laser beam was irradiated to the sites A, B, C, and D on the (001) surface of a single crystal of Form C, shown in . Site D is the center of the surface. The Raman spectroscopy measurement was also carried out for the (001) surface of Form H (4 hydrates), placed in an aqueous CS-023 solution saturated against the solubility of Form H.
Figure 5. Raman spectroscopy measurement on Form C’s (001) surface exposed by a saturated CS-023 solution. A, B, C, D: Laser beam irradiation sites.
The Raman spectra of Form C and Form H were compared in . The peak at 1386.4 cm–1 reduces or disappeared in Form H and the peak at 1548.9 cm–1 shifts to the large wave number 1558.7 cm–1. The peak assignment has referred to the measurement by Kalp and Carey (Citation2008) for Meropenem, Imipenem, and Ertapenem. The peak at 1386.4 cm–1 has low intensity, but it is important because it belongs to the symmetrical stretching of the carboxylic group, Site 2, shown in . The hydrogen bonding between the carboxylic group and water causes the intensity to drop at the 1386.4 cm–1 peak. The carboxylic group makes a hydrogen bonding with ethanol in Form C and water in Form H. (The molecular arrangement in those polymorphs is not shown here.) The dominant peak at 1548.9 cm–1 is assigned to a feature with significant contributions from the polarizable p-electron system (Kalp and Carey Citation2008), Site 1, shown in . The shift to 1558.7 cm–1 may depend on a change in the torsion angle C = C-S-C (Kalp and Carey Citation2008).
Figure 6. Raman spectroscopy data on Form C’s (001) surface exposed by a saturated CS-023 solution. A, B, C, D: Laser beam irradiation sites. (a) A comparison of Raman sift between Form C and Form H. (b) The changes in Raman spectroscopy with elapsed time.
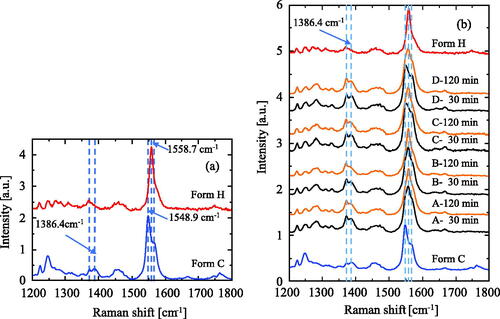
presents the time-depending changes in the peak intensity at 1386.4 cm–1 and the peak-top shift from 1548.9 to 1558.7 cm–1 for the laser irradiation Points A, B, C, and D. The decrease in the peak intensity at 1386.4 cm–1 and the peak top shift begin faster at Points A and B. However, at Points C and D, those changes are less observed. This observation shows that water molecules enter into Form C from the (010) and (00) surfaces and that Form C partially changes to a similar polymorph to Form H under aqueous conditions. Furthermore, this observation supports the drying mechanism shown in .
3.4. Improvement of Washing and Drying of CS-023 Crystals Recovered from 70 v/v% Ethanol Solution
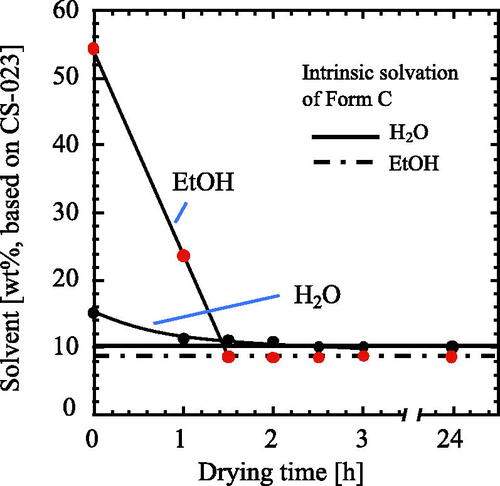
The drying process explained in suggests a possible method by which Form C holds the intrinsic solvation state. The critical factor in drying is not to generate the water-rich phase that induces the diffusion of crystal ethanol. If the suggested method is successful, it proves that the drying mechanism shown in is reasonable. The washing solvent was changed from the crystallization solvent to Ninety-six v/v% ethanol, which has a similar composition to the azeotropic ethanol/water mixture (Ninety-six wt% ethanol) commonly used in distillation. We chose this solvent to achieve a balanced drying process, where ethanol and water evaporate at the same rate. presents the drying process of crystals washed with 96 v/v% ethanol, where the water and ethanol solvation of Form C was also co-presented as a reference. When the ethanol disappeared from the crystal surface, the water remaining on the crystal surface was little. It means that the water-rich phase that may induce the diffusion of the crystal ethanol is not substantially generated. Thus, ethanol and water stopped evaporating at the solvation levels of Form C. As expected, it is owing to the simultaneous evaporation of ethanol and water in the same component. shows that the 96 v/v% ethanol is suitable for washing and drying crystals produced by ethanol/water-poor solvent crystallization.
Figure 7. Drying at 25 °C and 1.6 kPa. Washing with 96 v/v% ethanol. Reference: Intrinsic solvation of Form C: 10.04% H2O, 8.55% EtOH.
The additional washing with pure ethanol (99.5%) and drying at 25 °C and 1.6 kPa for 12 h were examined. Unfortunately, the crystals began to crush during washing with pure ethanol. The powder that remained after drying contained 17.55% ethanol and 0.9% water, but these values might not be related to the solvation of crystals. Considering this result, we conclude that 96 v/v% ethanol is most suitable for washing and drying crystals produced by ethanol/water-poor solvent crystallization.
Hsieh et al. (Citation2017) investigated the drying of an API (mono-ethanol solvate) washed with methyl t-butyl ether (MTBE). They classified the process into three stages, 1) the evaporation of MTBE from the crystal surface, 2) the transitional stage for the evaporation of the residual ethanol and a small amount of crystal ethanol, and 3) the diffusion of incorporated ethanol. In the transition stage, there may remain a small amount of MTBE yet in the vicinity of the crystal surface. The azeotropic solvent as a washing solvent may be helpful to avoid the second ambiguous stage. In the third stage, they succeeded in an estimation of the diffusion rate based on the diffusivity. Even if an azeotropic solvent is used, the third process occurs under severe circumstances; for example, under 0.04 kPa as shown in . In the present work, we utilized an azeotropic solvent for drying solvate crystals without destroying the crystal component, while Dance Z. E. E. et al. showed a strategy to avoid forming an azeotrope for the complete drying of hydrate crystals. Namely, Dance et al. (Citation2020) attempted to convert (dry) the dihydrate crystals of 2’-C-methyluridine to the anhydride by using 97% acetonitrile. Immediately after adding dihydrate crystals to acetonitrile at 20 °C, the dihydrate was partially converted to anhydride. Then, when the temperature was raised to 76–80 °C, that is a minimum azeotropic point, fresh acetonitrile was added during the ascending temperature. With this addition of fresh acetonitrile, all dihydrate crystals were successfully converted to anhydride.
3.5. Recovery of CS-023 Polymorph, Form C by the Poor Solvent Crystallization under 70 v/v% Ethanol
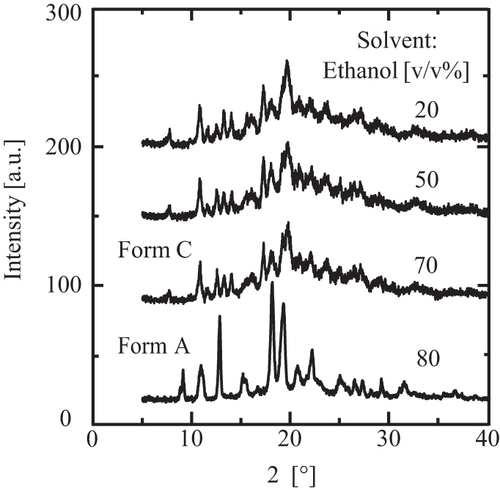
The poor solvent crystallization of CS-023 was conducted under 70 v/v% ethanol with stirring. Then, crystals were washed with 96 v/v% ethanol under 50% RH at 25 °C. presents the optical micrograph of the recovered crystals about 30 µm in length. The XRD pattern of the crystals is presented in . It was compared with that of Form C. The XRD pattern of Form C was estimated using crystallographic information data for Form C. The estimated XRD pattern includes the full width at a half maximum of 0.15, using Mercury (The Cambridge Crystallographic Data Centre (CCDC)). represents that the crystals recovered from 70 v/v% ethanol solution are Form C. shows that the crystals recovered from 20 and 50 v/v% ethanol solution are also Form C.
Figure 8. An optical microphotograph of the CS-023 crystals recovered after 18 h-poor solvent crystallization under stirring.
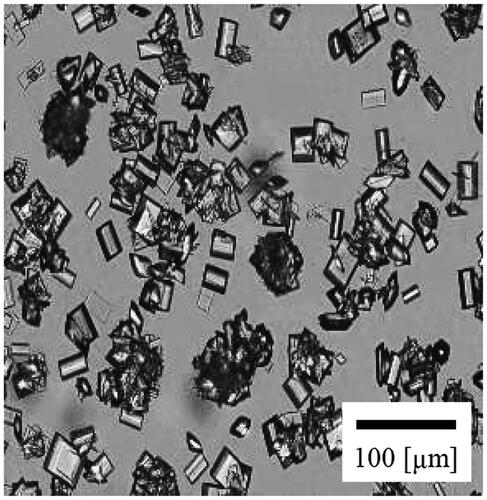
Figure 9. The comparison of the XRD patterns between (a) the crystals recovered from 70 v/v% ethanol solution and (b) Form C estimated from the crystallographic information data.
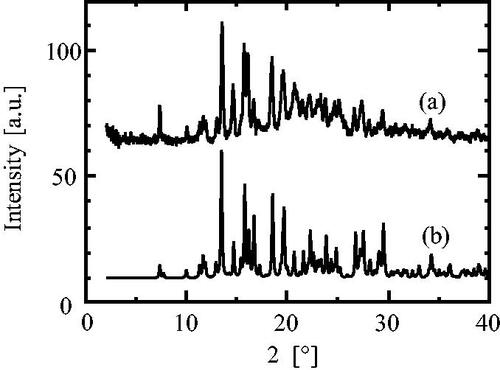
Figure 10. The XRD data for the crystals formed in less than 70 v/v% ethanol and a comparison with Form A’s.
The water absorption and emission isotherms in the humidity range of 0–90% RH were presented in (solid curves), which were determined for 30 µm crystals shown in . The red and blue curves represent the absorption and emission isotherms, respectively. The isotherms indicate at 9.25% mass change that the crystals tested correspond to 3H2O hydrates, namely, Form C. However, the isotherms show water’s slow absorption and emission of over 9.25% mass change. In our previous paper (Matsuura et al. Citation2021), we observed a similar slow absorption and emission phenomenon in Form H (CS-023·4H2O) and Form A (CS-023·5/2EtOH·1/2H2O). We discussed the excess before that the excesses might be due to water adsorption on the surface of crystals. Then we attempted to confirm what the excess was. Namely, the isotherms were also measured using the crystals crushed to a median of 0.24 µm. Suppose the water adsorption on the surface of crystals causes the excess. In that case, the excess will increase remarkably by using tiny crystals as adsorbents because the total surface area of fine particles is much bigger than that of large particles. The result is presented in (dotted curves). The water excess did not change between 29.1 µm crystals and 0.24 µm crystals. Therefore, we correct the previous discussion about the excess water (Matsuura et al. Citation2021) as follows.
Figure 11. Water absorption and emission isotherms on Form C washed with 96 v/v% ethanol; Effect of crystal size.
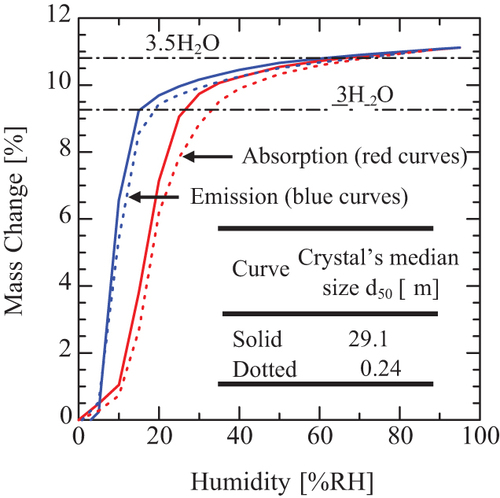
The absorption and emission of excess water are due to an invasion and leakage of free water into and from crystals. Namely, the slow absorption is caused by an accumulation of water in the inner dead space of crystals. This explanation about the absorption and emission isotherms is also supported by the experimental result shown in and . Depending on the humidity, such non-stoichiometric hydration and dehydration were reported for erythromycin A crystals (K. Fujii Citation2013).
3.6. Relationship between Form a and Form C That Crystallized from the Different Concentrations of Ethanol
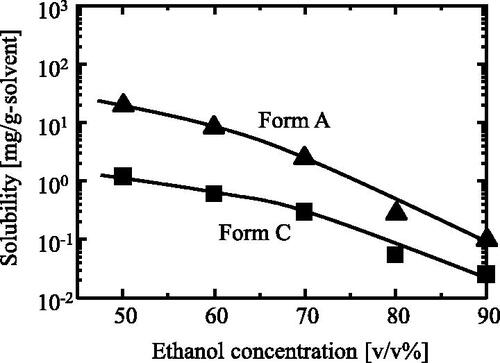
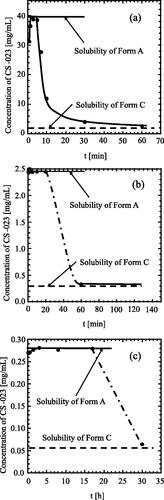
Two polymorphs of CS-023, Form A and Form C, are formed in an ethanol/water solution, as reconfirmed in . However, Form A was steadily formed in 80 v/v% ethanol (Matsuura et al. Citation2021), and Form C was formed in less than 70 v/v% ethanol. Then, the relationship between the two polymorphs was investigated. presents the solubility of Form C compared with that of Form A, where the former is lower than the latter. suggests that solvent-mediated transformation may transform Form A into Form C. Then the transformation of Form A was examined. Form A slurry prepared with the different concentrations of ethanol, 40, 70, and 80 v/v%, was incubated at 25 °C, and the solution concentration change of CS-023 was measured.
Figure 12. Solubility of Form A and Form C at 25 °C in ethanol solution.
shows that the solution concentration was kept at Form A’s solubility for a while and then decreased to Form C’s solubility in all three cases. Slight differences between Form C’s solubility and the measured CS-023 concentration may be due to an increase in solubility with the degradation products of CS-023. After the solution concentration reached Form C’s solubility, the crystals were recovered and washed with 96 v/v% ethanol. Those crystals were identified as Form C from XRD data. These results support the solvent-mediated transformation of Form A to Form C.
Figure 13. Changes in the concentration of CS-023 during the solvent mediated transformation of Form A to Form C at 25 °C. Solvent and the prepared Form A slurry: (a) 40 v/v% ethanol, 56 mg/mL, (b) 70 v/v% ethanol, 30 mg/mL, (c) 80 v/v% ethanol, 3 mg/mL. In all cases, Form C was recovered after (a) 60 min, (b) 60 min, (c) 30 h.
4. Conclusions
The solvation of crystals is a complicated parameter, especially for pharmaceuticals where reproducible production of the same product is required. The solvation of a new carbapenem CS-023 crystals was also hard to determine in the early stage of development, as shown in . CS-023 was crystallized in less than 70 v/v% ethanol aqueous solution, washed with the crystallization solvent, and dried under 0.04 kPa at 25–60 °C using a shelf dryer. In order to determine the solvation without drying, the crystal was prepared by hanging drop crystallization in less than 70 v/v% ethanol and then identified as Form C (CS-023·EtOH·3H2O) by single crystal X-ray diffraction analysis.
Then, we tried the milder drying conditions using a mini-conical dryer at 25 °C under 1.6 kPa (50% relative humidity (RH)). However, when the crystallization solvent, 75% ethanol, was used for washing, the intrinsic solvation of Form C was not reproduced for dried materials, as shown in . However, from , a possible drying mechanism was suggested and illustrated in . The crucial point is that the drying process includes the timing that the surface of crystals is covered with only water. This water layer induces the diffusion of solvated ethanol to the outer water layer and, as a result, causes the elution of ethanol from crystals and the water invasion of the vacant crystals. Based on this drying model, a method of washing was attempted, using 96 v/v% ethanol as a washing solvent. Although this is not an azeotropic solvent, namely not 96 wt%, an expected result was obtained, as shown in . Thus, a helpful washing and drying method was established for the industrial production of Form C. This method should be used for the ethanol/water solvates.
Form A (CS-023·5/2EtOH·1/2H2O), previously recovered from the poor solvent crystallization conducted under 80 v/v% ethanol (Matsuura et al. Citation2021), made the solvent-mediated transformation to Form C quickly under 40 and 70 v/v% ethanol. However, the transformation was significantly slow, under 80 v/v%.
Acknowledgments
The authors thank Daiichi Sankyo Co., Ltd for supplying CS-023.
Disclosure statement
No potential conflict of interest was reported by the author(s).
References
- Altomare A, Burla MC, Camalli M, Cascarano GL, Giacovazzo C, Guagliardi A, Moliterni AGG, Polidori G, Spagna R. 1999. SIR 97: a new tool for crystal structure determination and refinement. J Appl Crystallogr. 32:115–119. doi: 10.1107/S0021889898007717
- Barsky I, Bernstein J, Stephens PW, Stone KH, Cheung E, Hickey MB, Henck J-O. 2008. Disappearing and reappearing polymorphism in p-methylchalcone. Crystal Growth & Design. 8:63–70. doi: 10.1021/cg7007733
- Braun DE, Kahlenberg V, Gelbrich T, Ludescher J, Griesser UJ. 2008. Solid state characterization of four solvates of R-cinacalcet hydrochloride. CrystEngComm. 10:1617–1625. doi: 10.1039/b809219b
- Bučar D-KB, Lancaster RW, Bernstein J. 2015. Disappearing polymorphs revisited. Angew Chem Int Ed Engl. 54:6972–6993. doi: 10.1002/anie.201410356
- Dance ZEX, Crawford M, Moment A, Brunskill A, Wabuyele B. 2020. Kinetics, thermodynamics, and scale-up of an azeotropic drying process: mapping rapid phase conversion with process analytical technology. Org Process Res Dev. 24:1665–1674. doi: 10.1021/acs.oprd.0c00275
- Douillet J, Stevenson N, Lee M, Mallet F, Ward R, Aspin P, Dennehy DR, Camus L. 2012. Development of a solvate as an active pharmaceutical ingredient: developability, crystallisation and isolation challenges. J Cryst Growth. 342:2–8. doi: 10.1016/j.jcrysgro.2011.05.023
- Dunitz DJ, Bernstein J. 1995. Disappearing polymorphs. Acc Chem Res. 28:193–200. doi: 10.1021/ar00052a005
- Fujii K, Aoki M, Uekusa H. 2013. Solid-state hydration/dehydration of erythromycin a investigated by ab initio powder X-ray diffraction analysis: Stoichiometric and nonstoichiometric dehydrated hydrate. Crystal Growth & Design. 13:2060–2066. doi: 10.1021/cg400121u
- Henck J-O, Bernstein J, Ellern A, Boese R. 2001. Disappearing and reappearing polymorphs, the benzocaine: picric acid system. J Am Chem Soc. 123:1834–1841. doi: 10.1021/ja002113o
- Hsieh DS, Gao Q, Huang M, DiMemmo LM, Lindrud M, Razler T. 2017. From drying kinetics, solvate structure, particle morphology, and modeling to optimal drying protocol. Org Process Res Dev. 21:1509–1520. doi: 10.1021/acs.oprd.7b00162
- Kalp M, Carey PR. 2008. Carbapenems and SHV-1 β-lactamase form different acyl-enzyme populations in crystals and solution. Biochemistry. 47:11830–11837. doi: 10.1021/bi800833u
- Kawamoto I, Shimoji Y, Kanno O, Kojima K, Ishikawa K, Matsuyama E, Ashida Y, Shibayama T, Fukuoka T, Ohya S. 2003. Synthesis and structure-activity relationships of novel parenteral carbapenems, CS-023 (R-115685) and related compounds containing an amidine moiety. J Antibiot (Tokyo). 56:565–579. doi: 10.7164/antibiotics.56.565
- Machiya K, Ieda S, Hirano M, Ooshima H. 2009. Effects of impurities on crystal polymorphism of an imidazopyridine derivative developed as a drug substance for osteoporosis. J Chem Eng Japan / JCEJ. 42:147–152. doi: 10.1252/jcej.08we259
- Matsuura S, Igarashi K, Azuma M, Ooshima H. 2021. Polymorphic crystallization design to prevent the degradation of the β-lactam structure of a carbapenem. Crystals. 11:931–944. doi: 10.3390/cryst11080931
- Mimura H, Kitamura S, Kitagawa T, Kohda S. 2002. Characterization of the non-stoichiometric and isomorphic hydration and solvation in FK041 clathrate. Colloids Surf, B. 26:397–406. doi: 10.1016/S0927-7765(02)00026-7
- Morissette SL, Soukasene S, Levinson D, Cima MJ, Almarsson Ö. 2003. Elucidation of crystal form diversity of the HIV protease inhibitor ritonavir by high-throughput crystallization. Proc Natl Acad Sci USA. 100:2180–2184. doi: 10.1073/pnas.0437744100
- Okamoto M, Hamano M, Igarashi K, Ooshima H. 2004. the effects of impurities on crystallization of polymorphs of a drug substance AE1-923. J Chem Eng Japan / JCEJ. 37:1224–1231. doi: 10.1252/jcej.37.1224
- Sheldrick GM, Thomas RS. 1997. [16] SHELXL: High-resolution refinement. Methods Enzymol. 277:319–343. doi: 10.1016/S0076-6879(97)77018-6
- Shibayama T, Sugiyama D, Kamiyama E, Tokui T, Hirota T, Ikeda T. 2007. Characterization of CS-023 (RO4908463), a novel parenteral carbapenem antibiotic, and meropenem as substrates. Drug Metab Pharmacokinet. 22:41–47. doi: 10.2133/dmpk.22.41