
Abstract
Scope 1, 2, and 3 net zero is a major technological challenge for the chemical industry in Japan, but a failure or even a delay in achieving this goal could result in exclusion from international financing and supply chains. This study presents, for the first time to the best of our knowledge, multiple quantitative pathways from today until 2050 for the chemical industry operating in Japan to reach scope 1, 2, and 3 net zero, using a demand-supply model. Through these pathways, this study aims to provide fundamental and strategic insights into necessary actions for net zero. We demonstrate that, amid possible demand reduction through population decline and advances in circularity, securing access to bio-based feedstock as well as carbon capture and storage (CCS) is essential to avoid a supply limit that could be imposed under scope 3 net zero. Given the uncertainty of Japan’s access to both, the chemical industry should pursue both concurrently, while maximizing recycling. Specifically, it should secure long-term and stable sources of sustainable bio-based feedstock and aid in implementing carbon dioxide capture from incinerators in waste management. These implications could also apply to chemical industries in other countries and regions with similar constraints.
1. Introduction
Today, the global chemical industry supplies products essential to most sectors of the economy, accounting for more than 8% of the gross domestic product of the manufacturing sector in 2017 (Oxford Economics Citation2019). However, this has environmental impacts on many of the processes in the planetary boundaries (as defined by Rockström et al. Citation2009), including climate change (Steffen et al. Citation2015), and novel entities (i.e., new substances and new forms of existing substances, etc.) such as microplastics pollution (Persson et al. Citation2022). In the context of climate change, for instance, the Intergovernmental Panel on Climate Change is calling for increasingly urgent actions to reduce greenhouse gas (GHG) emissions. This urgency has compelled the international financial community (GFANZ Citation2022), and brand owners in the downstream of the supply chain (WBCSD Citation2021), to demand GHG emission reductions from upstream suppliers such as the chemical industry in scope 1, 2, and 3 as defined by the GHG Protocol (WBCSD and WRI Citation2004, Citation2011).
However, as a part of the hard-to-abate industries, GHG reductions in the chemical industry are notoriously challenging (Systemiq Citation2021). This is especially true in Japan, where renewable energy is not as abundant or accessible as in other countries (Carbon Tracker Initiative Citation2021). Furthermore, the fact that most chemical products contain carbon makes the management of end-of-life emissions after incineration particularly challenging in Japan, where incineration has been one of the primary waste treatment methods to minimize landfill (Ministry of the Environment Citation2014). Given the ubiquity of chemical products, the importance of these challenges is highlighted by the fact that unless the chemical industry achieves scope 1, 2, and 3 net zero, other industries will not be able to do so either. Thus, a failure, or even a delay, on the part of the chemical industry in Japan to achieve scope 1, 2, and 3 net zero could result in exclusion from international financing and supply chains. This is because the downstream sectors ultimately choose what products to procure from upstream of the supply chain, and financial sectors choose which chemical companies to invest in or divest from.
Several studies have reported pathways for the chemical industry to achieve net zero GHG emissions. Some are qualitative roadmaps developed by the Japanese government (Ministry of Economy, Trade, and Industry Citation2021, Citation2023a), whereas others are quantitative European or global studies (Saygin and Gielen Citation2021; Meys et al. Citation2021; CEFIC Citation2021; Stegmann et al. Citation2022; Bachmann et al. Citation2023). However, these studies failed to present a holistic perspective on the transition to net zero. For example, Stegmann et al. (Citation2022) and Bachmann et al. (Citation2023) omitted financial impacts, whereas Saygin and Gielen (Citation2021) and Meys et al. (Citation2021) omitted environmental impacts other than GHG emissions, and CEFIC (Citation2021) omitted end-of-life emissions and demand-side measures. Our group has recently reported quantitative pathways for the global chemical industry to achieve scope 1, 2, and 3 net zero, while taking these previously omitted perspectives into consideration (Meng et al. Citation2023). By applying this methodology to Japan, this study presents, for the first time to the best of our knowledge, quantitative pathways to scope 1, 2, and 3 net zero from today until 2050 for the chemical industry operating in Japan. Based on this quantitative analysis, this study aims to provide stakeholders of the chemical industry in Japan with fundamental and strategic insights, including opportunities and challenges, into the necessary actions that can guide the industry toward net zero. The scope 3 emissions in this study are limited to categories 1 and 12 only (see the Method section below for more detail).
2. Method
2.1. General description of the demand-supply model
A demand-supply model was developed to analyze pathways between 2020 and 2050 for the chemical industry in Japan to achieve net zero emissions. The model considered seven basic chemicals (ethylene, propylene, butadiene, benzene, toluene, xylenes, and methanol) at the start of the petrochemical supply chain. presents a conceptual overview of our demand-supply model.
Figure 1. Conceptual overview of the demand-supply model. Arrows represent flow of information for model calculation; EOL stands for end of life; and CE stands for circular economy. (1) The 7 chemicals are ethylene, propylene, butadiene, benzene, toluene, xylenes, and methanol. (2) Downstream sectors are packaging & household goods, transportation, building & construction, apparel, and other sectors. (3) CE activities include (i) elimination, (ii) reuse, (iii) substitution, and (iv) recycling. (4) Additional demand includes demand from products used in energy transition such as windmills, solar panels and batteries.
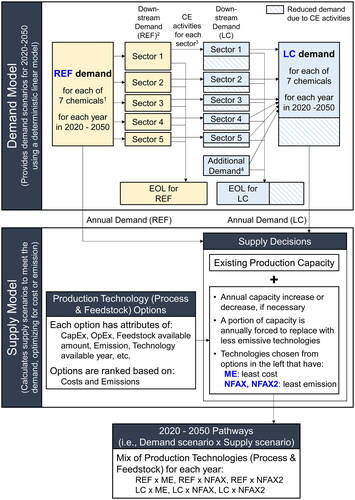
Our model was a combination of a demand model and a supply model. The demand model specified the yearly demand for each of the seven chemicals, whereas the supply model was an agent-based model (i.e., a system is described based on the activities of the constituents or “agents” in a bottom-up manner) in which the agents were the manufacturing plants that produced the seven chemicals to meet the annual demand specified separately by the demand model. The supply model included an external forcing mechanism to replace existing conventional plants on an annual basis to drive the scope 1, 2, and 3 emissions (see below for definition) toward net zero. This replacement could take the form of retrofitting existing plants into less emissive plants or a combination of decommissioning old plants and constructing new plants with new GHG reduction technologies.
In accordance with the GHG Protocol’s definitions (WBCSD and WRI Citation2004, Citation2011), the types of emissions considered in the model were as follows: scope 1 (direct GHG emissions), scope 2 (indirect GHG emissions from purchased energy, such as electricity and steam), and scope 3 (other indirect GHG emissions) category 1 (purchased goods and services) and category 12 (end-of-life treatment of sold products). Categories 1 and 12 were considered because they represent the largest scope 3 emission in major chemical manufacturers (BASF 2021). The GHGs considered in the model were carbon dioxide (CO2) and methane (CH4).
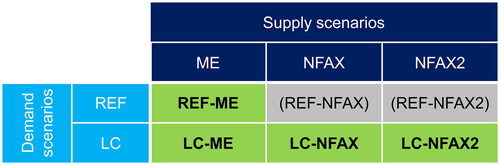
The demand and supply models each generated scenarios, and the combination of a demand scenario and a supply scenario constituted a pathway. We considered two demand scenarios and three supply scenarios, resulting in six pathways, as shown in . Four of these pathways (REF-ME, LC-ME, LC-NFAX, and LC-NFAX2) that were deemed the most insightful are discussed in depth. A brief description of these pathways is as follows: REF-ME (Reference demand is fulfilled using the lowest-cost production technologies); LC-ME (Reduced demand due to circular economy is fulfilled using the lowest-cost production technologies); LC-NFAX (Reduced demand due to circular economy is fulfilled using the best emission reduction technologies regardless of the cost); and LC-NFAX2 (Reduced demand due to circular economy is fulfilled using the best emission reduction technologies regardless of the cost, but without using carbon capture and storage (CCS)). The results presented by the demand and supply model were not precise projections or forecasts but rather simulations that identified the key elements necessary to implement a transition to net zero.
Figure 2. Demand scenarios, supply scenarios, and combined pathways.
2.2. General description of the demand model
The demand model we developed was a deterministic linear model which did not include optimization. For each of the seven chemicals, it calculated the annual volume demand from key downstream industry sectors, the demand reduction through circular economy, the volume of generated waste, and end-of-life emissions.
The REF (reference) demand scenario assumed a decline in domestic demand proportional to a 20% decline in the population of Japan by 2050 (United Nations Citation2022), while net exports were assumed to remain flat until 2050. This scenario was considered “reference” for Japan, because no major change in its future course of action was assumed, except for the rise in the methanol demand (see below).
The LC demand scenario assumed a further reduction in demand compared to the REF scenario as a result of the four circularity activities in the downstream industry sectors, as described in the following section. In the LC scenario, circularity was implemented at 50% of its maximum potential while still providing the same utility as the REF scenario did (50% was the consensus among a panel of experts convened by the authors, which was considered neither too optimistic nor pessimistic as the circularity target.). The handling of import is explained at the end of the “General description of the supply model” below.
Both REF and LC demand scenarios utilized the 2020 demand in Japan as their starting point. These demand scenarios also assumed that catalytic reformers in refineries would be decommissioned by 2050, following a decline in fuel production for vehicles with internal combustion engines, and that some olefins and aromatics would be produced through methanol, creating a rise in the methanol demand.
2.3. Circular economy, waste, and recycling in the demand model
The four circularity activities assumed in the LC scenario were (i) elimination (e.g., using less or no plastics through avoiding overpackaging), (ii) reuse (e.g., using new business models for packaging and delivery, as well as sharing), (iii) substitution (e.g., replacing plastics with paper and wood), and (iv) recycling (e.g., mechanical, depolymerization, and solvent-based recycling). The demand model estimated demand reductions through these circularity activities in the following industry sectors: packaging and household goods, transportation, building and construction, apparel, and other sectors.
Next, the demand model estimated the annual waste generation from each sector, assuming a delay from production to waste generation of 1, 12, 30, 5, and 5 years for the above five sectors, respectively (Geyer et al. Citation2017). For example, chemicals produced in the year X for the transportation sector go to the waste and recycling system in the year X + 12.
The model calculated the amount of mechanical recycling from the amount of available waste and from the reported mechanical recycling rates for each industry sector (Plastic Waste Management Institute Citation2022a, Citation2022b). Waste availability is a function of production volume and lifetime of each product according to established methodology (Geyer et al. Citation2017). Recycling rates are defined as the rate of plastic which is effectively recycled and incorporated into new products (once all processes losses are taken into account). Overall future recycling rates were based on the government targets (Ministry of the Environment Citation2019). Waste that was not mechanically recycled was cascaded to upstream chemical recycling (e.g., depolymerization and solvent-based recycling) and subsequently to downstream chemical recycling (e.g., pyrolysis and gasification).
2.4. General description of the supply model
The supply model we developed was based on bottom-up plant-level decisions made year by year, where the type of new plants (i.e., which production technologies to use) and the fate of existing plants (i.e., retrofitting or decommissioning) were decided based on the ranking of the technologies. Each production technology has corresponding attributes for emissions and levelized unit production costs. The production costs were estimated by taking steps described in the supporting information (pages 14, 17, 19 and 20) of our earlier study (Meng et al. Citation2023). Using the attributes for cost and emission, two ranking tables for the technologies were generated, one based on the cost, and the other based on the emission. The ME supply scenario chose the highest-ranking production technologies with respect to the low cost, whereas the NFAX and NFAX2 supply scenarios chose highest-ranking production technologies with respect to the low emissions. Despite the difference in priority, all supply scenarios pursued net zero.
From 2020 toward 2050, the external forcing mechanism in the supply model replaced 5% of the existing capacity every year with production technologies that had lower emissions. After the forced replacement, plants were further built or decommissioned based on the gap between the production capacity and the demand for each year. Our model and assumptions do not have mechanism and granularity to replace older plants before younger ones, because providing individual plant-level guidance is considered beyond the aim of this study. We chose a fixed rate (5%) to describe pathways with steady transition throughout the period, in order to gain fundamental insights into major changes that are needed in the industry. 5% was the consensus among a panel of experts convened by the authors, and was considered an appropriate rate for the chemical industry to reach near net zero. If the rate is set too low, the industry will not reach near net zero, and if too high, the industry will reach near net zero earlier than 2050. Note that certain new technologies were not expected to become available until 2030 (). Note further that scope 3 category 12 emissions (explained later) were included in the calculation of the total amount of emissions for each pathway but were excluded when production technologies were selected in the NFAX or NFAX2 scenarios; therefore, they were not part of the optimization.
Table 1. Production technologies considered in the model, categorized by the year when they become available. (I), (T), and (E) stand for an initial, transition, and end-state technology, respectively.
Our approach combined the demand model which describes the yearly demand between 2020 and 2050, and the supply model which describes the yearly mix of production technologies from 2020 toward 2050. This combined approach provided continuous transition pathways from 2020 to 2050 in terms of total production capacity and the mix of production technologies. This approach has multiple advantages; (1) it combined the strength of the forecasting approach (continuity from the current state) and that of the backcasting approach (reach the target state); and (2) it can highlight and compare (between pathways) the impact of major actions the chemical industry needs to take (such as securing bio-based feedstock and CCS). Thus, although using a fixed yearly rate for the external forcing mechanism throughout 2020 to 2050 did not guarantee that emissions would reach precisely net zero in 2050, we consider this approach sufficient and appropriate for the aim of this study.
Note that this model assumed that the seven chemicals in scope were produced domestically to meet domestic demand and net exports. However, the impact of imports from explicit production abroad was qualitatively evaluated outside of the model and discussed in the Discussion section.
2.5. Production technologies, emissions, and constraints in the supply model
The production technologies for the seven basic chemicals with a technology readiness level (TRL) above six were considered in the model (see for the technologies considered), where TRL was assigned by the International Energy Agency and others (International Energy Agency Citation2019, Citation2023). They were categorized into three types: an initial technology, which represents today’s unabated production technology; an end-state technology, which represents a fully abated production technology; and a transition technology, which only partially reduces emissions and requires an upgrade to an end-state technology in a later year but was needed when end-state technologies were unavailable yet.
Specifically, the Fischer-Tropsch process (FT) to convert syngas into hydrocarbon with a broad range of carbon chain length was not included in the model. Because it produces many distillates other than naphtha for the chemical industry, the entire demand volume and the cost for FT would be driven mostly by non-chemical demands such as fuels for transportation, which were beyond the scope. Because it is impossible to estimate the amount of naphtha that FT would provide, FT was considered unfit for the aim of this study. The impact of excluding FT will be discussed in the Discussion section.
The energy externally sourced by the chemical industry (such as electricity) that is used in the production processes was assumed to be net zero by 2050. This is in order to focus the analysis, for the aim of this study, on what the chemical industry does have control (such as whether and how to replace naphtha), and not to focus on what it does not have control (such as emission intensity of external energy sources).
CCS was assumed to be installed to capture emissions from incinerators in the waste management, and the installation base was assumed to increase along an S-curve (i.e., an initial slow growth is followed by a rapid growth and a late-stage slow growth) until all incinerators were fitted with CCS by 2050. CCS was also applied as an abatement solution for several production technologies in the supply model to capture scope 1 CO2 emissions.
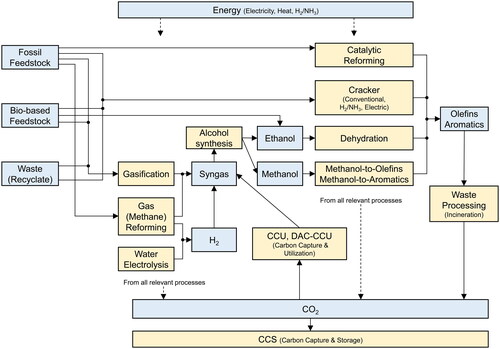
shows key process technologies and feedstock that were considered in the supply model.
Figure 3. Key process technologies and feedstock considered in the supply model. The yellow boxes represent process technologies, and the blue boxes represent key input and output from process technologies.
Several key constraints were considered in the model to remain within the planetary boundaries. With respect to the impacts on biodiversity and land use, we ensured that biomass use did not exceed 0.5 EJ per year. This amount of biomass was considered to be sustainably available from abandoned farmland and surplus woods in Japan. We conservatively estimated this amount by scaling down the technical potential availability in Japan (3.72 EJ per year in 2050) as reported in the literature (Wu et al. Citation2020), to account for sustainable sourcing (Wu et al. Citation2019), and to account for the fact that biomass would serve increasing demand from other industries as well, such as power generation, aviation fuel, and construction. Regarding the impact on novel entities, because of the reduced future demand and improved waste management in the model, the environmental leakage and microplastic pollution in 2050 should be less than those experienced today; thus, no constraints were set regarding the novel entities. Similarly, no constraints were imposed based on other processes in the planetary boundaries because they were less relevant to the chemicals within the scope of this study.
Other key assumptions considered in the model were as follows. The upper limit on the ramp up rate for new production technologies, which was set at four plants or a 30% increase in capacity per year to prevent unrealistic explosive growth of a new production technology (these values were the consensus among a panel of experts convened by the authors). Assuming the potential export of CO2, no upper limit was placed on the CCS in the ME or NFAX supply scenarios, to estimate the ultimate required volume of CCS from the chemical industry.
Detailed assumptions for the demand and supply model and the Python program for the model can be found on our GitHub site (See data availability statement below). Further descriptions of the model and assumptions can be found in the supporting information (pages 3–26, 30–53, 55, 126, and 127–141) of our earlier study (Meng et al. Citation2023), which used the same model and assumptions but studied the global chemical industry, whereas this study focused on Japan to gain country-specific insights.
3. Results
3.1. Future demand scenarios
Two demand scenarios were investigated: REF and LC. As shown in , the combination of a 20% population decline between 2020 and 2050 and a flat net export, which was 6.6 million tons per year (Mt/y), reduced the joint demand for olefins and aromatics from 25.1 Mt/y in 2020 to 22.7 Mt/y in 2050 in the REF demand scenario. This scenario included an increased demand for olefins and aromatics of 1.1 Mt/y in 2050 from products such as solar panels and windmills to advance GHG reduction. In this context, olefins represent ethylene, propylene, and butadiene, whereas aromatics refer to benzene, toluene, and xylenes. The REF demand was further reduced to 14.4 Mt/y in the LC demand scenario, in which the four circular economy activities reduced the demand for olefins and aromatics from REF by 8.3 Mt/y (or by 8.9 Mt/y if the decrease in methanol demand was included).
Figure 4. Changes in the demand for olefins, aromatics, and methanol between 2020 and 2050 in Japan. White type indicates the total demand for olefins and aromatics only.
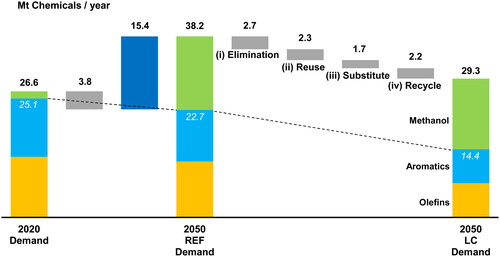
The REF demand scenario consisted of olefin, aromatics, and methanol demands of 11.8, 10.9, and 15.5 Mt/y in 2050, respectively. The LC demand scenario consisted of olefin, aromatics, and methanol demands of 7.2, 7.1, and 14.9 Mt/y in 2050, respectively. This was in contrast to the demands of 12.8, 12.3, and 1.5 Mt/y in 2020 for the same chemicals. In both demand scenarios, methanol demand increased significantly by 2050 to serve as an intermediate in the production of olefins and aromatics via the methanol-to-olefin (MTO) and methanol-to-aromatics (MTA) processes.
3.2. Four circular economy activities that reduce the demand for chemicals
Elimination (i) rendered chemical products unnecessary for delivering the same benefit to society, thereby reducing the demand by 2.7 Mt/y by 2050. This reduction included the elimination of unnecessary plastic packaging (0.7 Mt/y) and improved office and building utilization (0.6 Mt/y). Reuse (ii) required less chemicals to deliver the same benefit and reduced the demand by 2.3 Mt/y by 2050. This reduction consisted of new business models for the packaging and delivery of food and consumer products (1.5 Mt/y) and mobility-as-a-service (0.7 Mt/y). Substitution (iii), in which chemical products were replaced by products not produced by the chemical industry, reduced the demand by 1.7 Mt/y by 2050. This reduction included the substitution by paper products in packaging (1.3 Mt/y) and by wood-based products in housing (0.2 Mt/y). Recycling (iv) reduced the demand by 2.2 Mt/y by 2050. This reduction consisted of mechanical recycling (1.8 Mt/y) and chemical or solvent-based recycling (0.4 Mt/y).
3.3. Net zero supply scenarios that meet the demand
Three supply scenarios were investigated: ME, NFAX, and NFAX2. In these scenarios, an important conclusion was that all GHG reduction actions can be categorized into three basic supply strategies, namely alternative feedstock, renewable/non-fossil energy, and CCS. In fact, these three strategies were deployed at different combinations in the three supply scenarios.
Alternative feedstocks were derived either (i) from nonfossil sources of carbon where carbon atoms came from the atmosphere (bio-based feedstock or feedstock made from direct air capture - carbon capture and utilization (DAC-CCU)), or (ii) from recyclates (chemical recycling, such as pyrolysis and gasification, as well as point-source CCU). The energy used in the production processes for the seven chemicals within the scope of this study was assumed to be net zero by 2050, coming from renewable sources such as solar and wind, and non-fossil sources such as nuclear energy.
As shown in , the two ME supply scenarios that sought the most economical solution relied on fossil-based feedstock for more than 95% of their carbon source. In these scenarios, the carbon in waste that was not recycled was incinerated and sequestered by CCS or disposed of in landfills. In addition, off-gas (mostly methane) from crackers was used as fuel and sequestered via CCS. The ME supply scenarios selected solutions based on fossil feedstock and CCS for the most part because they were less expensive than processes utilizing alternative feedstocks.
Figure 5. (a). Sources of carbon in the feedstocks for different pathways, for the seven chemicals in the scope of this study.
(b). Emissions in 2050 for different pathways, and the amount of CCS assumed in each pathway.
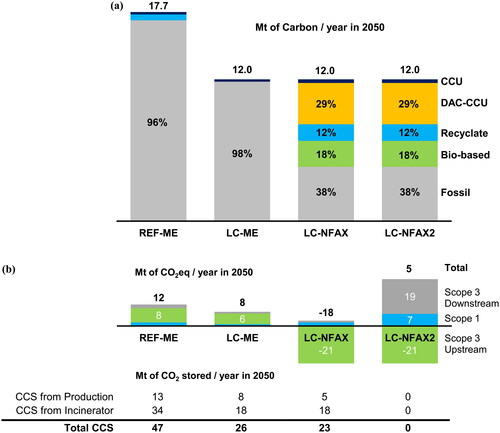
also shows that the NFAX supply scenario, which sought the fastest abatement, used diversified feedstocks, including bio-based, DAC-CCU, recyclates, as well as fossil-based feedstocks, while combined with CCS. The combination of bio-based or DAC-CCU feedstocks with CCS removed carbon from the atmosphere and stored it in the ground over the course of the lifecycle of chemical products, thereby providing an opportunity to reduce atmospheric CO2. The NFAX scenario continued using fossil feedstock, mainly because the model placed an upper limit on the annual rate at which conventional fossil-based plants were replaced by plants that used alternative feedstocks.
The NFAX2 supply scenario did not use CCS but was otherwise identical to the NFAX scenario. Specifically, the mix of the production process and feedstock was identical between NFAX and NFAX2, such as the extensive use of bio-based and DAC-CCU feedstock. However, NFAX2 used no CCS, and as a result, it had large end-of-life (scope 3 downstream) emission, unlike NFAX. This scenario provided insight into cases in which CCS was found prohibitively expensive or impractical in Japan.
3.4. Pathways (demand scenarios + supply scenarios) and GHG emission
In the LC-ME pathway (the combination of the LC demand scenario and the ME supply scenario), 98% of the feedstock came from fossil sources and required 26 Mt/y of CCS by 2050 to achieve near net zero emissions of 8 Mt CO2eq as shown in . The requirement for CCS in the LC-ME pathway was less than that in the REF-ME pathway (47Mt/y), because the unimpeded demand in the REF demand scenario generated more emissions from production and end-of-life incineration than in the LC demand scenario. Partly because of leakage from the CCS system, whose capture rate was assumed to be 95% in 2050, the REF-ME and LC-ME pathways did not achieve strict net zero. This was considered permissible, because the aim of the study is not to calculate pathways that arrive precisely at net zero, but is to gain fundamental and strategic insights into the necessary actions for net zero.
In the LC-NFAX and LC-NFAX2 pathways (the combinations of the LC demand scenario and the NFAX or NFAX2 supply scenarios), 62% of the feedstock came from alternative sources in 2050. In these pathways, bio-based feedstock represented 18% of the entire feedstock (or 0.080 EJ), which was well below the cap (0.5 EJ) we set, indicating that sourcing bio-based feedstock of this amount would be realistic for the chemical industry. The LC-NFAX pathway required 23 Mt/y of CCS in 2050 and achieved negative emissions (-18 Mt/y), whereas the LC-NFAX2 pathway required no CCS and achieved near net zero emissions (5 Mt/y). The LC-NFAX pathway produced negative emissions, with the entire chemical supply chain functioning as a carbon sink. In other words, the chemical products that remained in the economy (i.e., those produced using bio-based or DAC-CCU feedstock but have not yet reached the end-of-life stage) also served as temporary carbon sinks.
shows a breakdown of the production technologies for olefins, aromatics, and methanol. Olefins are currently produced with naphtha crackers using fossil feedstocks in Japan. However, in the REF-ME and LC-ME pathways, they were mainly produced by crackers retrofitted with CCS or those fueled by hydrogen or ammonia. In the LC-NFAX pathway, in addition to hydrogen/ammonia-fueled crackers, electric crackers and crackers using pyrolysis oil with CCS were used to achieve greater abatement. Currently, aromatics are mainly produced via catalytic reforming and naphtha cracking. However, in the REF-ME and LC-ME pathways, they were mainly produced by a methanol-to-aromatics (MTA) process using methanol produced via natural gas reforming, which requires CCS to abate the end-of-life emissions. In the LC-NFAX and LC-NFAX2 pathways, CCU, DAC-CCU, or biomass gasification was used instead of natural gas to produce methanol and aromatics via an MTA process.
3.5. Capital expenditures and unit production costs
The cumulative capital expenditures until 2050 are shown in . The LC-ME pathway had lower capital expenditures than those of the REF-ME pathway because the demand in the LC-ME pathway was smaller; thus, fewer new plants and retrofits were needed. The LC-ME pathway also incurred lower capital expenditures than those of the LC-NFAX pathway. This was because the LC-NFAX pathway required more expensive processes to utilize bio-based or CO2 as feedstocks, and more expensive cracker retrofits were required to achieve greater emission reductions.
As shown in , the unit production cost for olefins and aromatics in 2050 was approximately 20–130% higher than in 2020 in the LC-ME pathway and 30–190% higher in the LC-NFAX pathway. The increase in the cost of aromatics was greater than that of olefins because of the required transition from catalytic reformers to newly built MTA processes.
4. Discussion
4.1. Scope 1, 2, and 3 net zero pathways
Today, most of the feedstock for chemical products is fossil-based, and they are mostly incinerated without CCS or CCU at their end-of-life stage (with or without energy recovery) in Japan. In other words, the carbon vector is from the ground (fossil) to the air (incineration without carbon capture), as shown in .
As presented thus far, there are multiple pathways that could bring the chemical industry in Japan near or beyond scope 1, 2, and 3 net zero. The first set of net zero pathways is LC-ME and REF-ME, which mainly combine the use of fossil feedstock with CCS, where the carbon vector is from the ground (fossil) to the ground (CCS). These are the most economical pathways and appear to be financially more viable than the other pathways. However, they rely almost entirely on CCS for GHG reductions, despite the fact that Japan is yet to prove large-scale CCS destinations within its territory and exporting CO2 for overseas sequestration is only planned (Ministry of Economy, Trade, and Industry Citation2023b). For these reasons, the LC-ME and REF-ME pathways are considered highly risky for Japan. Typical CCS sites include deep geological formations, such as saline formations and oil and gas fields (Bui et al. Citation2018), which could be sought domestically and overseas.
Another net zero pathway is LC-NFAX2, which relies on alternative feedstocks; thus, even if chemical products are incinerated without carbon capture as they are today, a near net zero can be achieved owing to the CO2 absorbed from the atmosphere by the feedstocks. In this context, the carbon vector is from the air to the air. While this pathway does not rely on untested CCS, it relies intensively on bio-based feedstock and DAC-CCU feedstock, despite the fact that very little bio-based feedstock and even less DAC-CCU are used in practice today. Furthermore, sustainably sourcing a large amount of bio-based feedstock is considered a major challenge (Energy Transitions Commission Citation2021), due to the rising demand for securing food for the growing global population and the accelerating movement to safeguard biodiversity. The technical potential availability of biomass in Japan (3.72 EJ per year in 2050) appears sufficient for the chemical industry. However, long-term investment in, for example, woody biomass and abandoned farmland to convert them into chemical feedstock is needed to unlock this under-explored potential and to realize it as a source for stable access. Relying on imported bio-based feedstock is a simple but risky option in terms of supply chain management, not to mention trade security and currency fluctuations. Without domestic investment or importation, access to bio-based feedstock will remain uncertain.
The last net zero pathway is LC-NFAX, which is a combination of the LC-ME and LC-NFAX2 pathways, in that it combines the use of alternative feedstocks with CCS. The carbon vector for this pathway is from the air to the ground, which resulted in negative emissions.
Because the future availability and economic viability of CCS and alternative feedstocks (bio-based and DAC-CCU) in Japan are both uncertain, relying solely on one of them to achieve net zero, as in LC-ME or LC-NFAX2, would be a risky strategy. In conclusion, the chemical industry in Japan should instead diversify its risks by concurrently pursuing both CCS and alternative feedstocks, aiming for the shaded area in , where net zero is achieved through a combination of CCS and alternative feedstocks.
4.2. Managing the sources and destinations of carbon and their strategic implications
The four net zero pathways in the previous section indicate where the industry as a whole must head to. This section will translate this basic insight into specific actions, opportunities and challenges for individual companies in the chemical industry, by analyzing key constraints that scope 3 net zero brings about in the supply chain.
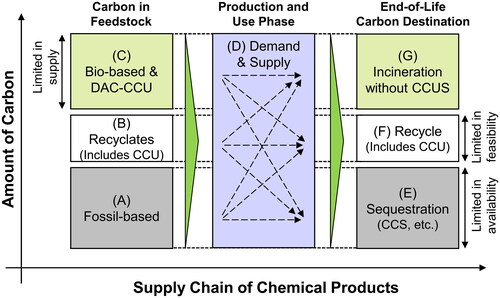
Scope 3 net zero is a requirement from the financial community as well as the direct and indirect customers of the chemical industry in the downstream of the supply chain. Under scope 3 net zero, our group has previously demonstrated that the total supply of carbon in chemical products is limited to the sum of sequestered carbon (CCS), recycled carbon (recyclates and CCU), and carbon in bio-based and DAC-CCU feedstock (Meng et al. Citation2023). In other words, this indicates (D) = (C) + (E) + (F) as mentioned in . This is because (A) = (E), (B) = (F), and (C) = (G) can be derived under the constraints of scope 3 (category 12) net zero, assuming a steady amount of stock of embedded carbon in chemical products within the economy over time, and that scope 1 and 2 emissions are net zero, among other assumptions detailed in the supporting information (page 7) of our earlier study. The equation (D) = (C) + (E) + (F) indicates that the capability of the chemical industry to fulfill the demand (D) will be capped by the sum of the three components, (C), (E), and (F), each of which could be limited in supply. For example, for (C), the supply of sustainably sourced bio-based feedstock is considered limited, whereas that of DAC-CCU could be limited owing to its high cost. For (E), the availability of CCS could be limited, especially considering the site development time until 2050. Finally, for (F), the recycling rate (measured with respect to carbon atoms in the production volume) is unlikely to reach 100% and could be limited. Overall, this implies that securing stable access to (C), (E), and (F) will be of vital strategic importance for companies in the chemical industry under scope 3 net zero. This conclusion is in agreement with what the four pathways require. For example, the REF-ME and LC-ME pathways highlight the importance of (E) or CCS; the LC-NFAX2 pathway shows the importance of (C) or bio-based and DAC-CCU feedstock, and (F) or recycling; and the LC-NFAX pathway features the importance of all of (C), (E) and (F).
To secure stable access to (F) or recyclate as a source of carbon, the chemical industry in Japan should maximize the recycling rate of chemical products. Expanding access to (F) will decrease the requirements for the uncertain (C) and (E) to accommodate the same level of demand (D). In fact, the recycling rate of plastics in Japan in 2021 was only 25% (Plastic Waste Management Institute Citation2022a), if energy recovery is not considered to recycle carbon.
Access to (C), bio-based and DAC-CCU feedstocks, as a source of carbon will be through methanol or ethanol. Methanol could be produced through DAC-CCU, where CO2 could be converted overseas into methanol using less expensive green hydrogen, or it could be produced from bio-based feedstocks. Ethanol will likely be bioethanol. However, given the rising demand for sustainable aviation fuel (SAF), supply for the chemical industry could compete with aviation fuel, which may no longer be joint products from petroleum. This constraint adds to the aforementioned supply chain risks. Therefore, securing domestic and dedicated sources to maintain a stable supply for the chemical industry is essential, such as long-term investments by the chemical industry in domestic woody biomass and abandoned farmland. Conversely, the relatively smaller and geographically distributed petrochemical complexes in Japan would be a comparative advantage when compared to the larger and more concentrated complexes abroad. This is because alternative feedstocks, such as bio-based feedstocks and recyclates, are typically generated in a more distributed manner than petroleum and naphtha, which are imported in bulk.
Access to (E) or CO2 sequestration as a destination of carbon is an important means to reduce GHG emission. For example, to achieve scope 3 net zero, shows that as long as fossil feedstock remains part of the feedstock, CCS (or other forms of sequestration such as managed landfill) is required to sequester the same amount of carbon as that in the fossil feedstock. CCS is used to sequester CO2 from production processes and end-of-life incineration, but because the latter is located outside of chemical plants and far down the value chain, it may be unrealistic for chemical companies to operate CCS after incineration. However, because post-incineration CCS is vital for achieving scope 3 net zero for the chemical industry and its value chain, the chemical industry should not detach itself from this issue. As Japan has over one thousand incineration facilities (Ministry of the Environment Citation2021), one way to deploy post-incineration CCS could be through an additional contribution to an existing extended producer responsibility program, such as the existing Containers and Packaging Recycling Law. In addition, the CCS demand for post-incineration CCS must be considered, when Japan estimates the total demand for CCS and pursues CCS capacity both domestically and internationally. Instead of CCS, post-incinerator CO2 or gasification to syngas could be utilized for CCU if hydrogen is accessible. The post-incinerator CCU reduces the need for CCS as parts of (A) and (E) in are replaced by (B) and (F). In conclusion, the chemical industry in Japan should pursue the implementation of post-incineration carbon capture, either in the form of CCS or CCU.
4.3. Dealing with the cost increase
The unit cost increase of the basic chemicals that achieve scope 1, 2, and 3 net zero (net zero chemicals) is high (20–190%), particularly for immediate customers of the chemical industry. However, suppose this unit cost increase is 100% (double cost), then the ultimate impact on the production cost of end-user products is limited to approximately 1% (Meng et al. Citation2023), assuming no opportunistic price increase in the supply chain exists, among other assumptions. This is because the impact of cost increase in the chemical industry is diluted by the additional material input and value added by companies in the middle of the supply chain. Given the seemingly prohibitive cost increase, it is natural for companies in the middle of the supply chain to delay the introduction of net zero chemicals despite the limited cost impact and regardless of the need for such chemicals at the downstream end of the supply chain. Therefore, it is essential that downstream brand owners who need to reduce scope 3 emissions collaborate with the chemical industry at both ends of the supply chain. For example, they could share signals for the future demand and supply of net zero chemicals via an open coalition.
4.4. Impact of excluding the Fischer-Tropsch process from the model
Our model did not include the Fischer-Tropsch process (FT) for reasons detailed in the Method section. However, we believe this exclusion did not materially affect the key conclusion of this study (i.e., fundamental and strategic insights for net zero) shown next. This is because the methanol routes (i.e., MTO and MTA) and the FT routes essentially share the same input and output chemicals, in that both routes convert carbon dioxide or syngas into olefins and aromatics. Here, the FT routes include FT production of saturated hydrocarbons followed by conventional cracking and/or reforming of the hydrocarbons into olefins and aromatics, as well as nascent direct synthesis of olefins and aromatics through FT (Nezam et al. Citation2021; Zhai et al. Citation2021). If FT were included in our model’s technology option, and the cost and emission of the FT routes were lower than those of the methanol routes, FT would replace the methanol routes in and . However, our conclusion to concurrently pursue alternative feedstocks, CCS, and recyclates would remain the same, because the need for these resources would remain the same under the supply scenarios in which FT replaces the methanol routes. If, on the other hand, the cost and emission of FT were higher, FT’s role in and would be negligible, and our conclusion would remain the same.
Figure 6. Breakdown of production technologies to produce olefins, aromatics, and methanol for different pathways.
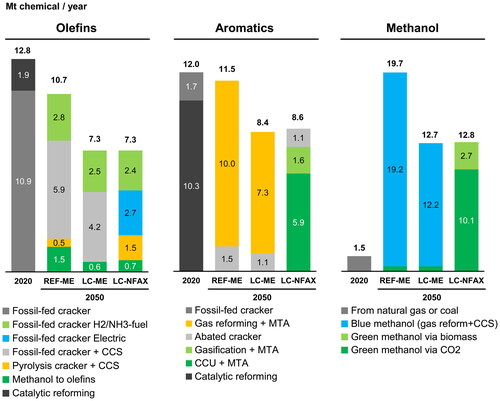
Figure 7. (a). Cumulative capital expenditures until 2050, broken down by target products.
(b). Unit production cost of chemicals in net zero pathways in 2050.
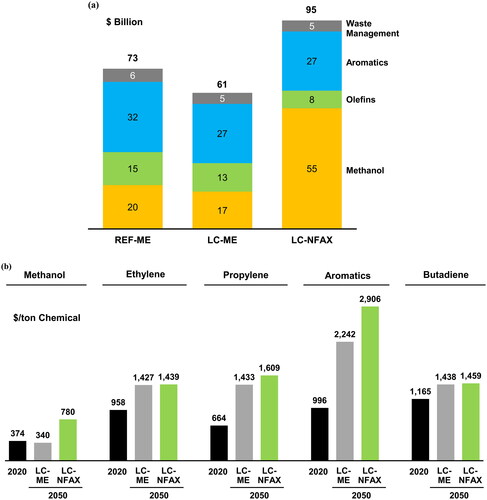
Figure 8. Conceptual positioning and carbon vector of where we are today, the four net zero pathways, and the target zone of net zero, with respect to two GHG reduction measures.
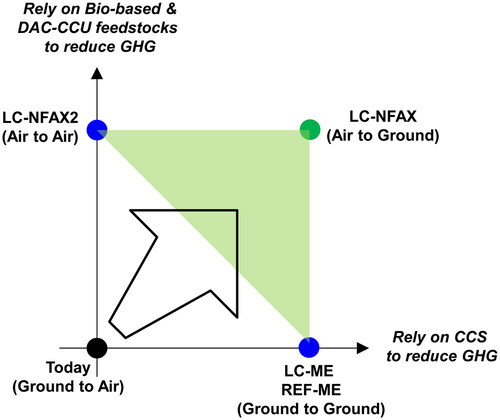
Figure 9. Carbon balance in the chemical supply chain. Carbon balance and scope 3 (category 12) net zero together require (A)=(E), (B)=(F), and (C)=(G). As long as these equations hold true, fossil feedstock, for example, can reach any of the three destinations to be scope 3 (category 12) net zero, as indicated by the dotted arrows in the Production and Use Phase. These equations also indicate (D)=(C)+(E)+(F), strategic implications of which are detailed in the Discussion section. The proportion of (A):(B):(C) or (E):(F):(G) is for illustrative purposes only.
5. Conclusion
We quantitatively demonstrated that the chemical industry located in Japan could transition from where it is today to scope 1, 2, and 3 net zero. Even though there are multiple pathways to net zero, they should not be regarded as forecasts, but as simulations to identify key elements necessary to implement a transition to net zero, which are mentioned below.
The chemical industry in Japan must expand access to both bio-based/DAC-CCU feedstocks and CCS, while maximizing recycling including CCU, to remain in the international financing and supply chain. Given the uncertainty in the access to these feedstocks and CCS in Japan, the chemical industry should explore both concurrently.
Concerning the access to bio-based and DAC-CCU feedstocks, the chemical industry in Japan can start with the import of methanol or ethanol to establish a supply chain, although it should also make a long-term investment in establishing a secure and stable supply. In addition, implementing post-incineration CCS or CCU throughout Japan is essential for achieving scope 3 net zero for the chemical industry and its value chain.
The increase in the production cost of the seven basic chemicals was substantial; however, its impact on the production costs of end-user products was limited. This uneven impact on the supply chain should be addressed by a coalition between the chemical industry and downstream brand owners to communicate future demand and supply of net zero chemicals.
Japan’s combined approach to bio-based feedstock and CCS could also apply to chemical industries in other countries and regions with limited access to these resources.
Acknowledgements
The authors would like to thank Fanran Meng, André C. Serrenho, and Jonathan M. Cullen (University of Cambridge); Min Guan, Eveline Speelman, and Pim Sauter (Systemiq); Martin M. Stuchtey (Innsbruck University); Katja Hansen (independent consultant); and Eric Masanet (University of California, Santa Barbara) for the discussions on the GHG reduction pathways for the chemical industry. The authors would also like to thank Wenchao Wu (Japan International Research Center for Agricultural Sciences) for discussions on the sustainable biomass potential in Japan. The authors would further like to thank Masahiko Matsukata (Waseda University) for the discussion on the GHG reduction pathways for the chemical industry in Japan. The authors would like to thank Taylor & Francis’s professional services for language editing and manuscript formatting.
Disclosure statements
The authors have organizational affiliations to disclose: Daisuke Kanazawa is employed by Mitsubishi Chemical Corporation and seconded to the University of Tokyo, and Naoko Ishii was a senior executive fellow of Mitsubishi Chemical Group Corporation, the parent company of Mitsubishi Chemical Corporation. Andreas Wagner and Alexandre B. Kremer now work for Radical Dot. In accordance with the publisher’s policy and Systemiq (the ‘company’) conflicts disclosure procedures, as a consultant, Systemiq reports that the company received funding from the University of Tokyo that may lead to development of research and/or may be affected by the research reported in the article. To the best of our knowledge, the company has disclosed such interests under the publisher’s policy, and the company shall endeavor to put in place an approved plan for managing any potential conflicts arising from such involvement. The authors declare that they have no further competing interests, and the opinions expressed in this publication are those of the authors and do not purport to reflect the opinions or views of any organization.
Data availability statement
Detailed assumptions for the demand and supply model and the Python program for the model can be found on our GitHub site (https://github.com/systemiqofficial/Pathways-Chemical-Industry-Japan).
Additional information
Funding
References
- Bachmann M, Zibunas C, Hartmann J, Tulus V, Suh S, Guillén-Gosálbez G, Bardow A. 2023. Towards circular plastics within planetary boundaries. Nat Sustain. 6:599–610. doi: 10.1038/s41893-022-01054-9.
- Basf SE. 2022. Scope 3 GHG Inventory Report. https://www.basf.com/global/documents/en/sustainability/we-produce-safely-and-efficiently/energy-and-climate-protection/corporate-carbon-footprint/BASF_Scope_3_Report_2021.pdf.
- Bui M, Adjiman CS, Bardow A, Anthony EJ, Boston A, Brown S, Fennell PS, Fuss S, Galindo A, Hackett LA, et al. 2018. Carbon capture and storage (CCS): the way forward. this. Energy Environ Sci. 11:1062–1176. 2018, doi: 10.1039/C7EE02342A.
- Carbon Tracker Initiative. 2021. The sky’s the limit. London (UK): Carbon Tracker Initiative.
- [CEFIC] The European Chemical Industry Council. 2021. iC2050 Project Report. Brussels (Belgium): CEFIC.
- Energy Transitions Commission. 2021. Bioresources within a net-zero emissions economy: making a sustainable approach possible. London (UK): Energy Transitions Commission.
- Geyer R, Jambeck JR, Law KL. 2017. Production, use, and fate of all plastics ever made. Sci Adv. 3:e1700782. doi: 10.1126/sciadv.1700782.
- [GFANZ] Glasgow Financial Alliance for Net Zero. 2022. Financial institution net-zero transition plans.
- International Energy Agency. 2019. Innovation Gaps. https://www.iea.org/reports/innovation-gaps.
- International Energy Agency. 2023. ETP Clean Energy Technology Guide. https://www.iea.org/data-and-statistics/data-tools/etp-clean-energy-technology-guide.
- Meng F, Wagner A, Kremer AB, Kanazawa D, Leung JJ, Goult P, Guan M, Herrmann S, Speelman E, Sauter P, et al. 2023. Planet-compatible pathways for transitioning the chemical industry. Proc Natl Acad Sci USA. 120:e2218294120. doi: 10.1073/pnas.2218294120.
- Meys R, Kätelhön A, Bachmann M, Winter B, Zibunas C, Suh S, Bardow A. 2021. Achieving net-zero greenhouse gas emission plastics by a circular carbon economy. Science. 374:71–76. doi: 10.1126/science.abg9853.
- Ministry of Economy, Trade, and Industry (Japan). 2021. Transition Finance Nikansuru Kagakubunya Niokeru Gijyutsu Roadmap. [Technology Roadmap for the Chemical Industry Related to Transition Finance.].
- Ministry of Economy, Trade, and Industry (Japan). 2023a. GX Jitsugen Nimuketa Kihonhoshin - Sankoushiryou. [Basic Policy for GX Implementation - Reference Material.].
- Ministry of Economy, Trade, and Industry (Japan). 2023b. CCS Chouki Roadmap Kentoukai Saishu Torimatome Setsumei Shiryou. [CCS Long Term Roadmap Study Group Final Meeting Explanation Material.].
- Ministry of the Environment (Japan). 2014. History and current state of waste management in Japan.
- Ministry of the Environment (Japan). 2019. Plastic Shigen Junkan Senryaku Gaiyou. [Plastic Resources Recycling Strategy (Summary)].
- Ministry of the Environment (Japan). 2021. Nihon No Haikibutsu Shori Reiwa Gannendoban. [Waste Management in Japan for 2019.].
- Nezam I, Zhou W, Gusmão GS, Realff MJ, Wang Y, Medford AJ, Jones CW. 2021. Direct aromatization of CO2 via combined CO2 hydrogenation and zeolite-based acid catalysis. J CO2 Util. 45:101405. doi: 10.1016/j.jcou.2020.101405.
- Oxford Economics. 2019. The global chemical industry: catalyzing growth and addressing our world’s sustainability challenges.
- Persson L, Almroth BMC, Collins CD, Cornell S, de Wit CA, Diamond ML, Fantke P, Hassellöv M, MacLeod M, Ryberg MW, et al. 2022. Outside the safe operating space of the planetary boundary for novel entities. Environ Sci Technol. 56:1510–1521. doi: 10.1021/acs.est.1c04158.
- Plastic Waste Management Institute. 2022a. An introduction to plastic recycling. Tokyo (Japan): Plastic Waste Management Institute.
- Plastic Waste Management Institute. 2022b. Plastic Seihin No Seisan Haiki Saishigenka Shorishobun No Joukyou 2021 [Status of Production, Disposal, Recycling, and Waste Management 2021]. Tokyo (Japan): Plastic Waste Management Institute.
- Rockström J, Steffen W, Noone K, Persson Å, Chapin FSI, Lambin E, Lenton TM, Scheffer M, Folke C, Schellnhuber HJ, et al. 2009. Planetary boundaries: exploring the safe operating space for humanity. E&S. 14:32. doi: 10.5751/ES-03180-140232.
- Saygin D, Gielen D. 2021. Zero-emission pathway for the global chemical and petrochemical sector. Energies. 14:3772. doi: 10.3390/en14133772.
- Steffen W, Richardson K, Rockström J, Cornell SE, Fetzer I, Bennett EM, Biggs R, Carpenter SR, de Vries W, de Wit CA, et al. 2015. Planetary boundaries: guiding human development on a changing planet. Science. 347:1259855. doi: 10.1126/science.1259855.
- Stegmann P, Daioglou V, Londo M, van Vuuren DP, Junginger M. 2022. Plastic futures and their CO2 emissions. Nature. 612:272–276. doi: 10.1038/s41586-022-05422-5.
- Systemiq. 2021. The Paris Effect - COP26 Edition.
- United Nations, Department of Economic and Social Affairs, Population Division. 2022. World population prospects: the 2022 revision.
- [WBCSD] World Business Council for Sustainable Development. 2021. Pathfinder framework: guidance for the accounting and exchange of product life cycle emission.
- [WBCSD] World Business Council for Sustainable Development, [WRI] World Resources Institute. 2004. Greenhouse gas protocol: a corporate accounting and reporting standard (Revised Edition).
- [WBCSD] World Business Council for Sustainable Development, [WRI] World Resources Institute. 2011. Corporate value chain (scope 3) accounting and reporting standard.
- Wu W, Hasegawa T, Ohashi H, Hanasaki N, Liu J, Matsui T, Fujimori S, Masui T, Takahashi K. 2019. Global advanced bioenergy potential under environmental protection policies and societal transformation measures. GCB Bioenergy. 11:1041–1055. doi: 10.1111/gcbb.12614.
- Wu W, Hasegawa T, Fujimori S, Takahashi K, Oshiro K. 2020. Assessment of bioenergy potential and associated costs in Japan for the 21st century. Renewable Energy. 162:308–321. doi: 10.1016/j.renene.2020.08.015.
- Zhai P, Li Y, Wang M, Liu J, Cao Z, Zhang J, Xu Y, Liu X, Li Y-W, Zhu Q, et al. 2021. Development of direct conversion of syngas to unsaturated hydrocarbons based on Fischer-Tropsch route. Chem. 7:3027–3051. doi: 10.1016/j.chempr.2021.08.019.