
 ?Mathematical formulae have been encoded as MathML and are displayed in this HTML version using MathJax in order to improve their display. Uncheck the box to turn MathJax off. This feature requires Javascript. Click on a formula to zoom.
Abstract
This article investigates empirical connections between agriculture and child nutrition in Nepal. We augment the standard approach to explaining child nutrition outcomes by including information about household level agricultural production characteristics, including indicators of agricultural diversity. Data from the 2010/2011 Nepal Living Standards Survey (NLSS) are used in a series of regression models to explain stunting outcomes and variation in height-for-age Z-scores among 1,769 children 0–59 months of age. Results highlight the relative importance of overall agricultural yields, specific crop groups, and the consumption of own-production as factors correlated with long-term nutrition among children of different age groups. We find a small positive association between the degree of commercial market-orientation of households and child HAZ, but only among children under 24 months of age.
1. Introduction
Nepal has experienced economic growth and a general decline in poverty rates over the past decade, but continues to lag many of its peers in reducing child malnutrition and mortality. The 2010/2011 Nepal Living Standards Survey (NLSS) shows that 42 per cent of children are stunted, 14 per cent are wasted and 31 per cent are underweight (CBS, Citation2011). The extent of malnutrition has important implications because adequate levels of child nutrition are essential to supporting a country’s long-run economic and human development. Many factors contribute to nutritional outcomes, among them agricultural performance. In a recent review, Haddad (Citation2013) highlights several key pathways that link improvements in agriculture to improvements in nutrition. These include higher incomes, lower food prices, more nutritious on-farm production and consumption, and synergies between agriculture and nutrition arising from women’s empowerment. In this article, we empirically measure some of the specific attributes of agricultural production and performance that are associated with child nutrition in Nepal.
In Nepal, food intake is closely tied to on-farm agricultural production. While the country was considered food sufficient until 1980, population growth has surpassed agricultural production since then and Nepal currently faces a food deficit (NPC, Citation2010). During the winter of 2008 and 2009, Nepal experienced one of its worst droughts in recent history. Coupled with food price increases in 2007 and 2008, food grain deficits and an inability to move food to the most affected areas, food security declined. Children and women were among the most severely affected. Agriculture remains the primary source of income, food and employment for the majority of the rural population, particularly among households in lower-income groups. Reliance on rainfall, underutilisation of fertiliser, degradation of land and poor seed quality all exacerbate Nepal’s poor agricultural performance and contribute to high levels of food insecurity (Shively, Gars, & Sununtnasuk, Citation2011). Furthermore, the country’s landscape creates isolation. Harsh terrain, high transportation costs and poor infrastructure create challenges to moving food from food-surplus to food-deficit areas, whether through markets or government intervention. Given the close association of on-farm agricultural production and food access, nutrition risks are often highly localised.
The standard empirical approach to explaining observed variations in child nutrition outcomes is to use multiple regression to measure correlations between anthropometric indicators and underlying household, child and maternal characteristics. Our contribution in this article is to augment this type of analysis by incorporating information about agricultural production. We use the 2010/2011 Nepal Living Standards Survey (NLSS) to study 1,769 children residing in 1,289 farm households. One might reasonably expect indicators of overall agricultural production for these households to have a positive correlation with access to food and child nutrition. This study asks more specifically whether observed indicators of crop composition and diversity are correlated with long term nutrition outcomes. We thereby provide observational insights into one of the most direct pathways between agriculture and nutrition in settings where households produce predominantly for their own consumption. A second research question considered is whether market participation is correlated with nutrition outcomes. As agricultural households become more market oriented, income generated from sales may provide access to both more food and more diverse diets than production for own consumption. Conversely, market orientation may lead households to specialise or otherwise neglect aspects of production and consumption that provide nutritional benefits. The net effects of such a shift are, a priori, unclear.
2. Background
2.1. Agriculture and Food Security in Nepal
Over the past several decades, the Government of Nepal has placed a high priority on the agricultural sector and promoting its development. The Nepal Agricultural Research Council (NARC) was established in 1991 to inform policy-makers and coordinate and execute research on agriculture. The Agriculture Perspective Plan (APP) was issued in 1995 as a 20-year strategy for agriculture-led growth and achieving food security and poverty alleviation. Agriculture has also taken precedence in most of the country’s five-year plans, which present frameworks for achieving goals and priorities set by the government for the succeeding five years. Despite the prioritisation, the sector’s performance has been less than satisfactory.
The structure and composition of the agricultural sector in Nepal has continued to change. The number of smallholder farmers is growing while the number of those operating more than 2 hectares of land is decreasing. According to the 2010/2011 NLSS, the average farm size has decreased to 0.7 ha (from 0.8 ha in 2003) and the share of farm income in household income has dropped to 28 per cent (from 48% in 2003) (Central Bureau of Statistics [CBS], Citation2011). Although the share of agriculture as part of GDP has declined over the years to roughly 33 per cent as of 2007, the sector still employs the majority of Nepalese through wages or self-employment. This underscores the importance of identifying connections between agriculture, health and nutrition.
2.2. Dietary Diversity and Child Nutrition
A child’s growth and development begins in utero and continues throughout childhood. Deficiencies in various micronutrients can be intensified by lack of dietary diversity of the mother while pregnant and of the child after birth. Lack of variety in the diet is more common in developing countries where the poor rely disproportionately on starch-heavy staple foods and consume fewer animal products. Lack of nutrient-dense foods can also hinder physical and cognitive growth, particularly during the critical window period between conception and the child’s second birthday. Martorell, Khan, and Schroeder (Citation1994) reviewed research on child growth from numerous developing countries, cautioning that beyond the age of two stunting becomes difficult to reverse as linear growth stabilises.
While it may seem that increasing dietary diversity is an obvious solution to child malnutrition, achieving dietary diversity is also linked to socio-economic status, income of the household, household food security, and a broad set of regional, agronomic and geographic factors that influence food availability. Along with better access to healthcare and better living conditions, higher income and socio-economic status allow for better-informed choices and improved capacity to access food of greater quality, quantity and variety. To discern whether better nutritional quality results from dietary diversity alone or is confounded by socio-economic factors, Arimond and Ruel (Citation2004) used 11 Demographic Health Surveys, including Nepal’s, to measure the height-for-age Z-scores (HAZ) of children. The sample was divided into terciles according to age to account for greater underlying dietary diversity among older children. Dietary diversity had a significant association with HAZ in all but one of the represented countries. Dietary diversity also had a strong relationship with HAZ in non-breastfed children, likely due to the reliance on complementary foods to meet all nutrition requirements. The observed patterns were particularly strong in Nepal.
Linking the importance of dietary diversity to nutrition is the notion of crop diversity. Household production of more diverse foods has the potential to subsequently increase both the diversity of foods consumed and household income. Labour shortages and poor health, however, may lead to the production of fewer and less labour-intensive crops. These less labour-intensive crops tend to be less nutrient dense and poorer sources of major nutrients than what could have otherwise been planted. In a study of communities in the Bolivian Andes, Jones, Agudo, Galway, Bentley, and Pinstrup-Andersen (Citation2012) examined the barriers to infant and child feeding practices by conducting household surveys and interviews with caregivers. They found that limited diversity of agricultural production of the household was a strong constraint reported by caregivers and had a significant negative relationship with both the improvement of 24-hour dietary diversity and the diversity of food groups consumed over the previous seven days. It should be noted that the communities included in Jones et al.’s study were located in a graphically and economically isolated area of the Andes, limiting access to other sources of food such as markets. An additional barrier to improvements in feeding practices, and the one most frequently cited, was the amount of time the caregiver had to dedicate to agricultural work. In Bolivia, as in Nepal, a large and growing percentage of women are involved in agriculture. Agriculture in Nepal has become ‘feminised’ in recent years, as male household members have left the farm for non-agricultural work in urban areas and abroad (Allendorf, Citation2007). Additionally, increased time spent on productive activities on the farm can inadvertently detract from attention devoted to a child’s care (Levine, Citation1988), with negative implications for nutrition and health.
2.3. Agricultural Production and Nutrition
Agriculture and nutrition are connected in multiple ways. Increases in agricultural productivity may boost the quantity and/or diversity of household food consumption or generate income through sales. Additional household income may be used to improve or purchase production inputs for future consumption, or may be spent on food for immediate consumption (Bonnard, Citation1999). Income may be used to decrease workloads, thereby improving child care, or to improve access to clean water and sanitation. Increases in agricultural productivity, therefore, have the potential to improve nutritional outcomes through the overall consumption of food, dietary diversity and improvements in household resources. However, while an increase in food production increases food availability, it neither guarantees that the quality, variety, or nutritional value of the food will increase nor does it guarantee that everyone in the household will have access to the food that is produced.
Levels of agricultural production and patterns of improved input use have been disappointing in Nepal. Yet, while intensification of farming may be seen as a strategy for raising and sustaining rural household incomes, intensification also has the potential to increase crop specialisation, leading to a potential loss of crop and diet diversity. Crop intensification can also serve as an alternative to increase food self-sufficiency, particularly at a time when Nepal is facing a food deficit. Tiwari, Nyborg, Sitaula, and Paudel (Citation2008) compared outcomes among cereal-producing and vegetable-producing farmers in the hills of Nepal and found that net income from vegetable production was 50 per cent higher, on average, than that from cereal production, and that more than half of the households surveyed reported an increase in household income as a result of vegetable production. In vegetable-producing communities overall employment opportunities increased, as more labourers were required for year-round cultivation of vegetables, and small shops opened to sell agricultural inputs and produce. Improvements in food security were observed among vegetable farmers and these gains were strongest among the poor. Proximity to the capital, Kathmandu, was a key underlying feature, since market access provided a steady demand for fresh vegetables, allowing farmers to regularly market their produce.
Agricultural specialisation and commercialisation may complement household incomes, but the distribution of earnings often determines the impact on the nutrition of all household members. Forms of commercialisation can occur on the output side of production (increases in marketable surplus, away from subsistence-oriented agriculture) or the input side (increases in the use of fertiliser, improved seeds, and so forth). Seeking to analyse the impacts of agricultural commercialisation on income and nutrition, von Braun (Citation1995) reviewed case studies of various commercialisation schemes emphasising the production of cash crops in 10 developing countries in Africa, South Asia and Central America. Using weight-for-age Z-scores as the measure of child nutrition, he found no evidence that increases in income from cash crops had a significantly negative impact on a child’s health.
Transitioning to commercial agriculture has several other potential consequences. Land ownership may become concentrated, land degradation may intensify, and the workloads of men and women may shift. Included in changes of activity and work patterns is the allocation of time devoted to child care when commercialisation occurs. Paolisso, Hallman, Haddad, and Regmi (Citation2002) examined the impact of the Vegetable and Fruit Cash Crop Programme (VFC) on the time allocation of men and women in Nepal in the early 1990s. The programme was designed to improve the commercial value of fruits and vegetables and increase household incomes by providing participating farmers with inputs, training and technical assistance. Regression results showed that VFC participation had a clear impact on the time allocation of household heads devoted to child care within the observed 12-hour period. However, whether the impact was positive or negative depended on the number of children in the household. In female-headed households with one child under the age of five, households which participated in the VFC program allocated 77 fewer minutes to child care than those that did not participate. Similar patterns were reported in male-headed households. The influence of VCF participation on child nutrition was not analysed, however.
3. Data
3.1. The 2010/2011 Nepal Living Standards Survey
The 2010/2011 Nepal Living Standards Survey (NLSS) is a nationally representative household survey conducted by Nepal’s Central Bureau of Statistics and covering 5,988 households. The integrated household questionnaire addresses multiple topics including food consumption and production, household expenditures, farm and off-farm income, labour and other welfare measures at both the household and individual levels. The 2010/2011 NLSS followed the methodology of the World Bank’s Living Standard Measurement Survey and used a two stage stratified random sampling technique. In 2010/2011, anthropometric measurements were collected as part of the NLSS for the first time in over a decade.
3.2. Height-for-Age Z-Scores
Z-scores measure the dispersion of the child health indicator as standard deviations around a reference population mean, and are calculated as:
where xi is the individual observation and and σx are the median and the standard deviation of the reference population. The NLSS Z-scores were calculated using WHO’s current Child Growth Standards reference population median and standard deviation. Normal growth patterns of well-nourished children under the age of five exhibit similar heights and weights, despite geographic, ethnic and cultural differences (Habicht, Martorell, Yarbrough, Malina, & Klein, Citation1974). Departures from the distribution of optimal growth can be attributed to socio-economic and environmental factors.
For this analysis we use only height-for-age Z-scores (HAZ). These reflect impacts of health and/or nutritional conditions on growth and development during gestation as well as exogenous factors that affect the child after birth. Low values are associated with chronic food insufficiency and an unhealthy physical environment. Low HAZ is a strong indicator of long-term nutritional deficiencies and repeated illness (Puffer and Serano, Citation1973). A child is considered stunted if HAZ falls below −2.0 and severely stunted if HAZ falls below −3.0 (WHO, Citation2006). Our sample for analysis consists of 1,769 children aged 0–59 months.Footnote1 Given important differences in the developmental and nutritional needs of children above and below two years of age, we split the sample and estimate a separate series of regression for each group.
4. Empirical Strategy
Our empirical goal is to measure observed correlation in the available data. To relate agricultural production characteristics to child growth outcomes, for each subsample of children we use a series of three multiple linear regressions. Each regression takes the form:
where Zi is height-for-age of child i, Xi is a vector of control and explanatory variables, μi is an error term and β is a vector of parameters to be estimated. In Model 1, Xi includes geographic variables and characteristics of the child, mother and father. In Model 2 we add a set of household characteristics. Model 3 adds to Model 2 variables representing characteristics of agricultural production. Because districts differ in terms of poverty levels, average land holdings, major crops grown and physical environment, we cannot assume that errors are independent and identically distributed. To relax this assumption, we cluster errors by district in all models. This ensures that results are robust with respect to district–group correlation.Footnote2
Policy-makers with an interest in malnutrition may be more motivated by statistics indicating the overall prevalence of malnutrition than in Z-scores per se. We therefore present additional results from three binary logistic regressions that are used to estimate the probability that a child is stunted. While the linear regression models for Z-scores explain linear changes in outcome due to unit changes in explanatory variables, these logistic regressions indicate which variables are most highly correlated with the probability of stunting. The logistic regression model assumes that the dependent variable Si takes values of one and zero:
and is distributed according to:
Parallel with the linear regressions, we estimate three logistic regressions (Models 4–6), reporting the average marginal effect for each independent variable. For continuous independent variables, we compute the marginal effect for each observation and then average these over the entire sample. For binary variables, we calculate the marginal effect as the difference between the predicted probability at 0 and the predicted probability at 1. We then average these individual differences over the sample.
reports and describes all independent variables used in the regressions. Agricultural production variables are our main focus, with non-geographic variables controlling for factors known to influence child health and nutrition outcomes. Farm size (in ha) includes owned land plus land rented in, minus land rented out. Annual yield (kg/ha) provides an indicator of agricultural productivity. A simple count of the number of crops cultivated by the household is used to measure crop diversity. The relationship between crop diversity and a child’s Z-score may be different for children of mothers with primary or secondary education and those with mothers who have no education. To measure and test this hypothesis, we also include an interaction term between education of the mother and crop diversity.
Table 1. Description of variables used in the analysis
To further quantify and study the implications of crop diversity, the share of each food group within total diversity is used. The share is calculated as the number of crops within the specific group divided by the total number of crops. These ‘group ratios’ are calculated for cereals, roots, pulses, fruits and vegetables. As an example, if a household produced 10 distinct crops, including two cereal varieties and three vegetable varieties, then it would be assigned values of 0.20 for the cereal group ratio and 0.30 for the vegetable group ratio, indicating relatively more diversity in the vegetable group than in the cereal group. The production of eggs, milk and meat is indicated by a single binary variable which takes a value of 1 if any of the three animal products is produced on the farm. The final two agricultural production variables characterise the ratio of own-consumption to total food consumption and the ratio of crops sold to total crops harvested. Both ratios are measured in terms of annual value. The ratio of the value of crops sold to the value of crops harvested indicates the degree commercialisation of the farm household.Footnote3
5. Results
5.1. Characteristics of the Sample
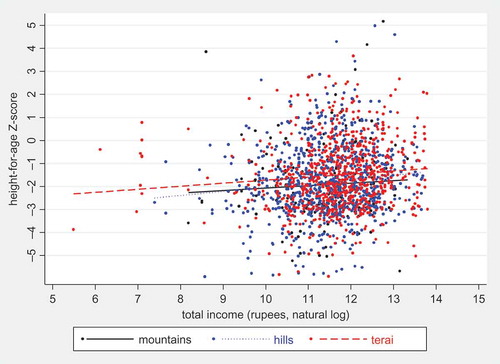
presents the distribution of children in the sample by age, gender, geographic location and income quintile. Roughly 45 per cent of all children in this sample are stunted, with an average HAZ of −1.67. Malnutrition is a nationwide problem in Nepal; however, national aggregates tend to hide the inequalities across political regions, geographic zones and socio-economic groups. Forty-six per cent of rural children are stunted compared with 35 per cent of urban children. In addition, the average Z-score among urban children (−1.26) is nearly half a standard deviation higher than among rural children (−1.71). Comparing outcomes across the three ecological zones, one finds the highest percentage of stunting and the lowest average HAZ (−1.92) in the mountains. At the regional level, 52 per cent of children in the mid-western region are stunted compared with 41 per cent of children in the central region. The negative relationship between household income and child stunting is not unexpected: prevalence rates fall steadily as one moves up the income distribution, from 51 per cent in the lowest quintile to 37 per cent in the highest quintile. The positive bivariate correlation between household income and HAZ is quite similar across ecological zones (see ).
Table 2. Characteristics of children in the sample
Figure 1. Income and height-for-age among agricultural households in Nepal, 2011
To examine how closely agricultural patterns correspond to income, reports a variety of agricultural input and output indicators by income quintile. Utilisation rates and quantities of all agricultural inputs increase across income quintiles. Farm size more than doubles between the lowest and highest income quintiles; and purchased fertiliser use increases nearly four-fold. With respect to agricultural output, yield, own consumption, the sales ratio, crop diversity and weighted crop diversity, all increase across income quintiles. It is worth noting that own-consumption of production increases slightly with income. This may be due to the smaller yields produced by poorer households and/or the composition of what they produce. Differences in the composition of output across the income gradient are less distinct. Shares of cereals decline, but shares of roots, pulses and vegetables remain roughly constant. The share of fruit in total diversity shows the strongest relationship with income. The production of proteins shows only a slight increase between the poorest and richest households. In part this reflects the way we have constructed this variable, since a household which produces only eggs is assigned the same value as a household which produces eggs, milk and meat. Generally speaking, the synergistic relationship between income and agricultural output makes it difficult to identify the direction of influence and impact. With prices given, and holding other things constant, higher yields increase household income by definition. But a higher income also facilitates purchases of inputs that boost yields. Through simple observation alone, it is not possible to identify the causal mechanisms that link income and yields.
Table 3. Agricultural inputs and outputs by income quintile
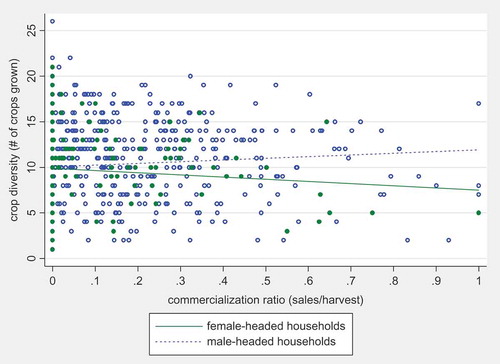
plots HAZ against yield for the separate subsamples of male- and female-headed households. We observe a positive relationship between yield and HAZ that roughly parallels the relationship between income and HAZ displayed in , which reflects the widespread importance of agriculture to income in Nepal. Predicted relationships for male- and female-headed households are almost exactly the same, although at the higher end of the income distribution the confidence intervals surrounding the predictions become increasingly wide, due to the relative scarcity of observations at these levels. plots our measure of agricultural diversity against total income, again for the separate sub-amples. The graph illustrates a fairly robust pattern in the data in which crop diversification rises with income. Male-headed households are slightly more diversified than female-headed households (10.2 crops, on average vs 9.8, p = 0.08). Diversification also increases with income at a slightly more rapid rate among male-headed households, perhaps reflecting better access to inputs and marketing among men. In general, subsistence-oriented households produce a slightly more diverse portfolio of crops than those that are sales-oriented. As female-headed households commercialise, they tend to specialise (). The opposite is true for male-headed households.
Figure 2. Agricultural yields and height-for-age in Nepal, 2011
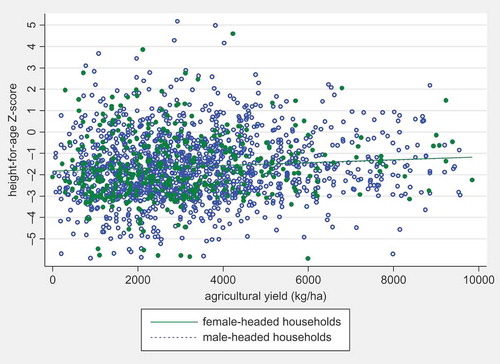
Figure 3. Crop diversification and total household income in Nepal, 2011
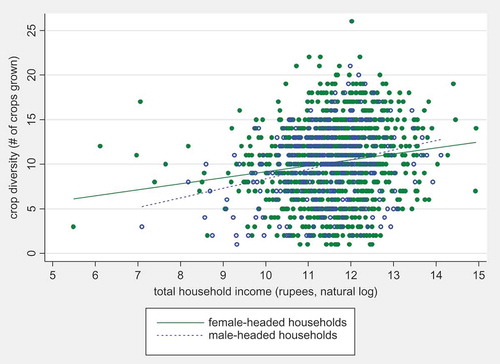
Figure 4. Commercialisation and crop diversity in Nepal, 2011
5.2. Regression Results
Regression results for the linear and logistical regressions are provided in two tables. contains results for the sample of children below the age of 24 months and contains results for the sample of children above the age of 24 months. Because patterns are similar in the HAZ and stunting regressions, we discuss them together, highlighting important differences where they appear. To begin, we note that geographic indicators in the multiple regressions do not always reflect the unconditional, bivariate patterns observed in the descriptive statistics. Z-scores among urban children below the age of 24 months are not significantly higher than among their rural cohorts and do not have a significantly lower probability of being stunted. This also holds for children above two years of age. Although all reported regressions include fixed effects to control for the three ecological zones and five regional jurisdictions represented by the data, we do not report the point estimates for these variables. On average, compared with children residing in the mountains, children under five and those residing in the Terai are significantly less likely to be stunted, but only children above the age of 24 months have a HAZ that is significantly higher (0.55 standard deviations). No other statistically strong regional differences appear for the probability of stunting for either age group; however, children under the age of two and residing in the mid-western and far-western regions and children older than two years and residing in the western region have statistically lower HAZ, on average.
Table 4. Regression results for Z-scores, children < 24 months of age
Table 5. Regression results for Z-scores, children ≥ 24 months of age
Regarding characteristics of the child, parameter estimates for age of children under two suggest that HAZ decreases and the probability of stunting increases as children get older but at a decreasing rate. This coincides with what is observed when stunting rates are disaggregated by age (as in ). The pattern is robust across all six model specifications. In the older age group of children, however, age loses its significance. Sex of the child appears to play no role in HAZ outcomes of children under two in Nepal, as the point estimate is consistently not statistically different from zero. However, the probability of stunting significantly increases for female children over 24 months old. The number of vaccines the child has received has a significant and positive correlation with HAZ and a negative and significant correlation with the probability of stunting across both age groups, with the exception of reducing stunting in children under two. Immunisations provide interventions to infectious diseases that, if contracted at a young age, could negatively impact a child’s future growth. Each additional vaccine is correlated with a 0.02 and 0.03 standard deviation increase in HAZ for the older and younger age groups, respectively. We note, however, that vaccines, per se, may not be the causal mechanism at play: the number of vaccines received may be a proxy for a number of unobserved factors, including the intensity or quality of health services and interventions in the child’s location, or general levels of parental care.
With respect to the education of the mother and father, we find maternal education to be a strong and robust predictor of HAZ and stunting in both subsamples. While the coefficient on father’s education is also positive, it is not significantly different from 0 in the long regressions. The importance of maternal education can be influenced by gender roles in the household as well as socio-economic and other conditions (Frost, Forste, & Haas, Citation2005; Reed, Habicht, & Niameogo, Citation1996), and has sometimes been considered a proxy for the socio-economic status of the household (Desai & Alva, Citation1998). For example, women with higher levels of education also tend to have higher household incomes, live in more urban areas, and have access to better medical facilities. However, even controlling for these aspects of the household, mother’s education has frequently been found to have a strong role in influencing the nutrition outcomes of children, which Thomas, Strauss, and Henriques (Citation1991) argue works primarily through the effect of education on improved access to health and nutrition information. Our regressions also underscore a strong and robust correlation between mother’s education and child health, even after controlling for a number of additional socio-economic factors including income, assets and place of residency. We can safely assert, therefore, that the estimated impact of maternal education in this sample is probably not overestimated due to omitted variable bias.
Among household indicators, income is strongly correlated with increases in HAZ and, to a lesser extent, reductions in the probability of stunting, but this pattern holds only for the sample of children under two years of age. Relative to households in the lowest income quintile, children in the younger age group and in all higher income quintiles have higher HAZ. The incremental change is largest when moving from the lowest income quintile into the second income quintile. Whether a household has a flush toilet is an indicator of adequate sanitation, but may also be regarded as a socio-economic indicator. Relative to children from homes which have no toilet, access to a flush toilet significantly improves HAZ across age groups, but only when agricultural characteristics remain unaccounted for. The probability of stunting decreases in the long regression, but only for the older age group. The negative coefficients on piped and well water, while exhibiting weak correlations, may be reflecting potential shortcomings with the potability of water from covered sources. In general, results suggest that access to safe water and proper sanitation facilities have an important role to play in ensuring a child’s long term health. Children under 24 months and residing in a female-headed household have higher average HAZ than children in male-headed households by roughly a third of a standard deviation. Controlling for these factors, characteristics of the household such as age of the head, the household dependency ratio and father’s education appear to have little independent or joint influence in determining nutrition outcomes for children in the sample.
Turning to the agricultural production characteristics, our key variables of interest, we note that farm size, which is widely regarded as an indicator of well-being and agricultural capacity has no significant correlation with average growth outcomes. The amount of land used for agriculture, though eventually a binding constraint for total output, says little about the intensity of land use. Instead, we find that overall agricultural yields (output per hectare) provide a better measure of resource intensity and efficiency of production. The household’s annual agricultural yield has a positive and significant correlation with HAZ and negative and significant correlation with the probability of stunting, but only for children over two years old. Moreover, the magnitude of the association is relatively small. A one ton/ha increase in yield is associated with a 0.07 standard deviation increase in HAZ and a reduction in the probability of stunting of roughly two percentage points.
Results for our measure of own consumption, that is, the proportion of food consumed that is produced by the household itself, are mixed.Footnote4 The point estimate is not significant in the HAZ regression (Model 3) or the stunting regression (Model 6) for children under two. However, it is significantly different from zero in both regressions for the older age group. An increase in the ratio is associated with a 19 percentage point increase in the probability of stunting and reduction in HAZ of more than half a standard deviation. This reflects a pattern in which a high degree of subsistence orientation puts children at a nutritional disadvantage. Alternatively, it may signal that access to and reliance on markets improves long-run household food security.Footnote5 The ratio of the value of crops sold to crops harvested is included in the regression in an attempt to provide an indicator of the degree of agricultural commercialisation in a household. Regression results reveal a positive and significant association between this ratio and HAZ (Model 3), but only for the younger age group. No significant relationship is seen between the ratio and the probability of stunting in either age group. The low sample average of the ratio of crops sold to harvested, 10 per cent, may reflect sales of low-value crops such as cereals rather than higher-value crops. Within sample, the result could also indicate that non-agricultural income or income from non-crop agricultural production (for example, sale of livestock) may be more closely linked to nutrition. It may further reflect the fact that, at the national level, rates of commercialisation remain low. Small percentages of aggregate output are actually traded in most markets, and a large majority of farmers in Nepal remain subsistence-oriented.
The composition of agricultural production can directly influence the availability and quality of food in the household. Regression results show that there is no significant relationship between a household’s total agricultural diversity and either HAZ or stunting. Although a close examination of the composition of diversity should help shed light on the specific crops which have the most potential for reducing stunting outcomes, we find significant correlations with stunting only for the share of vegetables (among children younger than 24 months) and roots (among children older than 24 months), both of which are associated with lower probabilities of stunting. It is important to underscore the differences in shares of vegetables in crop diversity among subgroups of the sample. In we see that shares of vegetables remain relatively constant among quintiles at roughly 30 per cent of total crop diversity. When comparing households participating in the market to those not participating, however, the only crop group in which the mean share in total crop diversity is not statistically different across groups is vegetables. This highlights the potential benefits across all income quintiles of increases in on-farm production of vegetables, regardless of the degree of market participation. Our indicator for production of protein is not helpful in explaining HAZ patterns in the older age group.Footnote6
To measure whether the relationship between crop diversity and a child’s long-term nutrition is different for children of mothers with primary or secondary education and those with mothers who have no education, we include an interaction term between these two variables. Results from Models 3 and 6 suggest that mother’s education is positively correlated with nutritional status, even when controlling for a household’s crop diversity. The positive coefficients on both crop diversity and education of the mother in Models 3 and 6 in the older age group and Model 3 in the younger age group relay that both factors contribute to increases in HAZ, albeit not at statistically significant levels. When the variables are combined, the point estimate for the interaction term is significant and the sign is negative. While this suggests some degree of substitution between a mother’s education and the household’s crop diversity, at least in statistical terms, the finding should not be over-interpreted. One possible explanation is that educated mothers are more aware of the nutritional requirements of their children and supplement poor diversity of agricultural production with more diversified food purchases from local markets, a possibility that seems to warrant further study.
6. Conclusions
This study contributes to our understanding of the observed correlations between measures of agriculture and human nutrition. Regression results based on 2010/2011 data from 1,769 children under age five highlight the role of household agricultural production characteristics, and their varied importance depending on the age of the child, in increasing HAZ and reducing the probability of stunting. Specifically, in children above the age of 24 months, increases in overall yields are associated with significant improvements in HAZ and decreased probabilities of stunting. On the other hand, higher ratios of own-consumption are associated with lower HAZ and increased probabilities of stunting. With respect to specific crop groups, higher shares of roots are correlated with reductions in the probability of stunting, while the production of animal products improves HAZ by nearly a quarter of a standard deviation. In the younger group, fewer agricultural variables are statistically significant. Increases in vegetable and root production are associated with decreases in the probability of stunting in children younger than 24 months and those older than 24 months respectively. We find a small positive association between the degree of commercial market-orientation of households and child HAZ, but only among children below the age of 24 months. From a policy perspective, our findings suggest that efforts to strengthen agricultural diversification and overall performance will be beneficial to children, and that efforts to promote commercialisation, at least to the limited extent observed in this sample, are not likely to have large impacts, positive or negative, on nutritional outcomes.
While specific characteristics of agricultural production have been shown to have positive associations with long-term nutrition outcomes, more research is needed to identify the precise nutritional benefits of household crop composition. This could be done, for example, by assessing the nutritional value of harvests in terms of calories or specific micronutrients, rather than the weight or share of crops in total agricultural diversity. Moreover, our analysis suggests a number of positive associations between the agricultural characteristics of households and child growth, but does not identify the causal pathways that might connect agricultural opportunities, choices and constraints to specific nutritional outcomes. Of course, such causal pathways will be of utmost interest to policy-makers, who must weigh efforts to promote specific crops, encourage market participation, or foster agricultural commercialisation. Research designed to isolate specific relationships between agricultural activities and nutritional outcomes of household members will need to confront the substantial empirical difficulty of establishing causality in a large sample, especially when underlying impacts and effects are likely to be heterogeneous and shaped by local conditions.
Acknowledgements
Support was provided by the Feed the Future Nutrition Innovation Lab, which is funded by the United States Agency for International Development.
Disclosure statement
No potential conflict of interest was reported by the author(s).
Additional information
Funding
Notes
1. We focus on children from agricultural households (both rural and urban) and therefore include only children from homes with crop yields greater than 0 in the most recent cropping season. We exclude 32 children with Z-scores outside the WHO recommended cutoff of −6/+6 and also exclude 17 children from households with non-agricultural income in excess of 1 million NPR (approx. 11,600 USD).
2. Some readers may be concerned about potential endogeneity arising from correlation between of our independent variables and the error terms in the regressions. Although an instrumental variables (IV) approach is often preferred in these settings, we face an inherent difficulty in trying to pursue an IV approach, since this requires at least as many valid instruments as potentially troublesome regressors. We chose to use OLS since the use of invalid instruments can lead to results that are even more biased than OLS and because the use of weak instruments does not necessarily overcome the potential bias of OLS and can also mislead one regarding the size of standard errors (Murray Citation2006). Our view is that any potential endogeneity between the growth of children under age five and decisions about crops and crop sales is likely to be very small.
3. Our measures of yield, diversity and production and sales ratios focus on edible crops and exclude cash crops such as tobacco, tea and spices. This may underestimate overall agricultural diversity, but we wish to maintain an emphasis on crop diversity that may translate directly into dietary diversity.
4. We computed a correlation matrix for key right-hand-side variables related to our agriculture measures. None of the estimated correlations are greater than 0.50 in absolute value and most are less than 0.15. For own-consumption and sold-ratio (a pairing highlighted by a referee), the pairwise correlation is 0.12 (t = 5.03). We do not believe multicollinearity is a noteworthy problem in these regressions.
5. Disaggregating the own-consumption variable into specific food groups (for example, the ratio of own-consumption of vegetables to total vegetable consumption) could possibly provide a more accurate indicator of how nutrition responds to household production. However, these disaggregated measures would likely provide little additional explanatory power beyond the variables measuring shares of food groups in crop diversity, which we also include in Models 3 and 6.
6. The construction of the diversity indicator gives a household which only produces eggs the same value as a household which produces eggs, milk, and meat. There is thus the potential that the variable is an imprecise indicator of protein availability in the household.
References
- Allendorf, K. (2007). Do women’s land rights promote empowerment and child health in Nepal? World Development, 35, 1975–1988. doi:https://doi.org/10.1016/j.worlddev.2006.12.005
- Arimond, M., & Ruel, M. T. (2004). Dietary diversity is associated with child nutritional status: Evidence from 11 demographic and health surveys. Journal of Nutrition, 143, 2579–2585.
- Bonnard, P. (1999). Increasing the nutritional impacts of agricultural interventions. Washington, DC: Academy for International Development.
- Central Bureau of Statistics [CBS]. (2011). Nepal living standards survey 2010/2011. Kathmandu: Central Bureau of Statistics.
- Desai, S., & Alva, S. (1998). Maternal education and child health: Is there a strong causal relationship? Demography, 35(1), 71–81. doi:https://doi.org/10.2307/3004028
- Frost, M. B., Forste, R., & Haas, D. W. (2005). Maternal education and child nutritional status in Bolivia: Finding the links. Social Science and Medicine, 60, 395–407. doi:https://doi.org/10.1016/j.socscimed.2004.05.010
- Habicht, J. P., Martorell, R., Yarbrough, C., Malina, R. M., & Klein, R. E. (1974). Height and weight standards for preschool children how relevant are ethnic differences in growth potential? The Lancet, 303, 611–615. doi:https://doi.org/10.1016/S0140-6736(74)92663-4
- Haddad, L. (2013). From nutrition plus to nutrition driven: How to realize the elusive potential of agriculture for nutrition? Food and Nutrition Bulletin, 34(1), 39–44.
- Jones, A. D., Agudo, Y. C., Galway, L., Bentley, J., & Pinstrup-Andersen, P. (2012). Heavy agricultural workloads and low crop diversity are strong barriers to improving child feeding practices in the Bolivian Andes. Social Science and Medicine, 75, 1673–1684. doi:https://doi.org/10.1016/j.socscimed.2012.06.025
- Levine, N. E. (1988). Women’s work and infant feeding: A case from rural Nepal. Ethnology, 27, 231–251. doi:https://doi.org/10.2307/3773519
- Martorell, R., Khan, K. L., & Schroeder, D. G. (1994). Reversibility of stunting Epidemiological findings in children from developing countries. European Journal of Clinical Nutrition, 48, S45–S57.
- Murray, M. (2006). Avoiding invalid instruments and coping with weak instruments. Journal of Economic Perspectives, 20(4), 111–132. doi: https://doi.org/10.1257/089533006780387373
- National Planning Commission [NPC]. (2010). The food security atlas of Nepal. Kathmandu, Nepal: Food Security Monitoring Task Force, National Planning Commission, Government of Nepal.
- Paolisso, M. J., Hallman, K., Haddad, L., & Regmi, S. (2002). Does cash crop adoption detract from child care provision? Evidence from rural Nepal. Economic Development and Cultural Change, 50, 313–338. doi:https://doi.org/10.1086/322881
- Puffer, R. R., & Serrano, C. V. (1973). Patterns of mortality in childhood. Washington, DC: World Health Organization.
- Reed, B. A., Habicht, J.-P., & Niameogo, C. (1996). The effects of maternal education on child nutritional status depend on socio-environmental conditions. International Journal of Epidemiology, 25, 585–592. doi:https://doi.org/10.1093/ije/25.3.585
- Shively, G., Gars, J., & Sununtnasuk, C. (2011). A review of food security and human nutrition issues in Nepal (Staff Paper Series No. 11-05). West Lafayette, IN: Purdue University Department of Agricultural Economics.
- Thomas, D., Strauss, J., & Henriques, M.-H. (1991). How Does mother’s education affect child height? The Journal of Human Resources, 26, 183–211. doi:https://doi.org/10.2307/145920
- Tiwari, K. R., Nyborg, I. L. P., Sitaula, B. K., & Paudel, G. S. (2008). Analysis of the sustainability of upland farming systems in the middle mountains region of Nepal. International Journal of Agricultural Sustainability, 6, 289–306. doi:https://doi.org/10.3763/ijas.2008.0390
- von Braun, J. (1995). Agricultural commercialization: Impacts on income and nutrition and implications for policy. Food Policy, 20, 187–202. doi:https://doi.org/10.1016/0306-9192(95)00013-5
- World Health Organization [WHO]. (2006). WHO child growth standards: Length/height-for-age, weight-for-age, weight-for-length, weight-for-height and body mass index-for-age: Methods and development. Geneva: WHO.