ABSTRACT
This article explores the fiscal effects of aid in Ethiopia using the Cointegrated Vector Auto-Regressive (CVAR) methodology to model complex long-run and short-run dynamics. We use national data for 1961–2010, including a measure of aid capturing flows through the budget as measured by the recipient. The data suggests three main conclusions on the long-run equilibrium. First, government long-term spending plans are based on domestic sources, treating aid as an additional source of revenue. Second, both grants and loans are positively related to tax revenue. Third, aid is positively associated with spending, with a particularly strong relation between capital expenditure and grants. Overall, our results show that aid in Ethiopia had beneficial fiscal effects.
1. Introduction
Aid effectiveness remains one of the areas of international debate most crucial to the development industry, yet still contended between supporters and critics. A large literature has focussed on establishing links between aid and growth, although this relation is likely to be complex and indirect. At least partly, this explains why the existing body of research fails to provide evidence that is fully conclusive.Footnote1 The need to ‘unpack’ aid effectiveness has led scholars to focus on the channels through which aid may have a positive effect on growth and economic development. In this context, part of the literature has turned to the analysis of the fiscal effects of aid, as a prerequisite to understanding broader macroeconomic effects of aid. Since a substantial portion of aid flows through governments’ budgets, it can affect fiscal aggregates such as taxes and public expenditure. In particular, tax revenues remain the main source of development financing in most developing countries. Therefore, if foreign aid discourages tax revenue mobilisation, not only its effectiveness but also its longer-term sustainability would be undermined. The main focus of this article is the effect of aid on taxation, although other key fiscal variables are also included and discussed.
The empirical literature on the relation between aid and tax has been largely dominated by cross-country studies from the tax effort tradition. Aid is typically disaggregated into grants and loans, to test the hypothesis supported by some scholars (Benedek, Crivelli, Gupta, Muthoora, Citation2012; Gupta, Clemens, Pivovarsky, & Tiongson, Citation2004) that grants have a negative effect on taxes while loans have a positive one, due to the need for repayment. However, recent studiesFootnote2 tend to provide no support for a crowding out effect of aid, with both grants and loans having a positive or no relation with tax revenues. While these studies are very useful in highlighting the general trends, they suffer from a number of drawbacks. Firstly, they are typically based on single equation models that impose restrictive assumptions on endogeneity. While efforts have been made to address this issue with instrumental variables, these studies remain vulnerable to endogeneity. Secondly, the cross-country literature suffers from limitations due to the heterogeneity in the effect of aid amongst countries. Carter (Citation2013) argues that due to this heterogeneity, estimates of averaged effects are unstable and of limited policy interest. Finally, tax effort studies typically focus only on taxation, thus excluding other fiscal variables and intra-budget dynamics. Partly because of these limitations, the cross-country tax effort literature is still divided on whether aid is positively or negatively associated with tax revenues.
A related strand of literature focuses on the fiscal response to aid at the country level and is based on the seminal work of Heller (Citation1975). This framework stems from the maximisation of the government’s utility function, represented by deviations of actual fiscal aggregates from target levels. Therefore, fiscal response studies can obviously overcome the problems due to country heterogeneity, in addition to taking into account broader budget dynamics. Moreover, by focussing on individual countries, they can potentially dig deeper into the local context and complement the econometric results with a sound understanding of the country’s political economy. In this context, the work of Franco-Rodriguez, McGillivray, and Morrissey (Citation1998) has the important merit of having explicitly introduced endogenous aid in the fiscal response framework, therefore addressing another key drawback of the previous literature.
This field has then developed to introduce methods from the ‘macroeconometric’ literature to study fiscal dynamics. In particular, Osei, Morrissey, and Lloyd (Citation2005) adopted the Cointegrated Vector Auto Regressive (CVAR) method to study the relation between aid and fiscal aggregates in Ghana. The CVAR approach has several methodological advantages over earlier fiscal response studies. Most notably, it does not require the estimation of targets for fiscal variables, which is one of the key limitations of the previous literature.Footnote3 More generally, the CVAR does not require any a priori assumptions, but rather it allows data to speak freely, to discriminate between competing hypotheses or theories. As far as the key results are concerned, this literature generally supports aid effectiveness by showing that it triggers beneficial responses from fiscal policy. For example, Osei et al. (Citation2005) show that aid in Ghana is associated with increased tax revenues and decreased borrowing, resulting in increased spending and an improved fiscal balance. Beneficial policy responses are confirmed in other CVAR studies, which also fail to find support for the tax discouragement hypothesis (Bwire, Morrissey, & Lloyd, Citation2017; Martins, Citation2010). However, the debate on the fiscal effects of aid remains open.Footnote4
This article contributes to this growing literature by adding empirical evidence on beneficial fiscal effects of aid in Ethiopia. By using a unique dataset of national data, it estimates two CVAR models including the following variables: government expenditure, disaggregated into recurrent and capital spending components; domestic revenues, disaggregated into tax revenue and non-tax revenue; and aid, disaggregated into grants and loans. Recognising that CVAR is highly demanding of the data, each model includes a maximum of five variables. The primary model follows our key interest in whether aid has any adverse effects on tax revenue. It therefore focuses on disaggregated aid and revenue variables, while government spending is kept aggregated. The alternative model then looks in more detail at the relationship between aid and public expenditure by disaggregating the latter into the capital and recurrent components, but aggregating government revenue. This alternative system thus aims at shedding light on what aid is actually funding, in addition to providing a robustness test for some key results from the primary model. The use of national data is especially relevant for the analysis of fiscal dynamics as it captures the proportion of aid channelled through the budget. This aid component and its variation differ substantially from the aid data in OECD Development Assistance Committee (DAC) database (see Section 4).
This article is related particularly to two studies on Ethiopia by Gebregziabher (Citation2014) and Martins (Citation2010). Gebregziabher (Citation2014) analyses broader macroeconomic effects of aid to Ethiopia, demonstrating that it positively affects GDP, investment, and imports. However, while the author demonstrates that aid is negatively associated with government consumption, the insights into the fiscal effects of aid are limited as no other fiscal variable is included in the model. Thus, this study does not address the effects of aid on tax revenue, among other fiscal dynamics. It has been argued that the study of the fiscal effects of aid can be considered a prerequisite for the analysis of its macroeconomic effectiveness (Lloyd, McGillivray, Morrissey, & Opoku-Afari, Citation2009; McGillivray & Morrissey, Citation2000), thus our study is highly complementary to Gebregziabher (Citation2014) in analysing this additional channel of aid effectiveness. Furthermore, unlike Gebregziabher (Citation2014), we use exclusively national data, including aid data. While OECD DAC data captures the aid components beyond budget aid that may affect macroeconomic variables, for the analysis of fiscal dynamics the recipient’s measure is more appropriate (see more detailed discussion in Section 4).
Martins (Citation2010) explores fiscal dynamics in Ethiopia using the CVAR framework, using quarterly data from 1993 to 2008. While our results are largely consistent with his study, our analysis departs from it in three important ways. Firstly, we favour annual data over quarterly data. While quarterly data inflates the sample size, it was only compiled rigorously after the introduction of the Protection of Basic Services (PBS) project in 2005, when donors became more careful about monitoring and reporting. Moreover, budget decisions are taken annually in both donor and recipient countries and intra-year dynamics do not necessarily add relevant information. Secondly, by using annual data, we can consider a much longer period of time: 50 years as opposed to the 15 considered in Martins (Citation2010). Not only this timeframe seems more suitable to analyse long-term dynamics; it also allows us to test an additional hypothesis about the continuity of fiscal dynamics across different regimes that cannot be tested with the quarterly data, since it only covers a period of relative political stability. By doing this, and in contrast with Martins (Citation2010), we find evidence of a domestic budget equilibrium that is valid across periods, partly supporting the continuity hypothesis (more details in Section 6). Thirdly, we make fuller use of the case study setting by complementing the econometric analysis with deeper qualitative information about Ethiopia, both to verify the quantitative data and to guide model specification. These data choices are discussed in more detail in Section 4.
The paper is structured as follows: Section 2 introduces the fiscal effects of aid; Section 3 provides some relevant elements of Ethiopian fiscal history and political economy; Section 4 introduces the Ethiopian data. Section 5 presents the model specification and the supporting tests. Section 6 discusses the long-run and short-run results, focusing mainly on the primary model. The results for the alternative system specification, where total expenditure is disaggregated into recurrent and capital, are provided in Section 6.1. Section 7 concludes.
2. The fiscal effects of aid
Although the CVAR framework is atheoretical, a simple government budget identity can be helpful to disentangle the possible fiscal effects of aid, which are to be tested in the empirical model. The basic accounting identity of the budget simply states that all revenues and borrowing must equal all expenditures:
where TAX denotes tax revenue, NTAX is non-tax revenue, LOANS are foreign aid loans, GRANTS denote foreign aid grants, BORROW is domestic (and foreign non-concessional) borrowing, and CAPEXP and RECEXP represent respectively the government’s capital and recurrent expenditures. Given the fact that aid loans are often highly concessional and linked to conditionality, BORROW could be considered as the borrowing of last resort. Based on this reasoning, the budget balance equation can be rewritten as:
where, for simplicity, all variables are aggregated: total domestic revenue (DOMREV), total government expenditure (TEXP), and aid (AID). Viewing borrowing as a residual decision allows us to regard it as a potentially stationary process, which is supported by the Ethiopian data, and therefore focus our hypothesis testing on interactions between the remaining variables.
Although the accounting identity is an intuitive departure point, from which various intra-budget dynamics can be analysed, it only represents a conceptual framework and it is not the basis of the empirical investigation. There are two reasons for this. The first one is purely statistical: as discussed in Section 5, our data supports the presence of three cointegrating relations, rather than just one reflecting the budget identity. Although estimating the budget identity could have the advantage of allowing the estimation of budget shares, this would not be possible in our case because our data is transformed in logs (see Section 4). The second, and perhaps more important reason, is of an economic nature. While the budget identity of Equation (2) represents in a compact way all fiscal dynamics, each one of them has been analysed extensively in separate strands of literature. For example, the tax effort literature focus on the aid-tax relation (crowding out or encouragement), fungibility studies on the link between aid and expenditure (fungibility or aid illusion), and yet other studies have looked at aid volatility and unpredictability as compared to domestic revenue as a more stable source of financing for government spending.Footnote5 Therefore, we can formulate three separate hypotheses, as detailed below, that speak directly to these separate but related literatures, while all stemming from Equation (2).
Firstly, aid can influence tax revenue. Several competing hypotheses can be formed about this potential relationship. Foreign aid may provide a politically cheaper source of revenue than taxation, and therefore discourage tax effort. This argument, in theory, is stronger for grants than for loans, because the latter requires future repayments. On the other hand, aid may have a positive effect on tax revenue by expanding the tax base, through its effect on income, by strengthening tax administration, or by supporting tax policy reform. If the positive effects prevail, we would expect aid and tax to exhibit a positive long-run association. Morrissey and Torrance (Citation2015) provide a more detailed discussion on alternative dynamics.
Secondly, we explore empirically the specification of the budget equilibrium equation. In particular, we investigate whether such equilibrium includes only domestic variables or if it requires aid to achieve balance in the long-run. The existence of a domestic equilibrium would imply that the government makes long-term plans based on domestic resources, with aid as an addition to this pre-existing long-run relation. The question of whether aid is part of the budget process or if it is rather an external source of financing that relaxes an existing domestic budget constraint is also closely related to the issue of exogeneity, which is discussed throughout the paper. This issue is also relevant in the context of aid volatility and predictability, which make it harder for governments to take aid into account in their spending plans and therefore to make it part of the long-run budget equilibrium.
Thirdly, we can expect a positive relation between aid and expenditure. We provide only initial indications on aid fungibility, but we do not delve into this aspect in detail given the limited availability of information on whether aid was earmarked for a particular sector or government spending component; as well as the contentious issue of what is a ‘good’ way to spend aid money.Footnote6 Our focus is to test which variable – aid or government expenditure – adjusts to the other if they form a long-run equilibrium, and which spending component bears a stronger association with aid.
In addition to these core hypotheses, we acknowledge that aid may not all be spent as additional public expenditure, but also be used to decrease borrowing. Since aid relaxes domestic budget constraints (that is, the budget identity excluding aid variables), the government could achieve the same level of expenditure with less borrowing. However, as we do not have the full series on domestic borrowing (see Section 4), we are unable to test for this potential fiscal effect of aid and we will treat borrowing as a residual item.
Therefore, while a single budget equation may imply a single long-term equilibrium, these three relationships would describe the inter-variable dynamics of Equation (2) as a joint system of three cointegrating relationships. These relationships are expected to form a stationary system, with borrowing – the excluded variable – representing a stationary (adjusting) process. In a five variable system, this would imply two common trends driving the system (see Section 6). From an economic point of view, we can interpret these two trends as broadly representing the domestic agenda and the donor, aid-driven process.
3. Aid and fiscal policy in Ethiopia
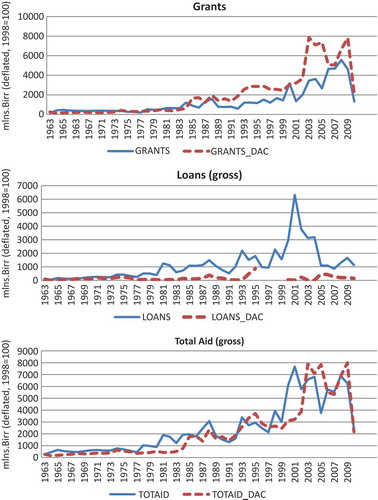
Understanding the historical, economic and political contextFootnote7 is not only important to put the results in context, but also to shed some light on the sources of possible econometric problems, such as structural breaks. During the period considered, Ethiopia experienced the succession of three different regimes: the Imperial rule of Haile Selassie until 1974, the socialist regime known as Derg from 1974 until 1991, and the Ethiopian People’s Revolutionary Democratic Front (EPRDF) from 1991 until today. These regime changes can be identified in the graphs reported in (which, for readability, depicts the data as proportion of GDP)Footnote8 and indeed they implied radical changes in policy. However, experts of Ethiopian history have argued that, despite these differences, successive Ethiopian governments show a great degree of continuity in terms of administrative structure and political culture (Abbink, Citation2011; Clapham, Citation1988).
Figure 1. Key aggregate and disaggregated variables.
In the feudal structure of the Imperial rule, tax revenues were largely coming from trade and indirect taxation. Sustained revenue mobilisation during this period was mainly driven by the country’s reconstruction efforts after the Italian invasion of 1936–1941, which implied the expansion of the military and civilian bureaucracies. Development planning was a central issue in the international debate in the 1950s and Ethiopia was well part of it, by implementing a succession of five-year development plans starting from 1958. Importantly, while these development plans relied partly on foreign aid, they recognised explicitly the importance of tax revenue as a major source of development financing. Partly due to Ethiopia’s unique independence from colonial powers, aid flows were relatively low, with loans and grants contributing about a fifth of total expenditure on average. Although the United States was a key ally and donor, Ethiopia could also turn for assistance to other European countries and the Soviet Union, as well as multilateral organisations such as the World Bank and the UN. Already in the Imperial period, Ethiopia was receiving advice on taxation through missions from the UN, the World Bank and the United States, amongst others.
After the 1974 socialist revolution and the establishment of the military junta (Derg), state expenditure grew increasingly imbalanced with the growth of the economy. The continuity with the Imperial regime became increasingly clear, particularly in terms of a strong state, repressive political apparatus and lack of independent institutions. Domestic revenue mobilisation remained a priority, as under the Imperial rule. Tax policy during the Derg era mainly relied on direct taxation with high marginal rates, agricultural taxation, and trade taxes. Although initially increasing, tax revenue eventually declined, mainly due to poor economic policies resulting in a shrinking tax base. In the context of the Cold War, American aid was fully withdrawn from Ethiopia by 1977, except its humanitarian component. The USSR became the most influential foreign actor, although Western donors remained engaged with Ethiopia through both aid and trade. For example, Ethiopia was part of the Lomé agreement signed in 1975 with the European community, and thus a substantial fraction of aid was still Western. The last years of the Derg regime (1989–1991) were characterised by a deteriorating economic, military, and political situation in the country, as a decade of poor economic policies resulted in economic crisis, accompanied by a fiscal collapse that appears clearly in .
Coming to power in 1991 after 16 years of armed struggle, the EPRDF embarked upon comprehensive liberalisation and privatisation programmes with the support of the International Financial Institutions. The fiscal situation improved quickly after the fiscal collapse of the Derg, with revenues increasing and the deficit decreasing. These significant improvements in fiscal policy were partly due to the very low level of tax collection in the last years of the Derg, which was relatively easily reversed, as well as the fact that by the early 1990s, the EPRDF already had effective control of many regions in Ethiopia where the Derg’s authority no longer reached. Moreover, the dismantlement of the massive Derg military apparatus decreased expenditures substantially, contributing to decreasing deficit. Western donors supported these efforts, especially through Structural Adjustment Programmes (SAPs) in the 1990s. Budget aid to Ethiopia increased substantially and consistently during the EPRDF period, with Ethiopia now being considered an ‘aid darling’. However, general budget support was withdrawn in the aftermath of the 2005 election, which led to increasing tensions between donors and the government. Despite these tensions, aid resumed shortly after its withdrawal through the Protection of Basic Services (PBS) project, which is also channelled through the budget. Both grants and loans each averaged about 3 per cent of GDP during the period, and aid dependency (expressed as total budget aid as a proportion of government expenditure) increased to about 28 per cent. However, aid remains a more volatile source of revenue than taxation and is generally seen as unsustainable for long-term planning. The IMF, along with other donors, played a crucial role in supporting the two main tax reforms of 2002 and 2008. Particularly in recent years, Ethiopia had a strong economic performance that has been largely driven by public investment, in the context of the developmental state approach. Perhaps encouraged by this strong economic performance, aid grants have consistently increased under the EPRDF, apart from the period of the war with Eritrea around the turn of the century.
The Ethiopian context, besides providing background on the data-generating environment, has important implications for our hypotheses. For example, the importance that independence from colonial powers has in national pride is reflected in fiscal terms in the priority given to tax revenue mobilisation over aid. This would make a substitution effect between aid and tax more unlikely than in other contexts. Moreover, the elements of continuity in successive governments support the validity of some of our long-term relations, particularly as regards domestic budget balance. Finally, it should be noted that, while tensions with donors have occurred in recent years, Ethiopia is still considered a country where great progress has been made and where donors can get ‘good value for money’.Footnote9 Importantly, Ethiopia has historically been of great strategic interest in the geopolitical landscape, for different reasons under the successive regimes.Footnote10 This made it particularly attractive for many donors, quite independently from fiscal performance.
4. Data
To test our hypotheses in the CVAR framework, we use annual time series data from Ethiopia covering the period 1961–2010. Although quarterly data would be available in principle, as used in Martins (Citation2010), extensive interviews with government and donor officials revealed that this data can only be considered suitable for analysis for the past decade. This information is mostly compiled for intra-year reporting to donors, but decisions on the budget are still taken annually. Therefore, we do not believe this data can offer sufficient additional insights to compensate for its lower quality and relevance. However, as a robustness test, our results are compared to those of Martins (Citation2010) throughout the paper. Importantly, using annual data allows us to consider a long period of 50 years and to test important hypotheses on the continuity of budget dynamics across regimes, which could not be tested in Martins (Citation2010) because the quarterly series starts in 1993.
Not only is this a longer annual series than other studies in this literature, but we would also argue that is of better quality. Due to its independence from colonial powers, Ethiopia has a longer experience of national government than other countries in Africa. By the time the Central Statistical Office was created in 1961, the country already had a well-established tradition of data collection, with modern fiscal records dating back to 1949. In fact, Ethiopia – together with South Africa – has the highest Statistical Capacity Rating in Africa (OECD and African Economic Outlook, Citation2010). Data quality and a relatively larger sample size are particularly important in the context of the CVAR framework that is highly reliant on the data. While the data are of generally good quality, the quantitative information was reviewed during an extensive interview process including with staff from the Ministry of Finance and Economic Development (MOFED). Such qualitative information contributed to improving data quality and consistency across the period, making the data comparable across the three regimes.
Our dataset was compiled exclusively on the basis of data from MOFED. Our choice to use national data has several advantages. Firstly, the data series are consistent as they come from a single source, and thus avoid introducing conversions or adjustments that may be necessary in international datasets. Secondly, it is the data used for government decision-making and is therefore relevant from a policy perspective. Finally – and crucially – it includes a measure of aid that represents the portion that goes through the government’s budget and that the government is fully aware of. As such, it is the most relevant measure for capturing its effects on fiscal dynamics. Importantly, the donor and recipient data on aid inflows differ substantially (see ). In fact, they do not even co-vary sufficiently to yield consistent adjustment behaviour.Footnote11 Note that our measure of budget aid includes not only budget support, but also other sources of aid that flow through the budget, such as PBS. While only budget aid is considered, the national data allows us to further disaggregate it into grants and loans. Such disaggregation is in line with most of this literature. However, it should be noted that other researchers have disaggregated aid along additional dimensions. For example Mavrotas (Citation2005) proposes a disaggregation of aid modalities into project aid, programme aid, technical assistance and food aid. While this alternative disaggregation is certainly valuable, we would argue that identifying aid that flows through the budget is a distinctive advantage when analysing fiscal response. Budget aid, regardless of whether it is strictly a project (like PBS) or pure budget support, is likely to be the closest substitute for tax revenues and therefore the most relevant component for our analysis.
When disaggregating public expenditure into its capital and recurrent components, we maintain the government’s original classification without any further manipulation. While it is theoretically appealing to separate developmental expenditure from pure government consumption, as attempted in Martins (Citation2010), in practice it can be very difficult to credibly impute single expenditure items to either category. Large investments can hardly be effective in the long-run if they are not sustained by recurrent spending for operation and maintenance. Our choice is therefore to follow the government’s classification. All data is in levels, deflated by GDP deflator and transformed in logs to obtain a better model fit.
5. Specification of the model
In the VAR framework, each variable is modelled as endogenous, and is expressed as a function of past own values, as well as past realisations of other variables. The vector error-correction model (VECM) representation of the VAR includes the endogenous variables in levels () and (stationary) first differences (
), thus preserving both the long-run and short-run information in the data. The error correction form of the VAR (VECM) is represented by the following equation, with five endogenous variables in the vector xt: total public spending (texp), tax and nontax revenue and two forms of aid (grants and loans).
In Equation (3), is a
vector of endogenous variables, so that
is the number of variables included in the system;
is a vector of deterministic components (such as a constant and dummy variables) with a vector of coefficients
;
denotes the selected lag length; and
is a
vector of unobservable error terms, that are assumed to be
. VECM allows a clear separation between the long-run coefficients in
and the short-run coefficients in
. When cointegration exists,
has reduced rank
, where
is the number of cointegrating relations, and is defined as:
In Equation (4), and
are
matrices (with
),
defines the stationary long-run cointegrating relationships (
), and
denotes the adjustment coefficients to the equilibrium error. Based on this empirical framework, we performed a battery of model specification tests (reported in the Appendix). The choice of lag-length for our specified model is
, usually considered to be sufficient to model a rich dynamic structure of macroeconomic variables (Juselius, Citation2006, p. 72). The model includes an unrestricted constant, thus allowing for a non-zero mean in the cointegrating space and trends in levels of variables, but not in cointegrating relationships.Footnote12 Guided by testing, the political regime changes are modelled as shift dummies, allowing for mean changes in equilibrium relationships. The specified model fits the data well and satisfies the necessary conditions to model as a CVAR (Appendix ).
The determination of cointegration rank, , is crucial in the CVAR analysis, as it divides the data into
pulling and
pushing forces, corresponding respectively to equilibrium relations and common driving trends. The choice of cointegration rank can be a difficult decision in practice, especially in small samples. It is therefore preferable to consider additional information in addition to the formal testing procedure (Juselius, Citation2006, p. 131). The Johansen (trace) test is the formal test procedure and results are presented in (with simulated critical values for the likelihood ratio test). The small sample Bartlett corrections to the trace statistic (Johansen, Citation2002) ensures a correct test size. The uncorrected trace statistic suggests a rank of three
, while the Bartlett-corrected values may suggest a rank of two
but only with a borderline p-value of 0.062. Following the suggestion by Juselius (Citation2006, p. 145) that in small samples it is better to avoid choosing the rank based on small p-values close to the 5 per cent threshold,
is considered a safer option.
Table 1. Rank tests
Four additional pieces of information support the choice of as well as the economic interpretability of the results: the characteristic roots of the model, the t-values of the α coefficients of unrestricted VAR, the recursive graphs of the trace statistic, and the graphs of the cointegrating relations (see Appendix). The significant
coefficients in the third cointegrating relation of the unrestricted VAR suggest that important long-run information may be lost with
. We are therefore confident that
fits the data well. This choice is also confirmed by the parameter constancy tests of the model with
, which do not signal any problems.
In addition to being statistically valid, the choice on the rank of needs to be economically sensible. By choosing
, we are considering a system with three long-run equilibrium relations and two common driving trends
. Based on the conceptual discussion on the fiscal effects of aid in Section 2 and on the specific Ethiopian context outlined in Section 3, we believe this structure is sensible from an economic point of view, in addition to being statistically valid. On the one hand, the three long-run relations could correspond to the hypotheses presented in Section 2 and would be economically interpretable as: 1) a domestic budget equilibrium, which may or may not include aid; 2) a relationship between government spending and aid; 3) a relation between aid variables and tax revenue. On the other hand, the two common driving trends can be interpreted as the two parallel processes of domestic decision-making and the donors’ agenda. As discussed in Section 3, the strong leadership and ownership that characterise the relation between donors and the government in Ethiopia offers a solid grounding to argue for these two processes to be separate and exist in parallel. The following sections confirm the empirical validity of these hypotheses and estimate the respective coefficients.Footnote13
We perform a battery of tests on variable stationarity, long-run excludability, weak exogeneity, and pure adjustment, for the rank choice of three. The technical details and the results are provided in the Appendix. None of the variables can be accepted as stationary if the shift dummies are excluded. If the dummies are included, the stationarity of non-tax and loans cannot be rejected; this is likely due to the slicing of an already small sample. None of the variables of interest can be excluded. Tax revenue and loans are potentially weakly exogenous, but only at 10 per cent confidence level, while government spending can be confidently seen as purely adjusting. Interestingly, while we cannot assert with confidence that the aid variables are exogenous, the tests do not support the idea that they are purely endogenous to the system. The three expected relations are statistically valid for inclusion in the long-run structure ().Footnote14
6. Results and discussion
The long-run equations are based on the structure identified through the tests discussed in the previous section. The results for the long-run part of the CVAR are reported in . The coefficients describe the stationary long-run equilibrium relations, while the corresponding
coefficients describe the adjustment behaviour of the variables. Normalisation of the
vectors is always done on a significant variable. In addition to this statistical criterion, normalisation is also decided to ease economic interpretability. However, it is important to note that the results of the normalised beta should still be read as a vector and not as causal effects. The joint stationarity of the over-identified system is accepted with a p-value of 0.849. The Doornik-Hansen test suggests that the assumption of multivariate normality cannot be rejected. As non-concessional borrowing is excluded from the model, and because variables are log-transformed, the long-run coefficients cannot be simply interpreted as share coefficients.
Table 2. Long-run results
The first equilibrium relationship confirms the ‘internal domestic equilibrium’ hypothesis. Expenditure and revenues are positively related, so in the long-run government spending plans are based on the availability of domestic resources. As suggested by the coefficients in Alpha1, expenditure exhibits the strongest and most significant adjustment behaviour, although the coefficient on tax is of a similar magnitude, implying that in the long-run tax is also adjusting to equilibrium error. This is in line with a sensible expectation that the government has a larger margin on expenditure decisions, while revenue is not as easily adjusted in the short-to-medium term. This adjustment behaviour is largely consistent with the finding in Martins (Citation2010), although his specification of the budget equation also includes grants and loans. By estimating a purely domestic budget equilibrium, unlike Martins (Citation2010), we can show that foreign aid is not needed to balance the budget. This seems to be in line with his assertion that ‘the government uses their fiscal policy tools to make ends meet’ (p. 44), instead of using grants. However, given differences in specification, his results cannot directly speak to the question on the existence of a domestic budget equilibrium.Footnote15
Interestingly, the mean shift dummies can be excluded by the long-term domestic budget equilibrium without affecting stationarity of the system, indicating that this relationship holds across the three political regimes. This result supports the idea, suggested in Section 3, that the attitude towards domestic budget balance and fiscal independence is a common trait of all three regimes. This seems fully consistent with the Ethiopian context set out in Section 3 and largely in line with the arguments on continuity put forward by experts of Ethiopian history and political economy such as Clapham (Citation1988) and Abbink (Citation2011). This result also represents an additional contribution to Martins (Citation2010), where the continuity hypothesis could not be tested because of the shorter time period considered – despite its strong grounding in the Ethiopian context.
The second identified equilibrium relationship reveals a positive association between both aid components and government spending. Crucially, the vector Alpha2 indicates that aid – and not expenditure – adjusts to departures from this equilibrium. As noted also in Martins (Citation2010), such behaviour may suggest that donors may follow some ‘disbursement rule’ based on government spending, whilst government spending behaviour does not seem to be conditional on disbursement of aid. This is consistent with the idea that donors back and reward proven government commitment by increasing aid. The coefficients show that, for example, a 1 per cent increase in grants is associated with a 0.72 per cent increase in total expenditure. Given that the nominal amount of grants is substantially smaller than expenditure, these figures suggest that expenditure increases by more than the amount of grants. In addition to giving a first indication on the absence of fungibility, this is also consistent with a positive association between aid and tax. For example, at 2010 values, an increase in grants of 124 million ETB is associated with a 501 million ETB increase in total expenditure.
Thirdly, the identified long-run relationship between aid and taxation reveals no adverse effects of aid: both grants and loans are positively associated with tax revenue. Grants seem to be the most adjusting variable to departures from the equilibrium, although expenditure and non-tax revenue exhibit some adjustment too. This is consistent with the notion that donors support tax reforms by disbursing grants, potentially to relax some capacity constraints. The significance of the mean shift dummies when aid variables are included (in Beta2 and Beta3) indicates that aid behaviour and its relation with fiscal variables change across the different political regimes. Importantly, this is the first time this hypothesis is tested for Ethiopia in a CVAR framework, since Martins (Citation2010) only addressed the question of revenue displacement marginally. However, he shows no evidence of any discouragement and even suggests the possibility of a positive relation, which we indeed confirm here.
As far as the two regime dummies are concerned, their significance and the plausibility of their coefficients’ sign support their inclusion in the system. Interestingly, the dummies are needed particularly where the aid variables are included – indicating that this is where the main breaks are, rather than in the domestic relationships. In the aid-spending equation (Beta 2) the 1974 dummy is negative and significant, and the 1991 dummy is positive and significant. This indicates a shift upwards in the association between aid and spending once EPRDF came to power, with both variables registering higher levels than before. More interestingly, the 1991 dummy is positive, significant and large in the aid-tax relationship (1974 being non-significant and excluded altogether). This soundly reflects the changes in the variable relationships across regimes (justifying the inclusion of the dummies), stressing the convergence in donor and recipient government agenda for Ethiopia once EPRDF has come to power, with stronger revenue performance associated with higher aid.
Finally, keeping the identified long-run structure fixed, it is possible to test whether any variables are weakly exogenous. Aid loans could be accepted as weakly exogenous (p-value = 0.131) confirming previous results (), whilst weak exogeneity of tax is rejected (p-value = 0.049). The analysis on short-run dynamics and common driving trends is conducted without imposing any weak exogeneity conditions.
6.1. Alternative system with disaggregated expenditure
The alternative system is specified as follows: keeping aid flows disaggregated, we aggregate the domestic revenue variables (supported by the fact that they did not exhibit highly contrasting long-run behaviour) and disaggregate government expenditure into its capital and recurrent components. The structure of the deterministic terms is identical to that of the model above to ensure full comparability. The selected lag length is, and the choice of cointegration rank is
.Footnote16 For reasons of space, we focus on the long-run results only (see ), as the fit of the system is inferior to our main model, thus making the short-run specification weaker.
The first cointegrating vector mimics the previously identified domestic budget equilibrium: domestic revenue is positively associated with both components of government expenditure. Interestingly the relationship is stronger with capital expenditure, possibly indicating that the periods with ‘good’ government policies, targeting the collection of revenue, tend to be reflected in more capital (‘development’) spending. Recurrent spending is the single most adjusting variable to departures from this equilibrium. Vectors Beta2a and Beta3a roughly correspond to the second equilibrium in the previous model, with aid variables now related separately to capital and recurrent expenditure in order to identify any potentially differing effects. Both aid variables seem to be positively related to both components of government spending.
Grants seem to be more strongly associated with capital expenditure than loans, consistently with the findings in Martins (Citation2010). They are also the most adjusting variable in this equilibrium relation (Beta2a), potentially signalling that the donor disbursements reward particularly increments in ‘developmental’ spending. When donors and the government are in accordance on financing priorities, donors may back the commitment to increased domestic capital expenditures with more grants, rather than applying aid conditionality. Finally, the third equilibrium relationship (Beta3a) indicates a positive association between recurrent expenditure and both loans and grants. While some would argue this may point to ‘fungibility’ issues, our view is that some aid is indeed intended to fund recurrent spending components (such as health and education, see Gomanee, Morrissey, Mosley, & Verschoor, Citation2005).
The strong positive relation between grants and capital expenditure is consistent with other findings in the literature (Fagernas & Roberts, Citation2004; Fagernas & Shurich, Citation2004; Martins, Citation2010). On the one hand, this result may seem counter-intuitive. Indeed, it may be reasonable for loans to be more closely related to the more ‘productive’ capital expenditure, since they have to be repaid in the future. In practice, however, loans to Ethiopia are largely concessional, making repayment too distant and abstract to significantly affect policy decisions. On the other hand, grants may come with more conditionality, in the form of pressure to spend on ‘productive’ capital rather than recurrent (‘consumption’) expenditures, precisely because they do not require repayment. The idea that capital spending is preferable to recurrent expenditure may be slowly fading in the international debate. However, in historical perspective, this distinction may be behind the result of grants being mostly associated with capital expenditure. This suggests that donors back a commitment to increased domestic capital expenditure with grants.
6.2. Short-run results and common driving trends
The short-run equations are relations between
current variables
;
lagged variables
; and
lagged equilibrium errors,
, from the identified long-run structure. Importantly, the distinction between endogenous and exogenous variables may change short-run identification, whereas it did not change the long-run structure. Moreover, identification in the short-run requires uncorrelated residuals, whereas no such requirement exists in the long-run structure. In particular, uncorrelated residuals of a short-run model may be interpreted as estimated shocks, whilst large off-diagonal elements of the covariance matrix can be a signal of significant contemporaneous effects between the system variables or omitted variables (Juselius, Citation2006, p. 230).
As the identified short-run structure is heavily over-parameterised, with many insignificant coefficients, in this section we report a parsimonious system where the estimated coefficients with small t-statistics are set to zero. The 30 over-identifying restrictions were accepted with a p-value of 0.5. Since there are some non-negligible correlation coefficients in the residual covariance matrix (), the interpretation of the short-run equations as causal relationships, or reactions to structural shocks, should be taken with caution. The results are reported in .
Table 3. Short-run equations
The government expenditure equation shows a positive association with past changes of foreign grants and loans, albeit with limited magnitude. This may reflect government smoothing decisions in the face of volatile aid flows. The tax equation indicates that even in the short-run, aid is not inducing a reduction in tax revenue. This could indicate a positive effect of aid through income or imports in the short-run, as well as the possibility that aid is used to release short-term capacity constraints. Grants do not seem to react to any of the shocks in the short-run, consistent with the qualitative suggestion that aid may be issued for strategic considerations, or that donors take time to react to Ethiopia’s fiscal decisions. Finally, loans seem to be reduced in the face of higher tax revenues, which is plausible, as government’s need to borrow is reduced in periods of growing revenues.
As far as common driving trends are concerned, the results from the moving average (MA) representation should be taken as indicative at most ().Footnote17 This is due to the presence of residual cross-correlations discussed above and to insufficient evidence to substantiate weak exogeneity restrictions or pure adjustment. Therefore, the results are only mentioned briefly for completeness.
The empirical investigation of the two common trends in our system confirms their possible economic interpretation as representing the domestic and donors’ agendas. The first common trend seems to be mostly constructed from the unanticipated shocks to tax revenue, with a potential contribution from grants (see ). Shocks seem to most strongly affect the domestic fiscal variables but also grants, indicating support for potential donor response to tax mobilisation reforms. The second common trend is composed from shocks to aid variables, and loading to aid variables themselves, consistent to aid policy being fairly independent of fiscal dynamics. Shocks to government expenditure may be expected to have a persistent positive impact on expenditure itself, tax and non-tax revenue, and grants especially (). This may indicate that increments in the government expenditure that are sustained are eventually funded from domestic resources, or aid grants. Unanticipated shocks to tax revenue would have positive permanent effects on all domestic fiscal variables and grant aid.
7. Conclusions
This article presented an in-depth analysis of fiscal dynamics in Ethiopia using the CVAR methodology. It builds on other studies on aid effectiveness in Africa, and in Ethiopia in particular, while adding new insights to this literature. Using exclusively national data, we were able to avoid mixing data sources and to capture exactly the component of aid that is most relevant for the analysis of its fiscal effects. This represents an advantage with respect to other studies that used a combination of international sources of data, such as Gebregziabher (Citation2014). In particular, we complement the evidence from Gebregziabher (Citation2014), on beneficial macroeconomic effects of aid in Ethiopia, by showing that fiscal effects more specifically seem to be beneficial in the Ethiopian case. Our results are largely consistent with the fiscal response analysis of Martins (Citation2010), but with three important advantages. Firstly, our analysis is much more grounded in a deep knowledge of the Ethiopian context and political economy. Secondly, and thanks to this knowledge, we are able to formulate and test additional hypothesis that seem particularly relevant for the Ethiopian context – namely on continuity of fiscal behaviour across regimes and a deeper analysis of the aid-tax relation. Thirdly, we argue that annual data is of better quality and more suitable to analyse long-run relations.
Our strongest results refer to long-run dynamics, while they are weaker for the short-run and MA representation. Generally, we find that aid in Ethiopia has beneficial effects on fiscal policy. It does not seem to impair the long-term sustainability of the budget or domestic revenue mobilisation. More specifically, the analysis allows us to draw three main conclusions, focussing particularly on the long-run effects.
Firstly, we find no evidence of an adverse effect of aid on tax revenue, which implies that the government of Ethiopia is not substituting taxes with aid, nor has it been discouraged in its tax mobilisation efforts. On the contrary, we find a positive and robust relation between tax revenue and both grants and loans in the long-run. This paper is therefore in line with the existing fiscal response literature, showing beneficial effects of aid, and adds to it by providing new evidence from Ethiopia. In the Ethiopian context, we can speculate on two reasons why aid and tax are positively associated in the long-run.Footnote18 The first one is related to the fact that, throughout the whole period considered, donors have provided Ethiopian governments with a great deal of policy advice and technical assistance on taxation. This today remains one of the policy areas with the highest level of alignment and cooperation between the government and donors. Moreover, Ethiopia’s history of independence from colonial powers has profoundly shaped the national character and pride, making financial independence a core government priority. As a consequence, the case for a substitution or tax displacement effect of aid is conceptually ill grounded in Ethiopia, as confirmed empirically by this analysis.
Secondly, both aid variables have a positive and robust relation with public expenditure. This relation is stronger between capital expenditure and grants, as shown in the alternative system. This finding is consistent with the results in the literature and with the idea that donors may have a preference for grants to be spent on more productive capital expenditure rather than on ‘consumption’ recurrent expenditure. We are also able to identify a donor disbursement behaviour whereby donors back proven commitment to increased expenditure, specifically capital expenditure, with additional funding, particularly grants.
Finally, we provide evidence for the existence of a domestic budget equilibrium that includes domestic revenues and government expenditure, but excludes aid. By looking at adjustment coefficients, we find that spending plans are mainly driven by tax revenue, while expenditure is the most adjusting variable. Treating tax as the driver for fiscal policy can be considered a good practice, both because it can reduce the risk of over-spending and because it reflects a view of aid as a temporary benefit, rather than a permanently available resource. Overall, our analysis suggests that aid has been managed relatively well in the context of fiscal policy in Ethiopia, producing beneficial responses and presenting no sign of adverse fiscal effects.
Acknowledgments
The authors are thankful to Oliver Morrissey for initiating this joint project, to Alan Winters, to the participants to the CREDIT seminar at the University of Nottingham and the DERG seminar at the University of Copenhagen for their useful comments. We are also deeply grateful to the Ethiopian Ministry of Finance and Economic Development for providing the necessary data and for their support throughout the project. This paper benefitted from valuable inputs from two anonymous peer-reviewers. All remaining errors are our own.
Disclosure statement
No potential conflict of interest was reported by the authors.
Notes
1. See for example Rajan and Subramanian (Citation2008); Arndt, Jones, and Tarp (Citation2010); and Juselius, Moller, and Tarp (Citation2013).
2. See for example Clist and Morrissey (Citation2011); Morrissey and Torrance (Citation2015); and Morrissey, Prichard, and Torrance (Citation2014).
3. For criticisms of the fiscal response framework, see for example Binh and McGillivray (Citation1993) and White (Citation1994).
4. For a literature review of fiscal response studies using CVAR, see Mascagni and Timmis (Citation2014).
5. Relevant references are, for example: Clist and Morrissey (Citation2011) and Morrissey and Torrance (Citation2015) for the first group, McGillivray and Morrissey (Citation2000) and Van De Sijpe (Citation2013)on fungibility, and Bulir and Hamann (Citation2008) and O’Connell, Adam, and Buffie (Citation2008) in the latter group.
6. See McGillivray and Morrissey (Citation2000) for an overview of the debate.
7. For a more detailed account of Ethiopian fiscal history and context, see Mascagni (Citation2016a) and Mascagni (Citation2016b).
8. The CVAR analysis uses level data deflated by GDP deflator and transformed in logarithms.
9. Howard Taylor, former head of DFID in Ethiopia, was quoted as saying that the review of UK aid in the world has shown that Ethiopia is ‘good value for our money’, thus justifying aid increases (Dereje Feyissa, Citation2011).
10. For a more detailed account, see Mascagni (Citation2016b).
11. These estimates and more details on the comparison of different data series are available in Timmis (Citation2015).
12. We tested a model allowing for a trend in cointegrating relationships, but the tests suggested that it can be excluded. Full set of testing results are available in Timmis (Citation2015).
13. A less conservative and perhaps more pragmatic approach to interpreting the Johansen test would be accepting one cointegrating vector. This has been considered, but rejected both on statistical and economic grounds. On the former, the model fit is far inferior, both in terms of normality and trace correlation, when we choose r = 1. Moreover, accepting one cointegrating vector would imply four common driving trends, which would be very difficult to explain in a plausible way. Instead, with three cointegrating relationships, the two common driving trends could be broadly attributed to distinct recipient and donor agendas, therefore having a sensible economic rationale. However, if we accepted the hypothesis of one cointegrating relationship – with or without the dummies – the results would most closely reflect the first cointegrated vector in .
14. For a more complete discussion on beta testing, see Mascagni and Timmis (Citation2014).
15. Martins (Citation2010) still tests, and rejects, a ‘balanced budget’ hypothesis using a specification that resembles H2 in , including grants but excluding loans. He concludes that the government needs loans and borrowing to balance the budget. However, he does not test the purely domestic budget equilibrium that we find here as a valid long-term relation.
16. Model specification tests for the alternative system are available from the authors.
17. For a more detailed description of the MA representation and a fuller discussion of results, see Mascagni and Timmis (Citation2014).
18. See Mascagni (Citation2016a) for a more detailed discussion.
19. For a more complete discussion on beta testing, see Mascagni and Timmis (Citation2014).
References
- Abbink, J. (2011). Ethnic-based federalism and ethnicity in Ethiopia: Reassessing the experiment after 20 years. Journal of Eastern African Studies, 5, 596–618. doi:10.1080/17531055.2011.642516
- Arndt, C., Jones, S., & Tarp, F. (2010). Aid and growth: Have we come full circle? Journal of Globalization and Development, 1, 1–29. doi:10.2202/1948-1837.1121
- Benedek, D., Crivelli, E., Gupta, S., & Muthoora, P. (2012). Foreign aid and revenue: Still a Crowding out Effect? (IMF Working Paper WP/12/186). Washington, DC: International Monetary Fund.
- Binh, T.-N., & McGillivray, M. (1993). Foreign aid, Taxes and public investment. A comment. Journal of Development Economics, 41, 173–176. doi:10.1016/0304-3878(93)90044-N
- Bulir, A., & Hamann, A. J. (2008). Volatility of development aid: From the frying pan to the fire? World Development, 36, 2048–2066. doi:10.1016/j.worlddev.2007.02.019
- Bwire, T., Morrissey, O., & Lloyd, T. (2017). Fiscal reforms and the fiscal effects of aid in Uganda. Journal of Development Studies. this Special Issue.
- Carter, P. (2013). Does foreign aid displace domestic taxation? Journal of Globalization and Development, 4, 1–47. doi:10.1515/jgd-2013-0023
- Clapham, C. (1988). Transformation and continuity in revolutionary Ethiopia. Cambridge: Cambridge University Press.
- Clist, P., & Morrissey, O. (2011). Aid and tax revenue: Signs of a positive effect since the 80s. Journal of International Development, 23, 165–180. doi:10.1002/jid.1656
- Fagernas, S., & Roberts, J. (2004). The fiscal effects of aid in Uganda (ESAU Working Paper 9). London: Overseas Development Institute.
- Fagernas, S., & Shurich, C. (2004). The fiscal effects of aid in Malawi (ESAU Working Paper 7). London: Overseas Development Institute.
- Feyissa, D. (2011). Aid negotiation: The uneasy “partnership” between EPRDF and the donors. Journal of Eastern African Studies, 5, 788–817. doi:10.1080/17531055.2011.642541
- Franco-Rodriguez, S., McGillivray, M., & Morrissey, O. (1998). Aid and the public sector in pakistan: Evidence with endogenous aid. World Development, 26, 1241–1250. doi:10.1016/S0305-750X(98)00048-5
- Gebregziabher, F. (2014). The long run macroeconomic effects of aid and disaggregated aid in Ethiopia. Journal of International Development, 26, 520–540. doi:10.1002/jid.v26.4
- Gomanee, K., Morrissey, O., Mosley, P., & Verschoor, A. (2005). Aid, government expenditure and aggregate welfare. World Development, 33, 355–370. doi:10.1016/j.worlddev.2004.09.005
- Gupta, S., Clemens, B., Pivovarsky, A., & Tiongson, E. (2004). Foreign aid and revenue response: Does the composition of aid matter? In S. Gupta, B. Clemens, & G. Inchauste (Eds.), Helping countries develop: The role of fiscal policy. Washington, DC: International Monetary Fund.
- Heller, P. (1975). A podel of public fiscal behaviour in developing countries: Aid, investment and taxation. American Economic Review, 65, 429–445.
- Johansen, S. (2002). A small sample correction of the test for cointegrating rank in the vector autoregressive model. Econometrica, 70, 1929–1961. doi:10.1111/1468-0262.00358
- Juselius, K. (2006). The cointegrated VAR model: Econometric methodology and empirical applications. Oxford: Oxford University Press.
- Juselius, K., Moller, N. F., & Tarp, F. (2013). The long-run impact of foreign aid in 36 African countries: Insights from multivariate time series analysis. Oxford Bulletin of Economics and Statistics, 76, 153–184. doi:10.1111/obes.12012
- Lloyd, T., McGillivray, M., Morrissey, O., & Opoku-Afari, M. (2009). The fiscal effects of aid in developing countries: A comparative dynamic analysis. In G. Mavrotas & M. McGillivray (Eds.), Development aid. A fresh look (pp. 158–179). Basingstoke: Palgrave Macmillan.
- Martins, P. M. G. (2010). Fiscal dynamics in ethiopia: The cointegrated VAR model with quarterly data. (Economics Departments Working Paper Series 2009-10). Brighton: University of Sussex.
- Mascagni, G. (2016a). Aid and Taxation in Ethiopia. The Journal of Development Studies, 52, 1744–1758. doi:10.1080/00220388.2016.1153070
- Mascagni, G. (2016b). A fiscal history of Ethiopia: Taxation and aid dependence 1960-2010 (ICTD Working Paper 49). Brightion: International Centre for Taxation and Development.
- Mascagni, G., & Timmis, E. (2014). Fiscal effects of aid in Ethiopia: Evidence from CVAR applications (CREDIT Research Paper 14/06). Nottingham: School of Economics, University of Nottingham.
- Mavrotas, G. (2005). Aid heterogeneity: Looking at aid effectiveness from a different angle. Journal of International Development, 17, 1019–1036. doi:10.1002/(ISSN)1099-1328
- McGillivray, M., & Morrissey, O. (2000). Aid fungibility in assessing aid: Red herring or true concern? Journal of International Development, 12, 413–428. doi:10.1002/(ISSN)1099-1328
- Morrissey, O., Prichard, W., & Torrance, S. (2014). Aid and taxation: Exploring the relationship using new data (ICTD Working Paper 21). Brighton: International Centre for Taxation and Development.
- Morrissey, O., & Torrance, S. (2015). Aid and taxation. In M. Arvin & B. Lew (Eds.), Handbook of foreign aid (pp. 555–576). Basingstoke: Edward Elgar.
- O’Connell, S. A., Adam, C. S., & Buffie, E. F. (2008). Aid and fiscal instability (CSAE Working Paper Series 2008-18). Oxford: University of Oxford.
- OECD and African Development Bank Group. (2010). African economic outlook 2010: Public resource mobilization and aid. Paris: Author.
- Osei, R., Morrissey, O., & Lloyd, T. (2005). The fiscal effects of aid in Ghana. Journal of International Development, 17, 1037–1053. doi:10.1002/(ISSN)1099-1328
- Rajan, R. G., & Subramanian, A. (2008). Aid and growth: What does the cross-country evidence really show? The Review of Economics and Statistics, 90, 643–665. doi:10.1162/rest.90.4.643
- Timmis, E. (2015). Fiscal effects of aid (PhD Thesis). University of Nottingham.
- Van De Sijpe, N. (2013). Is foreign aid fungible? Evidence from the education and health sectors. The World Bank Economic Review, 27, 320–356. doi:10.1093/wber/lhs023
- White, H. (1994). Foreign aid, taxes and public investment: A further comment. Journal of Development Economics, 45, 155–163. doi:10.1016/0304-3878(94)90065-5
Appendix. Model Specification and Tests
The details for the model set out in Section 5 are reported here. The lag-length determination tests in are not entirely consistent. The Schwarz information criterion suggests, whist Hannan-Quinn supportss
. The Lagrange Multiplier (LM) tests suggest some leftover residual autocorrelation at
, which could potentially violate the model assumptions and confound inference. Consequently, we settle on a lag-length for the specified model of
.
shows that the model satisfies the necessary conditions to proceed with the CVAR. The residuals from the unrestricted VAR model do not seem to suffer from residual autocorrelation or heteroskedasticity. The assumption of multivariate (and univariate) normality cannot be rejected, with a p-value of 0.111. The goodness of fit of the model, summarised by the trace correlation, is also acceptable (0.518).
With the largest characteristic root is 0.690, which can be considered far enough from the unit circle not to be considered a unit root. Most
coefficients of the unrestricted VAR for Alpha(3) show significance and adjustment, according to a critical value of 2.6 (Juselius, Citation2006, p. 122) whereas in Alpha(4) only one coefficient may be considered significant. Therefore by choosing
and excluding Alpha(3),we would lose important information. Details are available on request.
summarises the results of tests on whether the variables are long-run excludable, stationary, weakly exogenous, or purely adjusting. A variable is said to be long-run excludable if its long-run coefficient can be accepted to be zero across all cointegrating vectors. For a system with three cointegrating relationships, none of the variables of interest can be excluded. The stationarity tests show that, if the mean shift dummies are excluded, none of the variables can be accepted as stationary. However, if the dummies are included, the stationarity of non-tax and loans cannot be rejected. This is likely due to the lower number of observations available after having divided our sample across the three regimes. The Dickey-Fuller GLS tests largely support the hypothesis that variables are I(1) processes with a drift, with the exception of loans.
Weak exogeneity tests identify which variables do not adjust to the long-run equilibrium by imposing a zero row in the vector, without imposing any restrictions on
vectors. If the null hypothesis is accepted, a variable with a zero row in alpha can be considered weakly exogenous and it defines a common driving trend. Tax revenue and loans are potentially weakly exogenous, but only at the 10 per cent confidence level. This evidence is not strong enough to justify a partial model, and weak exogeneity is tested again once the long-run structure is identified. Finally, mirroring the weak exogeneity test, the unit vector in alpha test determines whether a variable can be accepted as purely adjusting to the equilibrium error, thus being purely endogenous. Only government spending can be confidently seen as purely adjusting.
Testing restrictions on the beta vectors offers indications on the stationarity of possible combinations of variables and therefore their possible inclusion in the long-run system as equilibrium relations. The procedure involves imposing zero restrictions on some variables in a given beta vector, allowing the remaining parameters to be estimated while keeping the other two cointegrating relationships unrestricted. The null hypothesis is then the stationarity of a particular relation that, if accepted, suggests that the tested relation is a possible candidate for inclusion amongst the three cointegrating relations in the final long-run structure. Each tested relation needs to include at least one normalisation and two restrictions to achieve long-run identification. However, with r = 3, when only two restrictions (and one normalisation) are imposed, the relation is just-identified and therefore the p-value is one by construction (that is, restrictions are not testable, see Juselius, Citation2006, p. 189). The last column of reports the p-value for the null of stationarity for each tested relation. In addition, the table allows us to assess the reducibility of relations, testing if it is possible to drop one additional variable from the relation while preserving stationarity.
Importantly, testing restrictions on beta allows testing the irreducibility (or otherwise) of a given relationship. is organised around the three hypotheses formulated in Section 2, namely: budget equilibrium, aid and expenditure, and aid and tax. Testing the first one (rows H1–H11) reveals that the relationship between government expenditure and revenue is stationary, with the coefficients across specifications. Aid variables do not need to be included and that, therefore, there exists an ‘irreducible’ domestic fiscal equilibrium. This domestic equilibrium is valid over the whole sample, as mean shifts can be excluded. The second hypothesis (H12–H17) summarises the relationship between total expenditure and the aid variables. This relationship needs the 1991 dummy to be stationary, but the exclusion of the 1974 dummy can be considered as an over-identifying restriction. The third relation (H18–H23) shows a positive association between tax revenue and the aid variables in the long-run. Again, the 1991 dummy is needed to achieve stationarity and therefore the only other restriction that may be considered is on the 1974 shift.
Testing restrictions on beta provides indications on the equilibrium relations that form the long-run system. The procedure involves testing the null hypothesis of stationarity for a particular vector that, if accepted, suggests that such relation is a possible candidate for inclusion amongst the three cointegrating relations. Importantly, testing restrictions on beta allows testing the irreducibility (or otherwise) of a given relationship. The results in the show that the three expected relations are statistically valid for inclusion in the long-run structure.Footnote19 reports various possible specifications of cointegrating vectors, with the relative tests. The first rows (H1–H11) allow us to identify an ‘irreducible’ domestic fiscal equilibrium that does not need aid to achieve stationarity and that is valid over the whole sample (that is, mean shifts can be excluded). The second and third relations associate respectively aid and expenditure (rows H12–H17) and aid and tax (rows H18–H23), in different possible specifications. In both cases the 1991 dummy is needed to achieve stationarity but over-identifying restrictions may be considered on the 1974 shift. These tests allow us to identify the long-run system that provides the results discussed next.
Table A1. Lag length selection
Table A2. Misspecification tests
Table A3. Long-run identification tests
Table A4. Testing on beta
Table A5. Short-run residual correlation matrix
Table A6. Composition and loadings of the common trends
Table A7. Long-run impact (C) matrix
Table A8. Long-run results for the alternative system
Figure A1. Comparison of recipient and donor aid data.