
Abstract
We re-examine some of the strongest evidence supporting agricultural commercialisation, a highly touted yet under-researched development intervention. Our replication study re-examines Ashraf, Giné, and Karlan’s ‘Finding Missing Markets’ paper. Using the previous paper’s raw data, our research generally reproduces the original findings. We explore the evaluation’s theory of change, focusing on the result that first time export crop adopters benefit more from agricultural commercialisation than previous adopters. We also examine recall bias questions and provide sample size guidance for future researchers. Similar to the original paper, we find that the intervention mostly benefits households just entering the agricultural production value-chain.
1. Introduction
Our replication study reconstructs the paper ‘Finding missing markets (and a disturbing epilogue): Evidence from an export crop adoption and marketing intervention in Kenya’ (Ashraf, Giné, & Karlan, Citation2009a) using the original raw data. This innovative study by Nava Ashraf, Xavier Giné, and Dean Karlan (henceforth referred to as AGK) captures the much promoted yet under-researched concept of agricultural commercialisation and diversification through export-oriented crop promotion in the developing world.Footnote1 Specifically, AGK evaluate the household-level income effects of efforts to encourage Kenyan farmers to adopt new export crops. AGK’s experimental design and package of commercialisation tools allow for a clean causal interpretation of the intervention’s impact.
Development professionals generally present agricultural commercialisation as a path to poverty alleviation, but little impact evaluation evidence exists to support this claim. Previous research shows households that adopt cash crops in which they maintain a comparative advantage to reach consistently higher income levels. However, many of these studies use village, region, or even nationally representative cross-sectional data.Footnote2 Stewart et al.’s (Citation2015) systematic review determines ‘Finding Missing Markets’ to be the only impact evaluation with low risk of bias in the area of agricultural practice innovation.
Agricultural commercialisation is a highly policy-relevant topic. International agencies continue to draw attention to agribusiness development opportunities because of both their ability to support rural households and the possibility of averting future food crises. World Bank (Citation2013) highlight the importance of unlocking the potential of agricultural commercialisation, while describing some of the market failures that prevented previous efforts from being fully realised. Fan, Brzeska, and Olofinbiyi (Citation2015) explain how properly incentivised agricultural commercialisation supports economic development.
Policy-makers recommend farmers transition from consumption farming to income farming (Fan et al., Citation2015). Agricultural commercialisation often presents opportunities for rural households to exploit their comparative advantage by growing labour-intensive agricultural commodities. Generally, commercialisation is advocated for as a means of agricultural diversification into high-value crops, while allowing for the purchasing of required food. Nevertheless, to reap the benefits of commercialisation, farmers must overcome a number of potential market failures, from unfamiliar export crops to capital constraints.
1.1. Reviewing the intervention
AGK evaluate an intervention designed to increase agricultural commercialisation by providing a package of extension and marketing services to treatment smallholder farmers. After identifying high-value international crops with strong local growth potential, the intervention targeted smallholder farmers with a package of services including current price information for those crops, linkages to a transportation supply chain, and, for one treatment arm, linkages with commercial banks. These services were provided to overcome general constraints faced by smallholder farmers engaged in higher value agriculture.
DrumNet, the project implementers, specifically targeted smallholder farmers through existing self-help groups (SHGs). They based intervention eligibility on agricultural household membership in a SHG registered with the Kenyan government; SHG interest in growing export crops; household access to irrigated land; and household ability to make a minimum payment of about US$10. DrumNet gave intervention recipients a month-long course in Good Agricultural Practices and instructions on opening a local bank account. They also gave households in the credit arm access to microcredit, with a minimum deposit required of those households to guarantee the loans they received.
The researchers based their paper on a plausible causal chain. Farmers gain knowledge and skills in growing high-value export crops. The adoption of these crops, along with a reduction in transportation costs, leads to increases in household income. In the end, it is hoped that this increase in household income will lead to general welfare benefits.Footnote3 The evaluation also examines possible heterogeneous impacts based on households that previously produced export crops versus first-time adopters, as first-time adopters may have more capacity for increasing their household income.
1.2. Introducing the replication
The original study uses a randomised evaluation framework to test the impact of providing a package of agricultural commercialisation services to SHGs. AGK conclude that the intervention only increases the household income of first-time export crop adopters. Possible recall bias and sample size constraints may influence the strength of the original results. Following our posted replication plan, our study aims to test the robustness of the existing agricultural commercialisation evidence and highlight the effectiveness of this package of interventions.
Following Brown, Cameron, and Wood (Citation2014), we include three main sections: pure replication, measurement and estimation analysis, and theory of change analysis. In the pure replication section, we explain the data, methods, and assumptions we use to re-evaluate the intervention. Our measurement and estimation analysis examines the different datasets from the original analysis and includes an analysis of the original study’s sample size. Our theory of change analysis briefly explores alternative methods of analysing heterogeneous impacts by considering whether the types of crop being planted or the method of entering the commercialisation market is of more relevance to this intervention.
2. The pure replication
Our pure replication uses the raw data to reassess the intervention (Ashraf, Giné, & Karlan, Citation2013). We reconstruct the original paper using these data, the publication, and the survey instruments as a pseudo-codebook. While we see strengths in recoding the entire paper, ensuring our results to be independent of the original research findings, that independence comes at the cost of not necessarily following AGK’s evaluation path.
2.1. The data
The original study includes three datasets: the baseline, the follow-up, and the ‘extra 500’.Footnote4 AGK shared with us the survey instruments, the raw data, and two codebooks that generally describe the data but do not contain detailed explanations of how they generated the study variables.Footnote5
While most of the data record time of survey statuses, the extra 500 dataset contains different types of data. Budget constraints forced AGK initially to interview a relatively small sample. To address possibly inadequate sample sizes, AGK expanded their sample in the middle of the evaluation.Footnote6 As they did not have baseline information for these new households, AGK collected the information retrospectively through recall questions at the time of the follow-up.
2.2. Assignment to treatment,
We begin our pure replication by reproducing the SHG-level balance statistics reported in the first table of the original paper. These summary statistics results compare the pre-intervention SHG characteristics between control and treatment groups, with the treatment groups separated into credit and no-credit arms. Ashraf, Giné, and Karlan (Citation2009a) note that they randomly assigned the 36 SHGs into three groups of 12 SHGs before implementing the intervention.Footnote7
Table 1. Replication results of pre-intervention balance with original and ‘updated’ group treatment assignment, AGK reproduction
The first table comprises eight variables: current number of members, age of SHG, existence of social activities, fee contributions to the SHG per member, existence of SHG bank account, paved main road, distance to the main market, and time to the main market. Due to the unavailability of raw SHG-level data, we use AGK’s pre-constructed variables to analyse the pre-intervention balance between the different SHGs.
The differences in our pre-intervention summary statistic finding in panel A of leads us to explore alternative possible assignments to treatment. panel B exactly replicates AGK’s first table including their treatment arm post-estimation tests on each baseline characteristic.Footnote8
As treatment status influences all of the evaluation results, we cross-reference our results with the original .do files. It appears that there are 12 control SHGs, 13 credit SHGs, and 11 no-credit SHGs.Footnote9 We use the updated treatment assignment for the remainder of our replication study, making the treatment assignment question moot because we combine all treatment SHGs into one group.
2.3. Reproducing the summary statistics
Our study focuses on the intent-to-treat (ITT) analysis for the combined treatment arms. In , we present the combined treatment group baseline summary statistics.Footnote10 The baseline statistically significant differences between the control and treatment households in appear to bias the impact evaluation results downwards. While we control for any reported differences in the ITT analysis, these factors suggest the analysis may understate the influence of the intervention evaluation results.
Table 2. Updated baseline summary statistics, AGK partial reproduction
Overall, the original paper and the replication study report very similar baseline sample sizes for each variable. Small differences exist between the number of household baseline observations in the original and the replication, which become a bit larger when looking at the number of households in the specific treatment arms.Footnote11
2.4. Reproducing the main results
Although AGK report a number of results, they present their key findings on the intervention’s effectiveness mainly in their fourth table.Footnote12 In this difference-in-difference table they present results from controlling for SHG fixed effects and some of the variables highlighted in their balance tables. AGK includes both ITT and treatment-on-the-treated instrumental variable results. We only reproduce the ITT results, as AGK express strong validity concerns with their instrumental variable approach and present their ITT estimates as their preferred results.
AGK examine the causal relationship between the DrumNet intervention and an increase in household income. This ultimate outcome of interest first requires households to grow export crops and devote more land to cash crop production. As DrumNet targeted baby corn and French beans, we expect to see increases in the production of these cash crops in the treatment SHGs. The intervention simultaneously relieves marketing and transportation constraints, which should correspond to supply-side cost decreases for farmers in the treatment SHGs. Each of these intermediate steps along the intervention’s causal chain is designed to increase the household income.
Shown side-by-side in our , which partially reproduces AGK’s , the replication study results generally support the original findings. AGK highlight that treatment households are 19.2 per cent more likely to adopt export crops in the follow-up period. Our 24.6 per cent result for the same outcome of interest is very similar and of an equal statistical significance level as the original finding. Similar to AGK, we do not find any significant changes in French bean production, so we only present the baby corn results.
Table 3. Impacts of DrumNet: ITT, OLS, AGK partial reproduction
Table 4. Impacts of DrumNet (prior exporters versus new adopters): ITT, OLS, AGK partial reproduction
Table 5. Impacts of DrumNet (prior exporters versus new adopters): ITT, OLS, AGK partial reproduction
Table 6. Wood and Dong versus AGK research decisions
Table 7. Updated baseline DrumNet summary statistics by dataset: replication results
Our reproduction of AGK’s baby corn results, while similar in statistical significance level, differ quite substantially in coefficient size. We find average increases of an extra 86 kilograms in treatment households. These results are closer to the findings in AGK’s working paper (Ashraf, Giné, & Karlan, Citation2008), where treatment households average an increase of 397 kilograms production of baby corn. Throughout the rest of the paper, we correct for misplaced commas in AGK’s production of baby corn, production of French beans, and total spent in marketing results.
A few notable differences exist between the original findings and the replication results in some of the secondary outcomes in our .Footnote13 Overall, outside of the difference in coefficient size for a few of the outcomes of interest, the original results are generally robust to our replication study.
2.5. Exploring heterogeneous impacts
AGK explore how the DrumNet interventions influence previous crop exporters versus new adopters. The researchers determine that the intervention mainly benefits producers who had not previously grown the recommended export-oriented crops. We focus on these results.
The heterogeneous impact findings in our and mostly support the original results. Our results show statistically significant increases in baby corn production, on average, for previous export crop adopters. However, that statistical significance does not carry over to the new export crop adopters in our results. These findings generally reinforce AGK’s claim that the intervention caused, on average, a statistically significant increase in the household income of newly commercialised agricultural households.
The possible presence of endogenous sorting may bias these heterogeneous impacts, in that households more prone to selling their crops may select themselves into the adoption group. A number of factors may influence crop adoption patterns, including a host of unobservable household and individual attributes. We do not directly address these concerns, although we find little correlational evidence to suggest that richer households sell export crops.
2.6. Pure replication challenges
Our decision to reconstruct independently the original evaluation from the raw data limits our replication study. As seen in our reproduced summary statistics, although the number of observations in the surveys remains very similar, in some instances the magnitudes of the variables of interest vary quite substantially with the published results.
2.6.1. Data documentation limitations
We encounter difficulties identifying households within and across the survey rounds, partly because of inconsistent household identification numbers. The multi-dataset format requires extensive merging throughout the analysis process, further complicating household identification.
We make a number of coding assumptions in our replication process. We assume the extra 500 survey instrument documentation reverses the crop production results, that many of the extra 500 observations are missing decimal points (and thus need to be divided by a factor of 100), and that missing variables need to be imputed.
We find it easier to reproduce some variables than others. Variables prove difficult to reproduce for a number of reasons. For example, without knowing the date of the interview, we approximate the number of months as member in SHG. Total spent in marketing is the hardest variable for us to reproduce, as it requires household transport costs and assumptions of the number of typical transactions for each household.Footnote14
2.6.2. Conversion factors
AGK’s survey instruments include difficult to calculate local measurement units.Footnote15 We convert production and planting area to standard units of measurement using AGK’s agricultural production conversion tables.Footnote16 We were unable to convert production measured in some units, like ‘gorogoro’ (ERS, Citation1992). By not accounting for planting measurements recorded in ‘stems’, which apparently represent fruit trees, we could not capture around 9 per cent of the recorded responses.
The use of non-standard units of measure for agricultural reporting in the original study touches on a much broader debate about these measurements in the literature (Diskin, Citation1999; Fermont & Benson, Citation2011). Although conversion factors contribute to the difficulties we encounter with reproducing the original evaluation results, we ultimately manage to capture most of the original observations in our analysis.
2.6.3. Pure replication conclusions
Our overall results are similar, but not identical to the original publication. Researchers make numerous decisions during an evaluation. In we document a number of the decisions me made during our replication process, and how they differed from the original authors. Highlights of these differences include imputation methodologies, methods for working with outliers, and data assumptions. We consider the general robustness of our pure replication supportive of continued interest in future agricultural commercialisation projects.
3. Measurement and estimation analysis: sample size
Our measurement and estimation analysis generally follows our replication plan in examining the evaluation findings from sample size requirements and data perspectives. The one major caveat is our analysis of the extra 500 sample, which we did not pre-specify due to a lack of understanding as to the extent of recall sampling before we undertook our replication study. First, we separate the extra 500 households from the original survey participants to check the within- and between-sample balance for both datasets. We then calculate sample size requirements for future work.
The publication results rely on pooling the baseline and the extra 500 surveys to measure the impact of the intervention. Enumerators collected the extra 500 baseline information at the time of the follow-up survey. These extra 500 data may include courtesy bias, as the intervention had already begun, or recall bias, as enumerators asked respondents to remember information from the previous year.
Given the differences in the baseline data collection timelines, we examine the datasets separately. shows the balance between the original baseline data and the extra 500 recall data. Age continues to be statistically significantly imbalanced across all of our datasets. The other variables highlighted in , export crops and uses of machinery/animal force, are only significantly imbalanced statistically in the original dataset. Literacy and proportion of land devoted to cash crops are only significantly imbalanced in the extra 500 data.
We identify a number of statistically significant imbalances when comparing the balance between the two datasets. Following Bruhn and McKenzie (Citation2009), we combine the data and conduct an F-test on the joint orthogonality of the variables in relation to treatment. With an F value of 4.13, the test finds the collective contribution of the variables in the balance tables to be significantly different from each other at the 1 per cent level when comparing the control and the treatment households.
Of all of the evaluation’s outcome variables, we focus our analysis on the one arguably hardest to precisely recall, proportion of land devoted to cash crops. To understand differences between the two surveys better, we separate the responses by the dataset and treatment status in the histogram plots in . As the recall period refers to the baseline period, we only present the baseline data results.
Figure 1. Baseline data distribution of land devoted to cash crops, by dataset.
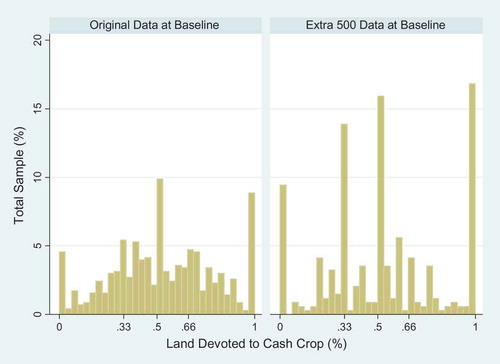
The distribution of the baseline responses for proportion of land devoted to cash crops differ quite substantially between the two datasets. We find a wide distribution of answers in the original dataset. Less variation exists in the extra 500 dataset. The clumpier distribution of the extra 500 data of around one third and one half suggests recall approximations. We formally test the equality of the distributions with a Kolmogorov–Smirnov test, finding a statistically significant difference between the two groups at a 1 per cent level (Stephens, Citation1992).
Because of our concerns with the recall data, we reproduce the main evaluation results excluding the extra 500 data in . Although we continue to find similar coefficient size between the combined and original samples, some of the key results lack statistical significance with this subset of the sample. The extra 500 data appear to drive at least some of the main results, especially in the proportion of land devoted to cash crop variable coefficient, which switches signs after excluding the extra 500 data.
Table 8. Impacts of DrumNet: ITT, OLS by dataset
Sample size constraints restrict our ability to make definite statements about the results from the separate datasets. AGK specifically collected the extra 500 data to offset their power concerns with the original size of the sample. We calculate sample size requirements from the baseline sample to determine the necessary size of future samples for researchers hoping to detect statistically significant change in theses outcomes of interest. We also calculate the actual intra-cluster correlation coefficient (ICC) for each outcome of interest, as a reference for future research.Footnote17
We focus our interest on the log of household income variables in . Our calculation results show, unsurprisingly given the published findings, that the log of household income variable does not contain enough observations to detect statistical significance. After calculating the effect size, we determine the required size of future evaluations to be able to test for statistical significance in log of household income. We perform a back-of-the-envelope calculation assuming the same number of SHGs, the same average number of interviewees per SHG, and that our replication results are the true change in household income. Under these assumptions, we estimate that future evaluations would need to include approximately 2,500 people to be able to detect a statistically significant increase in the log of household income among treatment households.
Table 9. Post-intervention sample size calculations, baseline by dataset
4. Theory of change analysis: reanalysis and alternative heterogeneity analysis
AGK’s heterogeneous impact results may lead to striking policy implications, notably that policy-makers should focus on subsistence farmers unfamiliar with export crops. We explore the hypothesis that the DrumNet intervention encourages formerly isolated farmers to work within established markets. Under this theory, the specific export crop encouragement is less important than the commercialisation of smallholder farmers. This alternative hypothesis would alter the policy recommendations somewhat, away from encouraging specific export crop production and towards supporting farmers to engage with markets.
In our opinion, DrumNet’s success with subsistence farmers may stem from the intervention’s focus on factors that had previously prevented these farmers from growing crops that are more valuable. A large body of literature finds subsistence crop production a typically inefficient use of land, with labour-intensive commercial crops potentially allowing for significant welfare gains through comparative advantage in lower wage costs.Footnote18 Relating to market failures, subsistence farmers may not adopt export crops due to a lack of established relationships with traders. In addition, these same farmers may fear unknown adoption effects, due to a need for knowledge of advanced agricultural practices or uncertainty around increased household dependence on outside markets for food purchases.
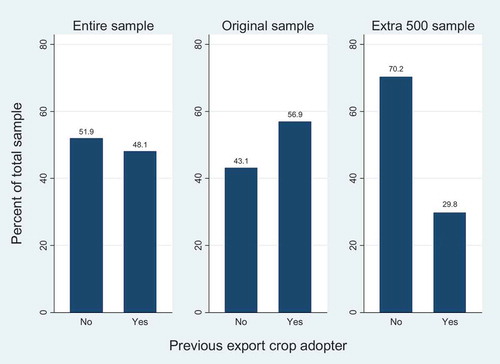
Defining previous adopter of export crops is difficult. As seen in , large differences exist between the per cent of previous adopters of export crops in the original baseline data and the extra 500 baseline recall data. The marked difference in the baseline status of the two samples questions the interpretability of the pooled heterogeneous impacts.
Figure 2. Previous adopters of export crops, by dataset.
In addition to our concerns over differences between the two datasets, we also explore the robustness of the heterogeneous outcomes findings in relation to alternative definitions of previous adopters. AGK define previous adopters rather narrowly as those farmers who previously grew the three DrumNet target crops. We explore an alternative approach to defining previous adopter.
Rerunning the original heterogeneous impact estimations with our alternative previous market participant definition creates different results. First, in panel A of and , we separate the original heterogeneous impact results into the full sample and the sub-sample that only includes the original baseline households. Then we replace the before-intervention cash crop adopter category with our sold crops at a market variable in panels B of these tables.Footnote19
Table 10. Impacts of DrumNet, ITT, OLS heterogeneous outcomes, by baseline characteristics and dataset
Table 11. Impacts of DrumNet, ITT, OLS heterogeneous outcomes, by baseline characteristics and dataset
Focusing on panel A, we find that limiting the sample to only the households included in the original baseline survey generally reduces the magnitude of the coefficients on the outcomes of interest. These results support a hypothesis that the extra 500 data represent a different subsample of households than the original baseline households. The findings would also support the possibility of a courtesy bias in the extra 500 household responses (Crawford, Citation1997). In the courtesy bias scenario, treatment households, having been exposed to the intervention before being asked recall baseline questions, might tailor their answers to demonstrate the effectiveness of the intervention.
When we change the binary previous adopter baseline variable to previously sold to market, we find very similar results with the original heterogeneous impact analysis. As we note above, the original researchers did not ask the extra 500 households to recall this question, so we cannot present entire sample heterogeneous impact results.
Specifically, we see average increases in baby corn production by treatment households, and marketing costs tend to reduce. Of particular interest, we continue to find dichotomous log of household income results. Following this alternative approach to measuring heterogeneous impacts, treatment households that previously sold to markets average statistically significant decreases in the income measurement, whereas we find the opposite result for treatment households who had previously not sold to a market.
The relationship between different channels of entering the agricultural production value chain remains an area for future research. We believe previously selling crops to market to be more relevant than producing specific export crops, as markets should dictate the highest prices for the crops with the most demand. However, incomplete markets may interrupt this natural process. Fan, Brzeska, Keyzer, and Halsema’s (Citation2013) recent work on helping smallholder farmers transition from subsistence farming to more profitable agricultural strategies provides policy options to encourage smallholder participation in the commercial food chain.
5. Conclusion and limitations
Our study suggests, similar to previous findings, that the intervention may benefit households by encouraging them to participate in market-based economies. Nevertheless, we suggest some degree of intervention targeting, as our results show offering assistance to farmers already participating in the value-chain is less productive.
Regarding our robustness checks, we find our data pooling and future sample size requirements results most striking. The differences between the two baselines make us question the interpretability of the study’s findings. Our analysis suggests future evaluation needs to substantially increase sample sizes to detect possibly statistically significant results in household income.
We encounter a number of difficulties with reproducing the original evaluation. Data limitations, both in the original data and the additional datasets we hoped to incorporate into the analysis, prevent us from completing all our replication plan activities. The unavailability of exact geographic locations prevents us from conducting potential control contamination analysis. In addition, data limitations around gender and assets restrict our planned analyses in those areas.
Our replication study provides a number of avenues for further research. One area is disentangling the relationship between different channels of entering the agricultural production value chain. Another connected area is the potential for targeting agricultural commercialisation interventions. We consider the necessity of working with smallholder groups or exclusively with subsistence farmers within agricultural commercialisation interventions to be open research questions. Finally, space exists for more research on the use of cash crop proceeds. Beyond household income, and in the vein of Lundberg, Pollak, and Wales (Citation1997) and Meinzen-Dick et al. (Citation2010), we encourage future researcher on gender specific questions in relation to adoption and gains from agricultural commercialisation. We hope this replication study will encourage future work in this field.
Supplemental Materials
Download PDF (423.4 KB)Acknowledgements
We would like to thank Annette Brown, Howard White, Heather Lanthorn, Eric Djimeu, and four additional anonymous external reviewers for helpful comments on this research. Thanks also to Alan de Brauw, our external project advisor, who’s sharp eye greatly improved our paper. We would also like to thank Sebastian Insfran Moreno for his early-stage research assistance and Courtney Soderberg for sharing her statistician perspective on power calculations in this after-evaluation context. Finally, we extend our gratitude to Nara Ashraf, Xavier Giné, and Dean Karlan, the authors of the original study, for providing us with the original data and survey instruments that made this replication study possible. The Stata statistical code to reproduce our results is available here: https://dataverse.harvard.edu/dataset.xhtml?persistentId=doi:10.7910/DVN/OCPDXG.
Disclosure statement
No potential conflict of interest was reported by the authors.
Supplementary Materials
Supplementary Materials are available for this article which can be accessed via the online version of this journal available at https://doi.org/10.1080/00220388.2018.1506574
Additional information
Funding
Notes
1. See World Bank (Citation2013) and Kherallah, Delgado, Gabre-Madhin, Minot, and Johnson (Citation2002) for examples of export crop promotion efforts.
2. Obare (Citation2000) uses a small district-level survey to discuss some of the impediments to agricultural commercialisation in a Kenyan context. While this research contextualises the research space, it does not answer the general effectiveness question.
3. As noted in the epilogue of the original paper, changes in Europe’s food import certification system prevent the evaluation, and us, from estimating the long-term effects of this intervention.
4. A reviewer noted that the ‘extra 500’ data do not actually contain 500 household observations. We follow AGK’s naming convention in this regard. An additional 500 households were interviewed but AGK only include a subsample of them in the analysis due to intervention eligibility.
5. AGK could not locate the formal follow-up survey instrument, but the composite version they provided us is relatively accurate in relation to the dataset.
6. Ashraf, Giné, and Karlan (Citation2009a) detail their data collection process on page 976 and in footnote 8. We did not focus on recall in our replication plan, as we did not understand the extent AGK relied on this technique. See Beegle, Carletto, and Himelein (Citation2012) for a greater discussion of issues with recall bias in agricultural data.
7. Targeting treatment at the SHG level allows for greater effectiveness because the intervention reaches a larger group of people with a lower cost. Focusing on SHGs also alleviates some unobserved-characteristic concerns among smallholder farmers. Future researchers should note the SHG intervention participation requirement when considering the generalisability of the findings.
8. We keep the SHG that switches treatment arm status within our balance analysis, although no members from that SHG remain in the follow up surveys after data cleaning. We follow AGK’s lead in referring to infrastructure in reference to the roads variable discussed in Table 1A and 1B.
9. We contacted AGK about our assignment concerns and they said we had discovered an ‘error’ in their .do file and that the assignment was equal between the control and two treatment arms. Our do-file is publicly available here (doi:10.7910/DVN/OCPDXG).
10. The treatment arms differ only in access to credit. AGK did not find any significant differences between the two arms in their main analysis. Copies of all tables with alternative treatment assignments are available upon request. Supplementary Materials (b) includes a breakdown of the numbers of observations by treatment assignment rule. See online appendix of Ashraf, Giné, and Karlan (Citation2009b) for an overview of their observations per treatment arm. The replication study’s version of (a) is presented in its entirety in Supplementary Materials Table 2.
11. A table comparing the number of observations between the original publication and the replication study is available upon request.
12. As determinants of DrumNet participation is not central to AGK’s argument, we present those results in Supplementary Materials . We made a similar determination about , , and 9 from the original publication, which we present in Supplementary Materials Tables 7, 8, and 10.
13. As these findings are not central to the theory of change argument we explore, we relegate them to Supplementary Materials Table 6.
14. A table documenting how we generated the variables is available upon request. Imputation ultimately played a role in recreating the sample sizes, which were partially guided by the original paper.
15. For an example of the difficulty around conversion factors, see the World Bank researchers’ note on determining how best to convert non-standard measurements in a Malawian household survey (World Bank, Citationn.d.). And an alternative approach proposed by Verduzco‐Gallo, Ecker, and Pauw (Citation2014).
16. AGK made these tables available to us upon request. They noted that they created the tables in conjunction with the Tegemeo Institute at Egerton University in Nairobi.
17. Our purpose in running post-evaluation power calculations is to determine required sample sizes. See Hoenig and Heisey (Citation2001) and Lenth (Citation2007) for a wider discussion of issues with post-hoc power analysis. See Wood and Djimeu (Citation2014) for more information on the importance of documenting power calculations.
18. See Wood and Djimeu (Citation2014) for a literature review around subsistence versus cash crop production.
19. We also planned to explore distance to market differences, but privacy concerns prevented AGK from sharing household geographic location data about the sample populations. https://dataverse.harvard.edu/dataset.xhtml?persistentId=doi:10.7910/DVN/OCPDXG.
Related Research Data
References
- Ashraf, N., Giné, X., & Karlan, D. (2008). Finding missing markets (and a disturbing epilogue): Evidence from an export crop adoption and marketing intervention in Kenya. NOM Working Paper No. Cambridge: Harvard Business School. pp. 08–065.
- Ashraf, N., Giné, X., & Karlan, D. (2009a). Finding missing markets (and a disturbing epilogue): Evidence from an export crop adoption and marketing intervention in Kenya. American Journal of Agricultural Economics, 91, 973–990.
- Ashraf, N., Giné, X., & Karlan, D. (2009b). Finding missing markets (and a disturbing epilogue): Evidence from an export crop adoption and marketing intervention in Kenya. American Journal of Agricultural Economics, 91, 973–990. https://ageconsearch.umn.edu/bitstream/164204/2/8210_xgine_appendix.pdf
- Ashraf, N., Giné, X., & Karlan, D. (2013). Finding missing markets (and a disturbing epilogue): Evidence from an export crop adoption and marketing intervention in Kenya [Data set]. Retrieved April 9, 2013, from original authors.
- Beegle, K., Carletto, C., & Himelein, K. (2012). Reliability of recall in agricultural data. Journal of Development Economics, 98, 34–41.
- Brown, A., Cameron, C., & Wood, B. (2014). Quality evidence for policymaking: I’ll believe it when I see the replication. Journal of Development Effectiveness, 6, 215–235.
- Bruhn, B., & McKenzie, D. (2009). In pursuit of balance: Randomization in practice in development field experiments. American Economic Journal: Applied Economics, 1, 200–232.
- Crawford, I. (1997). Marketing research and information systems. Rome: Food and Agriculture Organisation of the United Nations.
- Diskin, P. (1999). Agricultural productivity indicators measurement guide. Arlington: U.S. Agency for International Development.
- Djimeu, E., & Houndolo, D. (2016). Power calculation for causal inference in social science: Sample size determination and minimum detectable effect determination. ( Working Paper No. 26). Retrieved from International Initiative for Impact Evaluation website: http://www.3ieimpact.org/media/filer_public/2016/04/06/wp26-power-calculation.pdf
- Economic Research Service. (1992). Weights, measures, and conversion factors for agricultural commodities and their products (Agricultural handbook no. 697). United States Department of Agriculture Retrieved from https://www.ers.usda.gov/webdocs/publications/ah697/33132_ah697_002.pdf?v=42487
- Fan, S., Brzeska, J., Keyzer, M., & Halsema, A. (2013). From subsistence to profit: Transforming smallholder farms (food policy report). International Food Policy Research Institute (IFPRI): Retrieved from http://ebrary.ifpri.org/utils/getfile/collection/p15738coll2/id/127763/filename/127974.pdf
- Fan, S., Brzeska, J., & Olofinbiyi, T. (2015). 2014–2015 global food policy report (food policy report).IFPRI Retrieved from http://ebrary.ifpri.org/cdm/ref/collection/p15738coll2/id/129072
- Fermont, A., & Benson, T. (2011). Estimating yield of food crops grown by smallholder farmers: A review in the uganda context (ifpri discussion paper 01097). IFPRI Retrieved from: http://ebrary.ifpri.org/utils/getfile/collection/p15738coll2/id/124924/filename/124925.pdf
- Hoenig, J., & Heisey, D. (2001). The abuse of power: the pervasive fallacy of power calculations for data analysis. The American Statistician, 55, 19–24.
- Kherallah, M., Delgado, C., Gabre-Madhin, E., Minot, N., & Johnson, M. (2002). Reforming agricultural markets in Africa (Food policy statement no. 28).IFPRI Retrieved from http://ebrary.ifpri.org/utils/getfile/collection/p15738coll2/id/47871/filename/43329.pdf doi:10.1044/1059-0889(2002/er01)
- Lenth, R. (2007). Post hoc power: tables and commentary (Technical report no. 378).The University of Iowa Retrieved from https://stat.uiowa.edu/sites/stat.uiowa.edu/files/techrep/tr378.pdf
- Lundberg, S., Pollak, R., & Wales, T. (1997). Do husbands and wives pool their resources? Evidence from the United Kingdom child benefit. The Journal of Human Resources, 32, 463–480.
- Meinzen-Dick, R., Quisumbing, A., Behrman, J., Biermayr-Jenzano, P., Wilde, V., Noordeloos, M., … Beintema, N. (2010). Engendering agricultural research (IFPRI discussion paper 00973). IFPRI Retrieved from http://ebrary.ifpri.org/cdm/ref/collection/p15738coll2/id/1655
- Obare, G. A. (2000). The impact of road infrastructure on input use and farm level productivity in Nakuru district, Kenya. Njoro: Egerton University. Doctoral dissertation
- Stephens, M. A. (1992). An appreciation of kolmogorov’s 1933 paper (Technical report no. 453). Stanford University Retrieved from https://statistics.stanford.edu/sites/default/files/SOL%20ONR%20453.pdf.
- Stewart, R., Langer, L., Da Silva, R., Muchiri, N., Zaranyika, E., Erasmus, H., De Wet, T. (2015). The effects of training, innovation and new technology on African smallholder farmers’ economic outcomes and food security: A systematic review (Campbell systematic reviews 2015:16). Campbell Collaboration Retrieved from https://www.campbellcollaboration.org/media/k2/attachments/Stewart_SmallholderFarming_Review.pdf
- Verduzco‐gallo, I., Ecker, O., & Pauw, C. (2014). changes in food and nutrition security in Malawi: analysis of recent survey evidence (working paper no. 6). ifpri Retrieved from http://ebrary.ifpri.org/utils/getfile/collection/p15738coll2/id/128205/filename/128416.pdf
- Wood, B., & Djimeu, E. (2014). Requiring fuel gauges: A pitch for justifying impact evaluation sample size assumptions [3ie Evidence Matters blog]. Retrieved from http://blogs.3ieimpact.org/requiring-fuel-gauges-a-pitch-for-justifying-impact-evaluation-sample-size-assumptions Retrieved from
- World Bank. (2013). Growing Africa: unlocking the potential of agribusiness. Washington, DC: World Bank. Retrieved from https://openknowledge.worldbank.org/handle/10986/26082
- World Bank. (n.d.). Note on conversion factors for food item‐non‐standard measurement unit combinations in the Malawi third integrated household survey (IHS3) 2010/11 data [survey notes]. World Bank Retrieved from http://siteresources.worldbank.org/INTLSMS/Resources/3358986-1233781970982/5800988-1271185595871/Malawi_IHS3_Food_Item_Conversion_Factors.pdf