
 ?Mathematical formulae have been encoded as MathML and are displayed in this HTML version using MathJax in order to improve their display. Uncheck the box to turn MathJax off. This feature requires Javascript. Click on a formula to zoom.
Abstract
This paper develops a simple econometric strategy to operationalise the United Nations Children’s Fund’s (UNICEF’s) conceptual framework for nutrition. It estimates the extent to which child stunting correlates with investments in water, sanitation, and hygiene (WASH) across population groups (poor and nonpoor) and residence (urban and rural). Moving away from estimating single intervention marginal returns, the empirical framework of intervention packages is tested in Tunisia, a country with notable but uneven progress in reducing stunting. A successful nutritional strategy will thereby require mapping the distinctive intervention packages by residence and socio-economic status, away from universal policies, that more strongly correlate with reduction in stunting.
1. Introduction
Chronic low height for age, or stunting, causes irreversible damage to children’s growth, health, and cognitive development, resulting in a host of undesired impacts: from higher child mortality, morbidity, and higher risk of chronic disease in adulthood to lower school results, reduced adult work productivity, and lower future earnings (Alderman et al., Citation2013; Glewwe, Jacoby, & King, Citation2001; Hoddinott & Kinsey, Citation2001; Maccini & Yang, Citation2009; Mahmud & Mbuya, Citation2015; Strauss & Thomas, Citation1998; Victoria et al., Citation2008). It has also been long known that the determinants of nutrition are multidimensional and that solutions to chronic undernourishment require multisectoral approaches (Alderman et al., Citation2013; Prentice et al., Citation2013; Scale Up Nutrition, Citation2012; Skoufias, Citation2016; United Nations Children’s Fund [UNICEF], Citation1990). Because of its multisectoral nature, strong synergies among numerous determinants need to emerge before real progress in nutritional status takes place, especially for those critical first 1,000 days in the life of a child. In practice, improvements in stunting come from the successful integration of nutrition interventions – such as fortification of foods, promotion of breastfeeding, therapeutic foods benefiting undernourished children – along with interventions from other sectors, such as childcare programmes for working mothers, improvements in agriculture productivity, and the strengthening of safety nets, among others (Scaling Up Nutrition, Citation2012).
Figure 2. Prevalence of under-five stunting in Tunisia, 1988–2012 (%).
Source: UNICEF (Citation2014).Notes: These numbers are for under-five children population reported by UNICEF (Citation2014) while the empirical analysis here focuses on children under two.
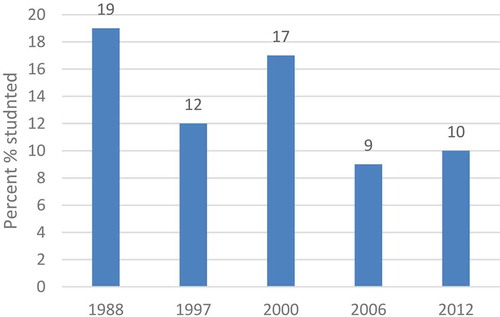
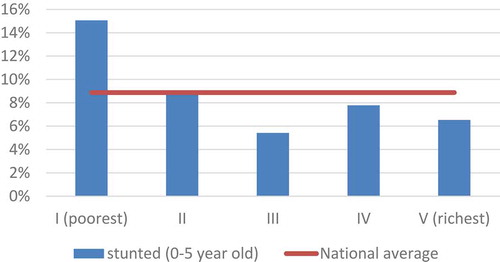
Figure 3. Stunting by wealth quintiles in Tunisia, 2011–2012. Source: UNICEF (Citation2014), based on MICS 2011–2012 for Tunisia. Notes: As the percentage of children under age five who are stunted, by wealth index quintile. Stunting is defined as having a height-for-age more than −2 standard deviations (SD) below the median of the World Health Organization (WHO) reference population.
Water, sanitation, and hygiene (WASH) interventions constitute another necessary dimension to improving child nutrition. The original UNICEF framework for nutrition recognised this conceptually. The international community politically committed to promoting WASH interventions to improve nutrition during the second International Conference on Nutrition (ICN2) in 2014 (FAO, and World Health Organization [WHO], Citation2014; WHO, Citation2015). Empirically, multiple studies report positive returns to children’s nutritional status from the provision of clean water and modern sewerage systems (Barrera, Citation1990; Behrman & Deolalikar, Citation1990; Behrman & Wolfe, Citation1984; Cuesta, Citation2007; Glewwe, Citation1998; Haddad & Hoddinott, Citation1990; Horton, Citation1986; Keller, Citation1988; Skoufias, Citation1999, Citation2016; Webb & Block, Citation2004). More recent research has focused on identifying concrete and direct pathways between WASH and nutrition (Fanzo, Citation2014; and, for a detailed review, Chase & Ngure, Citation2016). For example, improved nutrition can be attained through reduction in diarrheal disease due to declines in faecal contamination of the environment; reduced exposure to enteric infections, infections with protozoa, and helminths; reduced prevalence of anaemia; and reduced time spent fetching water and caring for sick children, among others. In fact, WASH is estimated to explain as much as 35 per cent of the variation in stunting rates across countries over time (Smith & Haddad, Citation2014). Furthermore, new evidence on the effect of open defecation on malnutrition (Spears, Citation2013; Hammer & Spears, Citation2016) – confirms earlier findings linking nutrition and WASH. Importantly, those studies also suggest that WASH effects on nutrition are not typically uniform, varying instead by age group and maternal education level, and not always significant. Indeed, the direction and significance of such interactions is a matter for empirical study.
A different set of studies, clinical randomised controlled trials (RCTs) have recently cast doubts on the benefits of integrating nutritional and WASH interventions. In rural settings in Bangladesh and Kenya, Luby et al. (Citation2018) and Null, Stewart, Pickering, Dentz, and Arnold (Citation2018), respectively, found that nutrient supplementation and counselling only modestly improved linear growth and did not reduce diarrhoea in the treatment group vis-à-vis the control group of children under five. They also found no improved results from integrating those nutritional interventions with (individual or combined) WASH interventions. These findings are similar to those reported by Patil et al. (Citation2014) and Clasen et al. (Citation2014) in rural India: large-scale community sanitation programmes did not improve health outcomes (diarrhoea, HCGI, helminth, and open defecation behaviour) among under five and under two age children. Similarly, Dangour, Watson, and Cumming et al. (Citation2013) report that other five cluster RCTs in Pakistan (Luby et al., Citation2004, Citation2006), South Africa (Du Preez, McGuigan, & Conroy, Citation2010), and Kenya (Du Preez, Conroy, Ligondo, Hennessy, & Elmore-Meegan, Citation2011) had no significant effects on height-for-age Z (HAZ) scores. Those studies also report no distinctive effects by gender or among under two age children.
By putting together the dominant conceptual framework on child nutrition and the existing empirical evidence, we can conclude two things. First, sector-specific interventions alone are oftentimes not sufficient to solve complex, interrelated, and multidimensional nutritional challenges.Footnote1 This does not imply that any combination of interventions will inevitably yield stronger impacts than single interventions. Second, neither are – in most cases – policies that do not account for the specific needs of different types of households, locations, and vulnerabilities. Is it therefore justified to continue investing in WASH across the board – vis-à-vis many other sectors – when such investments do not always provide the expected returns in improving child nutrition? Under what circumstances should we invest additional funds in WASH with expectations of improving child nutrition? These are particularly important questions for designing effective policy interventions in a world that aspires to end hunger, improve nutrition, and ensure a sustainable management of water and sanitation for all by 2030 – aspirations enshrined in the new Sustainable Development Goals 2 and 6. Of course, it is well-acknowledged that there are other reasons to invest in WASH that go beyond improving nutrition, such as for example, expanding coverage and/or ensuring the reliable supply of a critical public service; addressing gender violence; and avoiding political instability; among others (Hunter & Prüss-Ustün, Citation2016).
This analysis addresses the issue of investments in WASH by following a logic of economic efficiency, that is, by estimating which interventions have the largest impact on improving child nutrition. We acknowledge from the start that a simplistic approach is most likely to be unsatisfactory in a context of multiple and interrelated factors. In addition, we recognise that economic efficiency alone does not determine policy choices. Resource allocation decisions are often made based on political costs so, ideally, single and multi-sectoral interventions should be evaluated on their costs to achieve the same unit of reduction in stunting – and, to the extent possible, a discussion on the political costs and benefits of each policy choice. Furthermore, we acknowledge upfront that our model captures correlations among variables rather than causal effects. As such, this analysis should be regarded as a complement to rigorous experimental evaluation involving WASH interventions. While experimental evaluations are considered the gold standard, they are costly; hard to validate externally; typically too short-lived to capture long-term effects (frequently measuring impacts between nine to 24 months after the intervention); and oftentimes failing to ensure a high adherence to the programme (Dangour et al., Citation2013; Luby et al., Citation2018). For these reasons, we propose an extension of UNICEF’s conceptual framework to econometrically quantify, among the multiple sets of interventions or policy packages, which produce the largest synergies toward reducing stunting. In other words, we estimate the integrated relationships, or synergies, that influence stunting from multiple interventions rather than a single impact from a given intervention. From a policy perspective, this approach provides more useful insights for policy-making than evidence obtained from a single sector. Also, it provides an estimate of the magnitude of the influence on nutrition that specific interventions have within an integrated delivery of services. Section 2 explains this methodological extension. Section 3 introduces a specific country case application, Tunisia, in which the new analytics are tested. Section 4 reports key estimates and discusses main results. Section 5 provides concluding remarks with a view to policy design.
2. The synergies extension of UNICEF’s conceptual framework for nutrition
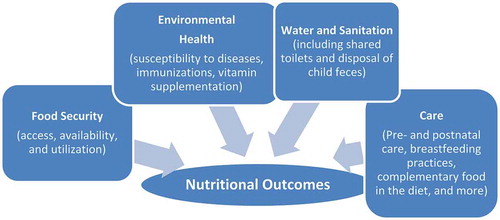
In 1990, UNICEF developed a conceptual framework for nutrition that has been rather influential in the design and implementation of nutrition strategies ever since. This framework provides the conceptual support to expand measures aimed at improving children’s (and adults’) nutrition beyond the traditional set of nutrition-specific interventions. The framework – see – categorises drivers influencing nutrition in several interrelated dimensions (food security, health services, and child care)Footnote2 –, thus arguing in favour of investments on a wider set of early child development, schooling, healthcare, social protection, agriculture, and food security interventions (see Ruel and Alderman, Citation2013). Thus, policies that improve food security alone cannot decrease undernutrition if, for example, the community does not have appropriate levels of safe water and sanitation or prenatal health services. Indeed, community level coverage of toilets has been compellingly shown to matter more to reduce malnutrition than household level coverage in multiple contexts (Andres, Briceno, Chase, & Echenique, Citation2014; Larsen, Grisham, Slawsky, & Narine, Citation2018).
Figure 1. Integrated multisectoral interventions for appropriate child nutrition.
Source: Adapted from UNICEF (Citation1990).
The expansion of the hitherto nutrition-specific paradigm has had deep effects in the design and implementation of domestic policies, as evidenced by the 59 countries currently participating in the Scale Up Nutrition movement or those adopting the concept of the first 1,000 days of life in their nutrition strategies (Hoddinott, Rosegrant, & Torero, Citation2012; Scale Up Nutrition, Citation2017). The influence of UNICEF’s framework can also be seen at the global level. The international community has widely embraced this integrated approach, inspiring nutrition strategies by international and multilateral organisations with different objectives such as WHO, FAO, and World Bank (FAO, Citation2015a; WHO, Citation2015; World Bank, Citation2013). It is precisely this unabated emphasis on the multidimensional nature of nutrition that makes UNICEF’s framework particularly relevant to the analysis of synergies among public interventions.
Against this widely agreed conceptual background, our notion of synergies is operationalised as follows. We estimate a single equation that links adequacies to basic services (As) with the nutritional status of children captured by the HAZ score. The focus is not merely access to or use of basic services, but, rather, adequate access to such services. This enhanced notion provides a sense of quality to services that is not present when looking at access or use alone. For example, food adequacy implies more than access to sufficient food to cover minimum caloric requirements, but also requires access to a balanced, diverse, and affordable diet. Similarly, adequate water access goes beyond accessing a source of safe water: it implies a continuous, predictable, and affordable supply of water. Section 3 discusses concrete definitions of adequacies used in this analysis in more detail.
Specifically, the equation to be estimated is:
where HAZi is the HAZ score for child i, and where i, j, k = 1…4 denotes each of the four dimensions considered, that is, food, water and sanitation, health services, and care. Thus, Ai denotes access to each of the four adequacies for each child i. Namely, A1 is 1 when the household has adequate food (F) and is 0 otherwise; A2 is 1 when the household is adequate in health services (H) and is 0 otherwise; A3 is 1 when the household is adequate in water and sanitation (W); and A4 is 1 for households with adequate care (0 otherwise). These measures are independent of whether the child has access to each of the other three adequacies considered. In this specification, the constant term α provides an estimate of the mean value of HAZ scores for children without access to adequate food security (A1 = 0), health services (A2= 0), water and sanitation (A3 = 0), and care (A4 = 0). That is, the constant term captures E (HAZ | X = x) or the expected (or mean) value of height for age, conditional on a control variable X when none of the adequacies are met – and assuming also that E (εi | A1, A2, A3, A4) = 0:
The coefficient β1 in Equation (1) yields an estimate of the increase in the mean HAZ score for children who have access to adequate food security only (A1 = 1), but do not have access to adequate health services (A2 = 0), adequate water and sanitation (A3 = 0), and no access to adequate care (A4 = 0). The reference group is the group of children satisfying no adequacies, that is, the mean HAZ score for the reference group summarised by the constant term. The coefficients β2, β3, and β4 have analogous interpretations for health services, water and sanitation, and care, respectively. The coefficients γs yield estimates of synergies or complementarities from having access to more than one determinant of nutrition. Specifically, the mean HAZ score for children with access to adequate food security (A1= 1) and adequate health services (A2 = 1) is summarised by the expression:
Thus, the mean value of HAZ scores for children in households with access to adequate food security and adequate health services can be considered as consisting of the sum of three components: the first component is the increase in HAZ scores associated with children in households with adequate food security only (that is, β1); the second component (that is, β2) is the increase in HAZ scores associated with children in households with adequate health services only; and the third component (that is, γ12) is the increase in HAZ scores associated with children in households that have access to both adequate food security and adequate health services. Thus, the coefficient γ12 yields information on whether there are additional (extra) gains (or losses) in HAZ scores derived from joint access to adequate food and health compared to exclusive access to adequate food and exclusive access to adequate health services. A significant and positive value of the coefficient γ12 implies synergies from the simultaneous access to adequate food security and adequate health services in the improvement of child nutrition.
HAZ goes beyond a measure of current child nutrition status. Height is widely acknowledged to be a latent stock measure of health and a predictor of longevity, education, earnings, and health status for the individual in the future as well as for the next generation (Akresh, Bhalotra, Leone, & Osili, Citation2012; Bhalotra & Rawlings, Citation2011; Bundy et al., Citation2016; Case & Paxson, Citation2010, Citation2008; Heckman, Moon, Pinto, Savelyev, & Yavitz, Citation2010; Heckman, Pinto, & Savelyev, Citation2013; Schultz, Citation2002; Steckel, Citation1995; Strauss & Thomas, Citation1998). Also, adult height is considered a marker of the nutrition conditions in early childhood, for instance, the exposure of individuals to severe shocks, such as war or famines (Akresh et al., Citation2012; Bozzoli, Deaton, & Quintana-Domeque, Citation2009). However, albeit recognised, the estimation methodology neither separates static vis-à-vis intertemporal correlations nor explicitly quantifies those intertemporal influences, instead providing an estimate of the static links of interventions, environments, and behaviours onto the observed nutrition status of children. This suggests that our empirical estimates might be underreporting the true magnitude of synergies by not accounting for their future (expectedly) positive correlations.
3. A country case study: Tunisia
3.1. Why Tunisia?
With prevalence levels around 1 per cent, Tunisia has long achieved the Millennium Development Goal Target 1C to halve, between 1990 and 2015, the proportion of people suffering from undernourishment, or to reduce it to below 5 per cent (FAO, Citation2015b). Most recent statistics specific to children’s nutritional status report low birth weight incidence at 7 per cent; moderate and severe underweight at 2 per cent; moderate and severe stunting at 10 per cent; and moderate and severe wasting at 3 per cent for 2008–2012 (UNICEF, Citation2014). These numbers suggest that Tunisian children’s nutritional status is better than the average for the Middle East and North Africa (MENA) region, which averages 7 per cent, 18 per cent, and 8 per cent, respectively, for moderate and severe underweight, stunting, and wasting. Practices including introduction of breastfeeding and semisolid and soft foods, as well as consumption of iodised salt, all place Tunisia among the best performers in that region – for countries for which information is available.Footnote3
However, the nutritional challenges in Tunisia do not relate to levels but, instead, to uneven progress. Improvements in stunting among Tunisian children are neither steady nor sustained over time, as indicated in . Under-five stunting prevalence has experienced frequent swings – associated in part with economic growth swings from low economic growth in the early 1980s to macroeconomic stabilisation in the second half of that decade, to faster economic growth post adjustment (see World Bank Citation2016). On occasions these changes have been large in magnitude, and most recently there has been an increase in stunting, which might be partially related to the effects of international food price crises in recent years and a setback in poverty reduction trends after the Arab Spring (see World Bank Citation2016). In addition, socio-economic differences among stunted children prevail: the stunting levels of children in the poorest quintile (of wealth) are double those of the richest quintile (). Consequently, notwithstanding its achievements, Tunisia still has work ahead to eradicate child malnutrition and sustain its progress over time.
3.2. Data sources
In Tunisia, the most recent comprehensive survey with nationally representative anthropometric measures and other health data is the 2011–2012 Multiple Indicator Cluster Survey (MICS) conducted by UNICEF, the National Institute of Statistics, and the Ministry of Development and International Cooperation of Tunisia. The main purpose of the 2011–2012 MICS dataset is to track progress toward the Millennium Development Goals (MDGs) and, more recently, the Sustainable Development Goals. It includes sections on health, nutrition, education, child protection, WASH, HIV/AIDS, and access to information technology. In addition to measures of height and weight for children less than five years old, the survey collects feeding practices for infants, immunisation history for children, food consumed in the last 24 hours for children under three years old, detailed information on health access, water and sanitation variables, and other socio-economic information about the household and its members. The 2011–2012 MICS is representative at the national, urban/rural, and regional level for households, women aged 15–49 years old, and children under five years of age. In addition, the survey provides a precalculated wealth index to proxy for poverty. MICS reports information for some 10,798 children under five years of age and 10,514 women in their reproductive age.
From the 2011–2012 MICS, it is possible to construct several definitions of adequacy, as discussed in the section below. Despite the two definitions already adopted in Tunisia, there is in practice a gap between ideal or desired definitions of adequacy and feasible definitions of adequacy from available data. compares ideal definitions of adequacy for all the dimensions considered in UNICEF’s framework with information available in the 2011–2012 Tunisian MICS.
Table 1. Ideal and feasible definitions of adequacy for child nutrition in Tunisia
This comparison highlights the gap between ideal and feasible definitions of adequacy in Tunisia, especially within the food and care dimensions. Instead, in the case of WASH, the definition of adequacy can be adjusted to account for several criteria, following the WHO/UNICEF/Joint Monitoring Programme (JMP) recommendation to include improved sources of water and sanitation, nonshared toilet facilities, and safe disposal of child faeces. We also compute and include in the definition of adequacy the condition of community-level improved sanitation, which is achieved with at least 75 per cent of households in the cluster have improved sanitation, following Andres et al. (Citation2014). Another variable of interest, hygienic hand-washing practices, is captured in the MICS, but its incidence is very low (less than 70 observations). This discourages its use in the empirical analysis.
3.3. WASH in Tunisia
Tunisia’s achievements in WASH access and adequacy lag behind nutrition. shows coverage rates for several WASH services taken separately, as well as adequacy rates for specific WASH services. For this purpose, we compute response categories for improved WASH facilities based on standard UNICEF/WHO/JMP definitions for monitoring access to improved facilities and consider in addition whether the household safely disposes of children faeces and whether the households’ use of toilets is shared. More comprehensive – and demanding – definitions of adequacy are not possible to construct in Tunisia due to data limitations (see Section 4).
Table 2. WASH-poverty profiles using adequate access rates, 2011–2012 (%)
When looking at the country as a whole, the first two rows of confirm high levels of improved water and sanitation, in excess of 91 per cent, with the urban population at close to universal access. However, poverty status is a strong predictor of more limited access to improved water or sanitation services (around 89% of access to improved water and 82% for improved sanitation). Evidence shows that the urban poor tend to have much higher access rates than the rural poor – a difference of more than 12 percentage points in both water and sanitation services, and even higher access rates than those reported by the rural population.
When adequacy components are taken into consideration, coverage rates significantly decline. Piped improved water and safe sanitation in the form of use of sewage and septic tank sanitation are enjoyed by significantly fewer Tunisians, especially if they are poor and reside in rural areas (41 and 35% of rural poor have access to piped improved water and use sewage and septic tank sanitation, respectively). The consideration of the type of toilet facility, concretely, whether or not is shared, also affects the levels of coverage, but much less than the safe disposal of child faeces. In fact, the most influential WASH-related behaviour observed in the MICS is the safe disposal of child faeces (Null et al., Citation2018), following WHO/UNICEF/JMP definitions convention (see for definitions adopted in this study). This practice is by far the least common among all household groups analysed: the full sample shows a rate of 2 per cent, with the urban poor having the highest rate of 6 per cent across population groups.
When looking at WASH services jointly, the last two rows of show different definitions of what could be considered adequate integrated WASH services. Adequacy under definition one includes only having access to improved water, improved sanitation (both at the individual and community levels), and a private toilet. The second definition also requires the safe disposal of child faeces in addition to the previous services. Under adequacy definition one, only 82 per cent of Tunisians are considered to have adequate WASH services, and most Tunisians with inadequate services are poor (55% adequacy) or rural (63% adequacy). When faecal disposal and toilet sharing are jointly taken into account, adequacy rates plummet to close to zero across all groups considered (about 2%). The poor, rural poor, and urban poor groups have the highest adequacy rate at only 3 per cent, and among all the other categories analysed, the adequacy rates are at or below 2 per cent.
4. Applying the synergies extension to UNICEF framework in Tunisia
reports the correlations of food-, health-, WASH-, and care-related interventions and child nutritional status. In doing so, it uses the HAZ score as the dependent variable capturing child malnutrition on a sample of children aged 0–24 months (the only age group for which MICS reports breastfeeding and prenatal variables). As indicated above, each of these dimensions has individual and interaction effects that are reported separately. For example, the coefficient ‘adequate in WASH only’ captures the correlation of Tunisian children’s nutritional status with successfully reaching adequate access to WASH services: in other words, this estimate quantifies the nutritional benefit of providing adequate access to WASH to all those Tunisian households that currently lack it. The same correlation is estimated for each of the other dimensions considered. Beyond these individual effects, other variables capture the effects of achieving, say, WASH adequacy when households benefit from one, two, or three other adequacies. That is the case of, for example, adequate WASH access and adequate food access. Those estimates include the correlation of the specific satisfied adequacies plus the interaction or synergy influences of having achieved these two adequacies. Results specific to WASH adequacies (, upper panel) are then compared with the correlations estimated for other dimensions that do not include WASH (that is, food, health services, and care adequacies; as also reported in , lower panel).Footnote4
Table 3. Effects of food, health, WASH, and care adequacies on child nutrition in Tunisia, 2011–2012 (using adequacy definition 1 and clustered standard errors)
Results shown in confirm first and foremost that improvements in the analysed drivers are not associated by themselves to large improvements in the nutritional status of Tunisian children. In effect, individual improvements in each dimension do not inevitably associate with a statistically significant improvement in the child’s nutritional indicator. This is likely a reflection of relatively good levels of nutrition at the baseline, on the one hand, and average improvements masking inequalities remaining across urban, rural, and poor populations, on the other. In addition, investments in one dimension forego the additional benefits that accrue from synergies across other investment dimensions. As shown in , column (1), several synergies across dimensions are found statistically significant. This is true across subsamples of poor, nonpoor, urban, and rural households, and across quartiles of household wealth. In all those subsamples, we can find synergies that are statistically significant larger than the correlation of single investments (see , columns 2–12).
Secondly, not all packages of adequacies are correlated with (statistically) significant improvements in children’s nutritional status. In other words, not any combination of adequate access to those services is closely associated with significant improvements in child nutrition. In fact, significant sets of integrated interventions vary across types of households (poor versus nonpoor, rural versus urban, and across their combinations) and, for some households, such as urban – especially nonpoor urban –, poor rural, and wealthier households, few combinations of these integrated interventions appear to relate to significant improvements in child stunting. This is either because of the already very low levels of stunting among children in urban areas and among wealthier households, which make additional improvements toward eradication harder to achieve, or because of the very low levels of adequacy among rural poor households that make marginal improvements insufficient to significantly improve stunting.
Importantly, adequate water and sanitation combined with other adequacies exhibit more frequently statistically significant correlation on child nutrition (upper panel in ). This is the case for adequate WASH combined with – each – food care and health dimension; (, column 1). But this is not always the case and in some contexts, this significant estimate of WASH related synergies is not observed. For example, in urban areas, neither adequate WASH and food access nor adequate WASH and health care are correlated with significant child HAZ score improvements; but they are in rural areas. Among nonpoor rural households, adequate WASH and care access; WASH and health care; and WASH and food have significant positive effects. In any case, the vast majority of coefficients reported for WASH have a positive sign, even though they are not significant. This indicates that WASH and other interaction effects may still be positively correlated with improved nutrition even though the magnitude of such correlations is not sufficiently large to suggest significant influences.
Adequacies other than WASH (lower panel in ) show somewhat different results; they are less likely to show positive and significant correlation into improved child nutrition. Also, some of the statistically significant coefficients are negative. This is mainly the case with care. This result does not necessarily mean that adequate care causes a deterioration of the nutritional status but that households receiving psychosocial care or practicing prolonged breastfeeding are most vulnerable to stunting.Footnote5 Both results, a lower propensity to report significant synergies among dimensions other than WASH and some negative correlation from care, are true for all considered subsamples defined by households’ socio-economic status, their location, or a combination of both (see , columns 2–11).
We also estimate alternative specifications using other definitions of adequate water and sanitation services, that is, using all improved water vis-à-vis only piped water, or all improved sanitation vis-à-vis sewerage or septic tank sanitation. Definitions also vary when considering whether or not child faeces are disposed of safely. Results do not change but become more statistically significant for WASH synergies. This is because now both within and between cluster variations go down from a definition that classifies 98 per cent of households as having inadequate WASH. When using a stricter definition of WASH adequacy that includes safe removal of child faeces and improved water and sanitation, adequate access brings more significant and positive correlations with improved child nutrition (see for the estimates of synergies using definition two). As this adequacy of WASH becomes harder to achieve, only synergies involving WASH and health services – that is, WASH and health; WASH, health and care; and WASH, health, care and food – remain systematically significant, largely reflecting the salience of community effects associated with faecal management.
Table 4. Effects of food, health, WASH, and care adequacies on child nutrition in Tunisia, 2011–2012 by wealth and location samples (using adequacy definition 2 and clustered errors)
We further explore the effects that a potential omitted variable bias might have. To the extent that variables not included in the current specifications – such as individual, household, and community characteristics – affect both the dependent and independent variables, the estimated coefficients may be biased upwards or downwards (Greene, Citation2012). For example, a disadvantaged single mother may live in a neighbourhood with weak access to services and be unable to invest sufficiently in the nutrition of her young children. In order to explore these effects, we re-estimate the synergies across adequacies for the full sample including a series of controls for individual, household, and community levels. These controls include the age and gender of the child,Footnote6 her birth order, and whether she was born in a multiple birth; the household size and composition, mother’s and household head’s education, gender of the household head, mother’s age and marital status, and wealth of the household; geographical location of the household and a proxy for the supply of services available to the community.Footnote7 It is worth noting that our original strategy of estimating synergies across subsamples of wealth and location of the household (columns 2–12 in ) already controls to a large extent for such potential omitted variable bias (as household socio-economics, wealth, and location are correlated to a considerable degree). Estimates for the conditioned specification on the full sample for adequacy definition one () suggest that the synergies found statistically significant in the unconditioned model remain so for the most part after introducing controls. Comparing the full unconditioned sample with the full conditioned model with all controls (column 4, ) confirms that all WASH synergies remain significant except for WASH and food. Furthermore, WASH, food and health and WASH, care, food and health now become statistically significant. For those WASH synergies that remain statistically significant across specifications, their estimated coefficients in the unconditioned model are smaller than in the conditioned specification, in an order of magnitude between 4 and 64 per cent of those coefficients reported in the conditioned model.Footnote8
Table 5. Effects of food, health, WASH, and care adequacies on child nutrition in Tunisia, 2011–2012 on conditioned full sample (using adequacy definition 1 and clustered standard errors)
These results have two important implications. First, the characteristics of the child expectedly constitute significant correlates for nutrition status, and so does her mother’s education and marital status. Gender of the household head and number of young children in the household also affect a child’s nutrition status, as well as the exposure of the household to shocks, and geographical location. Once controlled for these factors, household head’s education, household wealth, household size, and the proxy for the health care service do not have a statistically significant effect. These results are robust to different specifications of controls (see columns 2–4 in ). Second, the additional controls used in these estimates correlate with the key drivers of nutrition defined by UNICEF’s framework, thus influencing synergies estimates. In fact, the omission of those controls biases downward the magnitude of the synergies estimated in the unconditioned model but does not typically change their significance nor sign.
We also examine the effects of failing to cluster standard errors. Abadie, Athey, Imbens, and Wooldridge (Citation2017), Arellano (Citation1987), and Cameron and Miller (Citation2015) convincingly argue in favour of clustered errors when the sampling and intervention assignment designs are clustered. This is the case in Tunisia. First, data are randomly drawn from a random sample of district clusters. Second, the provision of water and sanitation services is not geographically random and depends on existing supply nearby, demand, population, and markets density, among others. Failing to cluster standard errors will wrongly treat observations as random, leading to lower standard errors. As expected, when results reported in , , and are estimated without clustered error adjustments, the statistical significance of our estimates typically increase, between 20 to 50 per cent of the average number of statistically significant synergies originally estimated with clustered errors (see and Supplementary Materials).
5. Conclusions
Our analysis provides three contributions to the existing literature on nutrition. First, it develops an econometric strategy to operationalise UNICEF’s conceptual framework for child nutrition. Second, it expands that conceptual framework to include synergies – that is, effects, or correlations, that are beyond individual correlations – on nutrition from WASH interventions. Third, it estimates for the first time – in a given country, Tunisia – the correlation that additional investments in WASH intervention packages and nutrition have across different population groups (poor and nonpoor) and residence (urban and rural). In doing this, the analysis does not settle for plain access/use variables, but constructs more data-demanding – and more policy relevant – adequacy indicators. Our findings provide relevant policy insights on both the correlations of WASH and child nutrition, as well as on how to increase the mutual influence of nutrition and WASH operations.
Notwithstanding data and methodological caveats, we conclude that adequate access to basic services matters in achieving improved child nutrition in Tunisia, a country whose progress in reducing stunting is notable, but rather uneven. WASH has a (statistically significant) positive link with improved child nutrition: more and better access to (improved) water and sanitation and nonshared toilets are likely to have significant beneficial effects on child nutrition. However, these correlations are neither uniform nor significant across WASH interventions, whether individual or as part of a combination of interventions. Yet, multiple adequacies with WASH present are found to be the most likely to have a significant impact on nutrition compared to adequate access to food, health, and care. But, critically, estimated effects differ across samples of poor, nonpoor, urban and rural, and across wealth quartiles of households. These two findings – synergies that are not systematically significant and distinctive subgroup effects – are consistent with the emerging evidence from RCTs on the apparent lack of impacts from integrating WASH and nutrition interventions.
For policy purposes, two key messages stand out for Tunisia. Progress toward satisfying a very strict level of adequacy in WASH or any single dimension of public service will not exhibit considerable correlation with child nutrition unless similar gains in other services are also attained. Neither will expectedly a single intervention package (for example, solar disinfection of water, provision of soap, hand washing groups, behavioural change campaigns on open defecation practices, or individual and community latrine installation combined with, namely, young child feeding interventions, expansion of public provision of health) bring uniform benefits across different types of households (poor–nonpoor, urban–rural, most–least vulnerable groups). Since correlations of interventions vary by group and area, on the one hand, and investments are limited on the other, interventions would have to selectively respond to specific needs of different types of households, locations, and vulnerabilities, before they associate themselves with even improvements in nutrition for Tunisian children.
While these messages are hardly surprising, their quantification is not so straight forward. In effect, the proposed analytical approach allows us to map differences across population groups and regions, estimate their magnitudes, and suggest priority areas of intervention to take on child undernourishment based on estimated correlations. Thus, our estimates suggest that specific interventions that lead to improved water and sanitation and food security are the most promising strategy for urban areas; while those ensuring improved water, sanitation, and health care, the most promising in rural areas; and improved water, sanitation, food, and health care among the poor. Any attempt to map recommended strategies becomes less precise when more specific groups are considered, that is, urban nonpoor vis-à-vis rural nonpoor or by quintile.
Although the methodological extension is only applied to Tunisia, it is susceptible to be replicated in multiple countries, even in relatively data poor contexts. To the extent that countries have repeated socio-economic household surveys, panel surveys and dedicated surveys that collect information on quality issues, the precision of estimated results should expectedly improve. Another direction of analysis refers to regional differences within country – in Tunisia, marked developmental gaps exist between western and eastern regions – and across samples of countries – say, for example, North Africa, the Middle East, or West Africa, to mention some.
Several caveats are worth mentioning. These findings draw from correlations rather than unambiguous causal effects. More effort is therefore needed to disentangle endogenous relationships; after all, investments are expected to be (even desired to be) targeted toward those most in need, that is, among groups and areas most lagging in adequate access. In addition, the lack of statistical significance of some synergies across specific subsamples may result from very few households reporting to have adequate access. That is, our estimations might lack the power to capture correlations in settings of low frequency. While this is certainly a concern, the fact that statistically significant correlations for the complete package of WASH, health services, care, and food security are found statistically significant across subsamples with few observations (fewer than 100) reassures the capacity of the empirical strategy to separate lack of statistical power from true no effects (see Table S1 in the Supplementary Materials).
Future analysis will need to consider synergies between other potential drivers of nutrition not included here – because they are not captured by the MICS – such as public awareness campaigns, improved education among future parents, safety nets, environmental degradation, and so forth. The analysis of adequate services needs validation across other health dimensions, for example, weight-for-age or the incidence of child diarrhoea (the latter was not possible to analyse in the case of Tunisia due to data constraints), and across different age groups (within childhood and between children and adolescents, for instance). It is worth emphasising that height-for-age is a long-term proxy for physical development. Yet, the proposed methodology is not able to disentangle intertemporal correlation and by failing to quantifying it, our estimated synergies most likely underestimate the true magnitude of synergies. However, to the extent that synergies across dimensions maintain their nature over time – that is, if WASH and health positively associate today’s HAZ, they will not have a negative impact on nutrition in the future –, our estimated synergies will provide a robust statistically significant albeit underreported estimate of the true relationship. Statically, however, this implies that only the correlation from the most relevant synergies in the short-term are likely to be captured. In addition, this nonexperimental analysis would greatly benefit from a comparison with a large, rigorous, and multisectoral intervention based RCT in Tunisia (yet to be developed). Finally, to make these results fully operational, further knowledge is still needed on programming aspects, such as, for example, the effectiveness of scaling up interventions or the introduction of results-based financing mechanisms.
Supplemental Material
Download PDF (563.1 KB)Acknowledgements
This work solely reflects the authors’ views and not necessarily those of the institutions they represent. Authors thank Leslie Elder, Abdel Rahmen El-Lahga, Michael Gnilo, Esther Loening, Eileen Murray, and Emmanuel Skoufias for helpful comments and feedback to earlier drafts as well as for insightful discussions on the subject, and Valeria Cuesta Lopez for support on data analysis. Remaining errors are entirely the responsibility of the authors.
Disclosure statement
No potential conflict of interest was reported by the authors.
Supplementary Materials
Supplementary Materials are available for this article which can be accessed via the online version of this journal available at https://doi.org/10.1080/00220388.2018.1516870
Notes
1. In some cases, WASH specific programmes may well have an impact on health and nutrition, such as, for example, community-led participatory-approach sanitation programmes that have proven successful in mobilising communities to build their own toilets and stop open defecation. A case in point is the Community-led total sanitation, CLTS, programme in Mali (see Pickering, Djebbari, Lopez, Coulibaly, & Alzua, Citation2015).
2. Food security measures the availability and consumption of various foods. Health services measures the child’s susceptibility to diseases due to lack of improved infrastructure (such as sanitation and drinking water) or lack of preventive health measures taken. Care measures the quality of care provided by the caretaker based on feeding and hygiene practices adopted and by the availability of the caretaker. Furthermore, this measure includes how well caretakers are supported in their child-rearing endeavours.
3. Other nutritional indicators, however, such as moderate and severe overweight or prevalence of anaemia among women at reproductive age are not so favourable, and remain short of international targets (namely, the Global World Health Assembly targets, as reported in International Food Policy Research Institute [IFPRI], Citation2014).
4. The results shown use clustered errors to account for both sampling design and assignment design (in how WASH investments are geographically distributed) involving clusters. As a robustness check, we also repeat the analysis without clustering errors which, expectedly, estimates more statistically significant – identical – coefficients on synergies. This confirms that wrongly assuming that observations are randomly sampled reduces the precision of standard errors. Results reported in Appendix and Tables S7 and S8 in Supplementary Materials.
5. For example, public awareness for increased breastfeeding that promotes better nutritional outcomes may be targeted to low income women that have poor living conditions such as inadequate WASH.
6. We also look into the specific effects of age and gender by controlling for the effects of three age groups, 0–5, 6–11, and 12–24 months aged children, divided by gender. Results, shown in the Supplementary Materials, underscore that there are distinctive effects for subgroups of children based on their age and gender. Such distinctive effects vary across samples, from national to urban and rural, as well as for different socio-economic groups. However, patterns are not sufficiently marked as to conclude that effects are stronger for a given subgroup or a particular sample. This is true regardless of the definition of adequacy used. See Tables S5 and S6 in the Supplementary Materials.
7. This proxy captures whether the household sought medical attention from a private or public clinic or pharmacy during the latest episode of illness of a child member of the household, as opposed to traditional doctor or friend/neighbour. Other variables that might have been potentially relevant to include in the analysis such as mother’s Body Mass Index, child stress, psychosocial care, household food diversity score were not possible to construct given the available data in MICS.
8. Alternatively, we included clusters as a control variable across all specifications and subsamples. Results are presented in Tables S2 and S3 in the Supplementary Materials. The control for the cluster is only statistically significant at times and, importantly, its effect is negligible in magnitude and does not revert any key messages on the sign of the correlations between WASH (and other dimensions) and nutritional status of children.
References
- Abadie, A., Athey, S., Imbens, G., & Wooldridge, J. (2017). When should you adjust standard errors for clustering? (NBER Working Paper No. 24003). Cambridge, MA: National Bureau of Economic Research.
- Akresh, R. S., Bhalotra, S., Leone, M., & Osili, U. (2012). War and stature: Growing up during the Nigerian war. American Economic Review, 102, 273–277.
- Alderman, H., Elder, L., Goyal, A., Herforth, A., Tanimichi Hoberg, Y., Marini, A., and Zaman, H. (2013). Improving nutrition through multisectoral approaches. Washington, DC: The World Bank. Retrieved from http://documents.worldbank.org/curated/en/2013/01/17211210
- Andres, L., Briceno, B., Chase, C., & Echenique, J. (2014). Sanitation and externalities: Evidence from early childhod health in rural India. (World Bank Policy Research Working Paper 6737).
- Arellano, M. (1987). Computing robust standard errors for within group estimators. Oxford Bulletin of Economics and Statistics, 49(4), 431–434.
- Barrera, A. (1990). The role of maternal schooling and its interaction with public health programs in child health production. Journal of Development Economics, 32, 69–91.
- Behrman, J., & Deolalikar, A. (1990). The intrahousehold demand for nutrients in rural South India: Individual estimates, fixed effects and permanent income. Journal of Human Resources, 25, 665–696.
- Behrman, J., & Wolfe, B. (1984). The socioeconomic impact of schooling in a developing country. Review of Economics and Statistics, 66, 296–303.
- Bhalotra, S., & Rawlings, S. (2011). Intergenerational persistence in health in developing countries: The penalty of gender inequality?. Journal of Public Economics, 95(3–4), 286–299.
- Bozzoli, C., Deaton, A., & Quintana-Domeque, C. (2009). Adult height and childhood disease. Demography, 46(4), 647–669.
- Bundy, D., De Silva, N., Horton, S., Patton, G., Schultz, L., & Jamison, D. (2016). Child and adolescent health and development: Realizing neglected potential. In D. Bundy, N. Silva, S. Horton, D. Jamison, & G. Patton (Eds.), Adult height and childhood disease (pp. 1–24)
- Cameron, C., & Miller, D. (2015). A practitioners guide to cluster-robust inference. Journal of Human Resources, 50(2), 317–372.
- Case, A., & Paxson, C. (2008). Stature and status: Height, ability, and labor market outcomes. Journal of Political Economy, 116(3), 499–532.
- Case, S., & Paxson, C. (2010). Causes and consequences of early life health. Demography, 47(Supplement), S65–S85.
- Chase, C., & Ngure, F. (2016). Multisectoral approaches to improving nutrition: Water, sanitation, and hygiene. Washington, DC: The World Bank.
- Clasen, T., Boisson, P., Routray, P., Torondel, B., Bell, M., Cumming, O., … Schmidt, W.-P. (2014). Effectiveness of a rural sanitation programme on diarrhoea, soil-transmitted helminth infection, and child malnutrition in Odisa, India: A cluster-randomised trial. The Lancet Global Health, 2, 645–653.
- Cuesta, J. (2007). Child malnutrition and the provision of water and sanitation in the Philippines. Journal of the Asia Pacific Economy, 12(2), 125–157.
- Dangour, A., Watson, L., Cumming, O., Boisson, S., Che, Y., Velleman, Y., … Uauy, R. (2013). Interventions to improve water quality and suppy, sanitation and hygiene practices, and their effects on nutritional status of children (review), the cochrane collaboration. New York, NY: Willey & Sons Limited.
- Du Preez, M., Conroy, R., Ligondo, S., Hennessy, J., Elmore-Meegan, M., Soita, A., and McGuigan, K.G. (2011). Randomized intervention study of solar disinfection of drinking water in the prevention of dysentery in kenyan children under 5 years. Environmental Science and Technology, 45(11), 9315–9323.
- Du Preez, M., McGuigan, K., & Conroy, R. (2010). Solar disinfection of drinking water in the prevention of dysentery in South African children aged under 5 years: The role of participant motivation. Envinonmental Science and Technology, 44(22), 8744–8749.
- Fanzo, J. (2014). Strengthening the engagement of food and health systems to improve nutrition security: Synthesis and overview of approaches to address malnutrition. Global Food Security, 3, 183–192.
- FAO. (2015a). Designing nutrition-sensitive agriculture investments. Checklist and guidance for programme formulation. Rome: Author.
- FAO. (2015b). Hunger map. Author. Retrieved from http://www.fao.org/3/a-i4674e.pdf
- FAO/WHO. (2014). Second international conference on nutrition (ICN2), Rome declaration on nutrition and the framework. Rome: FAO.
- Glewwe, P. (1998). Why does mother’s schooling raise child health in developing countries? Evidence from Morocco. Journal of Human Resources, 34(1), 124–159.
- Glewwe, P., Jacoby, H., & King, E. (2001). Early childhood nutrition and academic achievement: A longitudinal analysis. Journal of Public Economics, 81(3), 345–368.
- Greene, W. (2012). Econometric analysis, 7th Edition. New York: Stern School of Business, New York University.
- Haddad, L., & Hoddinott, J. (1990). Women’s income and boy-girl anthropometric status in the Côte d’Ivoire. World Development, 22(4), 543–553.
- Hammer, J., & Spears, D. (2016) Village sanitation and child health: Effects and external validity in a randomized field experiment in rural India. Journal of Health Economics, 48, 135–148.
- Heckman, J. J., Moon, S. H., Pinto, R., Savelyev, P. A., & Yavitz, A. (2010). The rate of return to the highscope perry preschool program. Journal of Public Economics, 94(1–2), 114–128.
- Heckman, J. J., Pinto, R., & Savelyev, P. (2013). Understanding the mechanisms through which an influential early childhood program boosted adult outcomes. American Economic Review, 103(6), 2052–2086.
- Hoddinott, J., & Kinsey, B. (2001). Child growth in the time of drought. Oxford Bulletin of Economics and Statistics, 63(3), 409–436.
- Hoddinott, J., Rosegrant, M., & Torero, M. (2012). Challenge paper: Hunger and malnutrition. Copenhagen Consensus. Copenhagen: Copenhagen Consensus Challenge Paper.
- Horton, S. (1986). Child nutrition and family size in the Philippines. Journal of Development Economics, 23, 161–167.
- Hunter, P. R., & Prüss-Ustün, A. (2016). Have we substantially underestimated the impact of improved sanitation coverage on child health? A generalized additive model panel analysis of global data on child mortality and malnutrition. PLoS ONE, 11(10), e0164571. doi:10.1371/journal.pone.0164571
- IFPRI. (2014). Global Nutrition Report 2014 Tunisia. Author. Retrieved from http://globalnutritionreport.org/files/2014/12/gnr14_cp_tunisia.pdf Retrieved from
- Keller, W. (1988). The epidemiology of stunting. In L. Nestle (Ed.). Linear growth retardation in less developed countries, nestle nutrition workshop series (pp. 17–39). Waterlow JC, NY: Raven Press.
- Larsen, D. A., Grisham, T., Slawsky, E., & Narine, L. 2018. An individual-level meta-analysis assessing the impact of community-level sanitation access on child stunting, anemia, and diarrhea: Evidence from DHS and MICS surveys. PLoS Negl Trop Dis, 11(6), e0005591. doi:10.1371/journal.pntd.0005591
- Luby, S. P., Agboatwalla, M., Feikin, D., Painter, J., Billhimer, W., Altaf, A., & Hoekstra, R. M. (2006). Combining drinking water treatment and handwashing for diarrhoea prevention: A cluster randomized trial. Tropical Medicine and International Health, 11(4), 479–489.
- Luby, S. P., Agboatwalla, M., Feikin, D., Painter, J., Billhimer, W., Altaf, A., & Hoekstra, R. M. (2004). Effect of intensive handwashing promotion on childhood diarrhea in high-risk communities in Pakistan: A randomised controlled trial. Journal of the American Medical Association, 291(21), 2547–2554.
- Luby, S. P., Rahman, M., Arnold, B. F., Unicomb, L., Ashraf, S., Winch, P. J., ... Colford, Jr., J. M. (2018). Effects of water quality, sanitation, handwashing, and nutritional interventions on diarrhea and child growth in rural Bangladesh: A cluster randomised controlled trial. Lancet Global Health, 6(3), e302–e315. doi:10.1016/S2214-109X(18)30005-6
- Maccini, S., & Yang, D. (2009). Under the weather: Health, schooling, and economic consequences of early-life rainfall. American Economic Review, 99(3), 1006–1026.
- Mahmud, I., & Mbuya, N. (2015). Water, sanitation, hygiene and nutrition in Bangladesh: Can building toilets affect children’s growth? A world bank study. Washington, DC: The World Bank. doi:10.1596/978-1-4648-0698-8
- Null, C., Stewart, C., Pickering, A., Dentz, H., Arnold, B., Arnold, C., … Colford, J. (2018, January 28). Effects of water quality, sanitation, handwashing, and nutritional interventions on diarrhoea and child growth in rural Bangladesh: A cluster randomized controlled trial. The Lancet Global Health, 6, PE316–E329. Published online.
- Patil, S., Arnold, B., Salvatore, A., Briceno, B., Ganguly, S., Colford, J. M., … Hunter, P. R., et al. (2014). The effect of india’s total sanitation campaign on defecation behaviors and child health in Rural Madhya Pradesh: A cluster randomized contolled trial. PLOS Medicine, 11(8), 1–16.
- Pickering, A. J., Djebbari, H., Lopez, C., Coulibaly, M., & Alzua, M. L. (2015). Effect of a community-led sanitation intervention on child diarrhoea and child growth in rural Mali: A cluster-randomised controlled trial. Lancet Glob Health, 3, e701–e711.
- Prentice, A. M., Ward, K. A., Goldberg, G. R., Jarjou, L. M., Moore, S. E., Fulford, A. J., & Prentice, A. (2013). Critical windows for nutritional interventions against stunting. American Journal of Clinical Nutrition, 97(5), 911–918.
- Ruel, M., Alderman, H., & The Maternal and Child Nutrition Study Group. (2013). Nutrition-sensitive interventions and programmes: How can they help to accelerate progress in improving maternal and child nutrition? The Lancet, 382, 536–551.
- Scaling Up Nutrition. (2012). Movement strategy [2012-2015]. http://scalingupnutrition.org/wp-content/uploads/2012/10/SUN-MOVEMENT-STRATEGY-ENG.pdf.
- Scaling Up Nutrition. (2017). SUN countries. Retrieved August 17, 2017, from http://scalingupnutrition.org/
- Schultz, T. P. (2002). Wage gains associated with height as a form of health human capital. American Economic Review, 92(2), 349–353.
- Skoufias, E. (1999). Parental education and child nutrition in Indonesia. Bulletin of Indonesian Economic Studies, 35(1), 99–119.
- Skoufias, E. (2016). Synergies in child nutrition: Interactions of food security, health and environment, and child care. (World Bank Policy Research Working Paper Number 7794).
- Smith, L., & Haddad, L. (2014). Reducing child undernutrition: Past drivers and priorities for the Post-MDG era. (IDS Working Paper 441).
- Spears, D. (2013). How much international variation in child height can sanitation explain? (World Bank Policy Research Working Paper 6351). Washington, DC: World Bank.
- Steckel, R. (1995). Stature and the standard of living. Journal of Economic Literature, 33(4), 1903–1940.
- Strauss, J., & Thomas, D. (1998). Health, nutrition, and economic development. Journal of Economic Literature, 36(2), 766–817.
- UNICEF. (1990). Strategy for improved nutrition of children and women in developing countries. New York, NY: UNICEF.
- UNICEF. (2014). Progress on drinking-water and sanitation: 2014 update, report of the WHO/UNICEF joint monitoring programme on water supply and sanitation. New York, Geneva: United Nations Children’s Fund and World Health Organization.
- Victora, C., Adair, L., Fall, C., Hallal, P., Martorell, R., Richter, L., & Sachdev, H. S. (2008). Maternal and child undernutrition: Consequences for adult health and human capital. The Lancet, 371(9609), 340–357.
- Webb, P., & Block, S. (2004). Nutrition information and formal schooling as inputs to child nutrition. Economic Development and Cultural Change, 52(4), 801–820.
- WHO. (2015). Improving nutrition outcomes with better water, sanitation and hygiene: Practical solutions for policies and programmes. Geneva: World Health Organization.
- World Bank. (2013). Improving nutrition through multi-sectoral approaches. Washington, D.C.: Author.
- World Bank. (2016). Tunisia poverty assessment 2015. Washington, DC: Author.
Appendix Table A1. Effects of food, health, WASH, and care adequacies on child nutrition in Tunisia, 2011–2012 (using adequacy definition one and non-clustered standard errors)