?Mathematical formulae have been encoded as MathML and are displayed in this HTML version using MathJax in order to improve their display. Uncheck the box to turn MathJax off. This feature requires Javascript. Click on a formula to zoom.
ABSTRACT
We propose the construction of a Digital Knowledge Economy Index, quantified by way of measuring content creation and participation through digital platforms, namely the code sharing platform GitHub, the crowdsourced encyclopaedia Wikipedia, and Internet domain registrations and estimating a fifth sub-index for the World Bank Knowledge Economy Index for year 2012. This approach complements conventional data sources such as national statistics and expert surveys and helps reflect the underlying digital content creation, capacities, and skills of the population. An index that combines traditional and novel data sources can provide a more revealing view of the status of the world’s digital knowledge economy and highlight where the (un)availability of digital resources may actually reinforce inequalities in the age of data.
1. The knowledge economy and individual activity
In much the same way that the Industrial Revolution transformed most of the world in the eighteenth and nineteenth centuries, many reference the transformative power of an informational revolution today (Brynjolfsson & Mcafee, Citation2016; Schwab, Citation2016). This information has been brought about by a widespread availability of information and communication technologies (ICTs) combined with a general global economic restructuring towards services, technology, and human capital. Eager to tap into economic and social opportunities potentially afforded by the information revolution, many governments of low-income countries have designed policies to guide their transformation into so-called ‘knowledge economies’ (World Bank, Citation2007).
This includes a range of approaches under the various banners of an ‘information society’, ‘information economy’, ‘knowledge society’, and ‘digital economy’. Whilst these terms do not have clear universally accepted definitions, they emphasise the growing reliance on human capital and the use of information technologies in contrast to the focus on primary sectors of the economy in earlier eras.Footnote1
In most metrics used in the literature, high-income countries are generally assumed to already be part of the global knowledge economy (Bałtowski & Pastuszak, Citation2008; Huggins, Citation2008; Nguyen & Pham, Citation2011) while the majority of low-income (/developing) countries are in various stages of becoming one (Carmody, Citation2013; Kolo, Citation2009; Piaggesi & Chea, Citation2011). Policy-makers in many sub-Saharan African (SSA) countries, in particular, are eager to tap into the new opportunities afforded by the information revolution, and both ICT sector policies as well as voices in the donor and private sectors are optimistic about the potentials of such a transformation (Graham, Citation2015; Friederici, Ojanperä, & Graham, Citation2017). For instance, the Ghanaian policy states:
The emergence of information age has brought to the fore, the important role that information, knowledge, and technology can play in facilitating socioeconomic development. The effective use of information and knowledge is becoming the most critical factor for rapid economic growth and wealth creation, and for improving socioeconomic wellbeing. (Ministry of Communications, Government of Ghana, Citation2003, p. 7)
This assumption that high-income countries are knowledge economies (with the inverse assumption for low-income countries) is problematic for a few reasons. All countries have mixed economies relying upon various combinations of natural resources, material factors, and knowledge generation and utilisation. Within each country there is considerable spatial variation including the contrast between urban and rural regions. By focusing on the knowledge economy (by fusing teleological narratives of modernisation and technological determinism), policies and national narratives often envision low-income countries as simply leapfrogging past less efficient technologies and industries and straight into the more advanced ones with a focus on human capital (Friederici et al., Citation2017).Footnote2 This paper contributes to the debate that asks how we offer empirical interventions that move away from such strategies of over-simplification and technological determinism in order to ask how policies can successfully promote the expansion of the knowledge economies around the world.
Specifically, it asks, how do we develop relatively robust and comparable data at the global level measuring the knowledge economy? An emerging body of literature investigates the growth of the knowledge economy in sub-Saharan Africa, but beyond comparing some of the region’s countries to countries in neighbouring regions such as the Middle East (Amavilah, Asongu, & Andrés, Citation2017), or benchmark countries such as South Korea (Asongu, Citation2017), these studies do not compare the region’s countries to other countries of the world. While these studies offer important insights into knowledge economy development in Africa, a topic that is surprisingly understudied, they tend to focus on certain factors such as formal institutions (Andrés, Asongu, & Amavilah, Citation2015) or globalisation (Amavilah et al., Citation2017) driving the knowledge economy development or certain segments of the knowledge economy impacting specific areas such as the financial sector (Asongu, Citation2014) and starting, doing, and ending business (Tchamyou, Citation2017) in African countries. They do not provide a global comparison of the region’s countries’ attainment of the knowledge economy and do not include variables on digital participation in their conceptualisations of the knowledge economy. The first challenge is recognising that beyond these national and regional case studies, there are only a few indices (created by institutions such as the Organisation for Economic Co-operation and Development and World Bank) that are designed to comparatively measure the knowledge economy at a cross-national level. These indices employ different sets of variables from one another, as well as differing methodologies: resulting in significantly divergent measurements of the knowledge economy.
The second and more fundamental challenge is the quality of the data series used in these indices, which are often collected by national statistical institutions. The indices rely on the accuracy and cross-sectional as well as longitudinal representativeness of their data sources, which may be called into question in low-income contexts and SSA in particular. Research indicates that the region suffers from a ‘statistical tragedy’, whereby weak capacity, inadequate funding, and lack of coordination have resulted in unreliable statistical estimates (Devarajan, Citation2013; Jerven, Citation2013a, Citation2013b; Lehohla, Citation2008). Further, many of the variables comprising the existing indices are collected using surveys that generalise the finding from a subsample to the larger population, and very few of them feature variables that directly measure total volume of knowledge-intensive activities in the country. Existing knowledge economy indices (which are discussed in greater detail in Section 2) tend to include a combination of attainment in education, innovation, economic competitiveness, and infrastructure. Rarely, if ever, do they include variables estimating knowledge-intensive user activity (which should be a key metric of the knowledge economy).
The proliferation of mobile computing devices and everyday digital activity (social media and networking, team working platforms, communications, and so forth) leave behind a wealth of digital traces about the users and the tasks they perform (Kitchin, Citation2014). Given the centrality of human capital to the definition of the knowledge economy, we therefore argue that it is imperative that any index also measures actual knowledge-intensive activity. Accounting for this activity offers a valuable proxy of digital skills and knowledge, as they are actually being used, and helps to define the knowledge economy based more on activity than potential.Footnote3
Given the traditional marginalisation of SSA from relevant statistics, its extremely poor ranking in statistics that do exist, and the potential and importance placed on the region’s participation in knowledge economies (Aubert & Reiffers, Citation2004), this paper focuses much of its enquiry onto the region. We hope that this regional focus offers a useful way to empirically ground itself into a critical and reflexive analysis of how knowledge economies are measured.
2. Parsing the many metrics for knowledge economies
The knowledge economy is not only challenging to define conceptually; it is also notoriously difficult to measure or compare between countries. Since the 1990s, various assessment frameworks have defined and redefined the dimensions of the knowledge economy. However, indices measuring the level of attainment or readiness to compete in the knowledge economy have emerged only over the past decade (see ).
Table 1. Knowledge economy frameworks, indices, and related indices focusing on digitalisation
Table 2. Countries omitted due to inflated domain registrations
A common issue with these indices is the universality of coverage, particularly for countries from SSA. Only the Knowledge Index (KI) and Knowledge Economy Index (KEI) (from the World Bank) and the Web Index (from the WWW Foundation) come close to providing metrics globally. The two World Bank Indices include 146 countries with 31 from SSA, while the Web Index includes 86 countries with 21 countries from SSA.
The KEI measures how close a country comes to having a knowledge economy with a score between 10 (best) and 0 (worst). Sweden tops the list with the KEI scoring 9.43. For comparison, the United States ranks 12th with a score of 8.77 and the highest-ranking African country is Mauritius at 67th with a score of 5.52. The KI uses the same scale to measure the competitiveness of countries in the knowledge economy. Sweden also scores highest in the KI with a score of 9.38, for contrast, the United States is 9th with a score of 8.89 and South Africa is the top ranking African country with a rank of 69 and a score of 5.11.
The Web Index, in contrast, measures the World Wide Web’s contribution to social, economic, and political progress on a scale of 0 (worst) to 100 (best). Denmark is the highest-scoring country with a score of 100. In contrast, the United States ranks 6th with a score of 94.52. Mauritius, as the highest-scoring country in SSA, ranks 40th with a score of 49.6. It is worth noting that the average score for countries in SSA is actually even much lower at 22.64.
The Digital Evolution Index attempts something similar by looking at both drivers and barriers that shape how countries evolve into digital economies. Singapore ranks highest with a score of 56.21, the United States ranks 6th with a score of 51.79, and South Africa comes in at 33rd out of 50 with a score of 16.98. It is worth noting that there are actually only two other sub-Saharan African countries included on the list (Kenya and Nigeria; with Nigeria being dead last).
In sum, sub-Saharan African countries tend to sit at the bottom of existing indices. Notable exceptions to this general pattern are Mauritius and South Africa (and in a few cases Botswana and Namibia). More problematic is that the majority of the indices measuring knowledge economies do not even include most countries from the region (see ). This likely results from both the paucity of available data and the questionable reliability of existing data.
Figure 1. The geographical coverage of indices measuring knowledge economy.
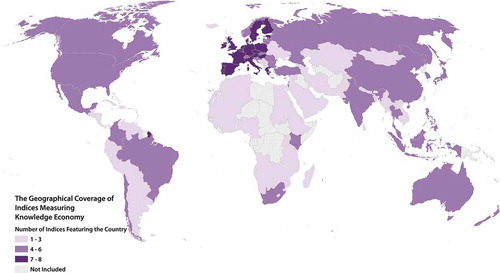
The fact that data about knowledge economies has its own geography, focusing on some parts of the world and excluding others, means that policy-makers in parts of the world with sparse data necessarily have to draw on the experiences of other/distant places when evaluating domestic opportunities and challenges. This has been shown in the context of African ICT policies, where despite drastically differing contexts, policies tend to refer to the experiences of high-income countries, as predictive of envisioned development trajectories for SSA (Friederici et al., Citation2017). An example of an ICT and knowledge-intensive initiative developed based on the perspectives and experiences in the United States and Europe is the One Laptop per Child programme, which has been criticised for being unaffordable for the poorest countries and ineffective without substantial additional resources into infrastructure development, teacher training, curriculum development, and reforms in assessment (Kraemer, Dedrick, & Sharma, Citation2009; Warschauer & Ames, Citation2010). Thus, unless alternative metrics, and indeces, to measure knowledge economies are developed, policies and projects will continue to be entirely reliant on the experiences of North America and Europe.
Existing indices focus exclusively on traditional data sources, often derived from quantitative national aggregates and qualitative expert surveys. The national statistical institutions necessary for the successful connection of these data are frequently underfunded in SSA and face challenges in capacity in statistical development (Devarajan, Citation2013; Jerven, Citation2013a; Lehohla, Citation2008). Large parts of the region’s economic activity operates in the ‘informal economy’, which has been difficult to account (Jerven, Citation2013a). After the economic collapse of the 1980s and 1990s, or the so-called ‘lost decades’, much of the continent has struggled to recover from the period of structural adjustment: making the funding of statistical agencies in a world of scarce resources even more difficult. Further, the need to collect appropriate data for poverty monitoring and for results based management driven by the development community have left national statistical institutes (already in a context of weak capacities) with changing demands and few proven implementation strategies. While many dimensions of the knowledge economy are notably difficult to measure, where consistent quantitative data is not available, existing indices resort to qualitative data derived from expert opinion surveys. As a result, the construction of the indices using traditional quantitative and qualitative data produces a measurement of the knowledge economy that for one part derives from quantitative performance data (sometimes of questionable quality) and for another is based on the estimation of experts.
Facing the already formidable challenges of existing data collection, few of these indices attempt to include metrics on individual activities related to knowledge creation. Such data are used in just two instances: the Web Index’s measurements of dominant social network monthly active users as part of its sub-index on ‘Relevant Content and Use’, and The Digital Evolution Index’s measures use of informational websites and social media usage as part of its sub-index on ‘Internet and Social Media Savviness’. Both indices pertain to the knowledge economy, but measure the web’s contribution to social, economic, and political progress in the case of Web Index and evolution into a digital economy in the case of the Digital Evolution Index.
Without including measures of individual knowledge creation, indices are misaligned, focused on potential rather than action. Moreover, it is possible to collect activity patterns directly through digital platforms providing the opportunity to use a wealth of available data. Thus, this paper proposes the construction of a digital knowledge economy index, building on the KEI developed by the World Bank – chosen because of its high visibility (Asongu, Citation2012; Driouchi, Azelmad, & Anders, Citationn.d.; Nguyen & Pham, Citation2011; Saltelli, Citation2006; Wielicki & Arendt, Citation2010). As we are interested in integrating measures of digital participation in the evaluation of such prospects, the paper calibrates the KEI with bespoke digital data on capacities and skills (measured through content creation and participation on digital platforms). It is our hope that this proof of concept will help to further the inclusion of actual measures of knowledge creation into key metrics, such as the KEI.
We first discuss the data in Section 3, proceeded by presentation of the index methodology in Section 4, conclude with a discussion of the ranking and scores of sub-Saharan Africa on this index in Section 5, and the broader implications of these measurement choices in Section 6.
3. Data
The data used in constructing our Digital Knowledge Economy Index (DKEI) are aggregated to the country level and have yearly observations. The index uses the base of the World Bank Knowledge Economy Index, but adds a fifth sub-index that includes indicators of participation and digital content creation of knowledge resources as represented by collaborative coding activity, edits to Wikipedia articles, and internet domain registrations. The data for the digital participation and content creation sub-index is obtained through bespoke methods that allow scraping information directly from websites and other online resources.
3.1. Collaborative coding
In order to include an estimation of programming skills in our knowledge economy sub-index we use data retrieved from GitHub to approximate these skills around the world. GitHub is a web-based repository hosting service, which allows users to share and collaborate on software development. With over 15 million users (GitHub, Citation2016), GitHub is by far the most popular code-hosting service for software development; competing platforms such as SourceForge, with 3.7 million (SourceForge, Citation2016), and Launchpad, with 3.1 million (Launchpad, Citation2016), have far fewer users. Measuring collaborative coding provides a way to account for programming skills, which are fundamental for many knowledge-rich activities and industries such as software development.
Coding activity is operationalised by measuring the volume of GitHub ‘commits’. Commits are instances of content contribution to GitHub, such as revisions to the code of a software project. The raw commit data that we retrieve through the site’s application programming interface (API) is not automatically associated with a country. In order to associate the commit volume with a country, we geocode commits submitted by users that have a parse-able location attribute. We then use the Edina Unlock Places geocoding API to look up country names.
Although we consider the GitHub data to be a suitable proxy for programming skills worldwide, the dataset does have some limitations. Only a quarter of the users indicate their location, and these users account for approximately 45 per cent of total commits. However, there is no reason to suspect that a user’s choice to indicate their location is subject to significant geographic biases. The process of geocoding user locations is also subject to a margin of error, though recent studies suggest this margin is likely to be narrow (Lima, Rossi, & Musolesi, Citation2014). We manually review both every toponym attached to over 10,000 commits in the dataset, and the most popular toponyms per country in order to ensure that our geocoding process is a good estimate of the user locations. GitHub commits are thus an appropriate, if imperfect, proxy for otherwise hard to measure programming skills.
3.2. Wikipedia edits
Wikipedia is the world’s leading encyclopedia project, and is written collaboratively by volunteers. Anyone with internet access can create or edit Wikipedia articles. The platform is widely considered as one of the largest reference websites and every day tens of thousands of edits and thousands of articles are created (Wikimedia, Citation2016). We consider the volume of Wikipedia edits to approximate a country’s capacity to expand and improve the quality of the knowledge contained in this open resource. In other words, the number of Wikipedia edits published from within a country indicates the volume of contributions to the world’s largest encyclopaedia. We obtained the data on editing traffic per country as outlined in Graham, Straumann, and Hogan (Citation2015). The dataset is provided by Wikimedia and samples editing activity across all Wikipedia language versions. The geographic origin of every 1,000th edit is analysed and then added to country-level counts.
While the majority of the contributors to Wikipedia are amateurs writing on non-specialist topics, some editing activity may add false or debatable information or is carried out with the intention of vandalism. Our dataset does not contain metrics on the quality or appropriateness of the Wikipedia edits, but we do not have any reason to suspect that the propensity for vandalism in the editing activity would have a particular geographic bias. Further, the proportion of vandalism has been estimated to account for only 1 or 2 per cent of all edits (Kittur, Suh, Pendleton, & Chi, Citation2007). Despite these limitations, we regard Wikipedia edits as a unique proxy for digital knowledge creation.
3.3. Domain registrations
The volume of domain registrations within a country provides an indicator of the quantity of internet content produced around the world. While it is possible to post websites on the internet without a domain name – through using more cumbersome IP addresses – domains represent a key means by which internet is organised, how search results are filtered and prioritised, and how anyone or any institution establishes a recognisable online presence or brand. With over 330 million domains registered worldwide – including a vast expansion of top-level domains (TLDs) beginning in 2014 – domain names provide an important indicator of the volume of codified information and knowledge that is accessible on the internet. The careful evaluation of the location of the person or institution who registered the domain (called the registrant) offers a unique perspective into the online presences (or absences) of content from countries.
To operationalise this variable, we sum the three different types of TLDs, including country-code TLDs (ccTLDs) such as .cm for Cameroon, generic TLDs (gTLDs) such as .com or .net, and internationalised TLDs (IDNccTLDs) that are ccTLDs in non-Latin script or alphabet, such as Arabic, or characters such as Chinese. The processes of associating domain data to countries of registration required different processes for different TLDs. CcTLDs and IDNccTLDs were assigned to their respective countries (for example all .cm domains were assigned to Cameroon), since previous research characterises these types of TLDs as emblematic of local content production (Janc, Citation2016; Zhen, Wang, & Wei, Citation2015; Zook, Citation2001) and available registry research shows that 90 per cent or more of the domains registered with standard ccTLDs are held by registrants within the associated country. In addition, it is important to recognise that some ccTLDs are used in non-standard ways. For example, some ccTLDs are primarily used as abbreviations (such as Tuvalu’s .tv domain for the entertainment industry), or form a word in a certain language (such as .me or .nu), or because they evoke connotations (such as .io being used for start-ups) (Graham, De Sabbata, & Zook, Citation2015).
The top-level-domain ‘hacks’ are for ccTLDs from countries that have either 1) extremely small populations, 2) historically and currently have very low internet use, or 3) both. Although many of these ccTLDs were known a priori, we compared the number of ccTLDs with the number of individuals with internet access for each country. If the number was abnormally high in countries with very low internet penetration, we sought further information regarding the use of the ccTLD and discarded any countries whose ccTLD registrations were clearly inflated by these types of domain hacks.Footnote4
Our ability to eliminate certain ccTLDs, however, does not mean that we have no measure of domain names in the associated countries because we also have the number of gTLDs per country. This is particularly important for many sub-Saharan African countries since registrants often prefer gTLDs as they are lower in cost and easier to obtain than a domain from the country’s ccTLDs. In order to locate gTLDs, their WHOIS record (record containing the address details of the person or organisation registering a domain name) has been geocoded and each domain has been assigned to the respective country. Since the retained TLDs generally have a clear connection to the address of the person or organisation who registered them, we regard the TLD dataset to offer a unique proxy of online content creation.
4. Methodology
The framework and methodology of the World Bank Knowledge Economy Index is used as a basis for our Digital Knowledge Economy Index. We add a fifth sub-index measuring digital participation, which carries a weight equal to the other sub-indices of the KEI measuring education, innovation, ICTs, and the economic institutional regime. The innovation sub-index and the digital participation sub-index are included in their weighted forms, as standardising the score with respect to population size offers a clear estimate of the countries attainment of the variables that are included in these sub-indices.Footnote5
To make the fifth sub-index comparable to the existing four sub-indices, we follow the same normalisation procedure as the KEI. Since the digital participation variables are measured in different units and on different scales, we bring the variables to a common standard of measurement through the following procedure:
We record the raw data (u) for the digital participation variables.
We rank the countries based on their absolute values (rank u). Country with the highest value ranks 1, the second best 2, and so on. Countries with the same value are allocated the same rank.
The number of countries ranking higher than a particular country (Nh) is calculated for each country in the sample.
The following formula is used to normalise the scores for each country for each variable according to their ranking within the sample and in relation to the total number of countries in the sample (Nc):
The country scores on the fifth sub-index are calculated by taking a simple average of the normalised country scores for each of the included variables.Footnote6 The digital knowledge economy score for each country is then calculated as the simple average of the five sub-index scores. We gather the scores for each country into an index, which we call the Digital Knowledge Economy Index (DKEI). Based on the DKEI, we also calculate a rank of the included countries, where the country, which performs best, is ranked one; the second best is ranked two and so forth.
Where a data point is missing for more than one variable within the fifth sub-index, we remove the observation in order to maintain data integrity. This is in line with the KEI methodology, which allows data to be missing for at most one variable per sub-index.Footnote7
The digital participation variables are measured for year 2013, while the variables included in the KEI are measured for year 2012. While we do not suspect that the one-year gap between the measures is large enough to warrant further corrective measures, we monitor the relationship of the fifth sub-index to the other sub-indices closely throughout the analysis.
5. Results
To facilitate discussion of the results, we mapped the quintiles of the DKEI scores (see ).Footnote8
Figure 2. DKEI scores (quintiles).
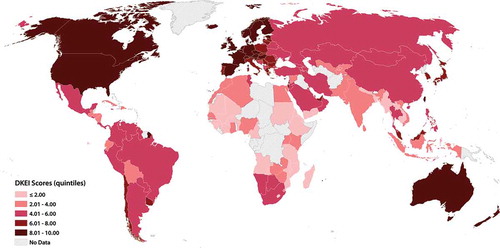
The countries with DKEI scores in the lowest quintile are almost exclusively located in Africa. A few countries in SSA score in the second lowest quintile, while South Africa, Namibia and Botswana land in the middle quintile. The countries scoring in the highest quintile are chiefly located in Europe and North America (apart from a few Asian countries, Australia, and New Zealand). The second highest quintile contains large parts of Latin America, Eastern Europe, and Asia.
Next, we calculated differences for the change in the ranks between the DKEI and KEI (see ). In the figure, the curve indicating rank change is blue for countries that rank higher in the DKEI than in the KEI, red for countries that rank lower in the DKEI than in the KEI, and yellow for countries that rank the same. The country names are typeset in bold font for Sub-Saharan African countries.
Figure 3. Rank comparison diagram of KEI (Left) and DKEI (right) 2012 rankings.
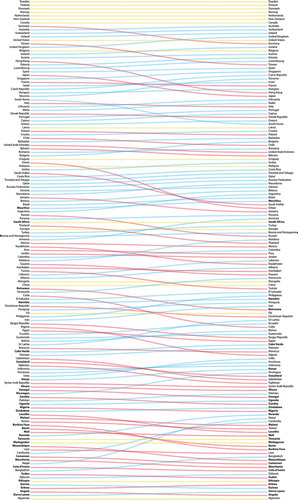
Interestingly, the ranking of the DKEI rather closely resembles the KEI, with seven of the highest-ranking countries on KEI maintaining their ranks on DKEI. However, the countries that rank in the upper and middle ranges of the DKEI have largely improved from their KEI ranking. On the contrary, countries that rank in the lowest ranges of the DKEI, tend to score worse than they do in the KEI. The majority of sub-Saharan African countries belong to this final group (see and Table 4 in Supplementary Materials). While Mauritius and South Africa continue to score higher than the rest of the group in the DKEI, the ranking of most sub-Saharan African countries declines when the digital participation sub-index is included in the ranking.
Figure 4. The geography of the differences between the KEI and the DKEI scores.
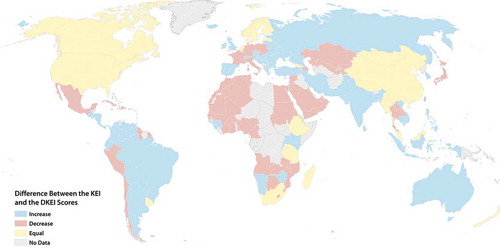
For the sub-Saharan African countries whose ranking is lower in the DKEI than in the KEI, the average change by which the ranking has declined is 2.5 ranks. While the change in rank of most of the countries in this group is around the average drop, the ranking of a few countries dipped substantially more, including Burkina Faso (−7), Botswana (−6), Benin (−5), Lesotho (−5), Swaziland (−4), and Mozambique (−4). Some of the continent’s countries rank higher in the DKEI than in the KEI, and the average change by which the ranking has increased within this group is two ranks. Notable deviations from these averages include Rwanda and Kenya, which improved by six and three ranks, respectively.Footnote9 These two countries have invested heavily in digitalisation over the past two decades, which might be reflected in a higher measure of digital participation relative to other countries in the region. The countries with highest decreases between the rankings include some of the countries with least access and use of ICTs during the time of the analysis (International Telecommunication Union, Citation2012). The literature on the African knowledge economy often mentions that knowledge economy development in Latin America has received more research attention than its counterpart in Africa (Andrés, Asongu, & Amavilah, Citation2015; Asongu, Citation2014, Citation2017), and as many Latin American countries improve their ranking in the DKEI, the inclusion of digital participation in the measurement of the knowledge economy seems to indicate that Latin America is not only accessing, but using ICTs at a higher rate.
However, the scores of the DKEI and KEI show only limited variation between them.Footnote10 For instance, observing the change in scores for Nepal, which moved 13 ranks between the two indices, the difference between the index scores is 0.37. In comparison, the average increase in the score within sub-Saharan countries that experienced a jump up is 0.07, whereas the average drop between the countries that scored worse on DKEI than KEI is 0.16.
Given that the digital participation sub-index carries the same weight as the four KEI sub-indices, it makes up 20 per cent of the DKEI score, whereas the respective impact of the KEI is 80 per cent. Thus, limited changes in the actual index scores are not surprising. However, recalibrating the KEI with the digital participation sub-index urges closer attention to the appropriateness of the KEI normalisation procedure.
The KEI normalises the actual variable scores into a score that takes a value between 0 and 10, unifying their direction and setting a common upper and lower bound. However, the procedure allocates these normalised scores not based on the variable scores, but based on the ranking of the variable scores. As a result, the countries’ scores are distributed evenly along the upper and lower bound of the index. While this normalisation procedure helps to rank the countries in terms of their performance, it smooths over the differences between them. Given that digital participation as well as various other variables included in the KEI are characterised by skewed distributions between countries, even where they have been standardised by population, the KEI standardisation method might not adequately capture their variation. An alternative standardisation procedure such as the min-max method could ameliorate this issue.Footnote11 This normalisation method would achieve a unified minima and maxima for the index scores, but would allow their distribution to retain the distribution of the actual variable scores.
6. Discussion and conclusion
Re-estimating the KEI with the inclusion of a digital participation sub-index tells a story about sub-Saharan Africa, whereby expectations about digital development and the information age are clearly not being met. The DKEI rankings saw two thirds of countries in SSA fall in comparison to their ranking in the KEI, and the rate of this drop was higher on average than the increase in the ranking of those few sub-Saharan African countries that improved their KEI rank in the DKEI. Although a few countries in the region (such as Rwanda and Kenya) have invested heavily in digitalisation, their improved DKEI scores are an outlier within the region. For the majority of sub-Saharan countries, including a measure of digital participation in the estimation of their attainment or preparedness for knowledge economy transformation seems to indicate challenges rather than prospects. This is a sobering reminder for policy and business circles, where knowledge economy visions are fuelled with hope and hype about the leapfrogging prospects of digitalisation.
We argue that these reminders are essential for crafting appropriate policy in the wake of overblown expectations and non-empirical proclamations about the changes that digital technologies are purported to bring about in global economic margins. In our contemporary knowledge economies, we see that far from levelling the gap, digital tools may actually be exacerbating them. However, this work also demonstrates that indices evaluating the knowledge economy are far from neutral or value free technical tools. Non-neutral choices are made on every step of creating such an index. While the limits of some of these choices are discussed transparently in indices’ accompanying material, other decisions such as the rationale for including certain variables, construction of the methodology and appropriateness of the normalisation procedure are rarely discussed, and are never accompanied by reflection of the structures of the underlying data. Overly detailed technical discussions or data analysis may not be feasible in the fast-paced policy, business, and donor circles, but we hope that easy-to-use tools such as indices would be accompanied with more grounded information about measurement choices. Complex issues and phenomena such as knowledge economies are impossible to be measured in a single number, and none of the indices discussed in this study have ever aimed to offer an all-encompassing analysis.
On a more practical level, the re-calibration of the KEI with a digital participation sub-index raises important questions about the appropriateness of the KEI normalisation procedure for the purpose that the index is meant to serve. This is especially important given its influence in shaping the perceptions of the prospects and challenges of knowledge economy transformations (and, as a result, valued and acted upon) by actors working in SSA. By smoothing skewed distributions and standardising variance, the KEI methodology fails to reveal where the underlying data would show both wide and narrow gaps between ranks rather than nearly uniform differences. This is critical information to those in charge of decisions about funding and implementation and could help them to design policies with better chances at success. Indices such as the DKEI offer a useful tool for policy-makers and other actors in the region. But it could be even more advantageous by allowing index scores to reflect the distances between the values of the underpinning data. Further, in order to allow more granularity, index scores could be re-estimated exclusively for particular regions or within a certain income group to allow for a comparison that might offer more relevant insight than an index with a global coverage.
While including data on digital participation offers novel insights into SSA’s efforts to build knowledge economies, these data are not without their limitations. GitHub and Wikipedia do not enforce their users to indicate a country location. Domain registrations are subject to a variety of registration processes across the world, which makes it difficult to estimate the proportion of websites created from within countries whose domain names are popular with foreign users. Although these limits require care in the analysis and interpretation of digital participation, the variables used remain important proxies and likely the best available measures for otherwise difficult to measure characteristics of the knowledge economy. Despite their limitations, these variables offer a unique perspective into digital participation, which we view as critical in exposing patterns of contemporary skills and knowledge that should be included in estimation of knowledge economy attainment. The work in this paper sheds light on new facets of the knowledge economy, and challenges the idea that digital tools may be deepening rather than levelling inequalities.
Supplemental Material
Download PDF (261.8 KB)Acknowledgements
The authors are highly indebted to the editor, two anonymous reviewers, and the participants of the Fifth International Monetary Fund Statistical Forum for their generous and constructive comments.
The data and code used in this article can be obtained by contacting the authors.
Supplementary Materials
Supplementary Materials are available for this article which can be accessed via the online version of this journal available at https://doi.org/10.1080/00220388.2018.1554208
Disclosure statement
No potential conflict of interest was reported by the authors.
Additional information
Funding
Notes
1. In this article, for ease of readability, we refer to the knowledge economy while acknowledging that the term is contested and rather than describing a singular knowledge economy, we attempt to describe the constellation of economic activities and characteristics that constitute many people’s and organisations’ conceptions of the term.
2. When discussed in a context of national development, the concept of leapfrogging tends to be associated with forgoing investment in agricultural-intensive economies and labour-intensive economies, and even service-based economies, and focusing more directly on knowledge-based industries, where knowledge resources such as trade secrets, brands, and expertise are as critical as other economic resources.
3. To be clear, we do not advocate the removal of existing data sources from indices, rather we argue that an index that combines traditional and novel data sources provides a more useful measure of the knowledge economy.
4. . Countries Omitted Due to Inflated Domain Registrations.
5. We think that in the context of measuring and comparing countries’ overall knowledge economy attainment, it is helpful to standardise the variables by the population. This weighted form of the KEI is also the default index configuration offered by the World Bank. However, we recognise that the unweighted variables measuring total numbers of digital participation and innovation tell an important story as well, since absolute size of resources matters where a critical mass of creativity and innovation is needed in order to facilitate exchange of ideas in a certain location. Further, populous economies such as China and India have a critical mass of innovative capacity, which is reflected less prominently when variables are scaled by population. However, as the sub-Saharan African countries are the main focus of this study, we chose to use the weighted versions of both KEI and DKEI.
6. We carried out a sensitivity analysis on the three digital content creation variables by comparing the DKEI index scores re-estimated with six different operationalisations of the digital participation sub-index. The six different operationalisations included estimating the digital participation sub-index as comprising a single variable or a pair of any of the three digital participation variables. The impact on the DKEI scores and ranking was very similar across all of the six measures, which we interpret as a robustness check on our operationalisation of the digital participation sub-index.
7. Because of this requirement, we removed Dominica and Aruba from the dataset and recalculated the rankings for the 143 variables included in the KEI.
8. See in the Appendix for the scores.
9. Given that the rate of digital participation across the three digital variables shows a growing time trend, and that the DKEI is estimated with data from 2013, these estimates are likely slightly upwardly biased. If the data from 2012 were available for the digital sub-index, the countries that experienced lower DKEI scores than KEI scores would likely have even lower DKEI scores, and the countries that had higher DKEI scores than KEI scores might have had lower increase in their scores, or perhaps no increases at all.
10. See in the Appendix for the scores.
11. While it would have been interesting to re-estimate the KEI and DKEI using the min-max method, unfortunately the World Bank does not release the non-normalised dataset on which the KEI was estimated.
Related Research Data
References
- Amavilah, V., Asongu, S. A., & Andrés, A. R. (2017). Effects of globalization on peace and stability: Implications for governance and the knowledge economy of African countries. Technological Forecasting & Social Change, 122(C), 91–103.
- Andrés, A., Asongu, S. A., & Amavilah, V. (2015). The impact of formal institutions on knowledge economy. Journal of the Knowledge Economy, 6(4), 1034–1062.
- Asongu, S. (2017). Knowledge economy gaps, policy syndromes, and catch-up strategies: Fresh South Korean lessons to Africa. Journal of the Knowledge Economy, 8(1), 211–253.
- Asongu, S. A. (2012). Financial sector competition and knowledge economy: Evidence from SSA and MENA countries. Journal of the Knowledge Economy, 6(4), 717–748.
- Asongu, S. A. (2014). Knowledge economy and financial sector competition in African countries. African Development Review, 26(2), 333–346.
- Aubert, J.-E., & Reiffers, J.-L. (2004). Knowledge economies in the Middle East and North Africa: Toward new development strategies. Washington, DC: World Bank.
- Bałtowski, M., & Pastuszak, Z. (2008). Sources of the success of Scandinavian knowledge economies. International Journal of Innovation and Learning, 5(2), 109–118.
- Brynjolfsson, E., & Mcafee, A. (2016). The second machine age - work, progress, and prosperity in a time of brilliant technologies. New York: W. W. Norton & Company.
- Carmody, P. (2013). A knowledge economy or an information society in Africa? Thintegration and the mobile phone revolution. Information Technology for Development, 19(1), 24–39.
- Devarajan, S. (2013). Africa’s statistical tragedy. Review of Income and Wealth, 59, S9–S15.
- Driouchi, A., Azelmad, E. M., & Anders, G. C. (n.d.). An econometric analysis of the role of knowledge in economic performance. The Journal of Technology Transfer, 31(2), 241–255.
- Friederici, N, Ojanperä, S, & Graham, M. (2017). The impact of connectivity in africa: Grand visions and the mirage of inclusive digital development. Electronic Journal of Information Systems in Developing Countries, 79(2), 1–20.
- GitHub. (2016). Build software better, together [Page describing the platform]. Retrieved August 27, 2016, from https://github.com
- Graham, M. (2015). Contradictory connectivity: Spatial imaginaries and technomediated positionalities in Kenya’s outsourcing sector. Environment and Planning A, 47(4), 867–883.
- Graham, M., De Sabbata, S., & Zook, M. A. (2015). Towards a study of information geographies: (Im)mutable augmentations and a mapping of the geographies of information. Geo: Geography and Environment, 2(1), 88–105.
- Graham, M., Straumann, R. K., & Hogan, B. (2015). Digital divisions of labor and informational magnetism: Mapping participation in wikipedia. Annals of the Association of American Geographers, 105(6), 1158–1178.
- Huggins, R. (2008). The evolution of knowledge clusters: Progress and policy. Economic Development Quarterly, 22(4), 277–289.
- International Telecommunication Union. (2012). Measuring the information society 2012. Geneva: Author.
- Janc, K. (2016). A global approach to the spatial diversity and dynamics of internet domains. Geographical Review, 106(4), 567–587.
- Jerven, M. (2013a). Comparability of GDP estimates in sub-saharan Africa: The effect of revisions in sources and methods since structural adjustment. Review of Income and Wealth, 59, S16–S36.
- Jerven, M. (2013b). Poor numbers: How we are misled by African development statistics and what to do about it. Ithaca: Cornell University Press.
- Kitchin, R. (2014). The data revolution: Big data, open data, data infrastructures and their consequences. London, UK: SAGE.
- Kittur, A., Suh, B., Pendleton, B. A., & Chi, E. H. (2007). He says, she says: Conflict and coordination in Wikipedia. In Proceedings of the SIGCHI Conference on Human Factors in Computing Systems (pp. 453–462). New York, NY: ACM.
- Kolo, J. (2009). The knowledge economy: Concept, global trends and strategic challenges for Africa in the quest for sustainable development. International Journal of Technology Management, 45(1–2), 27–49.
- Kraemer, K. L., Dedrick, J., & Sharma, P. (2009). One laptop per child: Vision vs. reality. Communication ACM, 52(6), 66–73.
- Launchpad. (2016). People and teams in launchpad. Retrieved August 27, 2016, from https://launchpad.net/people
- Lehohla, P. (2008). Statistical development in Africa in the context of the global statistical system. Statistical Journal of the IAOS, 25(1–2), 27–45.
- Lima, A., Rossi, L., & Musolesi, M. (2014). Coding together at scale: github as a collaborative social network. ArXiv Preprint ArXiv, 1407, 2535.
- Ministry of Communications, Government of Ghana. (2003). Ghana ICT for Accelerated Development (ICT4AD) policy. Accra: Author.
- Nguyen, T. V., & Pham, L. T. (2011). Scientific output and its relationship to knowledge economy: An analysis of ASEAN countries. Scientometrics, 89(1), 107–117.
- Piaggesi, D., & Chea, M. J. (2011). The knowledge economy: A new development paradigm for Latin America and the Caribbean (LAC). In Global strategy and practice of e-governance: Examples from around the world (pp. 464–477).
- Saltelli, A. (2006). Composite indicators between analysis and advocacy. Social Indicators Research, 81(1), 65–77.
- Schwab, K. (2016). The fourth industrial revolution. Geneva: World Economic Forum.
- SourceForge. (2016). About [Page describing the platform]. Retrieved August 27, 2016, from https://sourceforge.net/about
- Tchamyou, V. (2017). The role of knowledge economy in African business. Journal of the Knowledge Economy, 8(4), 1189–1228.
- Warschauer, M., & Ames, M. (2010). Can one laptop per child save the world’s poor? Journal of International Affairs, 64(1), 33–51.
- Wielicki, T., & Arendt, L. (2010). A knowledge-driven shift in perception of ICT implementation barriers: Comparative study of US and European SMEs. Journal of Information Science, 36(2), 162–174.
- Wikimedia. (2016). Wikipedia: About. [Article in Wikipedia, the free encyclopaedia]. Retrieved from https://en.wikipedia.org/w/index.php?title=Wikipedia:About&oldid=735677110
- World Bank. (2007). Building knowledge economies: Advanced strategies for development. Washington, DC: World Bank.
- Zhen, F., Wang, B., & Wei, Z. (2015). The rise of the internet city in China: Production and consumption of internet information. Urban Studies, 52(13), 2313–2329.
- Zook, M. A. (2001). Old hierarchies or new networks of centrality? The global geography of the internet content market. American Behavioral Scientist, 44(10), 1679–1696.
Appendix
Table A1. Digital Knowledge Economy Index (DKEI) 2012 rankings
(continued)

Notes: The cell indicating rank change is highlighted in light grey for countries that rank higher in the DKEI than in the KEI, in darker grey for countries that rank lower in the DKEI than in the KEI, and with diagonal stripes for countries that rank the same. The entire row is highlighted for sub-Saharan African countries.