?Mathematical formulae have been encoded as MathML and are displayed in this HTML version using MathJax in order to improve their display. Uncheck the box to turn MathJax off. This feature requires Javascript. Click on a formula to zoom.
Abstract
The aim of this study is to investigate how the poor, relative to the wealthier, benefitted from recent improvements in health insurance coverage, maternity care utilisation (modern contraceptive use, antenatal care visits, facility delivery, and skilled birth attendants), and under-five mortality in Kenya. The analysis relies on the latest two waves of the Kenya Demographic and Health Survey and a theoretical framework with three different inclusiveness (pro-poorness) concepts. Our results are quite robust to pro-poorness concepts and poverty definitions. The main result is that the poor experienced larger improvements in all investigated health aspects compared to the rich (irrespective of the poverty concept) when changes are measured in relative terms. When we investigate changes in absolute terms, we find a similar pattern, except in the case of health insurance coverage and the presence of a skilled birth attendant during delivery. Our analysis is expected to inform policy-making aiming to achieve universal health coverage.
1. Introduction
The aim of this study is to analyse if recent improvements in health insurance coverage of women, maternity care utilisation, and under-five child mortality, priority fields in the Sustainable Development Goals, have been inclusive in Kenya. Although the concept of inclusiveness is primarily discussed in relation to income growth, it is, especially in practice and policy-making, applied to other development fields. Many international and non-governmental organisations strive to increase health or education inclusiveness in countries where they operate. Although there are many existing approaches, inclusive growth usually refers to income increases which benefit the poor or those who are in need the most (Ali & Son, Citation2007; Grosse, Harttgen, & Klasen, Citation2008; Klasen, Citation2010; Ranieri & Almeida Ramos, Citation2013; Rauniyar & Kanbur, Citation2010).
In this study, the concept of inclusive growth is used to conceptualise inclusive health. Following existing approaches, we link the concept of inclusiveness to the concept of pro-poorness: changes in the selected indicators are evaluated based on how the poor benefitted from those relative to the rich. Poverty here is understood as a multidimensional concept, which means that it does not only concern wealth but also other socio-economic aspects. The analysis relies on the two latest waves of the Kenya Demographic and Health Surveys (2008–2009 and 2014) and a theoretical framework developed by Grosse et al. (Citation2008). Our main conclusion is that Kenya experienced improvements in all investigated health aspects, moreover, the poor seem to have benefitted more from these changes compared to the wealthier no matter how we define the poor and which pro-poorness approach we apply. The only exceptions are health insurance coverage and skilled birth attendants, in which aspects the poor benefitted more than the wealthier only in the relative sense.
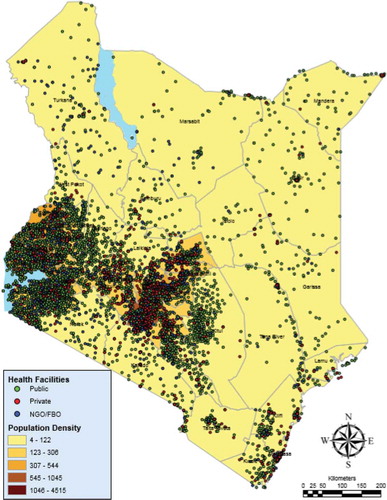
There are several reasons why Kenya provides an interesting case to study the distribution of the selected health variables across socio-economic groups in the past decade. First, according to the World Development Indicators (Citation2017), while Kenya was ahead of other countries in the East African region in 1990 in terms of life expectancy and mortality ratios, most countries caught up to Kenya or even outperformed her by 2015. Since they are closely related to mortality ratios (Alvarez, Gil, Hernández, & Gil, Citation2009; Brown, Sohani, Khan, Lilford, & Mukhwana, Citation2008), we believe that understanding the patterns of insurance and maternity care utilisation provides insight on why mortality ratios are not improving at the expected pace. Second, Kenya is one of the countries in Africa which recently has implemented a nation-wide health scheme to achieve universal health coverage. The free primary and maternal care which waives all fees for primary services at lower level facilities and fees for maternity services in all public facilities was introduced in June 2013 (Chuma & Maina, Citation2013). However, health insurance coverage was still only about 20 per cent one year after the introduction (KDHS, Citation2015). Third, disparities in access to healthcare in Kenya have been identified along many socio-economic lines. While about 74 per cent of Kenyans live in rural areas (United Nations, Citation2011), most of the health facilities are distributed in the urban areas (World Bank, Citation2014; see Appendix A). Educational and cultural background are also among the main drivers of health inequalities (KDHS, Citation2015).
Our study has a number of unique features. While the traditional approach is to compare the health status of the poor and rich defined by income or wealth, our approach defines poverty along non-income dimensions as well including the location of residence and educational attainment. Moreover, instead of sticking to one definition, the analytical framework is based on a set of three inclusiveness concepts differing in how they weigh improvements among the poor relative to the rich. By employing different approaches and comparing the results against each other, a detailed pattern of health-related improvements can be uncovered. Based on the results from the study, one can reasonably assess whether there has been a reduction in health inequality between the examined socio-economic groups and which groups lag behind. Finally, our methodological approach can be utilised as a tool to monitor progress towards achieving universal health coverage and to design more targeted policies.
The rest of the article is structured as follows. The next section conceptualises inclusive health and overviews why reduction in health inequalities leads to lower economic inequalities in general. Sections 3 and 4 describe the data and the methodological framework, respectively. The findings and discussion of the study are presented in Section 5. The last section concludes and articulates the main policy lessons.
2. Theoretical background
2.1. Conceptualising inclusive health
Inclusiveness is a widely discussed topic in relation to economic growth measured with income per capita changes. Although existing concepts of inclusiveness might differ to some extent,Footnote1 there is at least one aspect in common: the status of the poor gains special attention. The World Bank argues that inclusiveness is about both the pace and pattern of economic growth: while the rapid pace of growth is necessary for poverty reduction, it is its pattern that makes growth sustainable in the long run (Ianchovichina & Lundstrom, Citation2009). Ali and Son (Citation2007) define inclusive growth as ‘growth that not only creates new economic opportunities, but also one that ensures equal access to the opportunities created for all segments of society, particularly for the poor’. Klasen (Citation2010) considers an income growth episode ‘inclusive’ when it is ‘non-discriminatory’ and ‘disadvantage-reducing’. The first aspect highlights the importance of the process of growth: it allows participation of and contribution by all members of society, with particular emphasis on the ability of the poor and disadvantaged to participate in growth. The second aspect acknowledges the outcome: growth is associated with declining inequality in those non-income dimensions of wellbeing that are particularly important for promoting economic opportunities, including education, health, nutrition, and social integration.
However, there is much debate if inclusive growth should necessarily mean that the poor benefit more relative to the rich. The World Bank argues that inclusive growth should be in line with the absolute definition of pro-poor growth, with a focus on the absolute pace of economic growth: ‘by focusing on inequality, the relative definition could lead to sub-optimal outcomes for both poor and non-poor households, in which fewer people lifted out of extreme poverty’ (Ianchovichina & Lundstrom, Citation2009). On the other hand, Klasen (Citation2010) argues that reducing inequality is just as important as reducing poverty. Therefore, inclusive growth should relate to a relative pro-poor concept, in which the poor must accrue more benefit from growth than the non-poor, which definitely results in a reduction in inequality. If inclusive growth relates to a relative concept of pro-poor growth, it would mainly benefit groups that are otherwise disadvantaged.
Inclusive health, which is a not so commonly used term, is in line with the concept of inclusive growth. According to MacLachlan, Khasnabis, and Mannan (Citation2012, p. 139):
[i]nclusive health seeks to build on the idea of Health for All and to strengthen it through the rights-based approach; to stress the need for more active inclusion by recognising that particular groups have particular needs and that particular barriers have to be overcome to address these needs.
Similar to the literature above, our article links inclusiveness with pro-poorness. However, our analysis relies on a framework (discussed in Section 3) which applies various inclusiveness approaches which differ in how they evaluate the change in the position of the poor relative to the wealthy. Thus, instead of selecting a single approach, we study if health changes can be considered inclusive based on a system of multiple pro-poorness concepts.
2.2. The need for inclusive health
The aim of this section is to review the channels through which policies targeting health insurance coverage and maternal healthcare utilisation may affect health outcomes and the socio-economic status of women and children. Within maternal care, we specifically focus on modern contraceptive use, antenatal care visits, facility delivery, and skilled birth attendant utilisation, which are widely discussed determinants of various health outcomes (Alvarez et al., Citation2009; Brown et al., Citation2008). The importance of investigating health changes by socio-economic groups defined by wealth, and other dimensions such as urbanisation and educational background, is also covered.
Access to health insurance contributes to wellbeing through at least two channels, namely strengthening financial protection and increasing healthcare utilisation. In most African countries, the health financing system is weak and characterised by low government spending, few risk-pooling mechanisms, and the high share of out-of-pocket payments (Leive & Xu, Citation2008). Such health systems are not able to protect households from catastrophic health expenditures (Xu et al., Citation2003). Households in low- and middle-income countries often have to use their savings, borrow from banks or relatives, or sell assets and livestock to meet health expenses (Alam & Mahal, Citation2014). Recent health reforms implemented in African and Asian countries have been found to be successful in reducing out-of-pocket expenditures (Lagomarsino, Garabrant, Adyas, Muga, & Otoo, Citation2012). In addition, there is empirical evidence that health insurance is associated with higher care utilisation, including antenatal care (Smith & Sulzbach, Citation2008), facility delivery (Aremu, Lawoko, & Dalal, Citation2011), and skilled birth attendants (Hong, Ayad, & Ngabo, Citation2011).
Maternity care utilisation significantly improves health outcomes, and consequently, future economic opportunities of both women and children. Delivering at facilities and the presence of a skilled birth attendant have been found to reduce the risk of maternal and neonatal mortality (Brown et al., Citation2008). Reduced mortality, which corresponds with increased life expectancy, encourages investment in the human capital of women (Jayachandran & Lleras-Muney, Citation2009), leading to higher income (Psacharopoulos, Citation1994) and more decision power within the household (Beegle, Frankenberg, & Thomas, Citation2001; Malik & Courtney, Citation2011). Reduced fertility, partly as a result of family planning services, have similar consequences. The use of contraceptives is expected to reduce mortality by avoiding unwanted pregnancy and abortion (Ganatra & Faundes, Citation2016). Lower fertility is associated with better labour market status of women (Canning & Schultz, Citation2012) and higher and more equal investment of households per child (Kaplan, Citation1996).
Studies conducted in various contexts have confirmed the positive relationship between the quantity of prenatal care received and the birth weight of children (Awiti, Citation2014). Antenatal visits are also found to be associated with increased uptake of facility-based delivery and improved perinatal survival (Brown et al., Citation2008), which helps reduce several health risks for mothers and the newborns, as discussed above.
Insurance uptake and maternal healthcare utilisation, however, are dependent on many socio-economic factors. Compared to the poorer, wealthier women are more likely to be covered by insurance, have lower fertility rates, to go to antenatal care more often, and deliver in hospitals and clinics instead of their home with the assistance of doctors, nurses, or midwifes (Ruktanonchai et al., Citation2016; Kirigia et al., Citation2005). However, material welfare is not the only determinant. Since in developing countries health facilities are more likely to be located in cities, rural areas lag behind in terms of access to and utilisation of care (Arthur, Citation2012). Rural-urban disparities are associated with spatial inequalities which have gained increased attention in the past decade due to the spread of geographic information tools in policy-making (Gabrysch, Cousens, Cox, Campbell, & Bryce, Citation2011; Ruktanonchai et al., Citation2016). The educational level of women in developing countries is crucial to make policies work. Many studies have shown that women with no formal education are less likely to take part in health-related interventions and benefit from their advantages (Hong et al., Citation2011; Kirigia et al., Citation2005). Finally, culture such as religion and ethnicity are additional determinants of care utilisation. Traditions and belief systems of indigenous people often challenge the designers of interventions and influence the success of health programmes (Pyone, Adaji, Madaj, Woldetsadik, & Van Den Broek, Citation2014; Zepro & Ahmed, Citation2016).
Based on the literature review, we argue that inclusive health improvements and access to maternal healthcare and insurance can contribute to inclusive development and equity in the long-run by reducing maternal child deaths and morbidity, improving birth outcomes and the socio-economic status of women and children, and reducing out-of-pocket health spending in disadvantaged groups. The discussion above also makes it evident that the disparities in maternal care utilisation can be attributed to several factors, among which wealth, location of residence (rural versus urban areas), and educational attainment have the most pronounced impact. Therefore, we focus on these factors in our study when contrasting the improvements in health-related indicators among different socio-economic groups in Kenya.
3. Data
The empirical analysis explores changes in selected health indicators () in Kenya based on the two latest waves of the Demographic and Health Surveys (2008–2009 and 2014). suggests that all the investigated health dimensions improved between the two waves. The share of women with health insurance increased by 160.86 per cent, however, it was still low at 18.13 per cent in 2014. The increase in modern contraceptive use was about 40 per cent over the study period. According to the World Health Organisation (WHO, Citation2016), we coded pills, intrauterine devices (IUDs), injections, female and male condoms, female and male sterilisation, lactational amenorrhea, and implants (for example Norplant) as modern contraceptive methods, while periodic abstinence, withdrawal, and other non-specified methods were considered as traditional methods. The share of women with four or more antenatal visits and the share of women giving birth in health facilities increased with 20.1 per cent and 43.44 per cent, respectively. The presence of skilled birth attendants increased by about 40 per cent. Based on the practice of the DHS reports, we consider doctors, nurses, and midwives as skilled birth attendants (Assaf & Pullum, Citation2016).
Table 1. Descriptive statistics
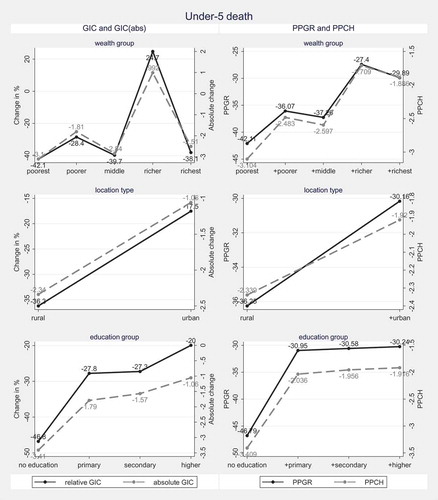
Under-five death is calculated as the share of children who were born in the five years preceding the survey but died before their fifth birthday. This indicator improved by 30 per cent. It is important to note that this under-five mortality is a simple ratio which is different from the rates published in the KDHS reports (Citation2015), and is only applicable to assess changes between the two waves.
4. Methodological framework
Similar to Grosse et al. (Citation2008), we rely on the concept of the relative and absolute growth incidence curves (GIC and GICabs) for each of the six health variables listed in . The traditional GIC, a well-known analytical tool in economics, represents the growth of the mean income in the percentiles of the income distribution. The absolute growth incidence curve (GICabs) shows the respective changes in absolute terms expressed in the unit of measurement instead of percentages. Grosse et al. (Citation2008) extend this approach and employ the growth incidence curves to show how non-income variables such as the average health status and years of education change in the percentiles of the income distribution over a time period.
This framework is accompanied with a set of growth rates. Let us define the ‘pro-poor growth rate’ (PPGR) as the growth in a health indicator among the poor over a certain period of time. Similarly, let ‘pro-poor change’ (PPCH) be the change in a health indicator expressed in the unit of measurement among the poor. Let ‘growth in mean’ (GRIM) define the growth (in percentages) in the population average of the health indicator and let ‘change in mean’ (CHIM) refer to the absolute change in the population mean.
Based on the above scheme, three types of pro-poor improvements are possible. If the change in a health indicator among the poor is positive (PPCH>0), or in other words the situation of the poor improves in a particular health aspect, there is pro-poor improvement in the weak absolute sense. This is the weakest pro-poorness approach which does not compare changes among the poor to those among the rich. A society experiences pro-poor improvement in the relative sense when the growth in the health indicator (in percentages) among the poor is higher than the population average (PPGR>GRIM). Finally, absolute pro-poor improvement requires that the absolute growth in the health indicator (in the unit of measurement) is higher among the poor than the population average (PPCH>CHIM).
Alternatively, we can use the growth incidence curves themselves to conclude on pro-poorness. Monotonously decreasing GIC and GICabs suggest pro-poor improvements in the relative and strong absolute sense, since they depict higher increase in groups ranked lower in terms of wellbeing or poverty. However, as we will see below in our analysis, growth incidence curves are often non-monotonous, thus straightforward conclusion on pro-poorness cannot be drawn. In these cases, the role of PPGR and PPCH in assessment becomes particularly important. We will demonstrate this in the empirical analysis. Technical details on the construction of the growth incidence curves and PPGR and PPCH curves are found in Appendix B and C, respectively.
Our study relies on a somewhat redesigned version of the framework developed in Grosse et al. (Citation2008). While their growth incidence curves are based on the unconditional and conditional distributions of health indicators, we make use of the conditional distributions only which makes it possible to analyse changes in health indicators by socio-economic group. Nevertheless, the unconditional distributions are presented in the next section to provide additional background for the analysis. The main modification is that instead of showing the changes of health indicators by income distribution percentile, we plot the relative and absolute growth incidence curves by wealth quintile, location of residence (rural and urban areas), and educational attainment. By this, we acknowledge that poverty is a multidimensional concept and should be measured along various dimensions.
Working with socio-economic groups instead of income, a continuous variable, raises three issues. First, the traditional growth incidence curve is based on income percentiles: the population is split into 100 equal sized groups ordered by their mean income. To follow the idea behind calculating income percentiles, we have to order the socio-economic groups from the poorest to the richest. The ranking of socio-economic groups other than those defined by wealth index is based on the results of previous studies and the average wealth index in the DHS per socio-economic group (). The modernisation theory and the majority of empirical studies suggest that since urban areas are more likely to be richer, people living in cities exhibit better health characteristics on average (Liu, Fang, & Zhao, Citation2013; Okeke & Okeibunor, Citation2010). Also, women with more education are more likely to be better off than their less-educated peers (Pathak, Singh, & Subramanian, Citation2010; Simkhada, Teijlingen, Porter, & Simkhada, Citation2008). shows that the average wealth index is lower in rural than urban areas and increasing along the educational attainment in both years. In other words, our expectations based on the literature associates well with the wealth index reported in the DHS.
Table 2. Investigated socio-economic characteristics
The second challenge of working with categories instead of income percentiles is that defining the poor is more difficult. When poverty is measured with income or wealth index, a threshold which separates the poor from the non-poor (for example income threshold of 2$/day) can easily be applied. When we classify the population along dimensions other than income or wealth, we have to decide which groups by location of residence and educational attainment can be considered poor in order to be able to use the framework. Estimates published in the Socio-Economic Atlas of Kenya (Kenya National Bureau of Statistics 2016) suggest that the national poverty rate was 45.2 per cent in 2009. Corresponding with this number, in terms of wealth quintile, we consider the bottom three groups as poor, in terms location of residence, we consider the rural group as poor and in terms of education attainment, we consider the bottom two groups as poor (the distribution of respondents by socio-economic group is in ).
Finally, while we analyse changes in groups defined by (wealth) percentiles, as in the original framework in Grosse et al. (Citation2008), the share of one group within the population or the sample (by definition) does not change over time. However, when we investigate changes in group means in surveys, there is no guarantee that the share of groups is constant in the two consecutive survey waves. Thus, when analysing total increase or decrease in the mean of health variables, we might want to separate changes due to actual changes in group means from changes due to differences in groups shares in survey rounds. Statistical textbooks touch upon these issues in chapters on index numbers. Since the share of urban areas is significantly higher in the 2014 wave, this issue is the most relevant in analysing pro-poorness when poverty is defined by location of residence.
In the next section we present our graphical analytical tools. On one hand, we apply the growth incidence curves which visualise relative and absolute changes in health variables by socio-economic group. We also present the PPGR and PPCH curves which show the changes in cumulative averages so that each point represents the PPGR and PPCH and the final points are basically the relative and absolute changes in the population mean (GRIM and CHIM). Thus, each point on these curves show what the PPGR and PPCH would be if socio-economic groups up until that point would be considered poor. These curves help us make conclusions on pro-poorness when growth incidence curves are non-monotonous.
5. Empirical findings and discussion
5.1. Analysis of distributions
Similar to Grosse et al. (Citation2008, pp. 1027–1030), we first present the unconditional and conditional means of the investigated health indicators. These tables provide a more detailed description of the data and support the forthcoming analysis using the growth incidence curves. The unconditional distributions are represented by weighted averages of respective indicators per quintile (). However, since the first five out of the six indicators are binary variables, we obtain unusual patterns. The means up until a certain quintile are zero; then, there is a quintile in which the mean is between 0 and 100 per cent and all the means equal to 100 per cent above that. The general pattern that values turn non-zero in a lower quintile in 2014 than in the earlier wave indicates increased insurance coverage and healthcare utilisation. Since the prevalence of under-five death is very low, only the top decile has a non-zero value in both waves. The value is lower in 2014 which suggests improvement.
Table 3. Mean health indicators per decile (unconditional means)
The conditional means are represented with the means of health indicators by socio-economic group ( and ). As expected, the poorest groups often exhibit the lowest means of health indicators, while the wealthiest groups usually have the highest means by all socio-economic aspects in both years. Moreover, we see improvements in all health aspects in all socio-economic groups between the two waves. The conditional mean tables are used to construct the growth incidence curves.
Table 4. Mean health insurance coverage and healthcare utilisation per socio-economic group in KDHS 2008–2009 (conditional means)
Table 5. Mean health insurance coverage and healthcare utilisation per socio-economic group in KDHS 2014 (conditional means)
5.2. General patterns
The GIC-s and GICabs-s and PPGR and PPCH curves per health variable are presented in to . The first main finding is that all health aspects improved in the weak absolute sense: the situation of the poor improved between the two DHS waves. However, weak absolute pro-poorness does not at all provide information on how large the improvement among the poor was compared to the rich.
Figure 1. Change in health insurance coverage (women).
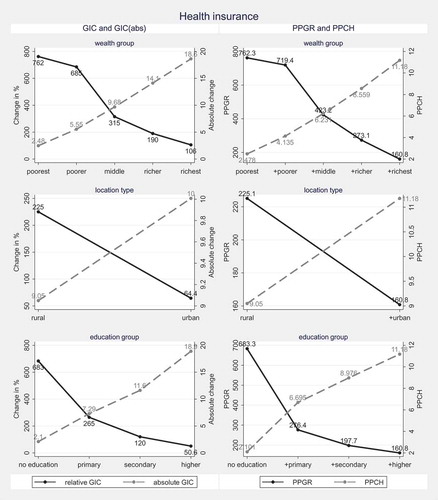
Figure 2. Change in modern contraceptive use.
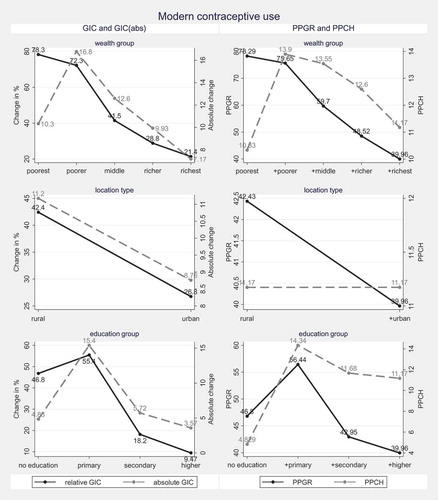
Figure 3. Change in antenatal visits.
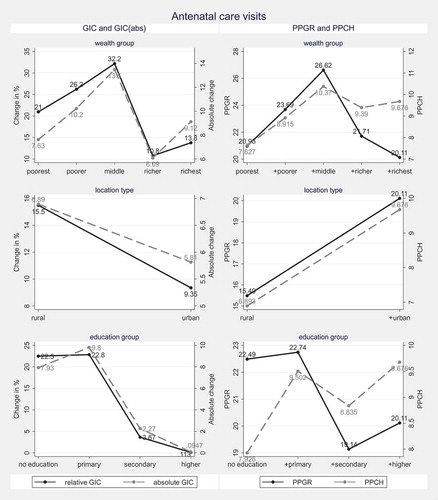
Figure 4. Change in facility delivery.
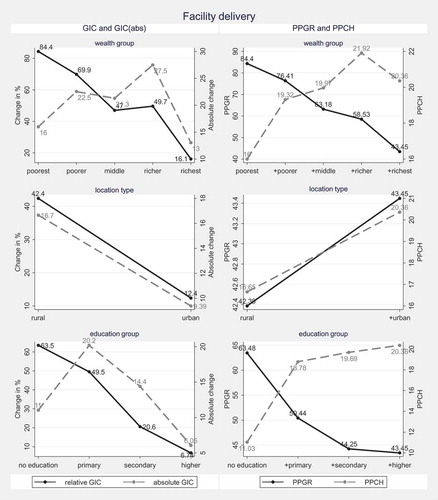
Figure 5. Change in the presence of a skilled birth attendant.
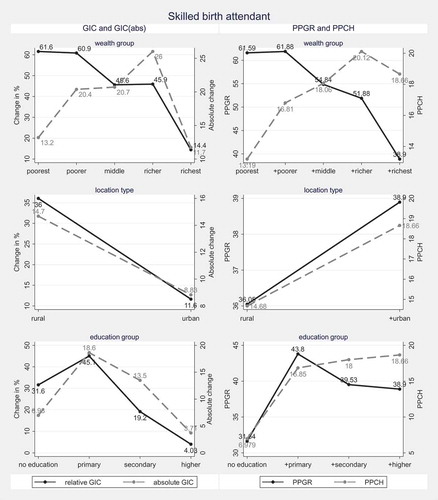
Figure 6. Change in under-five death rate.
Pro-poor improvements in the relative sense mean that improvements in the status of the poor in percentages are higher than the country average. This can be seen if the GIC is decreasing and/or the point of the PPGR curve corresponding with groups considered poor is higher than the final point of the curve. If we consider the bottom three groups as poor in terms of wealth, the bottom two groups in terms of educational attainment and the rural group in terms of location of residence, we can conclude that there is pro-poor improvement in the relative sense in all health aspects when poverty is measured along wealth and educational attainment. It means that changes in percentages in groups that are considered poor in terms of wealth and educational attainment are higher than the average improvement in the population. Improvements in health insurance coverage, modern contraceptive use and under-five mortality rate can be considered relative pro-poor when we investigate differences between rural and urban areas. Judging pro-poorness in terms of location of residence in the remaining health aspects is, however, not straightforward because the GIC is decreasing, which suggest pro-poorness, but the PPGR curve is increasing, which suggests the opposite. We discuss this finding later.
The last approach is the strong absolute pro-poorness, which requires that changes among those considered poor are higher than the country average in absolute terms. In cases where the initial difference between the health status of poor and rich is large, it might require only little efforts to achieve pro-poor improvement in the relative sense, while achieving pro-poorness in the strong absolute sense might require high investments and strong efforts. In other words, in high-inequality contexts strong absolute pro-poorness is the strictest pro-poorness concept.
When looking at GICabs and PPCH curves, the most obvious pattern emerges in the figure of health insurance coverage and under-five mortality: the former cannot be considered pro-poor in the absolute sense in any of the socio-economic aspects, while changes in the latter are absolute pro-poor improvements. The GICabs of the remaining variables do not increase or decrease monotonically, thus a clear decision cannot be drawn based on those alone. The PPCH curves, however, suggest that if we follow our definition of the poor, modern contraceptive use improvements can be considered absolute pro-poor when poverty is measured by wealth or educational attainment, while facility delivery and skilled birth attendance measures did not improve in the absolute pro-poor sense. Improvements in antenatal care visits are pro-poor in the absolute sense when poverty is defined by wealth quintile. Again, patterns regarding the location of residence are not straightforward.
As we noted earlier, it is difficult to draw a clear conclusion on relative and absolute pro-poorness in antenatal care visits, facility delivery and the presence of skilled birth attendants when we investigate location of residence. The reason why the growth incidence and PPGR and PPCH curves contradict is that the share of urban areas changed significantly between the waves. Thus, when we calculate points on the PPGR and PPCH curves, we not only take into account increases due to changes in the means of health variables in rural and urban areas (as the GIC and GICabs do) but mean changes due to the changes in the relative share of rural and urban areas are also taken into account. Statistical methods on how to decompose these two effects are discussed in basic statistics textbooks in chapters on index numbers (see for instance Ralph, O’Neill, & Winton, Citation2015). and report the decomposition of total relative and absolute changes, respectively, by health aspect and socio-economic group. When we filter out the composition effect, we find that improvements in all health aspects can actually be considered pro-poor in the relative sense when poverty is measured by location of residence. Thus, we can conclude that all health aspects improved in the relative pro-poor sense when the above decomposition method is used and poverty is defined as discussed in Section 3. When we apply the same method for absolute changes, our conclusions on pro-poorness change significantly: improvements in antenatal care visits, facility delivery, and skilled birth attendance becomes pro-poor when poverty is defined by location of residence and educational attainment. This issue is less relevant for analysing inclusiveness by wealth and educational attainment because categories within these socio-economic aspects are more similar in the two waves.
Table 6. Decomposition of relative changes
Table 7. Decomposition of absolute changes
5.3. Discussion
While the previous section allows us to gain a general insight into health changes in Kenya, observing the patterns of the growth incidence, PPGR, and PPCH curves makes a deeper analysis possible. One of the limitations of our research is that the conclusions are likely to be sensitive to how we define the poor. If we applied a strict concept and picked only the poorest wealth quintile as the poor, our general conclusions on the pro-poorness of the observed health progress would not change much. There are, however, two important notes to be made. First, if we picked the poorest only from the five wealth quintiles as poor, the changes in insurance coverage, contraceptive use, facility delivery, skilled birth attendant, and under-five death would be even more pro-poor in the relative sense than in the case of the original concept (bottom three wealth quintiles). Second, taking only the poorest quintile as poor would change our main conclusions on pro-poorness in the strong absolute sense: improvements would be even less pro-poor except for under-five death. Moreover, changes in contraceptive use would not be pro-poor any more. Since the initial levels of the utilisation indicators are very low in the poorest group, a small absolute improvement might seem to be high in relative terms, hence the observed patterns.
The discussion of the results by educational attainment is similar to what we observed in the case of wealth groups. The conclusions on pro-poorness change to some extent if instead of the combined bottom two groups (no education + primary education) we treat only the lowest group (no education) as poor. Since the initial level of health insurance coverage, antenatal care visits and facility delivery in the ‘no education’ group is low, a slight increase in absolute terms can be large in relative terms (, , and ). If only the bottom education group is treated as poor, contraceptive use increase is not pro-poor in the strong absolute sense anymore and improvements in having skilled attendants at birth would fail to remain pro-poor in the relative sense. Under-five death improvements are the largest in the ‘no education’ group in both the relative and absolute sense.
The literature suggests that women with more schooling are more likely to utilise maternity care (Pathak et al., Citation2010; Simkhada et al., Citation2008). Empirical studies find that maternal healthcare utilisation is the lowest among illiterate or non-educated women (Ahmed, Creanga, Gillespie, Tsui, & Shea, Citation2010). Our finding complements existing literature to some extent: absolute improvements in maternal care utilisation are often low in the bottom education group. While it is context-dependent whether primary or secondary education has the highest marginal impact on maternity healthcare utilisation in developing countries (Babalola & Fatusi, Citation2009; Shariff & Singh, Citation2002), the shape of the absolute growth incidence curves suggests that in Kenya primary education is crucial in promoting maternity care utilisation: the largest ’jump’ is between the first and second point of the PPCH curve (and often in GICabs) in various health indicators. Existing studies provide ample evidence that maternal education programmes, often part of antenatal care, can boost healthcare utilisation during pregnancy and after delivery (Magoma, Requejo, Campbell, Cousens, & Filippi, Citation2010). Our results, thus, call for research comparing the impact and cost efficiency of targeted maternal education programmes with general investments into primary education in Kenya.
Although we do not analyse changes in geographical regions and ethnic groups, it is important to highlight that the above discussed patterns are likely to be connected to additional socio-economic factors, such as ethnicity and geographical locations. For instance, the Somali people, the main ethnic group in the North Eastern region with low urbanisation rate, are nomadic and characterised by low education in general, which has been shown as an important determinant of low healthcare utilisation. Cultural and religious beliefs, such as fear of being seen by a male physician, were also found to determine maternity care behaviour among the Somalis (Zepro & Ahmed, Citation2016). It is now recognised that interventions promoting health insurance and maternity care utilisation are more successful if they are culturally sensitive and involve local communities (Jones, Lattof, & Coast, Citation2017). A study conducted in Somaliland (Pyone et al., Citation2014) has shown that promoting facility delivery is feasible and culturally more acceptable when traditional birth attendants are involved in the intervention and escort women to facilities themselves. The share of women having traditional birth attendants during delivery is very high in the North Eastern region, where the Somalis live (KDHS, Citation2015). Systemic reviews collecting the evidence on successful culturally sensitive interventions, building upon local characteristics and resources, across countries and ethnic groups (Coast, Jones, Portela, Lattof, & Petersen, Citation2014), might help design more targeted and effective policies.
Despite employing a popular and straightforward analytic framework, our study has some limitations. First, as we discussed above, the conclusions drawn from our analysis might be dependent on which group we consider poor. Although our method can be modified so that it is no longer sensitive to which groups are considered poor, it is not discussed in depth in this article. Second, while representing socio-economic groups with group averages, as we do in the present study, we do not take within-group distribution of health variables into account. Our framework can potentially be extended with within-group distributions and other socio-economic groups (for example geographical regions and ethnic groups), but that is beyond the scope of our analysis. Finally, we don’t take into account the differences in quality of services that people receive. For example, health insurance coverage does not capture the differences in the content of insurance packages and we do not have information on how similar the content of antenatal care is across various contexts.
6. Conclusions and policy lessons
This study relies on a set of three concepts to evaluate how inclusive improvements in health insurance coverage, family planning, maternity care utilisation, and under-five child mortality were in Kenya. These concepts differ in how they weigh improvements among the poor compared to the rich. Poverty is defined along wealth, location of residence, and educational background. Our results are quite robust to pro-poorness concepts and to how we define the poor. First, all health improvements can be considered pro-poor in the weak absolute sense: the status of the poor improved over the investigated period. However, since it does not take into account if the poor are catching up to the rich, this concept does not inform us about the dynamics of health inequalities. We also find that improvements in all health aspects can be considered pro-poor in the relative sense. It means that in relative terms (in percentages), the poor benefitted more from improvements compared to the wealthier in all health aspects and it does not matter if the poor are defined along wealth, location of residence, or educational attainment. When pro-poorness is measured in absolute terms, the conclusion is slightly different: all improvements can be considered pro-poor, except for those in health insurance coverage and skilled birth attendants when poverty is measured along wealth quintiles. The relative and strong absolute pro-poorness concepts might also be seen as an indicator of how insurance coverage, care utilisation, and child mortality of the poor is converging to those of the rich. In other words, the relative and strong absolute pro-poorness concepts inform us on health inequality dynamics.
Beyond illustrating the main trends of insurance coverage, healthcare utilisation and under-five mortality, our analytical tool is also applicable to reveal socio-economic groups which perform poorly in many health aspects. We show that the poorest wealth quintile and women with less than primary education, improve at a considerably lower pace in absolute terms than the rest of the population. Thus, we not only show that these groups are characterised by very low levels of utilisation, which has already been shown by many earlier studies, but we highlight that they are not likely to catch up in the near future. We discussed that women with at least primary education are characterised by significantly higher utilisation numbers than women with lower than primary education. This finding suggests that policies aiming to increase access to primary education have a beneficial effect on healthcare utilisation. On the other hand, maternal education interventions targeting family planning utilisation and facility delivery prove to be effective. A study which compares the costs and benefits of targeted maternal education programmes and general primary education investments could reveal which one of the two would be more efficient in promoting family planning and maternity care utilisation in the Kenyan context.
One potential extension of our study is to incorporate analysis on geographical regions and ethnic groups which would inform polic- making on the potential of geographical information systems (Gabrysch et al., Citation2011) and culture-sensitive health interventions (Magoma et al., Citation2010) in reducing health disparities.
The current analysis can also be extended with the forthcoming waves of the DHS, which are expected to capture the impacts of the recently introduced free primary and maternal health care (Chuma & Maina, Citation2013) to a larger extent than the latest wave in 2014. Thus, our method is proposed as a potential tool to assess how the new health scheme performs in achieving its ultimate goal, namely universal health coverage.
Acknowledgements
This paper is part of the research agenda of INCLUDE, the Knowledge Platform on Inclusive Development Policies funded by the Dutch Ministry of Foreign Affairs through NWO-WOTRO. We are grateful for Prof. Chris Elbers (Vrije Universiteit, Amsterdam), the participants of the Africa Health Agenda International Conference (AHAIC) 2017 (Nairobi, Kenya), and the two anonymous referees at the Journal of Development Studies for comments on the previous versions of the study. The underlying dataset in Stata (.dta) format and the programming commands (in .do file format) are available upon request.
Disclosure statement
No potential conflict of interest was reported by the authors.
Additional information
Funding
Notes
1. Overview of existing concepts is provided in Ranieri and Almeida Ramos (Citation2013), Klasen (Citation2010), and Rauniyar and Kanbur (Citation2010).
References
- Ahmed, S., Creanga, A. A., Gillespie, D. G., Tsui, A. O., & Shea, B. J. (2010). Economic status, education and empowerment: Implications for maternal health service utilization in developing countries. PloS One, 5, e11190.
- Alam, K., & Mahal, A. (2014). Economic impacts of health shocks on households in low and middle income countries: A review of the literature. Globalization and Health, 10, 21–38.
- Ali, I., & Son, H. H. (2007). Measuring inclusive growth. Asian Development Review, 24, 11–31.
- Alvarez, J. L., Gil, R., Hernández, V., & Gil, A. (2009). Factors associated with maternal mortality in Sub-Saharan Africa: An ecological study. BMC Public Health, 9, 462–469.
- Aremu, O., Lawoko, S., & Dalal, K. (2011). Neighborhood socioeconomic disadvantage, individual wealth status and patterns of delivery care utilization in Nigeria: A multilevel discrete choice analysis. International Journal of Women’s Health, 3, 167–174.
- Arthur, E. (2012). Wealth and antenatal care use: Implications for maternal health care utilisation in Ghana. Health Economics Review, 2, 14–21.
- Assaf, S., & Pullum, T. (2016). Levels and trends in maternal and child health disparities by wealth and region in eleven countries with DHS surveys (DHS Comparative Report No. 42). Rockville, MD: ICF International. Retrieved from the DHS website: http://dhsprogram.com/pubs/pdf/CR42/CR42.pdf.
- Awiti, J. O. (2014). A multilevel analysis of prenatal care and birth weight in Kenya. Health Economics Review, 4, 33–48.
- Babalola, S., & Fatusi, A. (2009). Determinants of use of maternal health services in Nigeria-looking beyond individual and household factors. BMC Pregnancy and Childbirth, 9, 43–55.
- Beegle, K., Frankenberg, E., & Thomas, D. (2001). Bargaining power within couples and use of prenatal and delivery care in Indonesia. Studies in Family Planning, 32, 130–146.
- Brown, C. A., Sohani, S. B., Khan, K., Lilford, R., & Mukhwana, W. (2008). Antenatal care and perinatal outcomes in Kwale district, Kenya. BMC Pregnancy and Childbirth, 8, 2–12.
- Canning, D., & Schultz, T. P. (2012). The economic consequences of reproductive health and family planning. The Lancet, 380, 165–171.
- Chuma, J., & Maina, T. (2013). Free maternal care and removal of user fees at primary-level facilities in Kenya. Monitoring the implementation and impact: Baseline report. Washington, DC: Health Policy Project, Futures Group. Retrieved from the Health Policy Project website https://www.healthpolicyproject.com/pubs/400_KenyaUserFeesBaselineReportFINAL.pdf
- Coast, E., Jones, E., Portela, A., Lattof, S. R., & Petersen, I. (2014). Maternity care services and culture: A systematic global mapping of interventions. PLoS One, 9, e108130.
- Gabrysch, S., Cousens, S., Cox, J., Campbell, O. M., & Bryce, J. (2011). The influence of distance and level of care on delivery place in rural Zambia: A study of linked national data in a geographic information system. PLoS Medicine, 8, e1000394.
- Ganatra, B., & Faundes, A. (2016). Role of birth spacing, family planning services, safe abortion services and post-abortion care in reducing maternal mortality. Best Practice & Research Clinical Obstetrics & Gynaecology, 36, 145–155.
- Grosse, M., Harttgen, K., & Klasen, S. (2008). Measuring pro-poor growth in non-income dimensions. World Development, 36, 1021–1047.
- Hong, R., Ayad, M., & Ngabo, F. (2011). Being insured improves safe delivery practices in Rwanda. Journal of Community Health, 36, 779–784.
- Ianchovichina, E., & Lundstrom, S. (2009). Inclusive Growth Analytics. Framework and Application (Policy Research Working Paper No. 4851). Washington, DC: World Bank Group.
- Jayachandran, S., & Lleras-Muney, A. (2009). Life expectancy and human capital investments: Evidence from maternal mortality declines. The Quarterly Journal of Economics, 124, 349–397.
- Jones, E., Lattof, S. R., & Coast, E. (2017). Interventions to provide culturally-appropriate maternity care services: Factors affecting implementation. BMC Pregnancy and Childbirth, 17, 267–276.
- Kaplan, H. (1996). A theory of fertility and parental investment in traditional and modern human societies. American Journal of Physical Anthropology, 101, 91–135.
- KDHS. (2015). Kenya Demographic and Health Survey Report 2014. Retrieved from the DHS website: https://dhsprogram.com/pubs/pdf/fr308/fr308.pdf.
- Kirigia, J. M., Sambo, L. G., Nganda, B., Mwabu, G. M., Chatora, R., & Mwase, T. (2005). Determinants of health insurance ownership among South African women. BMC Health Services Research, 5, 17–26.
- Klasen, S. (2010). Measuring and Monitoring Inclusive Growth: Multiple Definitions, Open Questions, and Some Constructive Proposals (Sustainable Development Working Paper No. 12). Manila: Asian Development Bank.
- Lagomarsino, G., Garabrant, A., Adyas, A., Muga, R., & Otoo, N. (2012). Moving towards universal health coverage: Health insurance reforms in nine developing countries in Africa and Asia. The Lancet, 380, 933–943.
- Leive, A., & Xu, K. (2008). Coping with out-of-pocket health payments: Empirical evidence from 15 African countries. Bulletin of the World Health Organization, 86, 849–856C.
- Liu, H., Fang, H., & Zhao, Z. (2013). Urban–Rural disparities of child health and nutritional status in China from 1989 to 2006. Economics & Human Biology, 11, 294–309.
- MacLachlan, M., Khasnabis, C., & Mannan, H. (2012). Inclusive health. Tropical Medicine & International Health, 17, 139–141.
- Magoma, M., Requejo, J., Campbell, O. M., Cousens, S., & Filippi, V. (2010). High ANC coverage and low skilled attendance in a rural Tanzanian district: A case for implementing a birth plan intervention. BMC Pregnancy and Childbirth, 10, 13–24.
- Malik, S., & Courtney, K. (2011). Higher education and women’s empowerment in Pakistan. Gender and Education, 23, 29–45.
- Okeke, T. A., & Okeibunor, J. C. (2010). Rural–Urban differences in health-seeking for the treatment of childhood malaria in south-east Nigeria. Health Policy, 95, 62–68.
- Pathak, P. K., Singh, A., Subramanian, S. V., & Noor, A. M. (2010). Economic inequalities in maternal health care: Prenatal care and skilled birth attendance in India, 1992–2006. PloS One, 5, e13593.
- Psacharopoulos, G. (1994). Returns to investment in education: A global update. World Development, 22, 1325–1343.
- Pyone, T., Adaji, S., Madaj, B., Woldetsadik, T., & Van Den Broek, N. (2014). Changing the role of the traditional birth attendant in Somaliland. International Journal of Gynecology & Obstetrics, 127, 41–46.
- Ralph, J., O’Neill, R., & Winton, J. (2015). A practical introduction to index numbers. Chichester, UK: John Wiley & Sons.
- Ranieri, R., & Almeida Ramos, R. (2013). Inclusive growth: Building up a concept (Working Paper No. 104). Brasilia: International Policy Centre for Inclusive Growth.
- Rauniyar, G., & Kanbur, R. (2010). Inclusive growth and inclusive development: A review and synthesis of Asian Development Bank literature. Journal of the Asia Pacific Economy, 15, 455–469.
- Ruktanonchai, C. W., Ruktanonchai, N. W., Nove, A., Lopes, S., Pezzulo, C., Bosco, C., … Ali, M. (2016). Equality in maternal and newborn health: Modelling geographic disparities in utilisation of care in five East African countries. PloS One, 11, e0162006.
- Shariff, A., & Singh, G. (2002). Determinants of maternal health care utilisation in India: evidence from a recent household survey (No. 85). New Delhi: National Council of Applied Economic Research.
- Simkhada, B., Teijlingen, E. R. V., Porter, M., & Simkhada, P. (2008). Factors affecting the utilization of antenatal care in developing countries: Systematic review of the literature. Journal of Advanced Nursing, 61, 244–260.
- Smith, K. V., & Sulzbach, S. (2008). Community-based health insurance and access to maternal health services: Evidence from three West African countries. Social Science & Medicine, 66, 2460–2473.
- United Nations. (2011). World urbanization prospects, the 2011 revision. New York: Author.
- WHO. (2016). Family planning: Contraception-Fact sheet. Retrieved from the WHO website: http://www.who.int/mediacentre/factsheets/fs351/en/
- World Bank. (2014). Kenya public expenditure review (Vol. 2): Laying the foundation for a robust health care system in Kenya (English). Washington, DC: Author.
- World Development Indicators. (2017). Washington, DC: World Bank. Retrieved from the World Bank website: http://data.worldbank.org/data-catalog/world-development-indicators
- Xu, K., Evans, D. B., Kawabata, K., Zeramdini, R., Klavus, J., & Murray, C. J. (2003). Household catastrophic health expenditure: A multicountry analysis. The Lancet, 362, 111–117.
- Zepro, N. B., & Ahmed, A. T. (2016). Determinants of institutional delivery service utilization among pastorals of Liben Zone, Somali Regional State, Ethiopia, 2015. International Journal of Women’s Health, 8, 705–712.
Appendix A
Figure A1. Distribution of health facilities by type of provider.
Source: World Bank, 2014; kmhfl.health.go.ke (2013) data.
Appendix B
Growth incidence curves (GIC), GRIM, PPGR, CHIM and PPCH as introduced in Grosse et al. (2008)
GIC (Eq. 1) plots the population centiles (p) (from 1 to 100 ranked by income) against the change in income or any other development aspect (y) of the respective centiles between two years (t-1 and t).
If the number of poor people in year t is Ht, the pro-poor growth rate (PPGR, Eq. 2) is the mean of growth rates of the poor up to the headcount (Ht).
The growth in mean (GRIM, Eq. 3)) is the change in the mean income or any other development aspect () from one year to the other.
If PPGR exceeds GRIM, growth can be considered pro-poor in the relative sense. The absolute growth incidence curve is defined in Eq. 4.
Pro-poor change (PPCH, Eq. 5) is defined as the area under the absolute GIC up to headcount H.
The PPCH is compared to the change in mean (CHIM) defined in Eq. 6.
If PPCH is above zero, the improvement can be considered pro-poor in the weak absolute sense. If PPCH exceeds the CHIM, the growth is declared to be pro-poor in the strong absolute sense.
Appendix C
Constructing the PPGR and PPCH curves
Order socioeconomic groups (wealth quintiles, location of residence and educational background) according to their average wealth index
Compute the points of the PPGR (pro-poor growth rate) and PPCH (pro-poor change) curves the following way. Figure C1 can be used as illustration. To follow the idea of percentiles, point A is the change of the mean of the respective health variable in the bottom socioeconomic group (Group 1), point B is the change of the mean in the combined bottom two groups (Group 1 + Group 2) and the last point, point N, is the change of the mean in the combined bottom N groups (Group 1 + Group 2 + … + Group N). Point C is also the change of the population average.
Decide on which groups are considered poor
Groups considered poor by wealth: poorest, poorer, middle
Group considered poor by location: rural
Groups considered poor by educational attainment: no primary, primary
Compare the PPGR and GRIM and PPCH with CHIM to find out if changes in the investigated health variables can be considered pro-poor in the weak absolute, relative or the strong absolute sense.
If PPCH>0, improvement is pro-poor in the weak absolute sense
If PPGR>GRIM, improvement is pro-poor in the relative sense
If PPCH>CHIM, improvement is pro-poor in the strong absolute sense
Figure C1. Illustration of the PPGR and PPCH curves.