
 ?Mathematical formulae have been encoded as MathML and are displayed in this HTML version using MathJax in order to improve their display. Uncheck the box to turn MathJax off. This feature requires Javascript. Click on a formula to zoom.
Abstract
This study documents the impact of a cash transfer programme – known as the No Lost Generation Programme (NLG) and locally as Min Ila (‘from to’) – on the school participation of displaced Syrian children in Lebanon. An initiative of the government of Lebanon, the United Nations Children’s Fund (UNICEF), and the World Food Programme (WFP), the programme provided cash for the benefit of children enrolled in afternoon shifts at public primary schools. It was designed to cover the cost of commuting to school and to compensate households for income forgone because children were attending school instead of working. Commuting costs and forgone income are two critical barriers to child school participation. The analysis relies on a geographical regression discontinuity design to identify the impact halfway through the first year of programme operation, the 2016/2017 school year. The analysis finds substantive impacts on school attendance among enrolled children, which increased by 0.5 days to 0.7 days per week, an improvement of about 20 per cent relative to the control group. School enrolment among Syrian children rose rapidly across all Lebanon’s governorates during the period of the evaluation, resulting in supply-side capacity constraints that appear to have dampened positive enrolment impacts.
1. Introduction
The provision of education to refugee children is a global challenge. In 2017, more than half the world’s 25.4 million international refugees were children under the age of 18 (United Nations High Commissioner for Refugees [UNHCR], Citation2018a). The primary school participation rate among these children was only about 61 per cent, compared with a global average of 92 per cent. Secondary school participation was even lower, at 23 per cent, compared with 84 per cent globally (UNHCR, Citation2018b).
Rigorous evidence on the effects of education interventions among displaced children is limited. In a review of the literature, Burde, Guven, Kelcey, Lahmann, and Al-Abbadi (Citation2015) conclude that, within the settings of displacement and other humanitarian crises, few experimental or quasi-experimental studies rigorously identify the effects of interventions on education outcomes. Observational studies are more abundant. What the most rigorous experimental, quasi-experimental, and observational studies reveal (Burde et al., Citation2015) suggests that the continued availability of high-quality educational opportunities is critical for the development and well-being of children in crisis settings. However, evidence on the most effective ways to provide such education opportunities is mixed and limited. Educational opportunities may also play a role in the mitigation of conflict and, ultimately, in the recovery by refugee children of their home countries.
The reason for the paucity of experimental and quasi-experimental studies in settings of displacement and other humanitarian crises is described by Puri, Aladysheva, Iversen, Ghorpade, and Brück (Citation2017). Practical, methodological, and ethical challenges abound. For instance, timelines for the design and implementation of interventions and therefore also for accompanying studies tend to be short. Emergency interventions may not be uniformly implemented or may change. Opportunities for establishing and maintaining credible control groups are often limited. Security concerns may prohibit data collection. However, as other studies in this special issue show, opportunities for evidence generation may arise, especially in the build-up to or protracted aftermath of emergencies (for example, Schwab, Citation2019; Valli, Peterman, & Hidrobo, Citation2019).
This study contributes by examining the effectiveness of an intervention designed to improve the schooling outcomes and well-being of displaced Syrian children in Lebanon. The intervention was jointly developed by the Ministry of Education and Higher Education (MEHE) of Lebanon, the United Nations Children’s Fund (UNICEF), and the World Food Programme (WFP). The programme, referred to either as No Lost Generation (NLG) or, locally, as Min Ila (‘From To’), was piloted during the 2016/2017 school year. At the time, about one person in six in Lebanon was a refugee, the highest ratio of refugees in any country in the world (UNHCR, Citation2017). The MEHE and partner agencies had already implemented a variety of policies to enable Syrian children of primary school age to attend school. Primary school fees had been waived; primary school supply had been expanded by opening an afternoon shift (often referred to as the second shift) in public primary schools dedicated mainly to Syrian children, and an accelerated learning programme allowing children who had been out of school for a prolonged period to re-enter school at an age-appropriate grade was being scaled up.
Despite these efforts, approximately half the Syrian children of primary school age in Lebanon did not attend school in the 2015/2016 school year. A nationally representative household survey, the 2016 Vulnerability Assessment of Syrian Refugees in Lebanon (VASyR 2016), suggested that two demand-side barriers played a critical role in non-attendance: the cost of school (including the cost of commuting to school) and household reliance on children to help generate income. A residency fee of US$200 required of adult Syrians desiring to work in Lebanon, which many Syrian households could not afford, was presumably important in household decisions to send children to work instead of to school. (The fee was partially waived in February 2017.) The NLG/Min Ila Programme aimed to address these barriers by providing monthly cash transfers for each child enrolled in an afternoon shift at a primary school. The transfers covered roughly the cost of transport to school for children ages 5–9 and offset a substantive portion of the income lost if older children (ages 10–14) attend school. Although the transfers were not conditional on regular school attendance, households were asked to sign an agreement confirming that the cash was intended to facilitate children’s school attendance. The pilot programme was rolled out in two of Lebanon’s eight governorates.
This study estimates the immediate effect of the programme on school participation. It relies on a geographical regression discontinuity design comparing children in pilot governorates with children in neighbouring governorates. Using baseline data and global positioning system (GPS) coordinates collected from households in pilot and neighbouring districts in September and October 2016, the analysis shows that, prior to the implementation of the NLG/Min Ila Programme, the characteristics of households and children did not change discontinuously at the borders between the pilot and the nonpilot governorates. This finding is in accordance with the fact that the borders between the governorates under study do not appear to be meaningful in people’s lives and are difficult to notice as one travels through the country. Economic and political situations do not change in any obvious way as one crosses these borders. Education policies are determined centrally and do not differ across governorates. Moreover, there is no indication that governorate borders affect the decisions of Syrian households on where to live.
The analysis does not find evidence that the NLG/Min Ila Programme increased school enrolment in afternoon shifts or primary school enrolment in general after 4 months of programme implementation, in February and March 2017. Slightly more than 50 per cent of the children in the pilot areas enrolled in afternoon shift schools and thus took up the programme during the 2016/2017 school year, that is, the first year of programme implementation. This share did not appear to change discontinuously at the pilot governorate borders. Limited impacts on school enrolment may have been related to capacity constraints in afternoon shift schools. Primary school enrolment rates, including, but not limited to afternoon shift school enrolment rates, rose rapidly across the country during the period of the study. Among children in the areas neighbouring the pilot governorates, primary school enrolment increased from 63 per cent in the 2015/2016 school year to nearly 80 per cent in the 2016/2017 school year. An intensive back to school advocacy campaign implemented in the entire country, including both the comparison and the intervention areas, is presumed to have been crucial in supporting this rise in primary school enrolment. As a result, the margin for the impact of the cash transfer programme on enrolment was reduced. Moreover, many primary schools were full and could not incorporate more children, potentially limiting the opportunity for children to enrol in afternoon shift schools.
The analysis does find a positive impact on schooling outcomes among children who enrolled in afternoon shifts, that is, children who receive NLG/Min Ila Programme benefits. Household expenditure on the education of these children increased relative to the corresponding expenditure on children in the control governorates. Part of the rise in education expenditure was driven by the wider use of paid bus services to commute to and from school. Because afternoon shift schools close at nightfall during at least part of the school year, safe transport is considered a critical element of regular school attendance. Accordingly, the self-reported number of days of school attendance in the week prior to a follow-up interview several months into the school year was about 0.6 greater in the pilot governorates than in the control group, an increase of about 20 per cent. This expansion is comparable among younger children (receiving lower-value transfers) and older children and also among boys and girls. Thus, the impact on children’s school participation conditional on enrolment in an afternoon shift school appears to have been substantial.
The findings of the analysis relate to an extensive literature on the effects of cash transfers on education outcomes in developing country settings (reviewed by Baird, Ferreira, Özler, & Woolcock, Citation2014; Fiszbein & Schady, Citation2009; Saavedra & Garcia, Citation2012). They also relate to a smaller literature on the effects of cash transfers and other education interventions in humanitarian settings (reviewed by Burde et al., Citation2015; Doocy, Tappis, & Lyles, Citation2016).Footnote1 These systematic reviews and meta-analyses find that cash transfer programmes average a 6 per cent improvement in school enrolment and a 3 per cent improvement in student attendance. They find a range of effect intensities on schooling outcomes that partly depend on the size of the transfer and on the access to schools. However, none of the studies include cash transfers in refugee settings.
A particularly relevant related study has been conducted by the International Rescue Committee, which evaluated a winter cash transfer programme among Syrian refugees in Lebanon in 2014 (Lehmann & Masterson, Citation2014). The programme provided a one-time transfer of US$575 to Syrian refugees living in high-altitude locations (above 500 m). The goal was to keep people warm and dry during the winter months. The study found that the size of the transfer was too small to achieve the programme goal because the transfer was insufficient to allow people to acquire adequate supplies to remain warm. However, it also found that the transfer helped increase school enrolment and reduce child labour, although these were not programme goals. The study did not investigate the share of children in the sample who had access to schools in which to enrol, or whether capacity constraints in schools affected the impacts on education outcomes.
The remainder of this study proceeds as follows. Section 2 offers an overview of the Syrian refugee crisis and the situation of Syrians in Lebanon when the NLG/Min Ila Programme was developed, reports on pre-existing cash transfer programmes and education interventions among displaced Syrians in Lebanon, provides more detail on the NLG/Min Ila Programme, discusses the study design, and describes the data collection. Section 3 lays out the estimation strategy, discusses the validity of the strategy, and presents estimated programme impacts on school enrolment and attendance. Section 4 discusses and concludes.
2. Background
2.1. The Syrian refugee crisis and Syrians in Lebanon
An estimated 11 million of a total national population of 23 million have been forcibly displaced within or outside the Syrian Arab Republic. Of these people, 4.8 million have sought refuge in the neighbouring countries of Iraq, Jordan, Lebanon, and Turkey. Most Syrians arrived in these countries with limited savings and have struggled to earn steady incomes to meet the basic needs of their families, such as food, healthcare, and shelter. These basic needs often require immediate attention, which means that Syrian families have often been forced to forgo education and the associated long-term benefits in favour of meeting short-term needs. Consequently, more than 2.6 million children were estimated to be out of school in Egypt, Iraq, Jordan, Lebanon, the Syrian Arab Republic, and Turkey (UNHCR & United Nations Development Programme [UNDP], Citation2015).
Because of the Syrian crisis, Lebanon has had one of the highest per capita ratios of registered refugees in the world (Government of Lebanon & United Nations, Citation2014). Of a population of 5.9 million, 1.5 million were displaced Syrians, including approximately 500,000 children of primary school age. VASyR 2016 provides a representative picture of the lives of Syrian refugees in Lebanon shortly before the start of the NLG/Min Ila Programme. Fewer than half the children of primary school age were attending school at the time, reflecting the education crisis created by the sudden influx of the Syrian refugees, which also affected Palestinian and vulnerable Lebanese children. This share contrasts sharply with a net primary school enrolment rate in the Syrian Arab Republic of nearly 93 per cent prior to the onset of the crisis.Footnote2 Members of only about one Syrian household in five held residency permits. This is important because, at the time, Syrian adults were legally required to possess a residency permit before engaging in economic activities in Lebanon. Because the Lebanese government was implementing a no-camps policy, most Syrians (about 71 per cent) were living in residential buildings. The rest were living in non-residential buildings (12 per cent) or informal tented settlements (17 per cent), often in overcrowded and dangerous circumstances and lacking basic sanitary facilities. A majority of Syrians (70 per cent) were living below the poverty line established by the World Bank, and most households (93 per cent) were experiencing some degree of food insecurity.
2.2. Cash transfer programmes and education interventions
Cash support: The WFP electronic food voucher (e-card) programme, which started operating in 2013, is the largest cash support programme among displaced Syrians in Lebanon. Beneficiaries receive a benefit payment loaded on an e-card at the beginning of each month. The money can be used to purchase food from more than 400 local shops. The programme initially provided this service to 900,000 refugees, but the coverage has subsequently fluctuated because of volatile funding. UNHCR and the Lebanon Cash Consortium, which consists of four international nongovernmental organisations, started implementing the Multipurpose Cash Assistance Programme in 2014. The programme provides a smaller number of highly and severely vulnerable Syrian refugee families with monthly payments and an additional winter subsidy. In 2016, UNICEF started providing winter-related cash support for the benefit of children living in informal tented settlements and collective shelters.Footnote3
Education interventions: Since the onset of the Syrian crisis, the MEHE, together with UNICEF and other partners, has worked to ensure access to education among Syrian children through its strategy, Reaching All Children with Education. The strategy aims to provide all school-age children with formal and accredited education opportunities. To reduce school-related expenses, the MEHE has waived fees in primary education, provided students with basic supplies, and waived the need for residency documentation. In 2013, the MEHE, with support from bilateral donors, UNHCR, UNICEF, and the World Bank, also launched an afternoon shift for Syrian children to accommodate the growing number of Syrian refugee children in Lebanese public schools. These schools follow the Lebanese curriculum, which is mostly taught in Arabic, though some classes are taught in French, potentially creating challenges among Syrian children, who do not typically speak French. To facilitate the transition of Syrian children from the Syrian curriculum to the Lebanese curriculum, the MEHE and UNICEF have developed the Accelerated Learning Programme. Programme classes are designed for refugee children who have been out of school for a prolonged period and children with language deficiencies and are intended to enable these children to (re-)enrol in age-appropriate grades. Caritas and UNICEF also offered transportation to school for the most vulnerable refugees who live 2.5 km or more from the nearest school, have a disability, or reside in a high-altitude location.
2.3. The NLG/Min Ila Programme
VASyR 2016 shows that nearly half of all displaced Syrian children of primary school age (6–14) in Lebanon were out of school despite the described cash transfer programmes and education interventions. The NLG/Min Ila Programme was designed to address two critical demand-side barriers to school participation identified in VASyR 2016: the cost of education and the reliance of households on children for income generation.
The NLG/Min Ila Programme provided income transfers to households with children enrolled in afternoon shifts. The benefit for younger children, ages 5–9, was US$20 a month, which was estimated to be sufficient to offset the cost of commuting to school for the average Syrian child in Lebanon.Footnote4 The benefit for older children, ages 10–14, was greater, US$65 a month, which was estimated to be sufficient to offset a considerable portion of the average monthly indirect costs of schooling and the forgone earnings of a working child. Thus, among the households of older children, the cash transfer programme was expected to assist in offsetting the opportunity costs of school attendance. The transfers were unconditional, but they were labelled because households were asked to sign an agreement when they registered as pilot beneficiaries. The agreement stated that households understand that the cash is intended to facilitate school attendance among their children and that the households are willing to be visited by pilot programme field operatives for referral for complementary services if the children are absent from school for more than 10 consecutive schooldays.Footnote5
The government took the decision to pilot the NLG/Min Ila Programme at scale in the governorates of Akkar and Mount Lebanon during the 2016/2017 school year. These governorates were selected during conversations between the MEHE and UNICEF. They were selected because they were expected to be representative in terms of population and programme implementation challenges, thereby allowing the generation of lessons that could be applicable to the entire country. The implementation of the pilot programme was advertised in time for households to adjust their school enrolment decisions at the start of the school year.
2.4. Study design
The analysis relies on a longitudinal geographical regression discontinuity design comparing eligible households in pilot governorates with similar households in neighbouring governorates – North Governorate next to Akkar and Nabatieh Governorate and South Governorate near Mount Lebanon – that had not begun receiving the transfers during the period of the study. The 74 schools offering afternoon shift education closest to the borders separating the pilot governorates and the comparison governorates – roughly half the afternoon shift schools in the governorates – were selected to facilitate the implementation of a geographical regression discontinuity design: 21 in Akkar, 22 in North Governorate, 20 in Mount Lebanon, and 11 in South Governorate and Nabatieh Governorate. To ensure that all selected schools would be located in similar peri-urban and rural areas, schools located in the three largest cities of Lebanon (Beirut in Mount Lebanon, Sidon in South Governorate, and Tripoli in North Governorate) were not considered.
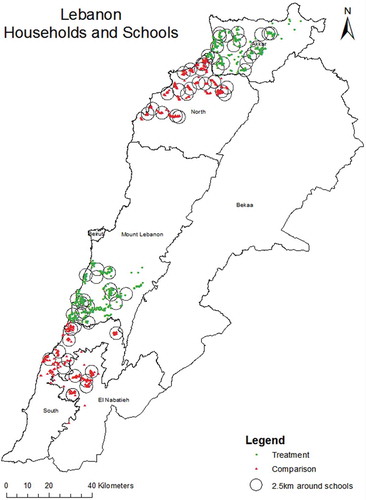
Syrian households in the cadastres in which the schools were located were then sampled into the study. Cadastres are small administrative geographical units, somewhat comparable in size with census enumeration areas in other countries. The sampling process relied on the UNHCR registry of Syrian households in Lebanon. (At the time, the majority of displaced Syrians in Lebanon were presumed to be registered with UNHCR.) UNHCR provided a list of up to 100 randomly drawn eligible households, that is, households with children ages 5–14, in each cadastre.Footnote6 These households were sorted in random order, and survey teams visited households in the order of this ranking until 20 households had been interviewed.Footnote7 This procedure resulted in a sample of 1,440 households with 1,784 children ages 5–9 and 1,647 children ages 10–14.Footnote8 GPS coordinates were collected for each household, enabling the calculation of the distance of the household from the border with the paired pilot or comparison governorate. shows the geographical distribution of treatment (pilot) households, comparison households, and afternoon shift schools within the study areas. Each afternoon shift school is at the centre of a circle with a scaled radius of 2.5 km. The small green circles each denote a pilot household, and the small red triangles each denote a comparison household. The majority of the households are within the circles around the afternoon shift schools and, thus, within a distance of 2.5 km from such a school. The study design was based on the assumption that children living within this radius would not be out of school because of constraints on school availability.Footnote9
Map 1. Pilot households and comparison households.
A key concern about the validity of the study design is that there could be structural differences that distinguish pilot governorates from comparison governorates. However, extensive discussions with local counterparts did not reveal any such differences. The borders separating the pilot and comparison governorates do not appear to be meaningful in people’s lives and are difficult to notice as one travels through the country. Economic and political situations do not change noticeably after one crosses these borders. Education policies are determined centrally and do not differ across governorates. Moreover, there is no reason to assume that governorate borders affect or have affected the (re-)location decisions of Syrian households. Accordingly, as discussed below, the analysis finds that the pre-intervention characteristics of the households in the sample do not change discontinuously at the borders.
2.5. Data collection
A baseline questionnaire was administered to each of the 1,440 households before the start of the 2016/2017 school year in September and October 2016, that is, the year in which the pilot cash transfer programme was launched. The questionnaire was administered to a knowledgeable household member and covered the following domains: household demographics, health, education, economic activities, assets, living conditions, household enterprises, access to credit, access to facilities and services, poverty, and food security. A follow-up questionnaire was administered to the same households by telephone in March 2017, several months into the programme and the school year. The follow-up data collection focused on education outcomes among children, specifically, enrolment and attendance during the 2016/2017 school year. Up to five attempts were made to reach all baseline households over the phone. In principle, call centre interviewers attempted to interview the same household member interviewed at baseline. Only if that person could not be reached was another knowledgeable household member interviewed. The phone interviews were piloted to ensure the accuracy and reliability of responses. There is no reason to believe that responses to the follow-up phone interview were less reliable than the baseline face-to-face interviews.
3. Estimation strategy and results
3.1. Estimation strategy
The analysis relied on the following regression specification to estimate the intent-to-treat effect of the programme on the outcome variables of interest:
where Yihsg1 is the outcome variable for child i in household h living in the vicinity of school s in governorate g at follow-up (denoted by subscript 1). Dg indicates residence in a pilot governorate, and distanceihsg0 is the assignment variable measuring distance to the border separating comparison and pilot governorates at baseline (0). The assignment variable is negative in comparison governorates and positive in pilot governorates. Xihsg0 is a vector of baseline covariates that include child age dummies, child gender, and an indicator taking the value 1 if the child’s parents had studied beyond primary school. Standard errors are clustered at the school level to allow for correlation of the error term, εihsgt, meaning Cov(εihsg1, εjhsg1) ≠ 0 for i and j near the same school. The coefficient of interest is β1, which gives the impact of the programme.
The regression discontinuity design in this context relies on households that are located along one of two borders: the Akkar-North border and the Mount Lebanon–South border. The term Pairg represents a fixed effect to account for differences between households located near the two borders (that is, Pairg takes the value 1 for Akkar and North governorates and 0 otherwise). Essentially, because a border fixed effect is included in all estimations, the sample is treated as though all households are located near a single border. The term f(distanceihsg0) represents the functional relationship between the distance of households to the border and the outcome variable of interest. This study reports on a simple linear functional form and a slope that may differ outside and inside pilot governorates, that is, f(distanceihsg0) = β4a distanceihsg0 + β4b distanceihsg0*Dg).
3.2. Attrition, descriptive statistics, and baseline balance
3.2.1. Attrition
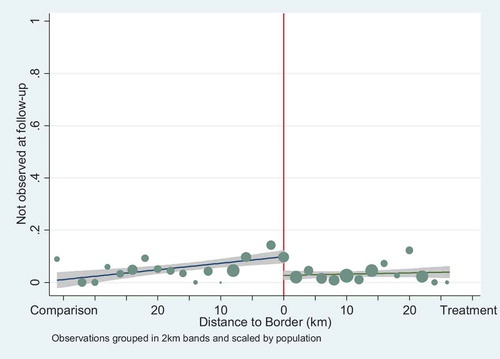
In this discussion and in the remainder of the study, the sample is restricted to households and children living within a 2.5 km radius of an afternoon shift school. The sample is additionally restricted to those children for whom baseline school enrolment is available.Footnote10 Of the 2,897 children, ages 5–14 observed at baseline and living within the 2.5 km radius, the average interview rate at follow-up was nearly 96 per cent. At the borders separating treatment and control governorates, attrition was about 7 percentage points higher in the control group than in the pilot group (see Appendix A, ; the formal estimation results are not displayed). However, the difference in attrition rates does not appear to have resulted in an imbalance in the baseline characteristics of households and children (see below).
3.2.2. Descriptive statistics
First, the initial characteristics of households in the treatment governorates, that is, potential programme beneficiaries, that were observed also at follow-up are summarised. The focus is on household demographics, housing conditions, economic well-being, adult characteristics, and child characteristics. describes the demographic characteristics of the sample households. The average eligible beneficiary household in the sample consists of a little more than six people (see the treatment mean column), including about 2.7 children ages 5–14, that is, the cash transfer recipient age. In principle, the average eligible beneficiary household is therefore eligible to receive multiple transfers each month, potentially including both smaller and larger transfers. The remainder of the beneficiary households primarily consists of working-age adults and children; less than 1 per cent are ages 65 or older (not displayed). The average household left the Syrian Arab Republic about 4 years before the baseline, suggesting that households stayed in that country for 1 or 2 years after fighting broke out in April 2011. Although it is not possible to state how long the households have been in their current locations, the assumption seems reasonable that households had been in Lebanon a sufficient time to understand key processes such as school enrolment or searching for jobs.
Table 1. Household demographic and composition characteristics at baseline
Approximately half the adult members in eligible beneficiary households (52 per cent) are women (). The average adult is 35 years old. The adult literacy rate is 82 per cent. Labour force participation is low among adults in eligible beneficiary households, probably reflecting the constraints on adult engagement in economic activities (described above). Only 25 per cent of adults had worked during the week prior to the baseline survey. The health of about 61 per cent of adult household members was rated as good or very good; about half of adult household members could walk 5 km easily, and about 58 per cent could sweep the floor easily.
Table 2. Adults ages 17+: demographic characteristics at baseline
Households mostly reside in unfavourable circumstances (). Around 64 per cent of households are located in houses, 17 per cent in tented settlements, and the remainder in other arrangements, such as garages. This roughly corresponds with national averages. About one-third of households are in overcrowded locations, and dwellings in poor condition (12 per cent) or even dangerous condition (6 per cent) are not uncommon. Most households have access to legal electricity (92 per cent) and toilets or latrines (100 per cent), but only 33 per cent have running water in the dwelling.
Table 3. Housing quality and access to basic services at baseline
Eligible beneficiaries survive on low levels of income (most of which is derived from cash earnings and United Nations cash assistance), take on debt to meet needs, and face frequent food insecurity (). Daily income per capita is less than half the Lebanese poverty line, which is US$3.84 per person per day, suggesting that eligible beneficiaries do not receive enough to meet basic needs.Footnote11 Slightly more than half the households (55 per cent) reported that they did not have sufficient food during the 7 days prior to the survey. Children with poor diets are likely to have poor school attendance (Drake, Woolnough, Burbano, & Bundy, Citation2016). However, children appear to suffer less than adults from food insecurity. Although 42 per cent of households reported that someone had skipped a meal, only 13 per cent of eligible beneficiaries reported that a child had skipped a meal, suggesting that adults assume at least part of the burden of food insecurity. Administrative United Nations data about other cash transfer programmes were linked to the sample to determine how many transfers each household receives, in addition to the cash transfers of the NLG/Min Ila Programme. Almost all households (99 per cent) receive at least one other type of humanitarian cash transfer. Over 91 per cent receive WFP e-voucher assistance, and well over half of all households receive at least one form of winter assistance.
Table 4. Household economic well-being and exposure to aid at baseline
The average child in the sample was 9 years old, and nearly 50 per cent of the children in the sample were girls (). About 65 per cent of children were enrolled in school at baseline; enrolment in afternoon shift schools was about 30 per cent. Boys and girls were equally likely to be enrolled in school, including afternoon shift schools. School enrolment rates, including in afternoon shift schools, were also similar among younger children (ages 5–9) and older children (ages 10–14).Footnote12 Among nearly half the children who were not in school, the primary reason for nonenrolment was cost (not displayed).
Table 5. Children ages 5–14: demographic characteristics, education, and time use at baseline
In the case of the children enrolled in an afternoon shift school, annual education expenditure averaged US$62. Education expenditure appears to be higher for girls than for boys, potentially because, in the pilot areas, girls are more likely than boys to travel to school by bus (63 per cent v. 55 per cent). This gender pattern is not observed in the comparison areas. Average annual education expenditure and the probability of commuting to school by bus are similar for younger children and older children.
3.2.3. Baseline equivalence
On average, households in the governorates neighbouring the pilot governorates are more well off in some respects. They have somewhat higher per capita incomes and experience markedly less food insecurity. These findings reflect the fact that there appears to be a gradient in well-being: areas towards the south of Lebanon are more well off than those farther towards the north. (The comparison areas are both to the south of the pilot governorates.) There is no evidence, however, that baseline characteristics change discontinuously at the borders separating the pilot and comparison governorates. The application of the regression discontinuity estimation procedure reveals no systematic difference in baseline characteristics between the pilot and comparison households or individuals. Estimated discontinuities at the borders separating pilot and neighbouring governorates (–, columns 5 and 6) are mostly limited in magnitude and not statistically significant, suggesting that a geographical regression discontinuity approach is valid.
The remainder of this subsection discusses the balance of the main outcome variables in more detail. (Appendix B discusses the definition of the outcome variables.)
Baseline school enrolment is examined in , panel a. The horizontal axis in the panel represents distance (in kilometres) to the border separating the pilot governorates (Akkar and Mount Lebanon) from the comparison governorates (North, South, and Nabatieh). The vertical red line represents the border itself. The vertical axis measures the share of children enrolled in school at the time of the baseline interview. Dots represent local averages for clusters of households. Bigger dots represent more households. Linear ordinary least squares regression lines have been fitted to the left and the right of the borders. Grey areas represent the 95 per cent confidence interval around the regression line. There is no visible jump in enrolment rates at the border separating pilot and comparison governorates, suggesting balance at baseline. Baseline afternoon shift enrolment was balanced (, panel b). Conditional on enrolment in afternoon shift schools, per child annual education expenditures (in US dollars) and the use of bus transport to commute to school were balanced at baseline (, panels c and d).
Figure 1. Baseline balance.
Notes: The horizontal axis represents distance (in kilometres) to the border separating the pilot governorates (Akkar and Mount Lebanon) from the comparison governorates (North, South, and Nabatieh). The vertical red line represents the border. The vertical axis measures the outcome variable of interest. Dots represent local averages, scaled by the number of households. Linear ordinary least squares regression lines have been fitted to the left and the right of the border. Grey areas represent the 95 per cent confidence interval around the regression line.
*Panels c and d represent data conditional on enrolment in an afternoon shift. Observations, panels a and b: 2,767. Observations, panels c and d: 940.
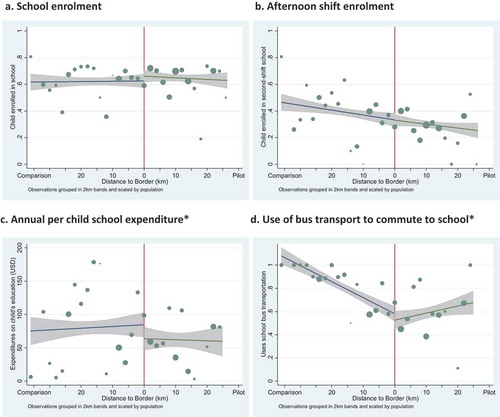
These findings are confirmed in the formal estimates displayed in . Differences in enrolment and afternoon shift enrolment at the borders separating pilot and comparison areas were not statistically significant at baseline. Conditional on enrolment in an afternoon shift school, education expenditures appear to have been lower in pilot areas than in comparison areas. Conditional on enrolment in an afternoon shift school, children in pilot and comparison areas are, however, equally likely to commute to school by bus.
3.3. Impacts on school enrolment
Aggregate administrative MEHE data (not displayed) suggest that formal school enrolment rates among displaced Syrian children rose rapidly across the country from the 2015/2016 school year to the 2016/2017 school year. The increase in overall afternoon shift school enrolment appears to have been particularly pronounced in pilot areas: the average enrolment in afternoon shifts increased by 51 per cent in NLG/Min Ila Programme pilot areas compared with 41 per cent in the rest of the country, potentially signalling an impact of the cash transfer programme on enrolment outcomes.
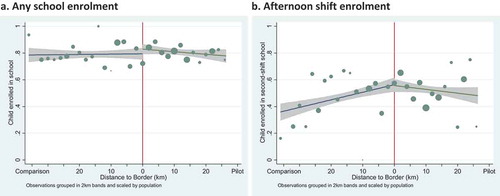
However, that the programme increased enrolment cannot be confirmed based on the regression discontinuity estimates. The data collected for this study confirm that overall school enrolment rates and afternoon shift enrolment rates rose substantially in pilot areas and in comparison areas. Overall school enrolment rates increased from nearly 60 per cent at baseline to nearly 80 per cent at follow-up in pilot areas and in comparison areas. Afternoon shift school enrolment rates rose from about 31 per cent to 51 per cent among children in the evaluation sample in treatment areas and from about 41 per cent to 48 per cent among children in the comparison areas. However, at follow-up, school enrolment rates did not jump as one crosses the Akkar-North and Mount Lebanon–South borders. Thus, it cannot be confirmed that the more pronounced average increase in afternoon shift enrolment in pilot areas relative to comparison areas was driven by the cash transfer programme. The regression discontinuity estimates are shown graphically in , panel a, while the regression estimates of the impact of the programme are shown in , column 1. Neither result suggests that the NLG/Min Ila Programme significantly raised overall school enrolment. No significant impacts were revealed among subgroups either (younger or older children and boys or girls). Similarly, no programme impacts were observed for afternoon shift school enrolment (, panel b; , column 2).
Table 6. Regression results
Figure 2. End line school enrolment.
Notes: The horizontal axis represents distance (in kilometres) to the border separating the pilot governorates (Akkar and Mount Lebanon) from the comparison governorates (North, South, and Nabatieh). The vertical red line represents the border. The vertical axis measures the outcome variable of interest. Dots represent local averages, scaled by the number of households. Linear ordinary least squares regression lines have been fitted to the left and the right of the border. Grey areas represent the 95 per cent confidence interval around the regression line. Observations: 2,767.
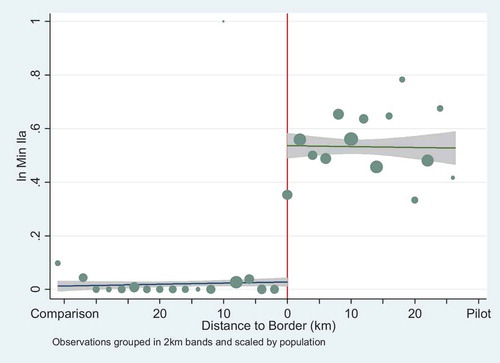
As shown in , the possibility that the lack of an impact on afternoon shift enrolment may be driven by households from neighbouring governorates taking up the programme can be ruled out. According to programme administrative data, almost no households – only about 1.6 per cent – in neighbouring governorates accessed the programme. The probability of benefiting from the NLG/Min Ila Programme jumps to about 50 per cent in pilot areas, in accordance with measured afternoon shift enrolment rates. The formal estimates confirm that NLG/Min Ila Programme enrolment jumps by about 50 percentage points at the borders separating pilot and comparison areas (see , column 3).
Figure 3. End line NLG/Min Ila Programme beneficiary households.
Source: Calculated based on administrative data.
Notes: The horizontal axis represents distance (in kilometres) to the border separating the pilot governorates (Akkar and Mount Lebanon) from the comparison governorates (North, South, and Nabatieh). The vertical red line represents the border. The vertical axis measures enrolment in the NLG/Min Ila Programme at follow-up. Dots represent local averages, scaled by the number of households. Linear ordinary least squares regression lines have been fitted to the left and the right of the border. Grey areas represent the 95 per cent confidence interval around the regression line. Observations: 2,767.
There are several potential reasons a household might not have enrolled children in an afternoon shift school. The nearest afternoon shift school may have been overenrolled and may therefore not have allowed the enrolment of new pupils. Households may have preferred schools of another type, such as first shift or private schools. Households may not have known about or may not have been interested in the NLG/Min Ila Programme. Each of these three potential explanations is examined hereafter.
There is evidence suggesting that school capacity constraints may have played a critical role in limiting the impact of the programme on enrolment. Administrative MEHE data indicate that over half the afternoon shift schools in the study had reached full capacity during the registration phase, thereby preventing children from enrolling in school and, hence, in the NLG/Min Ila Programme.Footnote13 Moreover, a majority of households continue to report that cost is an important motive for keeping older children out of school. This would be a logical finding if afternoon shift schools are at capacity and only other types of schools that are not eligible for the NLG/Min Ila Programme are available. Ongoing attendance at other types of schools also appears to limit programme impacts on afternoon shift enrolment. About 30 per cent of children continue to attend a first shift public school or a private school. A possible reason is that these schools offer higher-quality education, perhaps partly because of overenrolment in afternoon shift schools. It seems unlikely that households were not aware of the NLG/Min Ila Programme or that households were not interested in participating in the programme. The programme was widely advertised, and, because most Syrian households are in urgent need of income, information about support programmes spreads quickly in any case.
3.4. Impacts on education expenditure, bus transport, and school attendance
Despite limited impacts at the extensive margin, the NLG/Min Ila Programme appears to have led to improvements in education outcomes among children enrolled in afternoon shifts. Conditional on enrolment in an afternoon shift, education expenditure and reliance on bus transport to commute to and from school rose significantly in pilot governorates (, panels a and b). Estimates indicate that annual education expenditure per child rose by about US$74, while the probability of commuting to school by bus increased by 14 percentage points (see , columns 4 and 5).
Figure 4. End line education outcomes, conditional on enrolment in an afternoon shift.
Notes: The horizontal axis represents distance (in kilometres) to the border separating the pilot governorates (Akkar and Mount Lebanon) from the comparison governorates (North, South, and Nabatieh). The vertical red line represents the border. The vertical axis measures the outcome of interest. Dots represent local averages for clusters of households, scaled by the number of households. Linear ordinary least squares regression lines have been fitted left and right of the border. Grey areas represent the 95 per cent confidence interval around the regression line. In panel a, 28 observations with values above US$400 were dropped for ease of comprehension. Observations, panel a: 1,364. Observations, panels b and c: 1,392.
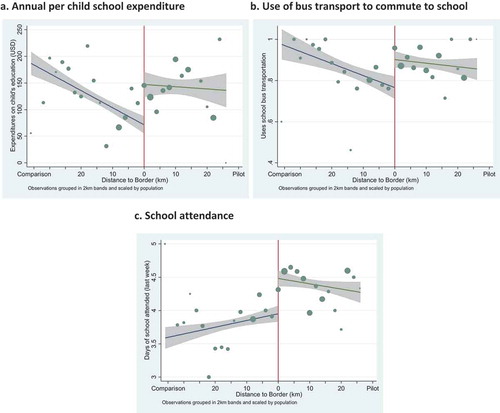
There was a concurrent rise in the number of days of school attendance among children enrolled in afternoon shift schools.Footnote14 There is a discontinuity in the number of days of school attended in the week prior to the follow-up interview among children enrolled in afternoon shift schools (, panel c). The average increase was about 0.6 days per week, which translates into an additional month of attendance annually among children in the pilot programme (see ). Thus, children enrolled in afternoon shifts in the pilot areas spent roughly 20 per cent more time in school relative to similar children in comparison areas. Children receiving the NLG/Min Ila Programme benefits attend school 4.1 days per week on average, which means they are in school during more than 80 per cent of the possible time. The impact of the programme on education expenditure, bus transport, and days of school attendance is similar among younger and older children and among boys and girls.
3.5. Robustness and study limitations
The primary analysis involves a linear specification without bandwidth adjustments. Appendix C presents two robustness checks. The first relies on a somewhat more flexible functional form. The second directly compares average outcomes among children living within 20 km of the borders separating pilot and nonpilot governorates, without making any regression discontinuity adjustment. The findings of these robustness checks are consistent with those in the primary specification. However, in general, the findings presented in this study are sensitive to the use of more flexible regression discontinuity specifications, including those comprising higher order polynomial specifications and smaller bandwidths. The decision was taken not to rely on bandwidth reductions in the primary specification because these rapidly reduce the number of clusters driving study findings.
A few limitations of this study may be readily highlighted. First, the study focuses on the impacts of the NLG/Min Ila Programme on schooling outcomes and does not examine impacts in other key areas of children’s psychosocial development and well-being, including mental health, parental involvement in children’s education, engagement in economic activities and household chores, nutrition, and so on. Additional follow-up data will be used to explore these dimensions of programme impact in more detail.
Second, the geographical regression discontinuity design leaves open the possibility that observed differences between pilot and comparison households may result from an effect other than the cash transfers, such as structural differences in other education policies in pilot and comparison governorates over the period of the study. This study identified no such structural differences across governorates, but, because many actors are implementing interventions in Lebanon, this possibility cannot be ruled out with complete certainty.
Third, because this study relies on a regression discontinuity design, it identifies a local treatment effect at the borders separating pilot and non-pilot areas. Moreover, because this study focuses on impacts near pre-existing afternoon shift schools, it does not capture impacts on school outcomes in other areas where new schools may have been opened up.
4. Conclusion
This study examines the impacts of the NLG/Min Ila Programme pilot cash transfers on education outcomes in enrolment and attendance after a few months of programme implementation. Over the period of the study, school enrolment increased across the country, including in the pilot and comparison governorates. Possibly because of the resulting capacity constraints in afternoon shift schools, the study has not identified a programme impact on school enrolment in pilot governorates over and above the nationwide increase in enrolment. However, it does find a beneficial impact of the programme on education outcomes among children enrolled in school. School expenditures, use of bus transport, and school attendance increased among all subgroups of children, including subgroups divided by age and gender. Improving school attendance among children is crucial because the benefits of schooling accumulate as more time is spent in the classroom; the more time children spend in school, the more they are likely to learn and the more they will benefit in other ways as well.
There are many other settings and contexts in which humanitarian organisations rely on related programmes to assist refugees. Thus, cash transfer programmes similar to the NLG/Min Ila Programme support hundreds of thousands of Syrian refugee children in Jordan and Turkey. Yet, few humanitarian cash transfer programmes have been rigorously evaluated, leaving a critical knowledge gap on programmes that are successful in helping refugees. The evidence generated by this study advances the understanding of the effects of cash-based education programming in humanitarian settings and may prove useful in helping policy-makers and financing agencies reach informed decisions about the allocation of scarce resources to confront the growing problems associated with refugees in low- and middle-income countries.
Two key take-aways may be highlighted. First, the finding that capacity constraints in afternoon shift schools may have limited programme impacts on school enrolment provides an important lesson for humanitarian programming. In settings of massive displacement such as Lebanon, supply-side constraints may hamper the delivery of goods and services to populations in need across many sectors, including education, but also healthcare, hygiene, nutrition, and so on. As a result, demand-side interventions may not be able to achieve the outcomes desired unless they are implemented in coordination with supply-side interventions.
Second, the refugee setting creates many challenges in the design and implementation of rigorous evaluations. However, as demonstrated by this and a small group of other studies, it is possible and important to identify opportunities to carry out rigorous evaluations of strategic humanitarian interventions even in challenging contexts. A key lesson of this study is that opportunities for such research and evaluation arise especially during the initial stages of the design and pilot implementation of programmes. The involvement of a study team at these stages may help in both applying the lessons from other settings in programmatic decisions and identifying a study design that can credibly determine programme effects.
Acknowledgements
The authors thank UNICEF Lebanon for the opportunity to carry out this study and for financial and technical support. They would like also to recognise the many individuals and organisations without which it would not have been possible to complete this study. They thank the Programme Management Unit of the Reaching All Children with Education Project in Lebanon’s Ministry of Education and Higher Education (MEHE), including Sonia Khoury, Bane Khalife, Georges Ghassan, and Maroun Hobeika, the UNICEF Middle East and North Africa Regional Office, the UNICEF Office of Research - Innocenti, the United Nations Refugee Agency (UNHCR), the World Food Programme (WFP) (Jordi Renart and Soha Moussa), and Statistics Lebanon for technical or financial support at various stages of the project.
Special thanks go to Violet Speek-Warnery, Georges Haddad, Sharlene Ramkissoon, Juan Santander, Maxime Bazin, Abed Alrahman Faour, Louisa Lippi, and Georges Fares at UNICEF Lebanon for their technical support during the research and during the design and implementation of the fieldwork. The authors thank Rabih Haber, Hanane Lahoud, and Elie Joukhadar of Statistics Lebanon and Mohammed Elmeski of the American Institutes for Research for their support during the implementation of the fieldwork. They gratefully acknowledge feedback on the initial evaluation design by members of the UNICEF Office of Research Review Group, including particularly Sudhanshu Handa and Amber Peterman. They also thank Gustavo Angeles, Amber Peterman, and Dan Sherman for detailed comments on an earlier draft of this report.
The acknowledgements would be incomplete without mentioning the team of able research assistants. Kevin Kamto of the American Institutes for Research provided invaluable data support, and the project manager, Mariela Goett, helped coordinate and support all activities. The authors also acknowledge the input of the team of enumerators and supervisors at Statistics Lebanon whose dedication during data collection ensured that the data collected were of high quality.
The patience shown by Syrian refugee households, community leaders, and community members during interviews is also gratefully acknowledged. It is hoped that the insights derived from the information they provided will translate into valuable support for their communities.
The data used in this study are currently not in the public domain. The authors will make any information about data release available online. The findings, interpretations and conclusions expressed in this paper are those of the authors and do not necessarily reflect the policies or views of UNICEF.
Disclosure statement
No potential conflict of interest was reported by the authors.
Notes
1. Puri et al. (Citation2017) note that, although rigorous impact evaluation methods can be helpful in learning about the effectiveness of interventions following humanitarian emergencies, such evaluations are more difficult to implement in the aftermath of humanitarian crises, where ethical concerns sometimes prevent the use of control or comparison groups. For this reason, only a few studies have examined the impact of cash transfers in humanitarian contexts in a rigorous manner.
2. See Education (database), United Nations Educational, Scientific, and Cultural Organisation, Institute for Statistics, Montreal, http://data.uis.unesco.org/; EdStats: Education Statistics (database), World Bank, Washington, DC, http://datatopics.worldbank.org/education/.
3. When the present study was designed, the value of the monthly WFP payment was US$27; the value of the monthly Multipurpose Cash Assistance Programme benefit was US$174, and the value of the winter subsidy was US$100–US$147.
4. US$20 is the average expenditure per child on the Caritas-UNICEF bus services.
5. Information on the reason for non-attendance is sought during the field visit, and household members (children) may be referred for complementary services offered by the government, UNICEF, or other agencies that address non–income-related constraints, such as the need for psychosocial support or difficulty keeping up with the Lebanese curriculum. In this way, the cash transfer programme can contribute to an integrated package of support. This process had not yet been launched at the time of the follow-up data collection reported in this study.
6. If the list provided by UNHCR contained fewer than 90 households, the evaluation team included additional neighbouring cadastres as necessary in an attempt to obtain a list of at least 90 households in the vicinity of each school.
7. To find and reach the threshold of 20 households per cadastre needed for the study interviews, the survey teams typically required lists of more than 50 households per cadastre.
8. The target sample was the 20 households per cadastre, for a total of 1,480 households. However, 40 households either did not meet the eligibility criterion of the presence of a child 5–14 years of age or could not be interviewed.
9. During the 2015/2016 school year, Caritas and UNICEF ran a school bus programme that provided transport to school for children living far from a school. The programme was stopped in the governorates of Akkar and Mount Lebanon during the 2016/2017 school year, but continued in the rest of the country. However, because the bus service is available only to children living 2.5 kilometres or more from the nearest school, the presence or absence of the bus service is not expected to confound the results presented in this study.
10. Information on school enrolment is missing on 1.5 per cent of the children in the sample.
11. Per capita income is calculated by summing household income from wages, self-employment, cash from friends, cash from support agencies, food aid, remittances, and the sale of assets over the previous 30 days and then dividing by household size.
12. School enrolment has an inverted U-shaped relationship with age. School enrolment peaks roughly at the age of 10 (not displayed).
13. New afternoon shifts were opened in response to the increased demand in other parts of the pilot governorates; however, this change was not captured by the study because the sample was selected from those households living in the vicinity of afternoon shift schools that already existed.
14. Baseline statistics on attendance were not available during the week prior to the interview because the baseline was conducted during the summer break. Thus, changes in attendance among these groups cannot be measured. It is only possible to determine how these groups compared with each other at follow-up.
References
- Baird, S., Ferreira, F. H. G., Özler, B., & Woolcock, M. (2014). Conditional, unconditional and everything in between: A systematic review of the effects of cash transfer programs on schooling outcomes. Journal of Development Effectiveness, 6, 1–43.
- Burde, D., Guven, O., Kelcey, J., Lahmann, H., & Al-Abbadi, K. (2015, October). What works to promote children’s educational access, quality of learning, and wellbeing in crisis-affected contexts (Education Rigorous Literature Review Series). London: Interagency Network for Education in Emergencies and UK Department for International Development.
- Doocy, S., Tappis, H., & Lyles, E. (2016). Are cash-based interventions a feasible approach for expanding humanitarian assistance in Syria? Journal of International Humanitarian Action, 1, 1–13.
- Drake, L., Woolnough, A., Burbano, C., & Bundy, D. (2016). Global school feeding sourcebook: Lessons from 14 countries. London: Imperial College Press.
- Fiszbein, A., & Schady, N. R. (2009). Conditional cash transfers: Reducing present and future poverty (World Bank Policy Research Report Series). With F. H. G. Ferreira, M. E. Grosh, N. Keleher, P. Olinto, & E. Skoufias. Washington, DC: World Bank.
- Government of Lebanon & United Nations. (2014, December 15). Lebanon crisis response plan 2015–16. Beirut: Government of Lebanon; United Nations High Commissioner for Refugees; United Nations Office for the Coordination of Humanitarian Affairs.
- Lehmann, C., & Masterson, D. (2014, August). Emergency economies: The impact of cash assistance in Lebanon; An impact evaluation of the 2013–2014 winter cash assistance program for Syrian refugees in Lebanon. Beirut: International Rescue Committee.
- Puri, J., Aladysheva, A., Iversen, V., Ghorpade, Y., & Brück, T. (2017). Can rigorous impact evaluations improve humanitarian assistance? Journal of Development Effectiveness, 9, 519–542.
- Saavedra, J. E., & Garcia, S. (2012, February). Impacts of conditional cash transfer programs on educational outcomes in developing countries: A meta-analysis (Labor and Population Working Paper No. WR-921-1). Santa Monica, CA: RAND Corporation.
- Schwab, B. (2019). Comparing the productive effects of cash and food transfers in a crisis setting: Evidence from a randomised experiment in Yemen. Journal of Development Studies, 55(S1), 29–54.
- United Nations High Commissioner for Refugees (UNHCR). (2017, June 19). Global trends: Forced displacement in 2016. Geneva: Author.
- United Nations High Commissioner for Refugees (UNHCR). (2018a, June 25). Global trends: Forced displacement in 2017. Geneva: Author.
- United Nations High Commissioner for Refugees (UNHCR). (2018b). Turn the tide: Refugee education in crisis. Geneva: Author.
- United Nations High Commissioner for Refugees (UNHCR) & United Nations Development Programme (UNDP). (2015, December 18). 3RP regional refugee and resilience plan 2016–2017 in response to the Syrian crisis: Regional strategic overview. Amman, Jordan: UNHCR.
- Valli, E., Peterman, A., & Hidrobo, M. (2019). Economic transfers and social cohesion in a refugee-hosting setting. Journal of Development Studies, 55(S1), 128–146.
Appendix A.
Attrition from baseline to follow-up
Figure A1. Attrition of children ages 5–14 from baseline to follow-up.
Notes: The horizontal axis represents distance (in kilometres) to the border separating the pilot governorates (Akkar and Mount Lebanon) from the comparison governorates (North, South, and Nabatieh). The vertical red line represents the border. The vertical axis measures the percentage of households that remain in the sample at follow-up. Dots represent local averages, scaled by the number of households. Linear ordinary least squares regression lines have been fitted to the left and the right of the border. Grey areas represent the 95 per cent confidence interval around the regression line. Observations: 2,897.
Appendix B.
Definitions of outcome variables
This appendix describes the construction of the outcome variables.
Enrolled in school (0/1):
• ‘Is [NAME] currently attending school?’ ≫ Yes
Enrolled in afternoon shift (0/1):
• ‘Is [NAME] currently attending school?’ ≫ Yes
• ‘What type of school does [NAME] attend?’ ≫ Public
• ‘What shift does [NAME] attend?’ ≫ Second
In the NLG/Min Ila Programme (0/1):
• Based on administrative data provided by the programme team
• Determined across households because information on individual children could not be obtained
Education expenditure:
Education expenditure equals the sum of the amounts spent on the following expenditure categories:
• After-school programmes and tutoring
• School books and stationery
• School uniforms
• Contribution for school building or maintenance, parent-teacher associations, and other, related fees
• Transport
• Any other school expenditures
Only if households were unable to break down their education expenditures on these individual categories were they asked to estimate their total education expenditures.
Commutes by bus (0/1):
• How does [NAME] get to school each day? ≫ School bus
Days attended school (past week):
• During the past seven days, how many days did [NAME] attend school?
Appendix C.
Robustness checks
The primary analysis relies on a linear specification without bandwidth adjustments. This appendix presents two robustness checks. The first relies on a somewhat more flexible functional form and bandwidth adjustments. First, the outcome variables are regressed on the control variables that are also used in the main regressions, that is, child age dummies, child gender, and an indicator taking the value 1 if the child’s parents had studied beyond primary school. Discontinuities in the residuals of these regressions are then estimated using the Stata RD command written by Austin Nichols. Rectangle kernel regressions and a bandwidth restriction of 20 km are relied on to establish f(distanceihsg0) (see equation 1).
The second robustness check directly compares average outcomes among children living within 20 km of the borders separating pilot and nonpilot governorates. In these estimates, the outcome variables are regressed only on the control variables used in the main regressions and the indicator for residence in a pilot governorate. Thus, the term f(distanceihsg0) is removed from equation 1, and no functional form is imposed between distance to the borders and the outcome variables.
The findings of these robustness checks, displayed in , are consistent with those in the primary specification. The impacts on overall school enrolment or on afternoon shift school enrolment are not statistically significant. However, conditional on enrolment in an afternoon shift school, average education expenditures increase by more than US$70; the use of bus transport increases substantially, and school attendance rises by about 0.5 days a week.
Table C1. Robustness tests
However, as noted also in the main text, the findings presented in this study are sensitive to the use of alternative specifications, including those comprising higher order polynomial specifications and smaller bandwidths. The decision was taken not to rely on bandwidth reductions in the primary specification because these rapidly reduce the number of clusters driving study findings.