
 ?Mathematical formulae have been encoded as MathML and are displayed in this HTML version using MathJax in order to improve their display. Uncheck the box to turn MathJax off. This feature requires Javascript. Click on a formula to zoom.
Abstract
While much knowledge is being generated on the impact of the pandemic, we still know very little on its implications on taxation in lower-income countries. Yet, tax is crucial to fund crisis response and recovery, in addition to broader development plans and expanded government expenditure. This paper starts addressing this gap using an unique dataset of survey data from Rwanda. We document two significant shifts in taxpayers’ views during the pandemic: perceptions about the fairness of the tax system improve by 40 per cent, and their attitudes to compliance become more conditional on the provision of public services of sufficiently good quality. We put these results in the broader context of crisis response. We show that they are not simply linked to individual experiences of the crisis or access to relief, but they are more likely linked to generalised improvements in solidarity and patriotism.
Keywords:
1. Introduction
The COVID-19 pandemic has been having profound economic and social implications globally. Despite facing much lower case numbers and deaths related to COVID-19, low-income countries have nonetheless faced massive economic losses. While some evidence is emerging on the economic implications of the pandemic in these contexts, it remains much more limited compared to the literature from higher-income contexts (Bishi, Grossman, & Startz, Citation2020; Djiofack, Dudu, Zeufack, et al., Citation2020; Egger, Jones, Justino, Manhique, & Santos, Citation2020; Goldberg & Reed, Citation2020; Mahmud & Riley, Citation2021; Ranchhod & Daniels, Citation2020; Teachout & Zipfel, Citation2020). Even more limited is our knowledge of the ‘tax side’ of the pandemic. Most of the evidence on tax focuses on estimating or measuring revenue losses resulting from the crisis (Arndt et al., Citation2020; Bachas, Brockmeyer, & Semelet, Citation2020; Mascagni & Lees, Citation2021). However, other questions remain almost entirely unanswered. Low-income countries already struggled to improve compliance and revenue before the pandemic hit. Did the crisis affect taxpayers’ perceptions of the tax system and their attitudes to compliance, and how? This is the key empirical question that this article aims to address.
The answer to this question is not obvious. There are at least two alternative and competing narratives that could be at play. The first one is that taxpayers might have become less willing to comply during the pandemic. At a time when most people and firms were undergoing exceptional hardship and economic difficulty, paying taxes might feel like an additional burden at an already difficult time. The alternative narrative paints a more positive picture: taxpayers might be more willing to comply, as the crisis made clearer than ever, and extraordinarily salient, that taxes are a fundamental tool to fund essential public services, particularly healthcare. Our results show that the second narrative is prevalent in Rwanda, while the first one is not supported by our data. We document two main shifts in taxpayers’ perceptions and attitudes. First, their views on the fairness of the tax system improve substantially and significantly. Second, their attitudes move towards more conditional views on compliance, making the link between taxes and public service provision more salient – as opposed to a more unconditional view on compliance, whereby taxes should be paid regardless of what the government provides in return. Both shifts emerge right at the beginning of the crisis, and then persist for at least two years (Section 4).
We obtain these results using an unique dataset from a nationally representative survey of about 2,000 Rwandan small and medium firms that are registered with the Rwanda Revenue Authority (RRA). Our dataset is unique because it allows us to observe the same firms, using the same questions, before the crisis hit Rwanda and at multiple stages in the following two years. More specifically, we evaluate the crisis’ impact on attitudes and perceptions at four stages of the pandemic: before it appeared, the first peak of the crisis, a time of relaxed restrictions, a second wave of infections, and finally at a time when the emergency normalised. We can therefore follow shifts in perceptions and attitudes across these different phases, while controlling for all observed and unobservable individual-level characteristics that are fixed over the two years covered by our data.
Our core results are based on the variables that we can observe both at baseline and during the crisis. In addition, we complemented our baseline questionnaire (which was designed before anyone knew COVID-19 would become a global pandemic) with questions aimed to capture issues that are specific to this crisis, such as tax relief and government support, as well as its beneficiaries, and perceptions on solidarity and patriotism, along with the prevalence of other feelings (e.g. fear or frustration). We use these variables in Section 4.3 to put our core results in context and check some possible mechanisms that might explain them. For example, we check whether the positive shifts on perceptions are associated with receiving tax relief or government support. We show that is not the case. Instead, the shifts are more generalised in the full sample, regardless of accessing support. We argue that they are related to broader increases in solidarity and patriotism, which increased during the crisis. This is consistent with the increase in voluntary or informal contributions during the crisis, which we also capture in our data.
As we discuss in Section 3, these results are found in a context where the government responded quite forcefully to the pandemic, imposing early and strict lockdowns as soon as the first cases of COVID-19 appeared in the country. In this sense, Rwanda is not dissimilar to many other low-income countries that have generally responded to the pandemic with similar restrictions to those imposed in higher-income contexts, despite much lower case numbers (Caselli, Grigoli, Lian, & Sandri, Citation2020; Ray & Subramanian, Citation2022; Walker et al., Citation2020). However, Rwanda stands out in other aspects. Perhaps the most important one, given the nature of the crisis, is the extensive health insurance coverage that the country managed to achieve in recent years – the highest in Africa (Barasa, Kazungu, Nguhiu, & Ravishankar, Citation2021). The Rwandan government might have also been particularly effective both in enforcing restrictions and in quickly adopting support measures, including tax relief, as the data presented in Section 3 suggests. While our results are not directly applicable to other contexts, they start filling the knowledge gap on low-income countries.
Our results complement the scant but increasing literature on revenue losses – estimated or actual – associated with the COVID-19 pandemic in low-income countries (Arndt et al., Citation2020; Bachas et al., Citation2020; Mascagni & Lees, Citation2021). These studies show that the pandemic has had a large revenue impact. For example, Arndt et al. (Citation2020) estimate a 32 per cent drop across all tax types in South Africa, while Bachas et al. (Citation2020) predict that tax revenue remitted by corporations in ten low and middle-income countries would drop by 1.5 per cent or 2.5 per cent of GDP under a three-month or five-month shock scenario. Estimates for Rwanda predict a 25 per cent drop in corporate income tax revenue in a three-month lockdown scenario (Lees, Mascagni, & Santoro, Citation2020), while real-time VAT data show a contraction in this tax type of 5.3 per cent in the first three quarters of 2020 (Mascagni & Lees, Citation2021). Our paper complements these findings by showing that, while revenue has been hit hard, the pandemic might have had positive effects on taxpayers’ perceptions about the tax system – and its fairness in particular. The shift towards more conditional forms of compliance might be seen in a positive light, as a first step to spur a potential virtuous cycle whereby taxpayers are more willing to pay tax, but also demand better services in return – with broader potential benefits to government accountability, trust and transparency (Prichard, Custers, Dom, Davenport, & Roscitt, Citation2019).
In what follows, we start by presenting our unique survey dataset (Section 2). We then describe the Rwandan context, its experience with the pandemic and the policy response to it, including some initial descriptive statistics from our data (Section 3). Section 4.2 presents our core results on shifts in compliance attitudes and perceptions. Section 4.3 discusses these results in context, drawing on the rich set of data we collected during the crisis. Second 5 concludes and provides some reflections on opportunities for policy change.
2. The Rwanda National Taxpayer Survey
The Rwanda National Taxpayer Survey was implemented as part of a long-standing collaboration between the International Centre for Tax and Development and the Rwanda Revenue Authority. Originally, we planned for a one-off survey to take place in early 2020. Follow-up rounds were added later to capture the impact of the COVID-19 pandemic. The original purpose of the survey was to generate new analysis on taxpayer compliance that would both inform RRA’s policy and contribute to the academic literature. To this aim, we designed a questionnaire that includes many of the typical questions of the survey-based literature on tax compliance, thus making it largely comparable with other studies.Footnote1 More specifically, the survey includes the following modules: (i) demographics, (ii) business characteristics, (iii) risk aversion, (iv) tax knowledge, (v) satisfaction with public services, (vi) interactions with RRA, (vii) overall tax burden, and (viii) tax compliance attitudes and perceptions.Footnote2
In addition to the standard questions on compliance and attitudes, our baseline survey also included three list experiments to test the validity of respondents’ answers on potentially sensitive topics, including on the fairness of the tax system (one of the key variables in our analysis). We then compared the results from the list experiments with the more direct questions on these topics. We do not find any evidence of significant biases in responses to these questions, which reassures us on the quality of our data.Footnote3
Based on this questionnaire, we conducted interviews in January and February 2020 with a nationally representative sample of 2,023 small and medium firms randomly sampled from the relevant population of taxpayers registered with the RRA for business income tax.Footnote4 This includes firms that are registered either as corporations, thus subject to corporate income tax (CIT), or as unincorporated firms or sole proprietorships, thus subject to personal income tax (PIT), which in this context is a tax on business profits. Although all firms are registered with the RRA, they have three broad types of compliance behaviour: (1) 23 per cent do not file declarations, although they should do so as required of all registered taxpayers; (2) 25 per cent file nil declarations, defined as reporting zero in all fields; (3) the remaining 52 per cent have a more usual behaviour where they report some sales and other information to the revenue authority. Non-filing and nil-filing are common behaviours anywhere, including in other African countries (Mascagni, Santoro, Mukama, Karangwa, & Hakizimana, Citation2020; Moore, Citation2020; Santoro, Groening, Mdluli, & Shongwe, Citation2020; Santoro & Mdluli, Citation2019). By including all three in our data and analysis we can offer a representative picture of firms that appear in the tax authority’s registry.Footnote5 The key variables used in this article are described in Appendix .Footnote6
The data collected in January and February 2020 are our baseline round. At this time, we were not planning to conduct any further rounds of data collection. This changed with the appearance of COVID-19 in Rwanda, in late March 2020, when we saw an opportunity to use these data to track the implications of the crisis on the compliance variables we collected pre-pandemic. We therefore implemented four follow-up rounds of data collection on the same sample in May 2020, September 2020, February 2021, and February 2022. In Section 3, we describe in more detail how these data rounds map with key stages in the crisis: right after the first national lockdown, at a time of relaxed restrictions, at the height of a second wave of infections corresponding with a second lockdown, this time localised in the capital city, and finally two years since the onset of the pandemic. Our complete dataset therefore allows us to compare key variables, measured using the same questions, in a context that was essentially free of COVID-19, in early 2020, and at subsequent stages of the crisis. Crucially, we are able to do so with the same sample, since our dataset is a panel. This allows us to control for a set of characteristics, both observable and unobservable, that remain fixed over the two years of our data period. By doing this, we can identify the impact of the pandemic precisely, especially since no other major event occurred in Rwanda during the data period.
Since our data are high frequency and collected for the same sample, we tried to keep the questionnaires in follow-up rounds as short as possible, to minimise attrition and fatigue. We therefore only included key questions from the following baseline models: tax compliance attitudes and perceptions, overall tax burden, and satisfaction with public services. All other variables, mainly taxpayer and business characteristics, are only observed at baseline. This is the dataset that allows us to identify the shifts in perceptions and attitudes that we discuss in Section 4.2. In addition, we also included questions that are specific to the crisis, for example on business closures, access to and awareness of tax relief, preferred options to fund recovery, solidarity and patriotism, and satisfaction with the government response to the crisis. We use this information to interpret and validate our results in the broader context of crisis response in Rwanda (see Section 4.3). The key variables used in our analysis are described in the Appendix.
A final note is due on attrition. Despite our efforts to minimise attrition, inevitably some respondents dropped out during the course of our data period. We have a fully balanced sample of 1,316 firms that are observed in all rounds – a 35 per cent drop compared to the baseline sample. However, all 2,023 taxpayers observed at baseline have been interviewed in at least one of the follow-up rounds, while for 93 per cent of the sample we have at least two follow-up observations. Our balance tests show that the balanced panel includes taxpayers that are quite different from those left out: they are more likely to be individuals out of Kigali, older and less educated, IT-sophisticated and tax-savvy.Footnote7 For this reason, we retain all taxpayers in an unbalanced panel. By design, the fixed-effect model controls for all taxpayer characteristics that are fixed over time, even those who are correlated with attrition (see Section 4.1).
3. Rwandan context: tax, pandemic impact and response
Rwanda is a small landlocked country of nearly 13 million people. It reported a tax to GDP ratio of 14.4 per cent in 2018, slightly below the average for Sub-Saharan African countries (15.4 per cent) and above low-income countries (13.1 per cent).Footnote8 More generally, Rwanda’s performance on tax has been strong, especially considering the near absence of natural resources that often drive up tax ratios of other African countries. The RRA, established in 1998, is considered one of the most efficient and modern tax administrations on the African continent – despite facing many of the common challenges amongst low-income countries (LIC), such as a large informal sector and weak tax compliance. The main tax types in 2019, as a share of total revenue, are: VAT (33 per cent), PAYE (24 per cent), CIT and PIT (20 per cent) and excise (11 per cent) – as reported in Rwanda Revenue Authority 2020. The firms in our survey sample are registered for either PIT or CIT, which are both taxes on business profits.Footnote9 They might also remit VAT, if they are above the relevant threshold, and PAYE, if they have employees – as well as other taxes at the national and sub-national level. They also pay a range of other fees and contributions at the local and community level.Footnote10
Rwanda’s experience with the pandemic has been similar to other low-income African countries, where case numbers have remained relatively low but restrictions have been quite strict (Mascagni & Lees, Citation2021). The first case of COVID-19 appeared in Rwanda on 14 March, well after we completed data collection for the baseline round. The government immediately announced some initial restrictions and a week later imposed a national lockdown, which lasted for six weeks. Our first follow-up data were collected in May 2020, shortly after the national lockdown was lifted – though some softer restrictions remained in place (e.g. on international travel and on movements outside the house, as well as a curfew). In the following months the country continued to experience low case numbers, and restrictions generally remained more relaxed. Our second follow-up round happened in this context, in September 2020, when case numbers were still below 1.5 per million people. The situation changed quite dramatically in early 2021, when the country experienced an unprecedented spike in infections – though still well below anything the typical higher-income country has experienced. Our third data round, collected in February 2021, covers this second period of increased cases and a second lockdown, which however this time only concerned the capital, Kigali. The rest of the country remained subject to softer restrictions on movement and gatherings, and a dusk to dawn curfew. The last data round was collected in February 2022, at a time when the pandemic had largely normalised. Appendix and report respectively case numbers and the stringency index for Rwanda during our data period. maps the key developments of the pandemic in Rwanda against our data rounds.
Figure 1. Timeline of crisis and data rounds.
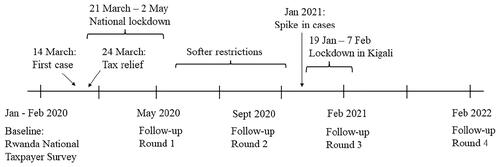
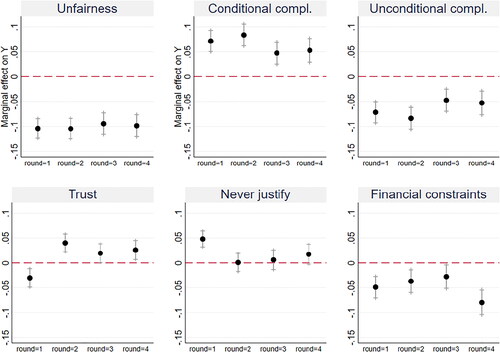
Figure 2. Shifts in attitudes and perceptions. Notes: results based on Rwanda National Taxpayer Survey. Graphs show coefficients on round1, round2 and round3 (see EquationEquation (1)(1)
(1) ) from fixed effects regressions on the relevant outcome, indicated at the top of each graph.
A recent analysis of the impact of the pandemic in Rwanda, based on data from VAT declarations, shows that economic activity contracted by 10 per cent in 2020, with the largest drop happening in correspondence with the lockdown imposed around March and April 2020 (Mascagni & Lees, Citation2021). Our survey data, focusing particularly on small and medium firms, complement those results and confirm the severe impact of the crisis on Rwandan firms. shows that two-thirds of firms stopped operating for reasons related to COVID-19 in the first national lockdown, while in the second one only a third did so: 35.8 per cent of firms located in Kigali, where the lockdown was implemented, and 27.8 per cent of the overall sample. These figures might suggest that, a year after the onset of the crisis, more firms were prepared to remain open and comply with distancing and other requirements, or that rules were applied somewhat more softly to contain the economic impact. Business income also dropped dramatically, as self-reported by respondents in our interviews. After an initial drop of 85 per cent compared to the baseline, average sales rebounded to about 43 per cent of pre-crisis levels, and then continued to rise – but only to 59 per cent of the pre-crisis level by February 2022. These large drops – larger than the overall figures found in other studies – are consistent with the finding that small firms, which are the focus of our survey, have been hit more than larger ones by the pandemic (Mascagni & Lees, Citation2021). However, once we take average sales conditional on being operational, the drop is less dramatic, as expected.Footnote11
Table 1. Impact of the crisis on firms and policy response
In terms of policy response, the Rwandan government has been rather active to put measures in place that would mitigate the effect of the crisis. This is reflected in an exceptionally high level of satisfaction with the government response to the crisis, as gathered in the second follow-up round: over 80 per cent of our respondents rate the government response as 8 or above, out of 10, where the latter indicates an excellent response. shows that during the national lockdown of March–April 2020, nearly 70 per cent of respondents accessed some form of relief, while nearly 41 per cent benefited from tax relief more specifically. After this initial crisis peak, the percentage of respondents receiving any support dropped to 22.4 per cent and increased again to 31.7 per cent in correspondence to the second wave of infections in February 2021. Tax relief decreased dramatically in September 2020, compared to May, and increased again in February. These shifts correspond both to peaks in infections, but also to the timeline of income tax declarations, which are due between January and March each year.
A few more notes are due on tax relief, as it is potentially crucial to our analysis (as discussed also in Section 4.3). First, tax relief was a very prominent form of government support especially at the height of the crisis, in May 2020. When we asked respondents a general question on what were the main types of support they received during the crisis, tax relief was the most common form of support (at 41 per cent, as reported in ), followed by ‘access to services’ (34 per cent).Footnote12 Consistently, the RRA emerged as one of the most important actors in crisis response, when we asked respondents who was providing relief. Second, amongst various types of tax relief, by far the most common is deferrals of tax declarations and payments: they represent about 96 per cent of all forms of tax relief in round 1 (57 per cent in round 2 and 91 per cent in round 3, see ).Footnote13 These deferrals only affect the deadline for submitting tax declarations, not the tax liability. Other types of tax relief included fast-tracking VAT refunds, and a waiver of fines, penalties and interest related to late payments, but they were less widely accessed. Third, take-up of tax relief was relatively low, with many taxpayers failing to access any type of tax relief. Even considering only eligible taxpayers, only 56 per cent took it up, based on the May data round.Footnote14 A descriptive regression explaining access to tax relief with a number of taxpayer characteristics shows that take up is greater for those who have higher education and tax knowledge, as well as for younger taxpayers and those with better perceptions about the fairness of the tax system.Footnote15
4. Shifts in tax compliance attitudes and perceptions
Against the background highlighted in the previous section, we now investigate whether the crisis has shifted compliance attitudes and perceptions in any significant way. The methods for identifying these shifts are described in Section 4.1 and rely on our ability to observe the relevant variables before and after the shock (see Section 2). After the overview of methods, Section 4.2 reports our core results, which Section 4.3 puts in the broader context of the crisis and responses to it.
4.1. Empirical framework
To identify shifts in attitudes and perceptions, we exploit the panel nature of our data and the fact that we can observe periods both before and after the onset of the crisis, as described in Section 2. More precisely, we run a set of regressions, using a fixed effects model, to evaluate the impact of different stages of the crisis on six outcomes of interest: perceptions about the unfairness of the tax system, trust in the RRA, compliance attitudes conditional on receiving public services of good quality, unconditional compliance attitudes (which is the alternative statement to the one on conditional compliance), the acceptability of reduced compliance due to financial constraints and, finally, whether taxpayers believe evasion is never justified (another indicator of unconditional compliance). These outcomes are defined more precisely in the discussion below and the exact questions they refer to, as well as their measurement, are reported in Appendix .
(1)
(1)
The regressions we estimate are based on EquationEquation (1)(1)
(1) , where Yit is one of the relevant outcomes listed above. The coefficients of interest are β1, β2, β3, and β4, which capture the effect of four dummy variables corresponding to each follow-up data round: May 2020 (round1), September 2020 (round2), February 2021 (round3), and February 2022 (round4). γi captures the fixed effects: all the observable and unobservable factors that remain fixed over time, within individual respondents, during our data period. They include factors such as gender, location, sector, and even other characteristics such as the level of education or business culture. While some of these variables may change over longer periods of time, we can reasonably expect very little or no variation over the year of our data period – especially as no other major event occurred in Rwanda in addition to the pandemic. The equation is estimated using a standard fixed effects model to account for these variables. In addition to fixed effects, we also control for business income (bincome), as self-reported by respondents during the survey, which saw drastic variations during the crisis, as described in Section 3. ϵit is an error term.
4.2. Results
plots the coefficients on round1, round2 round3, and round4, with the relevant confidence intervals, estimated with a fixed effects model based on EquationEquation (1)(1)
(1) . The dotted line represents the baseline value of each dependent variable. Since the baseline round is the excluded category in EquationEquation (1)
(1)
(1) , all other rounds’ coefficients are evaluated in comparison to it. Each individual graph in corresponds to a separate regression on the dependent variable indicated at the top of each one. These results point to significant shifts in all variables, particularly perceptions on tax fairness and conditional views on compliance. We discuss them in turn in the next few paragraphs. We also report the full regression results in .
Unfairness refers to a true/false question asking whether the tax system is unfair. While this is a direct question, the list experiment mentioned in Section 2 does not point to any significant bias in responses to this direct question. Importantly, even if such bias exists, we would expect it to be constant over the data rounds, since the question is exactly the same. We would therefore expect it to affect potentially the level of this variable but not its variations, which is what we are interested in. Compared to baseline, perceptions around fairness of the tax system improve significantly at the onset of the crisis in May 2020 (round 1). The magnitude is large: given the baseline level of 0.26, a decrease of 0.1 (the coefficient on round 1) in taxpayers reporting the system is unfair represents a 40 per cent shift in this indicator. Given that the question is framed around unfairness, a negative coefficient represents an improvement in perceptions about the fairness of the tax system. This shift persists, both in magnitude and significance, at the other stages of the pandemic that we capture in subsequent rounds – including two years into the crisis (round 4).
The outcome conditional compliance captures attitude to compliance conditional to public services, in the context of fiscal exchange or reciprocity. The relevant question required respondents to choose between the following two statements: (1) taxpayers must pay their taxes to the government regardless of the quality of public services (unconditional compliance); or (2) taxpayers could refuse to pay taxes if they were not receiving public services of adequate quality (conditional compliance). first reports results on a binary variable capturing agreement with the conditional compliance statement, as well as the exactly specular result when considering agreement with the unconditional compliance one. This indicator shows a large and significant shift away from unconditional compliance and towards more conditional views of compliance. The latter increase by 35 per cent in round 1, compared to the baseline level of 20 per cent. This shift persists in the following rounds as well, with a slightly reduced magnitude in rounds 3 and 4 but still statistically significant throughout the period. Since the two outcomes of conditional and unconditional compliance come from the same question, and indeed they are alternatives, the relevant coefficients almost exactly mirror each other in the two relevant sub-figures of .
Importantly, while conditional attitudes to compliance improve, the vast majority of respondents (about 80 per cent) keep agreeing more with the statement on unconditional compliance (statement 1 above) – though less so than at baseline. This links to an alternative outcome variable on unconditional compliance, labelled never justify in . It captures a separate question, which is standard in this literature (D’Arcy, Citation2011; Fjeldstad, Schulz-Herzenberg, & Sjursen, Citation2012; Isbell, Citation2017; McCulloch, Moerenhout, & Yang, Citation2021), where respondents are asked whether they think it is justifiable for some people not to pay taxes on their income (). Consistently with the two-statements choice discussed above, the baseline level of this indicator is very high (85 per cent), indicating that the prevalent attitude to compliance in Rwanda is of unconditional nature. While this indicator also sees a modest (5.5 per cent compared to baseline) but significant increase in May 2020, right at the onset of the crisis, it then settles back to its baseline level in all subsequent rounds – confirming no statistically significant shift beyond round 1. This result is therefore consistent with the significant and persistent shift towards more conditional views on compliance, while unconditional compliance is confirmed to remain largely unchanged.
Our results on trust, while more mixed, are in line with the generally positive story emerging so far on fairness and conditional compliance. This variable captures whether respondents have trust that the RRA acts in the interest of taxpayers like them (). In round 1, we observe a significant shift in a negative direction, with trust in the RRA decreasing by 3.5 per cent compared to a baseline level of 83 per cent (). This initial negative shift in trust, however, changes direction quite quickly: round 2 sees a significant offsetting increase in trust, which persists throughout the data period, although it loses its statistical significance (round 4).Footnote16
So far, we have documented positive compliance shifts during the pandemic: perceptions on tax fairness improve substantially, and taxpayers become more demanding on the government’s delivery of public services in their attitude to compliance, making a clearer link between spending and taxes – related to fiscal exchange and reciprocity. These results support the hypothesis, described in Section 1, that the pandemic improved taxpayers’ attitudes and potentially made them more willing to comply. The alternative hypothesis set out in Section 1, which our results seem to rule out, is that evasion might become more justifiable because of economic difficulties.
As a further check on our findings, we can directly test this alternative hypothesis using the outcome variable financial constraints. It refers to a question aimed to measure the extent to which compliance might be affected by businesses’ financial constraints and their ability to pay taxes. More specifically, respondents had to choose between the following two statements: (1) taxpayers should always declare their full income for tax purposes, regardless of their financial constraints; or (2) taxpayers in financial distress could declare less income in order to pay lower tax. plots result on a binary variable capturing agreement with the second statement. Results show a sizeable and significant decline in agreement with this statement, and conversely an increase in agreement with the idea that taxpayers should contribute what they owe regardless of their financial constraints.
These results confirm that, in the case of Rwanda, there is no support for the hypothesis that evasion might be more justified because of the economic hardship linked to the crisis. On the contrary, taxpayers strengthened their willingness to pay despite the financial drawbacks produced by the crisis. This result provides an interesting comparison with conditional compliance: while the financial constraints brought about by the crisis do not change attitudes to compliance (if anything, they see a slight improvement), the crisis makes the link with public services more salient – thus increasing conditional compliance, linked to fiscal exchange. This is fully consistent with the nature of this crisis: a pandemic that made the importance of public services – especially healthcare – particularly salient, along with the revenue needed to fund it.
Taken together, our findings show that the pandemic generated significant shifts in attitudes and perceptions around tax. The largest and most significant ones are towards better perceptions about the tax system’s fairness and more conditional views on compliance, implying a stronger link between the quality of public services and tax payments. The latter represents a positive shift because fiscal exchange is expected to be linked to improved accountability, greater demands for transparency, and citizen engagement in debates around fiscal decisions. This might, ultimately, improve quasi-voluntary compliance and potentially allow for sustainable increases in tax revenue (Luttmer & Singhal, Citation2014; Prichard et al., Citation2019). The results on financial constraints are consistent with these positive shifts and confirm that taxpayers appreciate the importance of tax compliance even at times of financial distress – especially during a pandemic, when much public attention focuses on access to public services and the required funding for them.
Finally, we check whether these shifts are driven by particular groups. We explore heterogeneity on location (Kigali vs. other provinces), gender, CIT or PIT (as described in Section 3), compliance categories (nil-filers, non-filers and active taxpayers, as defined in Section 2), and firm size based on self-reported business income.Footnote17 We see no clear differences in any significant direction, except for some expected minor differences that, however, do not appear to be systematic across groups. For example, while the shift in fairness is the same across PIT and CIT payers, the latter (which are also larger firms) don’t experience the same shift towards conditional compliance. However, we are reluctant to read much into these results, both because no systematic pattern emerges, and because estimates are affected by smaller sample sizes (especially for CIT and the top quintile; see Section 2). It is also worth noting that taxpayers in Kigali see an increase in the ‘never justify’ variable in round 3, corresponding to the second lockdown, localised in the capital, as compared to those in the provinces. This is consistent with the increase in this variable we observe during the first national lockdown (round 1 in ).
4.3. Putting compliance shifts in context: the role of solidarity and patriotism
As mentioned in Section 2, our follow up survey rounds also include data on other aspects of the crisis’ impact and response. The analysis of these data is necessarily more descriptive than our main analysis in Section 4.2, largely because we only have data after the crisis started. Nonetheless, these data can help us explore some of the possible factors affecting our main results on compliance shifts, and put them in the broader context of crisis response. To these aims, in this section we briefly discuss three pieces of supporting evidence.
Firstly, we consider whether the tax relief package mentioned in Section 3 might be behind our results on compliance shifts. A plausible possibility is that taxpayers improve their perceptions of the tax system, particularly on fairness, simply because they have received some form of tax relief. Since relief take-up was far from universal (Section 3), we can test this hypothesis by dividing our sample between those who accessed tax relief and those who did not.Footnote18 shows that our shifts are confirmed in both groups, rather than being driven by respondents who accessed crisis-related tax support.Footnote19 This result is not surprising when one considers the nature of tax relief in this case: rather than representing an actual reduction in payments, the vast majority of tax relief was provided in the form of deferrals (Section 3), which only affect the timing of declarations and payments.
Secondly, and relatedly, we also check whether having been affected by the crisis through business closure affects the way perceptions shift. To test this, we use a survey variable on whether the firm closed (permanently or temporarily) for reasons related to COVID-19. We then divide the sample across the two groups who closed or did not close during the crisis. Again, indicates that our key results on shifts in perceptions and attitudes are confirmed in both groups – suggesting they are not simply driven by whether respondents are directly affected by the crisis.
These two results on relief and business closure suggest that the compliance shifts we document here are more generalised in Rwanda, rather than being linked specifically to being affected by the crisis or accessing tax relief. This more widespread shift across the population is consistent with our third piece of supporting evidence: a general increase in feelings of solidarity and patriotism, which we also capture in two of our survey rounds.Footnote20 The data from round 3 suggest that the majority of our respondents believe that both solidarity and patriotism have increased during the crisis () – which is consistent with the positive shifts in attitudes we document here. In round 4, we explored feelings during the crisis more comprehensively, with two questions that increased the range of feelings to also include fear, frustration, and concern/preoccupation, alongside patriotism and solidarity. We asked respondents to rank these feelings in order of prevalence at two times: February 2021, and February 2022 (the time of round 4 data collection).Footnote21 Although solidarity and patriotism had increased already in February 2021 (round 3, see ), results from round 4 show that fear, frustration and concern were more prevalent at that time – when the pandemic was still generating strict restrictions (Kigali was under lockdown, as discussed in Section 3).Footnote22 However, in February 2022, with life largely going back to normal, patriotism and solidarity become the most prevalent feelings amongst our respondents.Footnote23 This result is consistent with the positive shifts we document in section 4, and with the fact that they are both generalised across the population and persistent in the longer-term.
Similar ‘rally round the flag’ effects of the pandemic have been documented in other contexts, largely in European countries (Baekgaard, Christensen, Madsen, & Mikkelsen, Citation2020; Kritzinger et al., Citation2021; Schraff, Citation2020).Footnote24 However, it is unclear from this broader literature whether these shifts persist over the longer-term (Johansson, Hopmann, & Shehat, Citation2021). Our study can offer an important contribution here because, unlike other studies, we can follow our sample over a relatively long period of time – two years. Importantly, this period includes times that are sufficiently far from the initial emergency, both in time and in terms of the severity of restrictions. Over these two years, we show that the shifts in fairness, trust, and conditional compliance are not only an immediate ‘rally round the flag’ effect in Rwanda, but they also persist beyond the crisis’ peak. There remains, of course, an open question (which we cannot answer here) on whether these effects will persist longer into the future.
The more generalised improvement in solidarity is also related to the key role that informal contributions played in crisis response.Footnote25 Our data shows that 43 per cent of respondents contributed to new projects related to COVID-19 in May 2020 – which comes in addition to other informal payments and contributions that our respondents usually make. This figure increased to 48 per cent in rounds 2 and 3. When we asked respondents for their support for various options to increase revenue for recovery, voluntary contributions emerged as the preferred option. This is despite the regressivity of this kind of contribution, which has been documented in the literature and that is also confirmed in our data. Amongst the tax options, we found the greatest public support for taxing large businesses and taxing the rich, with support for the latter increasing during the crisis.Footnote26
Finally, the shift towards more conditional compliance attitudes is also consistent with the Rwandan context, which experiences one of the highest levels of health insurance coverage in Africa. This is also a context where taxpayers are generally aware that taxes are the main source of funding for healthcare (70 per cent are aware of this in round 1) and are largely satisfied with the healthcare system (75 per cent are very or somewhat satisfied with it, while 85 per cent feel confident the healthcare system can help if they get sick). The improvements in attitudes that we document here might also be linked to the prompt and strong positive response of the Rwandan government, both generally and more specifically on tax (Section 3).
5. Concluding remarks
This paper starts to fill the knowledge gap on the impact of the pandemic in low-income countries, and particularly on its ‘tax side’. Our main analysis (Section 4) shows that the crisis in Rwanda led to significant shifts in perceptions and attitudes about tax that can be seen as being positive for long-term revenue mobilisation. Citizens’ perceptions about the fairness of the tax system improved, while their views on compliance became more conditional on the provision of public services of sufficiently good quality – which can be expected to be linked to improved accountability and citizen engagement (Section 4). Importantly, these results persist over the two years we can observe, rather than being merely immediate, short-lived effects.
Section 4.3 then puts these results in the context of the broader crisis response in Rwanda. We show that the positive shift in tax perceptions are not linked to narrow experiences of the crisis or tax relief, but that they are more generalised across the population. Additional evidence form our survey suggests that they are particularly linked to improvements in solidarity and patriotism, which persist as prevalent feelings even when the crisis normalised and other feelings of fear and concern start fading away.
Based on this study, we can offer three broader reflections for policymakers and researchers.
The first one relates to new opportunities for reform that the pandemic might have brought about, along with unprecedented challenges. Our results show that policymakers might have an opportunity to leverage fiscal exchange and fairness to improve compliance behaviour, in the wake of the crisis. This can be done with communication and sensitisation about the link between taxes and public services, and the fairness of the tax system. Policymakers should, however, also back communication campaigns with real changes in accountability and transparency (linked to fiscal exchange) and equity. On the latter, they might have an opportunity to improve progressivity and increase revenue by taxing the better-off more effectively, for which we document higher public support than other tax options (Section 4.3).
Secondly, and related, there remains an open question as to whether the positive shifts on tax perceptions that we document here translate into improved compliance behaviour. In the working paper version of this study, we started exploring this question, with encouraging results on improved behaviour during the crisis (Mascagni & Santoro, Citation2021). However, in the case of compliance behaviour our empirical framework presents some additional challenges, which mean this result is to be taken with caution. Certainly, reform options along the lines outlined above would help to increase tax morale and taxpayers’ willingness to contribute to the public purse.
Thirdly, as with all studies focusing on one country, our results refer to Rwanda and are not necessarily applicable to other contexts. We might expect shifts in tax perceptions to be highly context-specific, both depending on the baseline level of compliance and responses to the crisis, both of which vary widely across countries. Nonetheless, emerging evidence from other contexts suggests that our results might not be specific to Rwanda. A forthcoming study shows very similar patterns in Sierra Leone, a country with very different features to Rwanda, both in terms of tax compliance and pandemic responses.Footnote27
Acknowledgements
This paper benefited greatly from the support and collaboration of the Rwanda Revenue Authority’s (RRA) Research and Risk teams. Particularly Denis Mukama, Gadi Munyentwali, Adrian Bizumugabe, Sam Kabera, Naphtal Hakizimana and Kieran Byrne provided great feedback in the design of our baseline survey, as well as support throughout the project. We are deeply grateful for their continued engagement and insights. Special thanks go to RRA’s Senior Management for the high-level support they have provided our research. We would also like to acknowledge the excellent support we received from Vanguard Economics in collecting data. This paper was prepared with financial support from ICTD, which is funded by UK Aid and the Bill and Melinda Gates Foundation. It also reflects several exchanges with ICTD colleagues working on a broader project related to the impact of the pandemic in African countries, including Wilson Prichard, Vanessa van den Boogaard, and Nicolas Orgeira. We are grateful for excellent research assistance we received from Adrienne Lees and Celeste Scarpini. Last but not least, we would like to thank Andualem Mengistu and Oliver Morrissey for their constructive comments on an early draft of this paper, and two anonymous reviewers.
Disclosure statement
No potential conflict of interest was reported by the author(s).
Notes
Additional information
Funding
Notes
1 For example, some of our questions on attitudes to compliance are largely comparable with those included in the Afrobarometer survey.
2 The survey also included additional modules related to a video nudge experiment, which is described in Santoro and Mascagni (Citation2022). All the data used in this article was collected before showing the video to respondents, and it is therefore unaffected by it. The only exception is the variable on financial constraints (see Section 4.2), which however was not affected by the video (p-values of 48 and 75% on each treatment video).
3 It is worth mentioning, however, that even if such biases did exist, they would not affect our analysis because we are focusing on trends over time, using the exact same questions (with presumably the same biases, if any), rather than on the level of perceptions. A more detailed description of list experiments in this survey and the relevant results are reported in the Working Paper version of this study (Mascagni & Santoro, Citation2021).
4 Participants were randomly sampled from the population of small and medium business taxpayers in Rwanda. We included firms registered in 20 out of 30 districts in Rwanda. We dropped the ten smallest districts to facilitate the logistics of data collection, while maintaining the national representativeness of all provinces.
5 Nil-filers and non-filers represent a larger proportion of the RRA taxpayer registry, compared to the survey sample. This is an intentional choice, as we wanted to have a large enough sample of active taxpayers. Using sampling weights to bring our results back in line with the registry composition, does not change the main findings of this paper.
6 The working paper version of this study reports further descriptive statistics for our baseline sample (Mascagni & Santoro, Citation2021).
7 Further results and discussion on attrition are available in the working paper version of this study (Mascagni & Santoro, Citation2021).
8 Source: ICTD/UNU-WIDER Government Revenue Dataset. Figures refer to tax revenue, not total revenue.
9 PIT is a tax on un-incorporated businesses. The declaration deadline for both PIT and CIT is 31 March, for the year ending on 31 December. The tax rate in the PIT real regime is progressive, while for CIT it is a flat rate of 30 percent. Small and micro firms, both for PIT and CIT, benefit from simplified regimes with fixed tax amounts depending on turnover.
10 For a more detailed description on informal contributions, see the working paper version of this study.
11 The fact that the drop in sales, conditional on remaining operational, is more modest might reflect the fact that the minority of firms who remained open during the lockdown picked up consumption that would otherwise have been absorbed by other firms.
12 Over the whole data period, tax relief remained the most common kind of support.
13 The deadline for submitting declarations and making payments is the same.
14 By the time tax relief was announced on 24 March 2021, some taxpayers had already submitted their declarations. We consider taxpayers to be eligible if they had not yet filed by then, and could therefore benefit from deferrals or other measures.
15 The regression is based on baseline data and the first follow-up round of data, of May 2020. Results available in the working paper version of this study.
16 While the coefficient on trust is only borderline significant in rounds 3 and 4, it is worth noting that the baseline level is already very high, thus potentially leaving less margin for improvement.
17 Results are not reported here for brevity, but they are available in the working paper version of this study (Mascagni & Santoro, Citation2021).
18 We use access to tax relief in May 2020, as it was the round with the wider access to relief measures.
19 If anything, those in the ‘accessed relief’ group have a slightly less significant coefficient in round 4 for the conditional compliance result.
20 Questions on perceptions around solidarity and patriotism were only included in round 3 and 4, to help interpret and unpack the results on shifts in other perceptions.
21 The question on feelings in February 2021 is retrospective. We prompted respondents to think back at the situation at that time and reminded them that infections in the country were increasing and Kigali experienced a second lockdown.
22 These feelings were ranked in the order mentioned in this sentence, followed by patriotism and solidarity.
23 Ranked in that order, followed by concern, frustration, fear.
24 These studies largely focus on trust in government rather than the broader set of perceptions we use here. Our results on trust focus specifically on trust in the revenue administration, rather than in government more generally. However, they support the existence of rally round the flag effects, although not in the first data round (). Similar studies focussing on crises in low-income countries are scarce, but the ones that are available show that such effects are far from guaranteed in these contexts (Crisman, Citation2020).
25 For more detail on this, see the working paper version of this study (Mascagni & Santoro, Citation2021).
26 More detailed results and discussion on public support for options to increase revenue are available in the working paper version of this study (Mascagni & Santoro, Citation2021).
27 This study is forthcoming as an ICTD Working Paper, with the title ‘The politics of taxation and tax reform in times of crisis: Covid-19 and attitudes towards taxation in Sierra Leone’.
References
- Arndt, C., Davies, R., Gabriel, S., Harris, L., Makrelov, K., Robinson, S., … Anderson, L. (2020). Covid-19 lockdowns, income distribution, and food security: An analysis for South Africa. Global Food Security, 26, 100410. doi:10.1016/j.gfs.2020.100410
- Bachas, P., Brockmeyer, A., & Semelet, C. (2020). The impact of COVID-19 on formal firms: Micro tax data simulations across countries (Policy Research Working Papers 9437). Washington, DC: World Bank Group. https://doi.org/10.1596/1813-9450-9437
- Baekgaard, M., Christensen, J., Madsen, J. K., & Mikkelsen, K. S. (2020). Rallying around the flag in times of COVID-19: Societal lockdown and trust in democratic institutions. Journal of Behavioural Public Administration, 3(2), 1–12. doi:10.30636/jbpa.32.172
- Barasa, E., Kazungu, J., Nguhiu, P., & Ravishankar, N. (2021). Examining the level and inequality in health insurance coverage in 36 sub-Saharan African countries. BMJ Global Health, 6(4), e004712. doi:10.1136/bmjgh-2020-004712
- Bishi, H., Grossman, S., & Startz, M. (2020, June). How COVID-19 has affected Lagos traders: Findings from high frequency phone surveys (Policy brief NGA-20075). International Growth Centre. https://www.theigc.org/publications/how-covid-19-has-affected-lagos-traders-findings-high-frequency-phone-surveys
- Caselli, F., Grigoli, F., Lian, W., & Sandri, D. (2020). Protecting lives and livelihoods with early and tight lockdowns (IMF Working Paper 234). Washington, DC: International Monetary Fund. https://www.imf.org/en/Publications/WP/Issues/2020/11/08/Protecting-Lives-and-Livelihoods-with-Early-and-Tight-Lockdowns-49866
- Crisman, B. (2020). Disease, disaster, and disengagement: Ebola and political participation in Sierra Leone. Studies in Comparative International Development, 55(3), 328–353. doi:10.1007/s12116-020-09300-x
- D’Arcy, M. (2011). Why do citizens assent to pay Tax? Legitimacy, taxation and the African State (Afrobarometer Working Papers 126). https://www.afrobarometer.org/wp-content/uploads/migrated/files/publications/Working%20paper/AfropaperNo126.pdf
- Djiofack, C. Z., Dudu, H., & Zeufack, A. G. (2020). Assessing COVID-19’s economic impact in sub-Saharan Africa: Insights from a CGE model. COVID-19 in Developing Economies, 1(1), 53–68.
- Egger, E.-M., Jones, S., Justino, P., Manhique, I., & Santos, R. (2020). Africa’s lockdown dilemma: High poverty and low trust (Working Paper 2020/76) Helsinki: UNU-WIDER. https://www.wider.unu.edu/publication/africa%E2%80%99s-lockdown-dilemma
- Fjeldstad, O.-H., Schulz-Herzenberg, C., & Sjursen, I. H. (2012). People’s views of taxation in Africa: A review of research on determinants of tax compliance (Working Paper 8). Brighton, UK: International Centre for Taxation and Development. doi:10.2139/ssrn.2411424
- Goldberg, P., & Reed, T. (2020). The effects of the Coronavirus pandemic in emerging markets and developing economies: An optimistic preliminary account (Brookings Papers on Economic Activity Summer 2020 Special Edition). Brookings Institution Press. https://www.brookings.edu/bpea-articles/the-effects-of-the-coronavirus-pandemic-in-emerging-market-and-developing-economies/
- Isbell, T. (2017). Tax compliance: Africans affirm civic duty but lack trust in tax department (Policy Paper 43). Accra, Ghana: Afrobarometer.
- Johansson, B., Hopmann, D. N., & Shehat, A. (2021). When the rally-around-the-flag effect disappears, or: When the COVID-19 pandemic becomes “normalized”. Journal of Elections, Public Opinion and Parties, 31(sup1), 321–334. doi:10.1080/17457289.2021.1924742
- Kritzinger, S., Foucault, M., Lachat, R., Partheymuller, J., Plescia, C., & Brouard, S. (2021). Rally round the flag: The COVID-19 crisis and trust in the national government. West European Politics, 44(5–6), 1205–1231. doi:10.1080/01402382.2021.1925017
- Lees, A., Mascagni, G., & Santoro, F. (2020). Simulating the impact of COVID-19 on formal firms in Rwanda (MTI Practice Notes 9J). Washington, DC: World Bank.
- Luttmer, E., & Singhal, M. (2014). Tax morale. Journal of Economic Perspectives, 28 (4), 149–168. doi:10.1257/jep.28.4.149
- Mahmud, M., & Riley, E. (2021). Household response to an extreme shock: Evidence on the immediate impact of the Covid-19 lockdown on economic outcomes and well-being in rural Uganda. World Development, 140, 105318. doi:10.1016/j.worlddev.2020.105318
- Mascagni, G., & Lees, A. (2021). Using administrative data to assess the impact of the pandemic in low-income countries: An application with VAT data in Rwanda (African Tax Administration Paper 22). Brighton, UK: International Centre for Tax and Development.
- Mascagni, G., & Santoro, F. (2021). The tax side of the pandemic: Compliance shifts and funding for recovery in Rwanda (Working Paper 129). Brighton, UK: International Centre for Tax and Development.
- Mascagni, G., Santoro, F., Mukama, D., Karangwa, J., & Hakizimana, N. (2020). Active ghosts: Nil-filing in Rwanda (Working Paper 106). Brighton, UK: International Centre for Tax and Development.
- McCulloch, N., Moerenhout, T., & Yang, J. (2021). Building a social contract? Understanding tax morale in Nigeria. Journal of Development Studies, 57, 226–243. doi:10.1080/00220388.2020.1797688
- Moore, M. (2020). What is wrong with African tax administration? (Working Paper 111). Brighton, UK: International Centre for Tax and Development.
- Prichard, W., Custers, A., Dom, R., Davenport, S., & Roscitt, M. (2019). Innovations in tax compliance – conceptual framework. (Policy Research Working Paper 9032). Washington, DC: World Bank Group.
- Ranchhod, V., & Daniels, R. C. (2020, September). Labour market dynamics in South Africa in the time of COVID-19: Evidence from waves 1 and 2 of the NIDS-CRAM survey (Working paper 265). South Africa: Southern African Labour and Development Research Unit.
- Ray, D., & Subramanian, S. (2022). India’s lockdown: An interim report. In M. Dutta, Z. Husain & A. K. Sinha (Eds.), The Impact of COVID-19 on India and the Global Order: A Multidisciplinary Approach (pp. 11–61). Singapore: Springer Nature Singapore.
- Santoro, F., Groening, E., Mdluli, W., & Shongwe, M. (2020). To file or not to file? Another dimension of non-compliance: The Eswatini Taxpayer Survey (Working paper 110). Brighton, UK: International Centre for Tax and Development.
- Santoro, F., & Mascagni, G. (2022). Visual nudges: How deterrence and equity shape tax compliance attitudes and behaviour in Rwanda (Working Paper 145). Brighton, UK: International Centre for Tax and Development.
- Santoro, F., & Mdluli, W. (2019). Nil-filing in Eswatini: Should the revenue administration be concerned? (African Tax Administration Paper 6). Brighton, UK: International Centre for Tax and Development.
- Schraff, D. (2020). Political trust during the covid-19 pandemic: Rally around the flag or lockdown effects? European Journal of Political Research, 60(4), 1007–1017. doi:10.1111/1475-6765.12425.
- Teachout, M., & Zipfel, C. (2020, May). The economic impact of COVID-19 lockdowns in Sub-Saharan Africa (Policy brief). London, UK: International Growth Centre.
- Walker, P. G. T., Whittaker, C., Watson, O. J., Baguelin, M., Winskill, P., Hamlet, A., … Ghani, A. C. (2020). The impact of COVID-19 and strategies for mitigation and suppression in low- and middle-income countries. Science, 369(6502), 413–422. doi:10.1126/science.abc0035
Appendix
Figure A1. Confirmed cases of COVID-19 per million people in Rwanda. Source: Our world in data 2021.
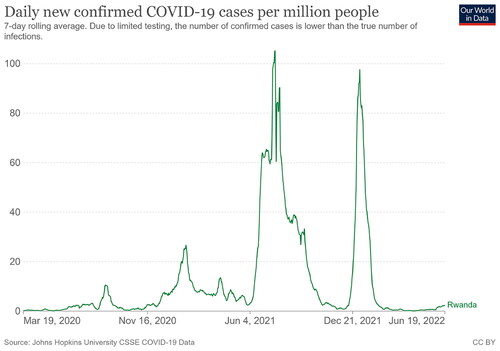
Figure A2. Stringency index in Rwanda. Source: Our world in data 2021.
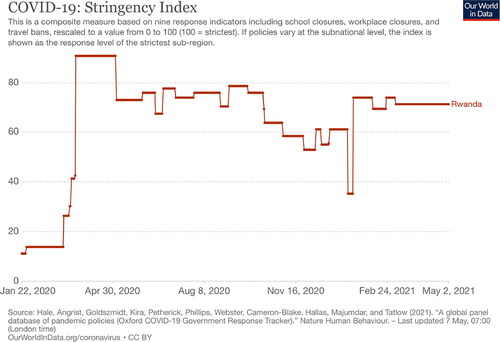
Figure A3. Shifts in in attitudes and perceptions: by tax relief access status. (a) Accessed tax relief. (b) Did not accessed tax relief.
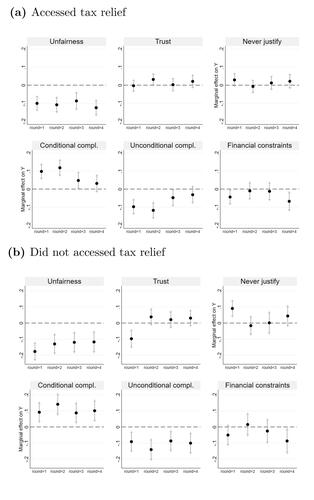
Figure A4. Shifts in in attitudes and perceptions: by business closure due to pandemic. (a) Business closed due to pandemic. (b) Business did not close due to pandemic.
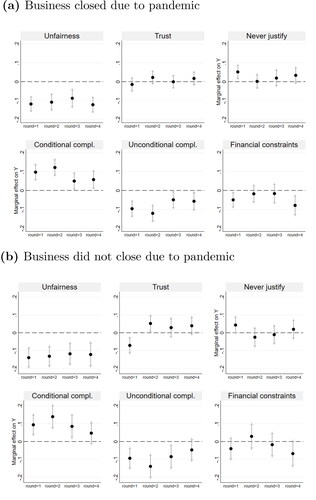
Figure A5. Change in solidarity one year after COVID-19 outbreak. Notes: results based on data from the Rwanda National Taxpayer Survey. Survey question reads: comparing the period before COVID and today, would you say that people are now: More likely to help each other/Less likely to help each other/About the same.
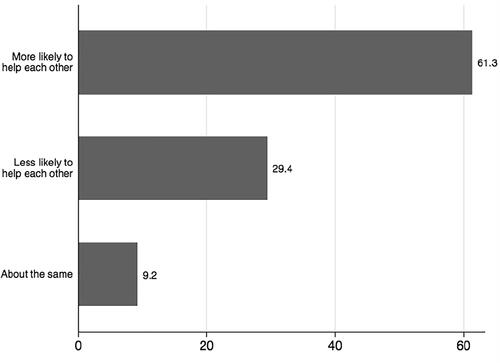
Figure A6. Change in patriotism one year after COVID-19 outbreak. Notes: results based on data from the Rwanda National Taxpayer Survey. Survey question reads: comparing the period before COVID and today, would you say that people are now: More proud to be Rwandan/Less proud to be Rwandan/About the same.
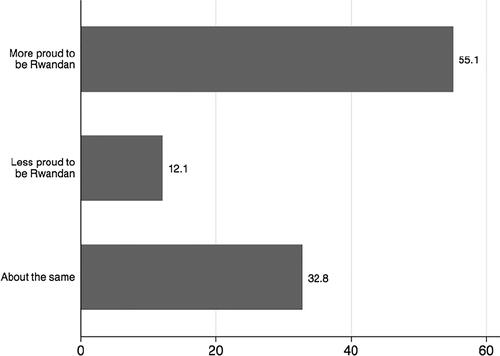
Table A1. Variables description
Table A2. Changes in tax attitudes over time, fixed effects estimation