
 ?Mathematical formulae have been encoded as MathML and are displayed in this HTML version using MathJax in order to improve their display. Uncheck the box to turn MathJax off. This feature requires Javascript. Click on a formula to zoom.
Abstract
Rigorous experiments show that nutrition-sensitive intervention programs can contribute to improved food and nutrition security (FNS) of rural households in low-and middle-income countries. Targeted individuals may, however, choose to engage with the intervention package at different intensities. It is yet unclear to what extent individual participation in more interventions influences FNS outcomes. Positive links would justify efforts by development stakeholders to diversify intervention packages and enable, encourage, or incentivize beneficiaries to participate in many different interventions. Using cross-sectional data from 2733 households across seven countries, we first estimate effects of a multi-sectoral intervention program using probit regressions, propensity score matching, and inverse probability weighted regression adjustment. Over the course of the three-year program, beneficiaries joined 8.3 interventions, on average. We find that targeted households were 6–9 percent more likely to be food secure, and targeted women and children were 15–17 percent more likely to consume a nutrient-adequate diet. Our estimates show that, across three indicators of FNS, each additional intervention increased the probability of achieving positive outcomes by about 1 percent. We conclude that investments in diversified intervention programs can be justified by stronger FNS benefits. Development stakeholders could enable strong individual participation by reducing transaction and opportunity costs of participation.
1. Introduction
Hunger and severe food insecurity threaten the well-being of millions of people worldwide, especially in low- and middle-income countries. Although the challenge of insufficient food intake has been a focus of global development efforts for decades, around 10 percent of the world’s population is undernourished, with highest rates in sub-Saharan Africa (FAO, IFAD, UNICEF, WFP, & WHO, Citation2022). Sustained malnutrition, manifested by the high prevalence of child stunting and wasting, is an even more pervasive global concern. Malnutrition can seriously impair health, physical and cognitive development, and labour productivity (DiGirolamo, Ochaeta, & Mejía Flores, Citation2020; Martorell, Citation1999; Wieser et al., Citation2017). Currently, about 22 percent of children under the age of five suffer from stunting (FAO et al., Citation2022).
To address these transversal development challenges, governments, civil society organizations, and international development charities implement a large diversity of interventions, both nutrition-specific (that is, addressing immediate determinants of nutrition, such as appropriate child feeding practices) and nutrition-sensitive (that is, addressing underlying determinants, such as agricultural productivity or hygiene practices; Ruel, Alderman, & the Maternal & Child Nutrition Study Group, Citation2013). Positive effects on beneficiaries’ food and nutrition security (FNS) can be achieved through different pathways, including improvements in nutrition awareness, agricultural production, incomes, sanitation, and gender relations (Nordhagen, Nielsen, van Mourik, Smith, & Klemm, Citation2019). Because food insecurity and malnutrition often have multiple, interlinked causes that may reinforce each other, there are high expectations towards diverse, multi-sectoral intervention programs that integrate efforts in, for example, agriculture, healthcare, nutrition awareness, social protection, and water and sanitation (del Carmen Casanovas et al., Citation2013; Ruel et al., Citation2013). Harnessing operational synergies between different types of interventions may increase the overall cost-effectiveness and sustainability of development programs for FNS (Cirillo, Györi, & Veras Soares, Citation2017). Examples of specific interventions include nutrition education campaigns, technical and institutional support to agricultural intensification and commercialization, the establishment of financial safety nets and the creation of sustainable income opportunities, or hand washing campaigns that aim to reduce the prevalence of diarrhoea and other diseases that can affect FNS (Bhutta et al., Citation2013; Nordhagen et al., Citation2019; Ruel et al., Citation2013).
Randomized controlled trials have demonstrated that targeting food-insecure population with multiple, complementary intervention packages – for example, promotion of nutrition-sensitive agriculture alongside nutrition education – can have stronger effects than single, standalone interventions (Bonuedi, Gerber, & Kornher, Citation2022; Kuchenbecker, Reinbott, Mtimuni, Krawinkel, & Jordan, Citation2017; McKune et al., Citation2020; Ogutu et al., Citation2018). These studies estimate effects at the level of treatment arms, that is, they disaggregate the effects of alternative intervention packages. But in addition, within treatment groups, the intensity of participation can vary substantially. Many households may be targeted by the same, integrated set of interventions, but usually, some project beneficiaries join more activities than others, as individual preferences, expectations, and the ability to commit time can vary (Okello et al., Citation2021; Santoso et al., Citation2020; Yekinni, Citation2010). This type of variation among targeted households cannot be fully controlled by the implementing organization because participation (in training sessions, childcare group meetings, etc.) is usually voluntary.
For efficient allocation of funds in future FNS programs, it matters to understand the relationship between the extent of individual intervention exposure and resulting program effects. In planning FNS intervention programs, donors and development practitioners need insight on the potential added benefit of diversifying FNS intervention programs with a larger set of different interventions. There is evidence that more empowering, meaningful participation of beneficiaries – in contrast to more passive approaches – can enhance the food security impacts of intervention projects (Beyuo & Anyidoho, Citation2022). Evidence also suggests that stronger engagement with individual interventions, in the sense of stronger commitment to promoted activities, is associated with stronger FNS impacts (Dallmann, Marquis, Colecraft, Kanlisi, & Aidam, Citation2022; de Brauw, Eozenou, & Moursi, Citation2015; Okello et al., Citation2021). We hypothesize that more intense involvement in project activities – in terms of participating in a higher number of different interventions – also contributes to better FNS outcomes, on average. This would justify investments into diverse intervention packages, as well as explicit efforts towards ensuring broad participation by individual beneficiaries.
In this study, we use cross-sectional data from one Asian and six African low- and middle-income countries where rural households were targeted with an intervention program to improve food security and dietary outcomes. We intend to answer the following question: to what extent is a greater level of individual participation in project activities associated with better FNS outcomes? To estimate the overall level of program effects, we first explore differences between program beneficiaries and a control group, using probit models and propensity score matching. Then, to answer our research question, we zoom in on the beneficiaries and estimate the marginal effects of increased participation intensity, measured by the number of interventions that a household has joined. Based on our findings, we derive recommendations for the design of FNS programs in rural settings.
2. Methods
2.1. Study context: GIZ intervention program
To address food insecurity and inadequate nutrition in low- and middle-income countries, German development agency ‘Deutsche Gesellschaft für Internationale Zusammenarbeit’ (GIZ) implemented a global program called ‘Food and Nutrition Security, Enhanced Resilience’. Funded by the German Ministry for Economic Cooperation and Development, this intervention program aimed at improving the FNS of vulnerable population as well as strengthening households’ resilience against shocks. The global program applied a multi-sectoral intervention approach, including a range of activities at household and community level. In each country, the project targeted rural areas (see in the Appendix) and included different sets of interventions, in line with identified local needs, partner preferences and capacities, and country project budgets. These nutrition-specific and nutrition-sensitive interventions were implemented between 2015 and 2018 and related to the promotion of nutrition awareness and knowledge, agricultural production, nutrition-related hygiene behaviour, food processing and preservation, and the level and resilience of household income. Messages were crafted and disseminated in collaboration with local NGOs and public offices, using different communication methods, including care groups, lead mothers, cooking demonstrations, farmer field schools, individual household visits, agricultural training sessions, and more. While the global program pursued the same goals everywhere (improving FNS of vulnerable population and increasing resilience to shocks), the exact design and composition of the country intervention packages were subject to prior deliberations between GIZ, local governments, and implementing partners, including local and international NGOs. Full lists of interventions by country are provided in the Supplementary Information. Given the importance of the ‘1000 days window’ in child development (from conception to 2 years of age), the program primarily targeted women of reproductive age and children of 0–23 months.
2.2. Data description
2.2.1. Household surveys
A household survey was designed to collect quantitative data on rural households. Surveys were conducted in eight countries where GIZ expected a second funding period (post-2018). In Ethiopia, however, for political reasons, data were collected only from program beneficiaries, but not from a control group. Since our impact analysis required a control group, data from Ethiopia were thus not included in this study. All survey respondents were women (aged 15–49 years) who were mother to at least one child aged 0–23 months at the time. In total, 3087 women were surveyed in six countries in sub-Saharan Africa and one country in Asia.
Surveys were administered in 2018 (African countries) and 2019 (Cambodia), three to five months after the main harvest time. In each country, between 350 and 574 households were randomly sampled through a two-stage procedure. First, a pre-defined number of program beneficiary villages was randomly selected, ranging from 27 in Benin to 100 in Zambia. These numbers were purposefully set to balance the trade-off between the need for high regional coverage (which would suggest visiting all villages) and maintaining survey logistics manageable. Second, households from these villages were randomly sampled. The number of respondents sampled in each selected beneficiary village was set to be in proportion with the villages’ respective population shares within the entire target population. For example, in a village hosting roughly 5 percent of the survey region’s population, we would have sampled 5 percent of our total survey respondents. All in all, at least 200 beneficiary households were randomly sampled in each country. In some countries, these goals were raised by the local survey coordinators, for example, up to 300 in Zambia (where, however, only 292 interviews were completed). In total, 1647 program beneficiaries were surveyed across the seven countries.
In addition, control groups consisting of the same number of households were surveyed in nearby non-beneficiary villages with comparable socio-economic and agro-climatic conditions. The same two-stage random sampling procedure was employed to select non-beneficiary survey respondents. That is, we randomly sampled households from the same number of villages, which were randomly sampled in a nearby sub-region within the same administrative unit (see in the Appendix). Control sub-regions were purposefully selected based on similarity in socio-economic and agro-climatic base conditions. The non-beneficiary households had not been directly targeted by development interventions. For logistical reasons, only 100 non-beneficiaries could be sampled in Benin. Overall, 1440 non-beneficiary households were surveyed. In the case of some interventions, survey respondents from control villages had also been reached, for example, through radio programs, billboards, or because interventions involved training of public health providers. To be able to control for spillover effects, households classified as non-beneficiaries were also asked about their interactions with program interventions. In all countries, this resulted in a non-zero mean number of interventions for non-beneficiary households.
All survey respondents provided informed oral consent before the interview. Data collection conformed with the principles of the 1964 WMA declaration of Helsinki. In all cases, local authorities were consulted before data collection to obtain research permission. Survey participants had the possibility to skip questions or end the interview at any moment. Data were aggregated and processed in anonymized form. Data cleaning, lastly, involved removing incomplete entries, to ensure equal group composition across all indicators when comparing the treatment and control groups. This reduced the number of households included in our analysis to 1467 beneficiaries (89% of the full sample) and 1266 non-beneficiaries (88%).
2.2.2. Indicators of food and nutrition security
Data collection included the nutritional status of respondent women, the youngest child, and their households at the time of survey. FNS status was assessed by three established indicators, using standard protocols for question phrasing and indicator calculation. First, to measure the degree of household food security, we enumerated the Food Insecurity Experience Scale (FIES) with a 30-day recall period, following the protocol presented by Cafiero, Viviani, and Nord (Citation2018). For a conservative approach, across all countries we used a FIES score >3 as the threshold for moderate and severe food insecurity. That is, we considered raw scores ≤3 as indicating ‘relative food security’ (Smith, Rabbitt, & Coleman-Jensen, Citation2017; Wambogo, Ghattas, Leonard, & Sahyoun, Citation2018). Second, the nutrient adequacy of mothers was assessed by Minimum Dietary Diversity of Women (MDDW), based on the enumeration of the individual dietary diversity score with 10 food groups and a 24-h recall period (Kennedy, Ballard, & Dop, Citation2010). MDDW was considered as achieved when women consumed at least five food groups (FAO & FHI 360, 2016; Martin-Prevel et al., Citation2017). Third, the nutrient adequacy of children was assessed by Minimum Acceptable Diet (MAD). This metric combines two criteria: a minimum individual dietary diversity criterion (four of either six or seven food groups, depending on breastfeeding status, 24-h recall) and the number of meals across the entire day and night preceding the survey, with varying cut-off points depending on child age and breastfeeding status (WHO, Citation2010).
The survey also enumerated household activities, such as farming and income-generating activities, as well as participation in the development interventions implemented by the program, which initiated three years earlier. A standard questionnaire was adapted to country context, for example, to enumerate crop diversity using locally relevant crop species, or to cover locally implemented interventions. Country-specific lists of crop and livestock species are provided in the Supplementary Information.
2.3. Empirical strategy
2.3.1. Estimating overall program effects on FNS outcomes
Before estimating the marginal effects of participation intensity (see following section), we first estimate overall program impacts. We do this by comparing targeted households, our treatment group, ex-post with non-targeted households, our control group. To estimate the effect of program participation on three FNS outcomes, we employ probit models, controlling for a program participation dummy and eight individual- and household-level control variables. A significant positive participation dummy would suggest a positive effect of program participation on FNS outcomes. These models take the following form:
(1)
(1)
where
denotes the respective binary outcome (FIES ≤3, MDDW, or MAD) for household
in country
represents the coefficient of interest, and
is a dummy variable for participation in the global program.
is a vector of observed characteristics for household
in country
while
denotes country fixed effects. A household-level error term
accounts for unobserved characteristics. The covariates in
include a set of eight household variables that have been reported to influence the FNS situation at individual or household level (see Fraval et al., Citation2019; Islam, von Braun, Thorne-Lyman, & Ahmed, Citation2018; Ruel, Quisumbing, & Balagamwala, Citation2018; Sibhatu, Krishna, & Qaim, Citation2015): the age of child in months, gender of child, gender of household head, household size, education level of respondent, access to farmland (dummy), access to school feeding (dummy), and access to food assistance (dummy). Child’s age and gender, however, were only included in the MAD model, as these variables are not expected to affect FNS at the levels of household (FIES) or mother (MDDW). In contrast to linear regression models, probit model coefficients cannot be directly interpreted as marginal effects. We estimated average marginal effects for all three models with the R software (R Core Team, Citation2020), using the margins package (Leeper, Citation2021).
As the allocation of treatment was not random in our observational, non-experimental study setting, our models can be subject to selection bias. The underlying reasons for self-selecting into interventions can be associated with the outcome indicators, hence the likelihood of receiving treatment can covary with positive outcomes. We address this potential bias by propensity score matching (PSM). In PSM, each treated household is matched with one or multiple control households which are most similar regarding multiple observed variables that explain program participation, that is, the propensity to be treated. Average treatment effects can then be estimated from the differences in outcome variables between matched treatment-control pairs (Caliendo & Kopeinig, Citation2008; Dehejia & Wahba, Citation2002; Rosenbaum & Rubin, Citation1985). For all survey respondents, we computed propensity scores based on the eight variables listed above, using a logistic regression with the participation dummy as the dependent variable. A propensity score – that is, the probability of being a program beneficiary – was then assigned to each household by extracting predicted response values from this model.
In general, PSM requires two assumptions to allow valid estimates. First, PSM requires the presence of common support, meaning that program beneficiaries have comparable non-beneficiaries in terms of their propensity scores. Second, the conditional independence assumption states that participation in the global program can be explained by the characteristics used to construct the propensity score. It is assumed that, once these characteristics are controlled for, there are no systematic differences between the two groups.
To avoid matching households from different countries, we performed relative matching on the propensity score based on these variables, but obligatory exact matching on the country variable. As a robustness check, we employed three alternative matching algorithms on the propensity score: nearest-neighbour matching, caliper matching, and genetic matching, using the Matching R package (Sekhon, Citation2011). In nearest-neighbour matching, each treated household is matched with the closest control household in terms of the propensity score. In the case of ties, that is, when multiple control households had equal distance to the treated household, all matched control observations were included, with their weights adjusted correspondingly. Caliper matching is similar to nearest-neighbour matching but implies that matching is bound by a distance restriction, called caliper. For all matching variables, we set the caliper to 0.2 of the standard deviation of the variable, following Austin (Citation2011). This ensures relatively strong similarity of matched pairs, but some treated households can be omitted due to the lack of a sufficiently similar match, and such omissions can introduce bias (Guo, Fraser, & Chen, Citation2020). Genetic matching, lastly, employs a genetic search algorithm to minimize mean matching distance by assigning an optimal weight to each matching variable. To analyse effects of program participation on FNS outcomes, we then estimated average treatment effects on the treated (ATT) regarding three outcome variables (FIES, MDDW, and MAD). ATT represents the mean difference between matched treatment-control pairs.
Under certain conditions, PSM can lead to biased estimates of treatment effects (Guo et al., Citation2020; King & Nielsen, Citation2019). As another robustness check, we thus re-estimated the ATTs employing inverse probability weighted regression adjustment (IPWRA, Woolridge, Citation2010). Estimating ATTs with IPWRA involves two steps. First, we estimated propensity scores in the same way as described above. Second, we employed probit regression models using inverse probability weighted least squares, where each observation is weighted by the inverse of its propensity to treatment in the treatment group, and to non-treatment in the control group. We performed analyses using the survey R package (Lumley, Citation2020).
2.3.2. Estimating effects of varying participation intensity
Our main interest was the extent to which the intensity of participation influences impact. We hypothesized that participation in a greater number of program interventions was associated with a higher probability of positive FNS outcomes. To test this hypothesis, we studied the 1467 beneficiary households, only, and performed three independent analyses.
First, we tested whether beneficiary households that did and those that did not achieve FNS thresholds differed significantly in their participation intensity. We performed three Chi-square tests, comparing the reported numbers of interventions of households above and below the thresholds of FIES, MDDW, and MAD. Chi-square tests, rather than Student’s t-tests, were used because the numbers of interventions per household were not normally distributed. Significantly different participation intensity between achievers and non-achievers of positive FNS outcomes may suggest that the number of interventions influences the likelihood of positive outcomes.
Second, we employed probit models for all three FNS indicators, controlling for participation intensity and individual- and household-level determinants of FNS. Model specifications are similar to EquationEquation (1)(1)
(1) , including country dummies and eight household covariates. However, instead of controlling for a participation dummy, we include participation intensity as a covariate. Thus, these models take the following form:
(2)
(2)
where
represents a count variable for the intensity of program participation. All other variables are defined in EquationEquation (1)
(1)
(1) .
We ruled out collinearity in all models using the performance R package (Lüdecke, Ben-Shachar, Patil, Waggoner, & Makowski, Citation2021). As with the previous set of models, average marginal effects for all three models were estimated using the margins R package (Leeper, Citation2021).
Third, we fit three dose-response models and inspected dose-response curves. This approach is common in medical research to assess the effectiveness of different doses of medication on patient health. But dose-response models are also used in economic research (for example, Debela, Shively, & Holden, Citation2021). We specified the number of interventions as ‘dose’ and the probability of achieving a positive FNS outcome as the ‘response’. Calculations used the drc R package (Ritz, Baty, Streibig, & Gerhard, Citation2015) and visualization was done with ggplot2 (Wickham, Citation2016).
3. Results
3.1. Descriptive statistics
shows key enumerated variables and indicators. To provide an idea of between-country diversity, it also shows the ranges between country-specific mean values. Across both program beneficiaries and non-beneficiaries, a large majority of respondents had access to farmland, but more than two-third of households also sourced part of their income from off-farm activities. Program beneficiaries had significantly higher on-farm species diversity scores than non-beneficiaries and were more likely to manage a home garden. Beneficiaries also more often received food through public or humanitarian food distribution systems or school feeding programs. Regarding our outcome indicators, relative food security (FIES ≤ 3) was more prevalent than nutrient adequacy (MDDW, MAD) across both treatment groups. Overall, beneficiaries outperformed non-beneficiaries for all three outcome indicators.
Table 1. Overview of household data and indicators
3.2. Effects of program participation on FNS outcomes
shows the probit model results following EquationEquation (1)(1)
(1) , which includes a participation dummy. Across the three outcome variables (FIES, MDDW, and MAD), program participation is a significant predictor of positive outcomes. The average marginal effects of the program participation dummy on the probability of positive FNS outcomes was about 8 percent for FIES, 16 percent for MDDW, and 15 percent for MAD.
Table 2. Probit model estimates including a program participation dummy
shows estimated average treatment effects (ATTs) after PSM addressing potential selection bias. Across all three PSM approaches, ATTs are positive and significant for all three outcome variables. According to the ATTs, participants in the global program are 7–9 percent more likely than non-beneficiaries to achieve a positive FIES score, 15–16 percent more likely to achieve MDDW, and 15–17 percent more likely to achieve MAD.
Table 3. Estimated effects of program participation on FNS outcomes: average treatment effects from three propensity score matching approaches
Results from IPWRA were similar to the probit models and ATT estimates using PSM in sign, magnitude, and significance level (see in the Appendix). For FIES, the IPWRA procedure estimates an ATT of roughly 6 percent, slightly lower than the probit models and PSM procedures.
3.3. Effects of varying participation intensity
Overall, beneficiary households that achieved positive FNS outcomes participated in more interventions than beneficiaries that fell below the FNS thresholds (see ). Chi-square tests confirmed differences are statistically significant (α=.999). shows results from probit models from EquationEquation (2)(2)
(2) , which includes intervention intensity. In all cases, the number of interventions per household is a significant predictor of positive FNS outcomes. For three outcome indicators, average marginal effects show that adding another intervention increased the probability of achieving a positive outcome by 1.1–1.4 percent. The dose-response curves generally confirm an increased probability of achieving positive FNS outcomes with increasing intervention intensity, although marginal benefits decrease with the growing number of interventions (). Adding a quadratic term (participation intensity squared) to EquationEquation (2)
(2)
(2) did not substantiate decreasing marginal returns, though, as the quadratic terms did not significantly improve model fit.
Figure 1. Dose-response curves for the relationship between number of interventions (dose) and three food and nutrition security indicators (response) among program beneficiaries. Vertical axes show the estimated probability of achieving positive FNS outcome. Shaded areas represent 95 percent confidence intervals.
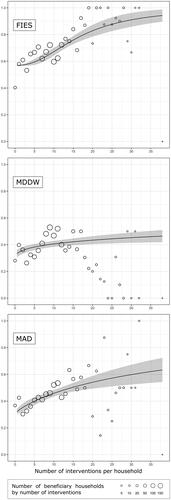
Table 4. Median numbers and interquartile range of interventions per household (HH), separate for households above and below the indicator thresholds
Table 5. Probit model estimates including participation intensity (number of interventions)
3.4. Evaluation of propensity score matching
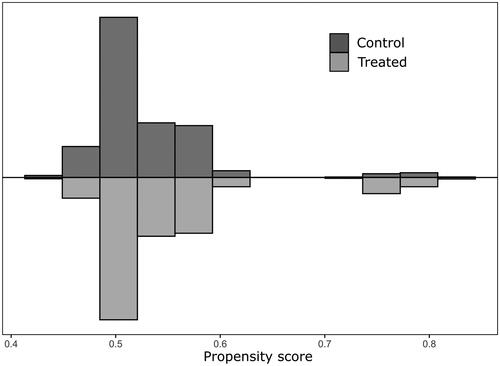
To evaluate the required assumptions for PSM, shows the region of common support. Visual inspection reveals a substantial overlap of the propensity scores of treated and control household, thus the assumption of common support was satisfied. The results of multiple balancing tests are shown in of the Appendix. Successful PSM implies that systematic differences in observed covariates between treatment and control group are removed. For all three matching procedures, independent sample t-tests and Kolmogorov-Smirnov tests confirm that no covariates show significant differences after matching (no p-values < 0.05). In addition, mean bias, that is, the average standard mean difference of all covariates between treated and control is reduced by at least 63 percent relative to the unmatched sample. Caliper matching can lead to biased estimates if many treated observations cannot be matched due to a lack of corresponding control households. In our case, sample size retention, that is, the share of treated observations that are effectively included in PSM is high at 93 percent. Lastly, matching should reduce the explanatory power of covariates for the allocation of treatment. Pseudo R2 values of the logit models after matching are reduced relative to the model on the unmatched dataset.
Figure 2. Distribution of propensity scores and region of common support.
4. Discussion
4.1. Overall positive effects of program participation on food and nutrition security
This study investigated the relationship between participation in a greater number of nutrition-oriented development interventions and positive FNS outcomes of targeted households. We present two main results: First, we found that participation in the intervention program, generally, was associated with improved FNS at the levels of household, mother, and child. Second, we observe additive effects of individual interventions for all three FNS outcome indicators.
Overall, our analysis suggests that participation in the nutrition-sensitive intervention program was associated with better FNS outcomes. ATTs are similar across three alternative matching algorithms, suggesting robust estimates. Program participants were 15–17 percent more likely than the control group to achieve nutrient adequacy (measured through MDDW and MAD), but the positive effect is estimated at just 7–9 percent for household food security, measured through FIES. These results are in line with the average marginal effects estimated by probit models based on the complete dataset without matching, as well as ATT estimates from IPWRA, suggesting that selection biases played a minor role in our study.
We assess program effects by estimating the mean difference in outcomes between treated and control households. Yet, because households in the control group had also benefited from more than two interventions, on average, their FNS situation may have also been improved by the global program. Absolute effects on beneficiary households could therefore be even higher and our results may represent conservative estimates. Given the frequency of intervention spillover (for example, through radio broadcasts), it was not possible to select a control group that was both comparable to the treatment group and effectively excluded from interventions.
Our results suggest stronger effects for individual nutrient adequacy than for household food security. The three FNS outcome variables can be compared because, in our analysis, all three were binary variables. One possible explanation for a weaker effect on FIES is that the global program targeted individual diets more explicitly than household-level access to food. But also, among beneficiaries and control households alike, positive FIES scores were more prevalent than positive MDDW or MAD scores. Compared to these measures of nutrient adequacy, a generally higher share of households already above the food security threshold (FIES ≤ 3) implies a more limited scope for measurable improvements. The fact that more targeted households enjoyed food security than nutrient adequacy may have diminished the measurable effect of the intervention program on food security.
4.2. Additive effects of nutrition-sensitive interventions
Our results suggest that participating in more interventions increases the probability of reaching desired FNS outcomes. For all three FNS indicators, probit regressions showed positive associations between the number of interventions and the probability of achieving a positive outcome. On average, each additional intervention increased the probability of a beneficiary household achieving positive FNS outcomes by about 1 percent. Although this estimated effect size per additional intervention may mask substantial heterogeneity between national project contexts, it could be useful for future FNS program design and planning. These findings may provide support for multi-channel ‘campaign’ approaches that deliberately target individual beneficiaries with similar messages via multiple pathways (that is, via different interventions), addressing different channel preferences and learning styles (Kansiime et al., Citation2022; Kim et al., Citation2016).
For all three outcome indicators, beneficiary households above the threshold have, on average, participated in more interventions than those below. The difference in size is not large (median numbers of interventions differ by just 1), but statistically significant.
The dose-response curves show that marginal effects, although remaining positive, tend to diminish at higher numbers of interventions, especially in the case of MDDW. To ensure the cost-effectiveness of FNS intervention programs, this result might underscore the need for locally tailored intervention packages that target women with few, but well-selected interventions (Fiorella, Chen, Milner, & Fernald, Citation2016). Our dose-response curves, however, need to be interpreted with caution. In contrast to the probit models, the curves do not control for country effects. Thus, the shown relationships may be biased by including FNS outcome rates from countries with rather low average numbers of interventions (left side of the diagrams) as well as countries with high average numbers (right side of the diagrams).
Our findings highlight the potential benefits of implementing diversified, multi-channel FNS intervention programs. Policy makers, donors, and development practitioners are provided quantitative evidence on the link between numbers of interventions per household and improved FNS outcomes. Given limited financial resources in development programs, this link points to a trade-off between increasing the total number of target households and maximizing the benefit for individual beneficiaries. Based on our results, development stakeholders interested in improving food security and dietary outcomes may consider reaching stronger effects per beneficiary by (i) offering diversified, multi-sectoral intervention programs, and (ii) encouraging and enabling broad participation (in many interventions) by individual households. The latter could be achieved through continued stakeholder deliberations around holistic program design, rather than focusing on the design of individual interventions (Leeuwis, Citation2000; Mansuri & Rao, Citation2013).
Variation in beneficiaries’ participation intensity can partly be explained by transaction and opportunity costs of participation (Okello et al., Citation2021; Thai et al., Citation2023). In our sample, for example, participation in a higher number of interventions was associated with an older child and a smaller household size (that is, less children). Female household leadership was associated with fewer interventions. This suggests that strong project participation may be constrained by time budgets required for productive and reproductive labour. To enable strong participation – including by especially time-poor mothers of small infants or many children – development stakeholders should emphasize minimizing transaction and opportunity costs. This could mean, for example, reducing travel needs through a focus on home visits or demonstration plots near the village, facilitating childcare at selected activities, or scheduling activities at periods when the target group is least burdened with on- or off-farm labour (Margolies, Colantuoni, Morgan, Gelli, & Caulfield, Citation2023).
4.3. Other determinants of food and nutrition security outcomes
Our results suggest an association between women’s educational attainment and FNS outcomes. These superior outcomes have been credited, for example, to higher average incomes enabled by better education (Mutisya, Ngware, Kabiru, & Kandala, Citation2016; Ruel et al., Citation2013). But also, education may increase women’s intra-household bargaining power, empowering them for greater participation in decision-making on household expenditures, with possible positive effects for nutrition (Sinharoy et al., Citation2018).
Other determinants of FNS outcomes include the gender of household leadership. Overall, men tend to have larger farming plots than women and often experience better access to agro-inputs and output markets, contributing to greater farm productivity (Lambrecht, Schuster, Asare Samwini, & Pelleriaux, Citation2018; Mason, Ndlovu, Parkins, & Luckert, Citation2015; Sheahan & Barrett, Citation2017). In addition, access to school feeding and food assistance play positive roles. It is not surprising that receiving free food contributes to food security and dietary diversity (Hidrobo, Hoddinott, Peterman, Margolies, & Moreira, Citation2014; Jomaa, McDonnell, & Probart, Citation2011). But the fact these variables significantly influenced our models underscores the importance of enumerating them in FNS research.
4.4. Potential methodological limitations
This study used aggregated survey data from seven different countries. Analysing aggregated data bears the risk of oversimplifying relationships by overriding heterogeneity and overlooking potentially important determinants of FNS at country level. For the purpose of our study, however, a cross-country study design allowed us to identify drivers of FNS with relevance to the design of multi-country intervention programs, rather than to identify local solutions.
Our probit models include several covariates that were selected based on their relevance for FNS according to the empirical literature. However, the number of variables was limited by data availability. Time limitations during survey enumeration did not allow collecting data to account for market access, for example, by quantifying travel time (Wichern et al., Citation2018). Part of the observed variation in FNS may also be explained by differences in household assets (for example, farm and herd size; Frelat et al., Citation2016). Since the survey was carried out within the context of a donor-funded intervention program, however, we did not enumerate assets, to avoid potential strategic under-reporting (van Asten, Kaaria, Fermont, & Delve, Citation2009).
Between countries, the overall number of different interventions offered to beneficiaries varied, ranging from 15 in Togo to 45 in Mali. This variation is partly due to differences in financial volume, regional coverage, and the number of targeted beneficiaries in the respective countries. In part, however, the numbers also reflect different project strategies: multiple one-off interventions (field days, events around nutrition) generate a higher intervention count than recurrent activities that require stronger beneficiary commitment (for example, ongoing, biweekly care group meetings were considered one intervention). In addition, part of the variation may be due to differences in what was considered ‘one intervention’ by local staff, as different activities can sometimes be subsumed into one, or defined as multiple, separate interventions. As we controlled for country effects in all econometric analyses, however, we do not expect that this effect influences our overall conclusions.
5. Conclusion
Using cross-country data from 2733 households, of which 1467 were targeted by an intervention program for food and nutrition security, this study finds that participation in a greater number of different interventions is associated with better food and nutrition security outcomes. Our findings suggest that targeting rural households with a greater number of diverse interventions, through different communication channels, increases the probability of achieving positive change in food and nutrition security. We derive two key practical insights from our results: First, the effort of managing complex, diverse intervention projects, involving a range of complementary nutrition-oriented activities, can pay off by improved food and nutrition security outcomes compared to less diversified projects. Second, to maximize impacts, implementing organizations may consider deliberate efforts towards encouraging and enabling individual participation of beneficiaries in many different interventions, especially through reducing transaction and opportunity costs of participation.
Supplemental Material
Download PDF (440.9 KB)Acknowledgments
The authors thank all survey respondents, survey coordinators, and enumerators, as well as three anonymous reviewers and the editor whose comments have helped improve this manuscript. We acknowledge support by the Open Access Publication Fund of Humboldt-Universität zu Berlin.
Disclosure statement
No potential conflict of interest was reported by the author(s).
Data availability statement
The full anonymized dataset used in this study is available online (https://doi.org/10.6084/m9.figshare.21080854). Statistical code for R software will be shared upon request.
Correction Statement
This article was originally published with errors. This version has been corrected. Please see Correction notice https://doi.org/10.1080/00220388.2023.2198817
References
- Austin, P. C. (2011). Optimal caliper widths for propensity-score matching when estimating differences in means and differences in proportions in observational studies. Pharmaceutical Statistics, 10(2), 150–161. doi:10.1002/pst.433
- Beyuo, A., & Anyidoho, N. A. (2022). An impact assessment of farmer participation on food security in northwestern Ghana. The European Journal of Development Research, 34(4), 1831–1856. doi:10.1057/s41287-021-00444-7
- Bhutta, Z. A., Das, J. K., Rizvi, A., Gaffey, M. F., Walker, N., Horton, S., … Black, R. E. (2013). Evidence-based interventions for improvement of maternal and child nutrition: What can be done and at what cost? Lancet, 382(9890), 452–477. doi:10.1016/S0140-6736(13)60996-4
- Bonuedi, I., Gerber, N., & Kornher, L. (2022). Intervening in cash crop value ahains for improved nutrition: Evidence from rural Sierra Leone. The Journal of Development Studies, 58(1), 38–54. doi:10.1080/00220388.2021.1945043
- Cafiero, C., Viviani, S., & Nord, M. (2018). Food security measurement in a global context: The food insecurity experience scale. Measurement, 116, 146–152. doi:10.1016/j.measurement.2017.10.065
- Caliendo, M., & Kopeinig, S. (2008). Some practical guidance for the implementation of propensity score matching. Journal of Economic Surveys, 22(1), 31–72. doi:10.1111/j.1467-6419.2007.00527.x
- Cirillo, C., Györi, M., & Veras Soares, F. (2017). Targeting social protection and agricultural interventions: The potential for synergies. Global Food Security, 12, 67–72. doi:10.1016/j.gfs.2016.08.006
- Dallmann, D., Marquis, G. S., Colecraft, E. K., Kanlisi, R., & Aidam, B. A. (2022). Maternal participation level in a nutrition-sensitive agriculture intervention matters for child diet and growth outcomes in rural Ghana. Current Developments in Nutrition, 6(3), nzac017. doi:10.1093/cdn/nzac017
- de Brauw, A., Eozenou, P., & Moursi, M. (2015). Programme participation intensity and children’s nutritional status: Evidence from a randomised control trial in Mozambique. The Journal of Development Studies, 51(8), 996–1015. doi:10.1080/00220388.2015.1018907
- Debela, B. L., Shively, G. E., & Holden, S. T. (2021). Implications of food-for-work programs for consumption and production diversity: Evidence from the Tigray Region of Ethiopia. Agricultural and Food Economics, 9(1), 28. doi:10.1186/s40100-021-00189-1
- Dehejia, R. H., & Wahba, S. (2002). Propensity score-matching methods for nonexperimental causal studies. The Review of Economics and Statistics, 84(1), 151–161. doi:10.1162/003465302317331982
- del Carmen Casanovas, M., Lutter, C. K., Mangasaryan, N., Mwadime, R., Hajeebhoy, N., Aguilar, A. M., … Onyango, A. W. (2013). Multi-sectoral interventions for healthy growth. Maternal & Child Nutrition, 9(S2), 46–57. doi:10.1111/mcn.12082
- DiGirolamo, A. M., Ochaeta, L., & Mejía Flores, R. M. (2020). Early childhood nutrition and cognitive functioning in childhood and adolescence. Food and Nutrition Bulletin, 41(1_suppl), S31–S40. doi:10.1177/0379572120907763
- FAO, & FHI 360 (2016). Minimum dietary diversity for women: A guide for measurement. Rome: Food and Agriculture Organization of the United Nations.
- FAO, IFAD, UNICEF, WFP, & WHO (2022). The state of food security and nutrition in the world 2022. Repurposing food and agricultural policies to make healthy diets more affordable. Rome: Food and Agriculture Organization of the United Nations.
- Fiorella, K. J., Chen, R. L., Milner, E. M., & Fernald, L. C. H. (2016). Agricultural interventions for improved nutrition: A review of livelihood and environmental dimensions. Global Food Security, 8, 39–47. doi:10.1016/j.gfs.2016.03.003
- Fraval, S., Hammond, J., Bogard, J. R., Ng’endo, M., van Etten, J., Herrero, M., … van Wijk, M. T. (2019). Food access deficiencies in sub-Saharan Africa: Prevalence and implications for agricultural interventions. Frontiers in Sustainable Food Systems, 3, 104. doi:10.3389/fsufs.2019.00104
- Frelat, R., Lopez-Ridaura, S., Giller, K. E., Herrero, M., Douxchamps, S., Andersson Djurfeldt, A., … van Wijk, M. T. (2016). Drivers of household food availability in sub-Saharan Africa based on big data from small farms. Proceedings of the National Academy of Sciences of the United States of America, 113(2), 458–463. doi:10.1073/pnas.1518384112
- Guo, S., Fraser, M., & Chen, Q. (2020). Propensity score analysis: recent debate and discussion. Journal of the Society for Social Work and Research, 11(3), 463–482. doi:10.1086/711393
- Hidrobo, M., Hoddinott, J., Peterman, A., Margolies, A., & Moreira, V. (2014). Cash, food, or vouchers? Evidence from a randomized experiment in northern Ecuador. Journal of Development Economics, 107, 144–156. doi:10.1016/j.jdeveco.2013.11.009
- Islam, A. H. M. S., von Braun, J., Thorne-Lyman, A. L., & Ahmed, A. U. (2018). Farm diversification and food and nutrition security in Bangladesh: Empirical evidence from nationally representative household panel data. Food Security, 10(3), 701–720. doi:10.1007/s12571-018-0806-3
- Jomaa, L. H., McDonnell, E., & Probart, C. (2011). School feeding programs in developing countries: Impacts on children’s health and educational outcomes. Nutrition Reviews, 69(2), 83–98. doi:10.1111/j.1753-4887.2010.00369.x
- Kansiime, M. K., Njunge, R., Okuku, I., Baars, E., Alokit, C., Duah, S., … Watiti, J. (2022). Bringing sustainable agricultural intensification practices and technologies to scale through campaign-based extension approaches: Lessons from Africa Soil Health Consortium. International Journal of Agricultural Sustainability, 20(5), 743–757. doi:10.1080/14735903.2021.1976495
- Kennedy, G., Ballard, T., & Dop, M.-C. (2010). Guidelines for measuring household and individual dietary diversity. Rome: Food and Agriculture Organization of the United Nations.
- Kim, S. S., Rawat, R., Mwangi, E. M., Tesfaye, R., Abebe, Y., Baker, J., … Menon, P. (2016). Exposure to large-scale social and behavior change communication interventions is associated with improvements in infant and young child feeding practices in Ethiopia. PLOS One, 11(10), e0164800. doi:10.1371/journal.pone.0164800
- King, G., & Nielsen, R. (2019). Why propensity scores should not be used for matching. Political Analysis, 27(4), 435–454. doi:10.1017/pan.2019.11
- Kuchenbecker, J., Reinbott, A., Mtimuni, B., Krawinkel, M. B., & Jordan, I. (2017). Nutrition education improves dietary diversity of children 6–23 months at community-level: Results from a cluster randomized controlled trial in Malawi. PLOS One, 12(4), e0175216. doi:10.1371/journal.pone.0175216
- Lambrecht, I., Schuster, M., Asare Samwini, S., & Pelleriaux, L. (2018). Changing gender roles in agriculture? Evidence from 20 years of data in Ghana. Agricultural Economics, 49(6), 691–710. doi:10.1111/agec.12453
- Leeper, T. J. (2021). Margins: Marginal effects for model objects. R package version 0.3.26. https://cran.r-project.org/web/packages/margins/
- Leeuwis, C. (2000). Reconceptualizing participation for sustainable rural development: Towards a negotiation approach. Development and Change, 31(5), 931–959. doi:10.1111/1467-7660.00184
- Lüdecke, D., Ben-Shachar, M. S., Patil, I., Waggoner, P., & Makowski, D. (2021). Performance: An R package for assessment, comparison and testing of statistical models. Journal of Open Source Software, 6(60), 3139. doi:10.21105/joss.03139
- Lumley, T. (2020). Survey: Analysis of complex survey samples. R package version 4.0. https://cran.r-project.org/web/packages/survey/
- Mansuri, G., & Rao, V. (2013). Can participation be induced? Some evidence from developing countries. Critical Review of International Social and Political Philosophy, 16(2), 284–304. doi:10.1080/13698230.2012.757918
- Margolies, A., Colantuoni, E., Morgan, R., Gelli, A., & Caulfield, L. (2023). The burdens of participation: A mixed-methods study of the effects of a nutrition-sensitive agriculture program on women’s time use in Malawi. World Development, 163, 106122. doi:10.1016/j.worlddev.2022.106122
- Martin-Prevel, Y., Arimond, M., Allemand, P., Wiesmann, D., Ballard, T. J., Deitchler, M., … Moursi, M. (2017). Development of a dichotomous indicator for population-level assessment of dietary diversity in women of reproductive age. Current Developments in Nutrition, 1(12), e001701. doi:10.3945/cdn.117.001701
- Martorell, R. (1999). The nature of child malnutrition and its long-term implications. Food and Nutrition Bulletin, 20(3), 288–292. doi:10.1177/156482659902000304
- Mason, R., Ndlovu, P., Parkins, J. R., & Luckert, M. K. (2015). Determinants of food security in Tanzania: Gendered dimensions of household headship and control of resources. Agriculture and Human Values, 32(3), 539–549. doi:10.1007/s10460-014-9568-5
- McKune, S. L., Stark, H., Sapp, A. C., Yang, Y., Slanzi, C. M., Moore, E. V., … Wereme N’Diaye, A. (2020). Behavior change, egg consumption, and child nutrition: a cluster randomized controlled trial. Pediatrics, 146(6), e2020007930. doi:10.1542/peds.2020-007930
- Mutisya, M., Ngware, M. W., Kabiru, C. W., & Kandala, N. (2016). The effect of education on household food security in two informal urban settlements in Kenya: A longitudinal analysis. Food Security, 8(4), 743–756. doi:10.1007/s12571-016-0589-3
- Nordhagen, S., Nielsen, J., van Mourik, T., Smith, E., & Klemm, R. (2019). Fostering CHANGE: Lessons from implementing a multi-country, multi-sector nutrition-sensitive agriculture project. Evaluation and Program Planning, 77, 101695. doi:10.1016/j.evalprogplan.2019.101695
- Ogutu, S. O., Fongar, A., Gödecke, T., Jäckering, L., Mwololo, H., Njuguna, M., … Qaim, M. (2018). How to make farming and agricultural extension more nutrition-sensitive: Evidence from a randomised controlled trial in Kenya. European Review of Agricultural Economics, 47, 95–118. doi:10.1093/erae/jby049
- Okello, J. J., Bocher, T., Low, J., Grant, F., Cole, D., Okuku, H. S., … Levin, C. (2021). Effects and drivers of participation in agriculture-nutrition-health interventions: Experiences from a biofortified sweetpotato project. Development in Practice, 31(5), 592–605. doi:10.1080/09614524.2021.1907533
- R Core Team (2020). R: A language and environment for statistical computing. Vienna: R Foundation for Statistical Computing. https://www.R-project.org/
- Ritz, C., Baty, F., Streibig, J. C., & Gerhard, D. (2015). Dose-response analysis using R. PLOS One, 10(12), e0146021. doi:10.1371/journal.pone.0146021
- Rosenbaum, P. R., & Rubin, D. B. (1985). Constructing a control group using multivariate matched sampling methods that incorporate the propensity score. The American Statistician, 39(1), 33–38. doi:10.2307/2683903
- Ruel, M. T., Alderman, H., & The Maternal and Child Nutrition Study Group (2013). Nutrition-sensitive interventions and programmes: How can they help to accelerate progress in improving maternal and child nutrition? Lancet, 382(9891), 536–551. doi:10.1016/S0140-6736(13)60843-0
- Ruel, M. T., Quisumbing, A. R., & Balagamwala, M. (2018). Nutrition-sensitive agriculture: What have we learned so far? Global Food Security, 17, 128–153. doi:10.1016/j.gfs.2018.01.002
- Santoso, M., Bezner-Kerr, R., Kassim, N., Mtinda, E., Martin, H., Hoddinott, J., & Young, S. (2020). Predictors of program participation in a nutrition-sensitive agroecological intervention in Singida, Tanzania. Current Developments in Nutrition, 4(S2), 4140903. doi:10.1093/cdn/nzaa053_108
- Sekhon, J. S. (2011). Multivariate and propensity score matching software with automated balance optimization: The matching package for R. Journal of Statistical Software, 42(7), 1–52. doi:10.18637/jss.v042.i07
- Sheahan, M., & Barrett, C. B. (2017). Ten striking facts about agricultural input use in sub-Saharan Africa. Food Policy, 67, 12–25. doi:10.1016/j.foodpol.2016.09.010
- Sibhatu, K. T., Krishna, V. V., & Qaim, M. (2015). Production diversity and dietary diversity in smallholder farm households. Proceedings of the National Academy of Sciences of the United States of America, 112(34), 10657–10662. doi:10.1073/pnas.1510982112
- Sinharoy, S. S., Waid, J. L., Haardörfer, R., Wendt, A., Gabrysch, S., & Yount, K. M. (2018). Women’s dietary diversity in rural Bangladesh: Pathways through women’s empowerment. Maternal & Child Nutrition, 14(1), e12489. doi:10.1111/mcn.12489
- Smith, M. D., Rabbitt, M. P., & Coleman-Jensen, A. (2017). Who are the world’s food insecure? New evidence from the Food and Agriculture Organization’s Food Insecurity Experience Scale. World Development, 93, 402–412. doi:10.1016/j.worlddev.2017.01.006
- Thai, G., Margolies, A., Gelli, A., Sultana, N., Choo, E., Kumar, N., & Levin, C. (2023). The economic costs of a multisectoral nutrition programme implemented through a credit platform in Bangladesh. Maternal & Child Nutrition, 19(1), e13441. doi:10.1111/mcn.13441
- van Asten, P. J. A., Kaaria, S., Fermont, A. M., & Delve, R. J. (2009). Challenges and lessons when using farmer knowledge in agricultural research and development projects in Africa. Experimental Agriculture, 45(1), 1–14. doi:10.1017/S0014479708006984
- Wambogo, E. A., Ghattas, H., Leonard, K. L., & Sahyoun, N. R. (2018). Validity of the food insecurity experience scale for use in sub-Saharan Africa and characteristics of food-insecure individuals. Current Developments in Nutrition, 2(9), 2009003. doi:10.1093/cdn/nzy062
- WHO (2010). Indicators for assessing infant and young child feeding practices. Part 2: Measurement. Geneva: World Health Organization.
- Wichern, J., van Heerwaarden, J., de Bruin, S., Descheemaeker, K., van Asten, P. J. A., Giller, K. E., & van Wijk, M. T. (2018). Using household survey data to identify large-scale food security patterns across Uganda. PLOS One, 13(12), e0208714. doi:10.1371/journal.pone.0208714
- Wickham, H. (2016). ggplot2: Elegant graphics for data analysis. New York, NY: Springer.
- Wieser, S., Brunner, B., Tzogiou, C., Plessow, R., Zimmermann, M. B., Farebrother, J., … Bhutta, Z. A. (2017). Societal costs of micronutrient deficiencies in 6- to 59-month-old children in Pakistan. Food and Nutrition Bulletin, 38(4), 485–500. doi:10.1177/0379572117720012
- Woolridge, J. M. (2010). Econometric analysis of cross section and panel data (2nd ed.). Cambridge, MA; London: MIT Press.
- Yekinni, O. T. (2010). Women’s participation in development programs and food security status. Journal of Agricultural & Food Information, 11(1), 28–35. doi:10.1080/10496500903436359
Appendix
Table A1. Distribution of survey respondents by country
Table A2. Estimated effects of program participation on FNS outcomes: average treatment effects from inverse probability weighted regression adjustment
Table A3. Covariate balancing tests and PSM quality indicators