
 ?Mathematical formulae have been encoded as MathML and are displayed in this HTML version using MathJax in order to improve their display. Uncheck the box to turn MathJax off. This feature requires Javascript. Click on a formula to zoom.
Abstract
Whether schooling systems with greater autonomy offset or reinforce educational inequalities remains debateable. Yet school autonomy is often advocated by different actors including donors and international organisations in many countries. This study examines the association between school autonomy and the inequality in maths achievement of 15-year-olds by socioeconomic status (SES), and whether this correlation differs by countries’ level of development. We construct a country-level panel using six waves of the Programme for International Student Assessment (PISA) from 69 countries in 322 country waves. We first estimate the gradient of SES and maths achievement as a measure of achievement inequality at the country level and take the country mean of the relevant covariates including school autonomy. Results from weighted mixed-effects models suggest that the association between all autonomy variables and inequality in achievement is not significant. However, academic autonomy is linked to increasing achievement inequality in high- and upper-middle-income countries compared with low- and lower-middle-income countries. But the coefficients for budget and personnel autonomy do not differ by the development level. The results remain similar in several specification tests including country and year fixed effects, which leads us to suggest not to simplistically apply autonomy reforms regardless of context.
1. Introduction
Do decentralised and self-governing schooling systems close the learning achievement gaps between advantaged and disadvantaged children? This question has been consistently at the centre of education policymaking processes worldwide to understand which educational systems help equalise learning inequalities. Decentralised or autonomous educational systems share more responsibilities with local government and schools, especially at the pre-tertiary levels (Barrera-Osorio, Fasih, & Patrinos Citation2009; McGinn & Welsh, Citation1999). Greater school autonomy may mean educational policies and responsibilities do not maintain uniformity across schools in a country. Hence, this phenomenon is also familiar as decreasing ‘standardization’ or de-standardisation of educational systems in the sociological literature (Allmendinger, Citation1989). While decentralised practices can take place both at the subnational and school levels, in this study, we solely focus on the latter. We term this as school autonomy, which means more decision-making power for schools regarding curriculum and other academic issues, hiring and firing teachers, and allocation of resources (Hanushek, Link, & Woessmann, Citation2013).
Advocates for this management paradigm argue that autonomy in the local administration and schools ensures the efficient use of resources by increasing the participation of stakeholders and mutual accountability (Barrera-Osorio et al., Citation2009). However, autonomy has been severely criticised for its limited focus on social inequality and a strong emphasis on ‘efficiency’, which may overlook the interests of the marginalised population (Vermeulen, Citation2018). Critics argue that autonomous educational systems create differentiated opportunities as opposed to more ‘standardised’ systems where everyone has access to a uniform schooling system. De-standardised schooling systems, resulting from school autonomy, would make it hard for low-income and less-educated parents to navigate the complexities and understand which system would suit their children best. Conversely, by having appropriate informational capital and resources, higher SES parents are more likely to benefit from an autonomous governance scheme (Park, Citation2008).
While a global issue, past research has mostly focused on high-income countries (HICs) when evaluating the inequality effect of school autonomy or decreasing standardisation. Findings on this linkage, nonetheless, remain inconclusive (for example, Bukodi et al., Citation2018). The literature investigating the effect of school autonomy in low- and middle-income countries (LMICs) mostly focuses on overall learning outcomes (for example, Elacqua, Munevar, Sanchez, & Santos, Citation2021; Hanushek et al., Citation2013), less so on how different SES groups are affected differently. An investigation of the heterogeneous effect of decentralised or autonomous systems by development level is, thus, important.
This is also pressing given that LMICs have experienced an influx of education reforms to devolve the educational systems during the last few decades (Hossain, Citation2022; Weiler, Citation1990). Development partners have increasingly pushed for more autonomous school governance around the world, for instance, from Bolivia and Colombia in Latin America (Faguet & Sanchez, Citation2008) to Indonesia in Southeast Asia (Kristiansen, Citation2006). These reforms have typically emphasised strengthening school management committees through parent and community participation to make school decisions (for example, regarding curriculum, budget, teacher recruitment, and training) more autonomously and local needs-driven (Fiske, Citation1996; Gershberg & Winkler, Citation2004; Sayed, Citation2002). This is also known as policy borrowing from the Global North to the South (Steiner-Khamsi, Citation2012), which may take place by providing financial assistance conditional on implementing institutional reforms (Steiner‐Khamsi, Citation2006). This form of ‘compulsion’ is unlikely to be observed in education policy diffusion between HICs. For instance, the Organisation for Economic Co-operation and Development (OECD) promotes greater school autonomy in its member countries (Beatriz, Deborah, & Hunter, Citation2008), but it is not attached to any instruments like conditional aid.
Addressing the lack of research in LMICs, we aim to examine two questions in this paper. First, to what extent is school autonomy associated with widening or closing the learning achievement gap by SES? Second, does this association, if any, differ by countries’ level of development? We specifically focus on the lower-secondary level as in many countries, this is a critical point for students to choose their academic track. We use a classic measure of educational inequality, defined by the relationship between family SES and the learning achievement of children (the SES gradient on achievement), which is used in existing studies (Chmielewski, Citation2019; Gruijters & Behrman, Citation2020; Van de Werfhorst & Mijs, Citation2010). We use six waves of Program for International Student Assessment (PISA) data from 2000 until 2015 combining 69 HICs and LMICs. Since PISA data is cross-sectional at the student level, we create a country-level panel dataset containing countries and territories that participated in at least two PISA waves.
2. Research puzzle
2.1. School autonomy and learning inequality
To capture holistic policy areas in a school, we define school autonomy by three key elements – the autonomy of a school in (1) determining academic courses and selecting textbooks, (2) making budget decisions, and (3) managing personnel. Hanushek et al. (Citation2013) and van Hek, Buchmann, and Kraaykamp (Citation2019) also employ these school autonomy indicators although their focus was not primarily to explore learning inequality by SES.
Existing research exploring the linkage between autonomy in educational systems and inequality in outcomes has mostly focused on HICs. Past research suggests that standardised educational systems, as opposed to de-standardised or autonomous systems, tend to generate more equitable learning outcomes by implementing uniform policies and providing homogeneous educational services to all schools (Van de Werfhorst & Mijs, Citation2010). Bodovski, Byun, Chykina, and Chung (Citation2017) observe that having government-prescribed textbooks in schools (indicating lower school autonomy) is associated with decreasing achievement gaps. Similarly, Gamoran (Citation1996) also finds that greater standardisation in the national curriculum is associated with more equal learning outcomes. However, research also finds null (Montt, Citation2011) or mixed results, that is, higher standardisation (less autonomy) either has no connection or leads to a reduction in inequality in attainment (Bukodi et al., Citation2018).
2.2. Why focus on the development level?
There are several reasons to assume that the association between school autonomy and learning inequality may differ across LMICs and HICs. First, school autonomy in the developing world in recent decades has been a borrowed phenomenon, exported from the Global North (Steiner-Khamsi, Citation2012). Decreasing standardisation has gained prominence in the education sector of LMICs during the post-Washington Consensus era by development banks and donors throughout the 1990s and onward. School autonomy reforms have been quite similar around the world emphasising the ‘importance’ of autonomous governance to mobilise local resources and reduce dependence on the government (Hossain, Citation2021). For instance, the name ‘school-based management’ can be found across the globe with similar structures and guidelines (Barrera-Osorio et al., Citation2009).
School autonomy has also been promoted in HICs by the OECD (Beatriz et al., Citation2008). Nonetheless, the effectiveness of these remains debateable while the effects of some of these policy features remain inconclusive in HICs as we discussed. More importantly, since these reforms were exported from institutions in HICs, they may not fit the context of LMICs. Past research suggests that greater school autonomy to serve marginalised people may bring negative consequences. An embedded culture of informal governance in institutions of many LMICs may strengthen the ‘patron-client’ relationship between local politicians, teachers, and school administration. This may lead to keeping parents aloof from making any school decisions (Nishimura, Citation2017), resulting in more irregularities such as the recruitment of teachers by favouritism. For instance, Joshi (Citation2014) finds that parents prefer sending their children to private schools in Nepal as excessive political interference in the school management committee (as a result of more autonomy) and negligence of teachers impede the learning environment in public schools. Essuman and Akyeampong (Citation2011) argue that local political actors in Ghana influence school decisions due to more autonomy keeping little or no room for community participation.
Second, proponents argue that devolving educational responsibilities would empower marginalised parents, which would then result in less learning inequality. This mechanism implicitly assumes that people from all walks of life will be empowered by having a voice and decision-making power ‘who know more about the local education systems than do central policy makers’ (Barrera-Osorio et al., Citation2009, p. 2). This mechanism disregards the socioeconomic background of individuals that may hinder the empowerment process. Evidence is, however, scarce supporting or opposing this second point.
2.3. Hypotheses
Aligning with previous studies (for example, Allmendinger, Citation1989; Park, Citation2008), we expect that autonomy in educational systems would be associated with increases in achievement gaps (Hypothesis 1). We assume that all three elements of autonomy would have a similar direction of association with the inequality in achievement.
Hypothesis 1: Increasing school autonomy in academic, budget and personnel management decisions is associated with widening the achievement gap by SES.
To elaborate, higher academic autonomy means schools have the freedom to choose different curricula and textbooks. By having better informational and knowledge capital, higher-SES parents would be able to identify schools that have better teaching methods and innovative curricula. They would also have more economic resources to send their children to better-quality schools (Park, Citation2008).
Moreover, granting greater autonomy, especially in budgetary responsibilities, is likely to result in disparities in resource mobilisation among schools. This means schools in affluent neighbourhoods may attract more resources by collecting taxes, fees, and donations, potentially leading to widening achievement gaps. This issue is particularly pronounced in LMICs, where significant disparities in resources between schools are already evident (Gruijters & Behrman, Citation2020).
Likewise, more autonomy regarding personnel management issues such as teacher recruitment and determining their salary may have an influence on teaching methods and therefore learning outcomes of children. When schools control the personnel management aspect, the quality of teachers may likely vary depending on the capacity of school leadership and how rich schools are (Gingrich & Ansell, Citation2014). This eventually may lead to widening learning inequality by SES.
However, we also expect that the coefficient for academic autonomy will likely be greater than that of budget and personnel autonomy (Hypothesis 1a). Academic autonomy involves decisions about textbooks, curricula, and course content that are more directly related to the learning of children. An existing body of literature finds that a more standardised academic curriculum is associated with closing the SES achievement gap (for example, Chmielewski & Reardon, Citation2016; Gamoran, Citation1996). In other words, academic autonomy has been consistently found to be associated with widening learning inequality. For budget and financial aspects, such evidence is limited. Bukodi et al. (Citation2018) use budget decisions as one of the standardisation measures in their study but find that its effect is mixed or not conclusive. Besides, when using personnel management as a measure of school autonomy, Hanushek et al. (Citation2013) do not observe any effect of this factor on overall learning achievement across countries.
For question 2, enquiring whether the inequality effect of school autonomy differs by the development level of countries, our hypothesis is the following:
Hypothesis 2: While increasing school autonomy may likely lead to greater inequality in learning achievement among countries, it may be more pronounced in high- and upper-middle-income countries than in the low- and lower-middle-income groups.
3. Analytical approach
3.1. Data
We construct a country-level panel dataset on 69 countries/territories from six waves of PISA- 2000, 2003, 2006, 2009, 2012, and 2015- involving 2,180,440 students.Footnote1 PISA measures the ability of 15-year-old pupils in maths, reading, and science across OECD member and non-member countries every three years. Fifteen-year-olds are roughly at the lower-secondary level, which is the focus of this study.
PISA data is cross-sectional, that is, in every cycle, a different cohort from different schools participates in the assessment. We aggregate data to construct a country-level panel. The number of PISA-participating countries ranged from 43 in 2000 to 72 in 2015 (OECD, n.d.). We include countries that took part in at least two assessment waves making the final country-wave observations 322 (see the bottom of Table S1 in the Supplementary Material). We exclude PISA 2018 as it does not have the school autonomy measures used in this study. We calculate achievement gaps for each country from each year and aggregate all other variables by country mean.
Using PISA data gives the advantage of including countries from various income ranges. While it predominantly includes HICs, PISA also surveys LMICs. In our study, 33 countries are identified as high-income, 16 as upper-middle-income, 15 as lower-middle-income, and 5 as low-income, according to the categorisation of the World Bank in 2000 (the rationale for the choice of the year is described in the variable section). The selection of countries with a wide regional diversity gives the advantage of examining the linkage between school autonomy and inequality, which has not been investigated at this scale.
3.2. Variables
3.2.1. Maths achievement
To measure the inequality in achievement, we use achievement in mathematics as it is viewed to be more comparable across countries (Hanushek et al., Citation2013). Each subject area in PISA, including reading and science, is tested using a wide range of tasks with different difficulty levels to capture students’ abilities in a comprehensive way. The maths achievement is scaled to have a mean of 500 test-score points and a standard deviation of 100 points across the OECD countries.Footnote2
3.2.2. SES percentile position
In each wave, PISA has an index of the economic, social, and cultural status (ESCS) of parents. We use this to signify the family SES of students. The variable is a composite score of (1) the highest parental occupation (ISEI), (2) the highest education of either of the parents, and (3) home possessions including books at home (see Table S2 in the Supplementary Material for the third item’s description), estimated by using principal component analysis (PCA). PCA is frequently used to reduce the dimensionality of datasets and increase the interpretability of the measure while minimising information loss (Jolliffe & Cadima, Citation2016). As mentioned, this index has been used in the existing literature as a proxy for family SES (for example, Gruijters & Behrman, Citation2020).
The SES measure may arguably not be comparable across countries as someone’s SES position with a certain level in one country may be different for others in another country. For instance, an SES value may situate a pupil at the 90th percentile while the same value may situate other students in a different country at the 80th percentile. To address the issue of comparability across countries and study waves, we convert the SES variable into percentile ranking through which each student is assigned an SES percentile. We assume that family SES is a positional good rather than an absolute one (Chmielewski, Citation2019).Footnote3 Converting the index into percentile is particularly important in this study as it involves countries from different income levels; the composition of students by SES level is also likely to vary across countries. The mean SES percentile position is around 0.5 (as the pupils in each country are evenly assigned with percentile positions) (Table S1 in the Supplementary Material).
3.2.3. Development level
The initial development level of countries is the only time-invariant country-level variable. All other variables are at the country-wave level. Among 69 countries, 20 countries were categorised as (1) lower- or lower-middle-income, 16 as (2) upper-middle-income, and 33 as (3) high-income countries as of 2000 (Table S3 in the Supplementary Material). This is according to World Bank (Citationn.d.) categorisation at the outset of the PISA test in 2000.Footnote4
The development level, instead of the measure of Gross Domestic Product (GDP) per capita, is utilised for the following reasons. As we argue, many LMICs have received reforms to provide schools with more autonomy. Receiving these reforms by international organisations (IOs) through aid depends on countries’ development level, that is, whether they have surpassed certain income thresholds, not the continuum of their GDP per capita (see World Bank, Citationn.d.). Hence, the development level is theoretically more suitable. But we run robustness checks to see whether controlling for GDP per capita’s within-country variation changes the effect of the development level. Nonetheless, we do not account for how much aid LMICs have received since this will limit analysis to only aid receiving LMICs.
Additionally, we keep the development level variable time-invariant (from 2000) for two reasons. First, this is to align with the theoretical assumption that school autonomy-related reforms started increasingly taking place in LMICs in the late 1990s and continuing in the early 2000s (Ball & Youdell, Citation2009). Second, there have been limited changes in countries’ development levels if we compare the status of 2000 with that of 2015. As shown in Table S3 in the Supplementary Material, 47 countries, out of 69, remained at the same development level one and a half decades apart. Most of the remaining countries have moved just one level, from the low/lower-middle to the upper-middle or the upper-middle to the high-income group. As said, to capture this change, we account for the GDP per capita as part of robustness checks. Additionally, the year fixed effects would further capture some unobserved time-related factors.
3.2.4. School autonomy
We use four continuous variables for school autonomy, broadly divided into three categories: academic autonomy, budget autonomy, and personnel autonomy. (1) Academic autonomy is measured by three indicators – autonomy in deciding (a) course content, (b) courses offered, and (c) textbook materials. (2) Budget autonomy is measured by autonomy in (a) formulating and (b) allocating the budget. Finally, to measure personnel autonomy, we use two variables: autonomy in (3) hiring teachers, and (4) determining teachers’ (a) starting salaries, and (b) salary increase. The questionnaire asks school principal(s) who is/are responsible for performing the academic, budget, and personnel responsibilities to choose from among five stakeholders (a) Principal; (b) Teachers; (c) School governing board; (d) Regional or local education authority; and (e) National educational authority (Table S4 in the Supplementary Material). We code schools as autonomous when principals answer options a, b and/or c as principals, teachers and the school governing board are school stakeholders. When one or more of these three actors is/are responsible for these designated tasks, a school is coded 1, otherwise 0. Thus, 1 indicates a school is fully autonomous to perform a responsibility. A limitation of this approach is that we could not include schools where autonomy may be partly shared with the local or central government. Despite this, we make an important contribution by examining how changes in autonomy are associated with changes in achievement inequality, which remains understudied due to a lack of longitudinal data.
To aggregate variables at the country level, we follow two steps. First, we estimate the country-year mean of each of the eight indicators under four autonomy variables, weighted by PISA student weights. Second, since the indicators under each autonomy category are consistently highly correlated in most of the PISA wavesFootnote5 (see Table S5 in the Supplementary Material), we combine them by taking the arithmetic mean. Autonomy in selecting course content, textbooks and courses offered are highly correlated to each other (r = 0.7 or higher) and, thus, combined into one variable. The scale of the resulting variables is a proportion ranging from 0 to 1. Similarly, budget formulation and allocation are highly correlated (r = 0.64) and, thus, we combine them by taking the arithmetic mean. However, we estimate two separate variables for personnel autonomy as although determining teachers’ salary and salary increase are highly correlated (r = 0.91), hiring autonomy is less so, as demonstrated in Table S5 in the Supplementary Material. Thus, hiring and salary autonomy are kept separate.
Figures S1 and S2 in the Supplementary Material suggest that school autonomy scores vary across countries regardless of their development levels. On average, schools have more autonomy over the budget formulation and allocation and less so over salary autonomy while hiring teachers and academic autonomy being in the middle.
LMICs do not show much of a sharp decline in autonomy. These countries do not have schools with zero autonomy compared to some high-income countries such as Germany, Greece and Hong Kong in recent years and Singapore in all reported years. This could be because LMICs have received many decentralisation initiatives in the education sector during the past few decades aided by donors/IOs (for example, Bandur, Citation2012).
3.2.5. Proportion in private schooling
Data on the proportion of students enrolled in private schools come from PISA, which accounts for private schools’ propensity to have more autonomy as they are independently run. Data on the proportion of private school students are not available for some countries in some waves. We use aggregated data from the UNESCO Institute for Statistics (UIS) for the missing cases (UIS, n.d.). To ensure that the results are not driven by the sources of private schooling data, we use a dummy in the analysis indicating whether data come from PISA or UIS. We find aggregated measures from PISA and UIS consistent.
3.2.6. Pupil-teacher ratio
The country average of the pupil-to-teacher ratio (PTR) in school data comes from PISA, which is a continuous variable. A lower PTR may facilitate running the school more autonomously as teachers will have more time to interact with parents. Similar to the private school variable, when PISA waves do not have this variable, we use the aggregated measure from UIS and indicate this with a dummy in the analytical models.
3.2.7. Gini coefficients
To account for country income inequality in the analysis, we use Gini coefficients data primarily from the World Bank, but also from the World Income Inequality Database (WIID) when data is unavailable (UNU, n.d.).Footnote6 This time-varying continuous variable ranges from 0 to 1 where 0 means no inequality and 1 indicates absolute inequality.
3.2.8. Rural school ratio
The rural school ratio variable is continuous and taken from UIS and also OECD for very few cases when data is missing in UIS. Similar to the above two variables, we adjust for the differences in sources using a dummy indicator. This variable intends to account for achievement inequality triggered by school location.
3.3. Methods
3.3.1. Estimating inequality in learning achievement
The outcome variable in this study is the inequality in maths achievement by SES at the country level. To address the issue of comparability across countries and study waves, we convert students’ family SES into percentile, as explained in the variable section. We measure achievement inequality by EquationEquation (1)(1)
(1) ,
(1)
(1)
which estimates the relationship between the SES percentile position C and maths achievement A of students i. δ is the coefficient on SES position and εi is an error term. The gradient δ becomes the dependent variable at the second stage of panel analysis in EquationEquation (2)
(2)
(2) . We run this regression on each country and PISA wave separately.
As PISA data has multiple plausible values for achievement scores created by multiple imputations, we incorporate these in the regressions, weighted by student and school survey weights using the ‘repest’ command in Stata (Avvisati & Keslair, Citation2020). The trend in inequality in achievement is presented in the findings section. After calculating the achievement inequality gradients for each country and year, we build a panel dataset by combining the country-year mean of all other covariates.
3.3.2. Regression models
We employ mixed-effects regression models on unbalanced panel data of 322 country-waves at level 1 nested within 69 countries at level 2. To account for standard errors of the gradients from EquationEquation (1)(1)
(1) , we run the regression analysis weighted by the estimated inverse squared standard error of the gradient, similar to the weighted least squares (WLS) method. Using mixed models allows for examining heterogeneity across countries in the association between autonomy and achievement inequality, and the extent to which this cross-national heterogeneity can be explained by the time-constant development level.
(2)
(2)
As shown in EquationEquation (2)(2)
(2) ,
is the true achievement gap in maths by SES estimated employing EquationEquation (1)
(1)
(1) in year y (level 1) and country c (level 2). γ is an intercept, λ is a vector of coefficients on four variables of autonomy Tyc, and θ is the coefficient on countries’ development level Dc. ψ is the vector of coefficients on the cross-level interaction between the development level Dc and four autonomy variables Tyc. The interaction term examines whether the autonomy coefficients differ by the level of development. Without the interaction, the equation will answer research question (RQ) 1. α is a vector of coefficients on control variables Lyc for level 1 and μ is year fixed effects to account for any secular trends in achievement gaps across waves. uc is the country-level random intercept and eyc is a level 1 time-varying error. Before running this final model, we add variables step by step. All time-varying country covariates are mean-centred within countries. Hence, the coefficients for these time-varying covariates indicate the relationship between changes in autonomy and changes in achievement gaps within countries over time after accounting for secular trends.
4. Findings
4.1. Inequality in achievement
We first present the inequality in achievement trend over time across countries estimated by EquationEquation (1)(1)
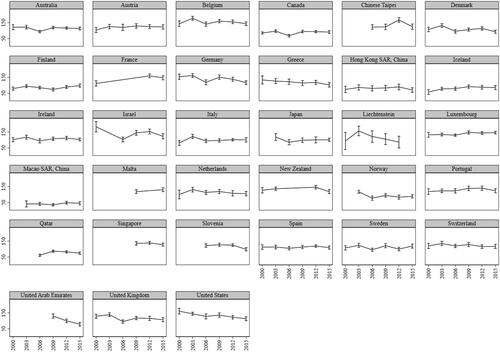
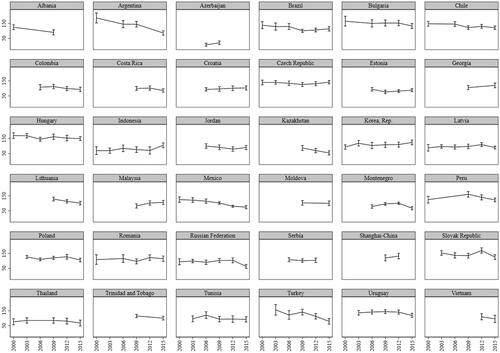
(1) . We find the gradients statistically significant for all country-years (p < .05). represents initially HICs and shows initially LMICs. Both figures suggest that the trend in maths achievement inequality differs across countries. But in most cases, the trend remains steady over time. Additionally, the achievement gap is overall higher in upper-middle and high-income countries compared to lower-income countries (Table S1 in the Supplementary Material).
Figure 1. Maths achievement inequality by SES in initially (A) high-income countries and (B) low- and middle-income countries.
Notes: The gradient of SES and maths achievement (on the y-axis) is estimated by EquationEquation (1)(1)
(1) . The figure includes 95 per cent confidence intervals.
Source: Author’s calculations based on PISA data.
4.2. RQ 1: the association between school autonomy and achievement inequality
The country-pooled regression models in demonstrate that the association between all school autonomy variables and inequality in achievement is not significant (p > .05). We also do not observe noticeable changes in the variance in achievement inequality between and within countries in all these models as shown in parameters Σu and Σe, respectively, in .
Table 1. The relationship between school autonomy and the inequality in maths achievement
The results in do not correspond to our initial hypothesis (H1) that there might be an association between school autonomy and an increase in the achievement gap in mathematics by students’ SES.
4.3. RQ 2: does development level matter?
To answer RQ 2, we estimate the interaction between the four measures of school autonomy and the development level using EquationEquation (2)(2)
(2) . demonstrates that only the coefficient for academic autonomy significantly differs by the level of development. Model 8 in the table suggests that when all four autonomy areas are added to the model, only the association between academic autonomy and achievement gap significantly differs by the countries’ development level. Specifically, the slopes for high-income (109.5, p < .001) and upper-middle-income countries (70.6, p < .01) are significantly steeper than that of lower-middle and low-income countries. The coefficient for upper-middle countries is larger than that of HICs.
Table 2. Interaction effect of school autonomy and initial development level on the inequality in maths achievement
However, the coefficients for budget and personnel (salary and hiring) autonomy do not significantly differ by the development level. These results remain similar in a number of alternative specifications including unweighted mixed effects, the inclusion of alternative controls, and fixed and random effects models. We explain these in the ‘Robustness’ section and Table S6 in the Supplementary Material. Additionally, as explained in the variable section (development level), we control for time-varying GDP per capita to examine whether accounting for it changes the coefficients for the time-constant development level. The results, however, remain largely unaffected (Table S7 in the Supplementary Material).
The academic autonomy slope varying by the development level is partially in line with our initial expectation (Hypothesis 2) that the effect of this autonomy would be higher for HICs. Although the HICs slope is higher than that of lower-income countries, the slope for upper-middle-income countries is the steepest as illustrated in (using model 8 in ). The slope for the lower-income countries is downward while the other two are upward. One limitation in this analysis is that we could not further disaggregate the low- and lower-income groups as the former has only five countries in our sample. In sum, in the high- and upper-middle-income groups, academic autonomy in schools is associated with a greater increase in inequality in achievement compared to the lower-income countries.
Figure 2. The interaction effect of academic autonomy and initial development level on the inequality in maths achievement.
Notes: (a) The interaction between academic autonomy and development level is estimated by EquationEquation (2)(2)
(2) or based on model 8. (b) Academic autonomy and other time-varying variables are group mean-centred with a mean of 0. Hence, the vertical solid line on 0 is the mean, its left side refers to decreases and the right side indicates increases in academic autonomy in the proportion of schools. (c) Country N = 69 and country-wave N = 322.
Source: Author’s calculations based on PISA data.
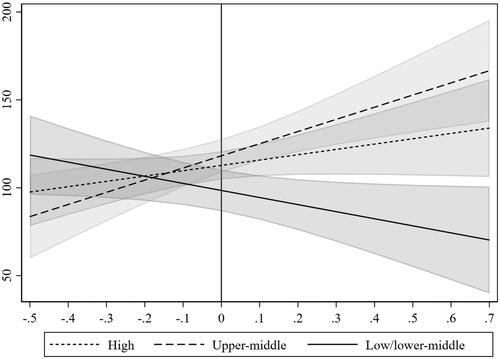
Additionally, when we check model 8 in , the interaction term explains around 10 per cent of the between-country variance in the inequality in achievement compared to the non-interaction model (4) in . This also suggests the significance of countries’ development level and its interaction with autonomy to explain the inequality in achievement.
Although these findings only hold true for academic autonomy, it partially corresponds to our Hypothesis 1a that academic autonomy would matter more for achievement inequality as it is related to the core of the learning processes compared to other autonomy areas. This conforms to the evidence from past research that maintaining greater standards in academic aspects such as curriculum and assessment methods are associated with decreases in learning inequality (for example, Chmielewski & Reardon, Citation2016; Van de Werfhorst & Mijs, Citation2010). By contrast, budget and personnel management aspects may not hold similar significance to addressing disadvantages in learning processes. Related to this, earlier research does not find a strong effect of standardisation of educational systems (less autonomy) on achievement inequality when budget autonomy is considered as an indicator (Bukodi et al., Citation2018). Personnel autonomy is not found associated with overall learning achievement (Hanushek et al., Citation2013).
5. Discussion and conclusion
We find a null association between school autonomy variables and inequality in maths achievement in pooled analyses. However, the association differs by the countries’ development level only for academic autonomy, the slope for upper-middle-income countries being the steepest and statistically significant followed by that of HICs compared to lower-income countries. Our results align with findings from previous studies (for example, Gamoran, Citation1996; Van de Werfhorst & Mijs, Citation2010) that school autonomy in deciding academic course content, and selecting courses and textbooks is associated with widening the achievement gap by SES. We observe the null association of school autonomy in formulating and allocating the budget and in personnel management, as well as their interaction with the development level, although these two elements often get highlighted in decentralisation and autonomy reforms in development projects (Torche, Citation2005). Regarding academic autonomy, we assume that this could be because academic aspects play a more influential role in deciding how the learning environment should be and how teachers can design courses and deliver teaching. In a more autonomous system, the standards of teaching quality and curriculum would widely vary across schools, which may induce greater inequality (Van de Werfhorst & Mijs, Citation2010).
Nevertheless, our measure of budget autonomy is limited in the study. Budget autonomy is defined in the PISA questionnaire by whether schools have the capacity to formulate and allocate budgets. But we do not know whether the financing of the budget comes from the central or local government. To address this limitation, we estimate models by alternative measures of budget autonomy as explained in the ‘Robustness’ section in the Supplementary Material. The results, however, remain unchanged or null (see Table S8 in the Supplementary Material).
As discussed, academic autonomy is associated with a higher level of achievement inequality in upper-middle-income countries, compared to other income groups. This is a notable point as many of these upper-middle-income countries are the first to experience an influx of decentralisation reforms by development actors, for instance, Argentina, Brazil, Chile, and Mexico in Latin America. Evidence suggests that educational decentralisation and autonomy-related reforms may have widened the achievement gaps in the region (for example, Galiani, Gertler, & Schargrodsky, Citation2008; Prawda, Citation1993).
Opposite to the claims often made by IOs in support of school autonomy in LMICs, we find limited evidence of its association with minimising learning inequality. These results raise the question of whether school autonomy reforms in both LMICs and HICs should be encouraged irrespective of context. Policy practitioners and advocates for decentralisation and autonomy should carefully evaluate educational management reforms.
IOs such as the World Bank have implemented school autonomy reforms across LMICs over the past four decades involving a considerable amount of resources (Hossain, Citation2022). While its goal is to improve overall learning achievement and decrease disparities, our paper suggests contrasting results for the upper-middle-income group in academic autonomy. Despite school autonomy reforms being primarily exported from the Global North, it does not seem to yield positive outcomes in those countries (HICs) either. The validity of these reforms to implement in LMICs by IOs, thus, remains questionable. We argue that equitable resource distribution across schools should require primary attention from policymakers as research shows that disparities in school quality explains considerable achievement inequality between advantaged and disadvantaged pupils in many LMICs (for example, Gruijters & Behrman, Citation2020).
In addition to this, more attention should be given to contextual aspects when considering autonomy reforms. It may work in some contexts, but not in others. Currently, we have a limited understanding of those micro-mechanisms, which requires evidence with finer context-specific data. Indeed, school autonomy and decentralisation reforms are often prescribed to LMICs based on theory rather than sufficient evidence, let alone the consideration of the context.
6.1. Limitations
We highlight some major limitations in the paper. First, while our results remain unaffected or robust to several specification tests, the findings cannot be considered causal. There can still be endogeneity bias in predicting inequality in achievement by autonomy. Future research can address this issue by using causal designs with new data. Second, we could not take into account all context-specific variables. Different socio-cultural settings may induce school autonomy differently, which may also shape parents’ attitudes towards participating in decision-making processes. Since we have limited country-year observations, we could not incorporate many variables which would otherwise overfit the models. We, however, run models using country and year fixed effects as robustness checks to account for the time-varying and invariant factors, which gives us quite similar results as discussed. Third, we use three major aspects of school autonomy. But one can argue that they are not comprehensive enough. There might be other aspects of school autonomy such as implementing school development plans, school inspection and supervision, which may also affect inequality in achievement. Fourth, our study is limited to analysing country-level autonomy and learning inequality. This is partly due to the scarcity of individual-level comparative longitudinal data. Since our main objective was to examine the changes in school autonomy and inequality, we required a panel dataset, which we could achieve by aggregating measures at the country level. By doing so, we could not further estimate the variance in achievement between and within schools. We will focus on this aspect in future endeavours by analysing a country case as there are some longitudinal datasets in some LMICs, such as in Indonesia. Fifth, as mentioned in the variable section, our school autonomy measures do not include whether autonomy is shared between schools and local governments or the central government, which we aim to address in the future. Sixth, hiring autonomy in PISA means a school can select teachers for hiring and the measure in our study signifies full school autonomy for hiring. Despite this, it is not clear if schools’ ability to hire could be limited because of the mandatory involvement of local or central government officials in the hiring committee, for instance, for monitoring purposes.
Supplemental Material
Download PDF (543 KB)Acknowledgements
I thank Anna Katyn Chmielewski, Dirk Witteveen, Tobias Rüttenauer, Sheena Bell, Hanbo Wu, Élise Rouméas and Jiaqi Liu for their valuable comments and suggestions. I also thank the participants in RC28 Spring Meeting 2021 and the Research Sharing Group Seminar at the Department of Social Policy and Intervention, University of Oxford, for their helpful feedback.
Disclosure statement
No potential conflict of interest was reported by the author.
Data availability statement
PISA data can be freely accessed from https://www.oecd.org/pisa/data/. The do-files will be available upon request.
Correction Statement
This article has been corrected with minor changes. These changes have no effect on the academic content of the article.
Notes
1 Some variables have missing observations for both student and school-level variables but less than 10 per cent. We exclude all the missing values in the paper. Since the proportion of missing cases is small it is not likely to bias the results as also argued by Sun, Bradley, and Akers (Citation2012) when using PISA data. A similar approach is observed in van Hek et al. (Citation2019) with PISA data.
2 Since we combine data from six PISA waves, a few non-OECD countries moved to the OECD in the later waves, which may have affected the overall standard deviation in the high-income group as presented in Table S1 in the Supplementary Material.
3 We do not use the rescaled indices of ESCS provided by OECD along with PISA 2015 for comparable trend analysis as doing so leads to losing a significant number of observations, especially for earlier waves. Besides, it does not address the comparability issue regarding the SES position across countries.
4 In 2000, the World Bank classified countries with GDP per capita lower than 755$USD in the low-income group, between 756 and 2995$USD in the lower-middle-income group, and between 2996 and 9265$USD and higher than 9265$USD in the upper-middle- and high-income groups, respectively (World Bank, Citationn.d.). All these low and lower-middle-income countries were on the Development Assistance Committee (DAC) list and therefore eligible to receive Official Development Assistance (ODA) or Official Aid in 2000 (OECD, Citation2000).
5 The correlation matrix for all autonomy indicators and aggregated measures was checked for each year and is available upon request.
6 World Bank and WIID data on the Gini coefficient are not perfectly comparable. However, as we are interested in comparing time-varying independent variables over time within countries, we use one source for each country. Thus, the validity of the results depends on that each unit change in the Gini coefficient is approximately equivalent, but the level of each measure is not fully comparable. We would like to also note that the Gini coefficient measure is not available for Liechtenstein from either of the two sources. Hence, we use national sources for the country where available.
References
- Allmendinger, J. (1989). Educational systems and labor market outcomes. European Sociological Review, 5(3), 231–250. doi:10.1093/oxfordjournals.esr.a036524
- Avvisati, F., & Keslair, F. (2020). REPEST: Stata module to run estimations with weighted replicate samples and plausible values [Statistical Software Components S457918]. Chestnut Hill, MA: Boston College Department of Economics.
- Ball, S. J., & Youdell, D. (2009). Hidden privatisation in public education. Brussels: Education International.
- Bandur, A. (2012). School-based management developments and partnership: Evidence from Indonesia. International Journal of Educational Development, 32(2), 316–328. doi:10.1016/j.ijedudev.2011.05.007
- Barrera-Osorio, F., Fasih, T., & Patrinos, H. A. (2009). Decentralized decision-making in schools: The theory and evidence on school-based management. Washington, DC: World Bank.
- Beatriz, P., Deborah, N., & Hunter, M. (2008). Improving school leadership, volume 1 policy and practice: Policy and practice (Vol. 1). Paris: OECD Publishing.
- Bodovski, K., Byun, S-y., Chykina, V., & Chung, H. J. (2017). Searching for the golden model of education: Cross-national analysis of math achievement. Compare, 47(5), 722–741. doi:10.1080/03057925.2016.1274881
- Bukodi, E., Eibl, F., Buchholz, S., Marzadro, S., Minello, A., Wahler, S., … Schizzerotto, A. (2018). Linking the macro to the micro: A multidimensional approach to educational inequalities in four European countries. European Societies, 20(1), 26–64. doi:10.1080/14616696.2017.1329934
- Chmielewski, A. K. (2019). The global increase in the socioeconomic achievement gap, 1964 to 2015. American Sociological Review, 84(3), 517–544. doi:10.1177/0003122419847165
- Chmielewski, A. K., & Reardon, S. F. (2016). Patterns of cross-national variation in the association between income and academic achievement. AERA Open, 2(3), 233285841664959. 2332858416649593. doi:10.1177/2332858416649593
- Elacqua, G., Munevar, I., Sanchez, F., & Santos, H. (2021). The impact of decentralized decision-making on student outcomes and teacher quality: Evidence from Colombia. World Development, 141, 105378. doi:10.1016/j.worlddev.2020.105378
- Essuman, A., & Akyeampong, K. (2011). Decentralisation policy and practice in Ghana: The promise and reality of community participation in education in rural communities. Journal of Education Policy, 26(4), 513–527. doi:10.1080/02680939.2011.554999
- Faguet, J.-P., & Sanchez, F. (2008). Decentralization’s effects on educational outcomes in Bolivia and Colombia. World Development, 36(7), 1294–1316. doi:10.1016/j.worlddev.2007.06.021
- Fiske, E. B. (1996). Decentralization of education: Politics and consensus. Washington, DC: The World Bank.
- Galiani, S., Gertler, P., & Schargrodsky, E. (2008). School decentralization: Helping the good get better, but leaving the poor behind. Journal of Public Economics, 92(10-11), 2106–2120. doi:10.1016/j.jpubeco.2008.05.004
- Gamoran, A. (1996). Curriculum standardization and equality of opportunity in Scottish secondary education: 1984-90. Sociology of Education, 69(1), 1–21. doi:10.2307/2112720
- Gershberg, A. I., & Winkler, D. (2004). Education decentralization in Africa: A review of recent policy and practice. In B. Levy & S. Kpundeh (Eds.), Building State Capacity in Africa (pp. 323–356). Washington, DC: The World Bank.
- Gingrich, J., & Ansell, B. (2014). Sorting for schools: Housing, education and inequality. Socio-Economic Review, 12(2), 329–351. doi:10.1093/ser/mwu009
- Gruijters, R. J., & Behrman, J. A. (2020). Learning inequality in Francophone Africa: School quality and the educational achievement of rich and poor children. Sociology of Education, 93(3), 256–276. doi:10.1177/0038040720919379
- Hanushek, E. A., Link, S., & Woessmann, L. (2013). Does school autonomy make sense everywhere? Panel estimates from PISA. Journal of Development Economics, 104, 212–232. doi:10.1016/j.jdeveco.2012.08.002
- Hossain, M. (2021). Does greater community involvement mean more parent-teacher interaction? Evidence from seven developing countries. International Journal of Educational Development, 83, 102378. doi:10.1016/j.ijedudev.2021.102378
- Hossain, M. (2022). Diffusing “destandardization” reforms across educational systems in low- and middle-income countries: The case of the World Bank, 1965 to 2020. Sociology of Education, 95(4), 320–339. doi:10.1177/00380407221109209
- Jolliffe, I. T., & Cadima, J. (2016). Principal component analysis: A review and recent developments. Philosophical Transactions. Series A, Mathematical, Physical, and Engineering Sciences, 374(2065), 20150202. doi:10.1098/rsta.2015.0202
- Joshi, P. (2014). Parent decision-making when selecting schools: The case of Nepal. Prospects, 44(3), 411–428. doi:10.1007/s11125-014-9319-9
- Kristiansen, S. (2006). Decentralising education in Indonesia. International Journal of Educational Development, 26(5), 513–531. doi:10.1016/j.ijedudev.2005.12.003
- McGinn, N., & Welsh, T. (1999). Decentralization of education: Why, when, what and how? Paris: UNESCO, International Institute for Educational Planning.
- Montt, G. (2011). Cross-national differences in educational achievement inequality. Sociology of Education, 84(1), 49–68. doi:10.1177/0038040710392717
- Nishimura, M. (2017). Community participation in school management in developing countries. Oxford Research Encyclopedia of Education. doi:10.1093/acrefore/9780190264093.013.64
- Organisation for Economic Co-operation and Development. (2000). DAC list of aid recipients used for 2000 flows. Retrieved from http://www.oecd.org/development/financing-sustainable-development/development-finance-standards/historyofdaclistsofaidrecipientcountries.htm
- Organisation for Economic Co-operation and Development. (n.d.). PISA data. Retrieved from https://www.oecd.org/pisa/data/
- Park, H. (2008). The varied educational effects of parent-child communication: A comparative study of fourteen countries. Comparative Education Review, 52(2), 219–243. doi:10.1086/528763
- Prawda, J. (1993). Educational decentralization in Latin America: Lessons learned. International Journal of Educational Development, 13(3), 253–264. doi:10.1016/0738-0593(93)90033-V
- Sayed, Y. (2002). Democratising education in a decentralised system: South African policy and practice. Compare: A Journal of Comparative and International Education, 32(1), 35–46. doi:10.1080/03057920120116517
- Steiner‐Khamsi, G. (2006). The economics of policy borrowing and lending: A study of late adopters. Oxford Review of Education, 32(5), 665–678. doi:10.1080/03054980600976353
- Steiner-Khamsi, G. (2012). Understanding policy borrowing and lending: Building comparative policy studies. In G. Steiner-Khamsi & F. Waldow (Eds.), World yearbook of education 2012: Policy borrowing and lending in education (pp. 3–17). Oxford: Routledge.
- Sun, L., Bradley, K. D., & Akers, K. (2012). A multilevel modelling approach to investigating factors impacting science achievement for secondary school students: PISA Hong Kong sample. International Journal of Science Education, 34(14), 2107–2125. doi:10.1080/09500693.2012.708063
- Torche, F. (2005). Privatization reform and inequality of educational opportunity: The case of Chile. Sociology of Education, 78(4), 316–343. doi:10.1177/003804070507800403
- UNESCO Institute for Statistics. (n.d.). National monitoring. Retrieved from http://data.uis.unesco.org/
- UNU [United Nations University]. (n.d.). Database: World income inequality database - WIID. Retrieved from https://www.wider.unu.edu/database/wiid
- Van de Werfhorst, H. G., & Mijs, J. J. (2010). Achievement inequality and the institutional structure of educational systems: A comparative perspective. Annual Review of Sociology, 36(1), 407–428. doi:10.1146/annurev.soc.012809.102538
- van Hek, M., Buchmann, C., & Kraaykamp, G. (2019). Educational systems and gender differences in reading: A comparative multilevel analysis. European Sociological Review, 35(2), 169–186. doi:10.1093/esr/jcy054
- Vermeulen, W. (2018). Decentralised funding and inequality in education. In J. Kim & S. Dougherty (Eds.), Fiscal decentralisation and inclusive growth (pp. 99–126). Paris: OECD Publishing.
- Weiler, H. N. (1990). Comparative perspectives on educational decentralization: An exercise in contradiction? Educational Evaluation and Policy Analysis, 12(4), 433–448. doi:10.3102/01623737012004433
- World Bank (n.d.). World Bank country and lending groups. Retrieved from https://datahelpdesk.worldbank.org/knowledgebase/articles/906519-world-bank-country-and-lending-groups