?Mathematical formulae have been encoded as MathML and are displayed in this HTML version using MathJax in order to improve their display. Uncheck the box to turn MathJax off. This feature requires Javascript. Click on a formula to zoom.
Abstract
School enrolment has increased at an unprecedented scale in Sub-Saharan Africa but learning and the associated education efficiency have not. Given that resources are limited, the efficient use of inputs is of utmost importance for sustainable development. Hence, we investigate whether improvements in children’s nutrition can improve learning and hence efficiency. To assess this relationship, we employ average female height as our proxy for nutrition during childhood. For learning, we estimate numeracy and efficiency using a linearized version of the Whipple Index. Our data is at the subnational level focusing on the birth decades from 1950 to 1999. To deal with the endogeneity of nutrition, we use an instrumental variable approach. Our instrument is negative rainfall shocks during childhood which can adversely affect nutrition. We find that better nutrition increases education efficiency. Therefore, investments in nutrition can advance self-sustaining long-term growth based on human capital in Sub-Saharan Africa.
Keywords:
1. Introduction
Providing access to high-quality education to each child is of utmost importance to achieve sustainable development in the long run. While in the last decades, more children than ever have been enrolled in primary school in substantial parts of Sub-Saharan Africa, the region has not experienced the expected progress in learning outcomes (Angrist, Djankov, Goldberg, & Patrinos, Citation2021). The World Bank has even argued that Africa faces a severe ‘schooling crisis’ (Bashir, Lockheed, Ninan, & Tan, Citation2018). For sustainable growth the learning outcomes are essential, not the time spent in school (Hanushek & Woessmann, Citation2008). Therefore, policymakers and scholars have been searching for tools to increase education efficiency.
We contribute to this discussion by taking a long-term perspective. First, we evaluate how numerical skills and schooling efficiency have evolved at the sub-national level between 1950 to 1999. Second, we investigate the underlying mechanisms focusing on nutritional quality because previous research found that lower nutrition substantially reduces the ability to learn (Bryan et al., Citation2004; Currie & Vogl, Citation2013; Paxson & Schady, Citation2007). Following this evidence both international organizations and governments have invested in school-feeding programs, which provide children with meals at school, to not only improve nutrition in general but also learning. Hence, we estimate the impact of children’s nutrition and health on schooling efficiency, measured as the ratio between acquired numeracy (output) and years of schooling (input). We employ average female height as our main explanatory variable.
Stature is an indicator of the quality of nutrition during childhood (Baten & Blum, Citation2014). While height is highly dependent on genetic factors at the individual level, averaging across individuals within a given group can specify whether they suffered from malnutrition during childhood. However, we must confine our averages to female height because of constraints in the available data. Nevertheless, we can use this to estimate the effect of childhood nutrition on schooling efficiency.
We use an instrumental variable approach (IV) using negative rainfall shocks as the IV for a causal interpretation. We chose this instrument due to its local variations and its importance in livelihoods as more than half of the population in Sub-Saharan Africa is employed in agriculture (World Bank, Citation2022) and little land is irrigated (Barrios, Bertinelli, & Strobl, Citation2010). Moreover, there are several mechanisms that can link rainfall shocks with adverse child health. First, insufficient rainfall can reduce food supply, agricultural income as well as breastmilk production (Banerjee, Duflo, Postel-Vinay, & Watts, Citation2010; Burlando, Citation2014; Hidalgo et al., Citation2010). Second, anticipation of a poor harvest induces maternal stress, harming foetal development (e.g. Aizer, Stroud, & Buka, Citation2016; Currie & Rossin-Slater, Citation2013; Lee, Citation2014). Lastly, insufficient rainfall is also linked to conflict, posing additional risks to child well-being (Hsiang, Burke, & Miguel, Citation2013). We carefully assess the instrumental variable (exclusion restriction and other issues) below.
For our outcome variable ‘schooling efficiency’, we estimate numeracy, because numerical skills are among the most relevant outputs of the schooling process (alongside with literacy). We follow the age-heaping methodology as less numerate people are more likely to misreport their age (A’Hearn, Baten, & Crayen, Citation2009).Footnote1 This is visible in censuses and other surveys, as an unusually large number of people mention, for example, ‘I am 40 years old’ when in reality they are 39 or 41. Societies in regions and periods in which many people are innumerate tend to be societies in which many persons do not know their exact age, or they cannot calculate it from existing documents. To quantify this phenomenon, we employ a linearized version of the Whipple Index, the ABCC Index. It compares the frequency of age statements with the terminal digits zero or five to a uniform distribution. We estimate this index for each birth decade from the 1950s to the 1990s per admin I subnational area in Sub-Saharan Africa.
This indicator has been characterized as a reliable proxy for numerical skills. For example, several contributions show the negative correlation of heaped ages with numerical tests (Baten, Benati, & Ferber, Citation2022; Baten & Nalle, Citation2022; Ferber & Baten, Citation2023). However, a certain degree of measurement error remains, as with any proxy indicator. The key advantages of this method are as follows: First, the data requirements are comparably low as only the respondent’s reported age is necessary (compared to a demanding math test); and second, the birth cohort method allows estimating of numerical abilities over long-time horizons and different geographical areas while remaining comparable.Footnote2
For the numeracy estimation, we combine reported age data from censuses, UNICEF’s Multiple Indicator Cluster Surveys and the Afrobarometer to achieve a large coverage of Sub-Saharan Africa. Thus, this study fills an important data gap about adult numeracy and provides the first comprehensive overview of basic numerical abilities at the subnational level in Sub-Saharan Africa for the birth decades from 1950 to 1990.
As a preview to our findings, we observe that children’s nutrition proxied by height is a strong predictor of the efficiency of the education system. The finding is robust across several specifications. This might also explain the stagnation of schooling efficiency, as height has stagnated over this period and declined in several countries of Sub-Saharan Africa (Baten & Blum, Citation2014). From the 1960s to the 1980s, African heights fell modestly from the range of 169.7–169.9 cm to the one of 169.1–169.0 cm, while all other world regions increased in height.Footnote3
The contributions of this paper to the literature are twofold. As a first value-added, it is the first paper to systematically estimate numeracy for Sub-Saharan Africa for the second half of the 20th century. We obtain important insights into the spatial differences by considering subnational evidence and tracing the development of numeracy in the region. Some evidence on the numeracy of school children exists, but none on adults: Data from international comparable tests have become an integral part of evaluating the quality of schooling. For Sub-Saharan Africa, the Southern and Eastern Africa Consortium for Monitoring Educational Quality (SACMEQ) and the Programme d’Analyse des Systèmes Educatifs de la Confemen (PASEC) have started to provide test scores for many countries. However, data from these international comparable tests have two important drawbacks: They cover only the in-school population and given that many children in Sub-Saharan Africa do not attend school at all or regularly, the test scores will overestimate the overall skills of a given population (Lilenstein, Citation2020). Moreover, since both organizations only started operation in the late 1990s, assessing the long-run development of schooling outcomes is impossible. Furthermore, only very few studies estimate numerical abilities in Sub-Saharan Africa.Footnote4 The most closely related study is by Cappelli and Baten (Citation2021) who estimate numerical abilities with the age-heaping method for 43 Sub-Saharan African countries between 1730 and 1970 using a panel data model. However, their study does not cover most of the post-colonial period.
As a second value-added item, our study contributes to the literature about the efficiency of the educational systems. The relevance of nutrition for numerical learning has been hypothesized and studied for individual case studies, such as Kenya (Hulett et al., Citation2014), Ecuador (Paxson & Schady, Citation2007), and England around 1810 (Baten, Crayen, & Voth, Citation2014). We are the first to study the relevance of nutrition for the efficiency of the educational sector for a whole world region, Sub-Saharan Africa. In sum, our work uses the educational efficiency of numeracy acquisition for the first time. Using this method broadens data availability considerably. We gain significant insights on the determinants of educational effectiveness, especially nutrition. If the causes of low educational efficiency are fully understood, political decisions can be taken to improve educational efficiency.
The remainder of this paper is organized as follows: Section 2 presents the background; Section 3 discusses the data sources, the methods to estimate numeracy, and our strategy to evaluate the efficiency of the education systems; Section 4 details the results; Section 5 includes the robustness checks; and Section 6 concludes the discussion.
2. Background
To design effective policies that raise the overall level of education, understanding the current state and potential determinants of educational achievement is of utmost importance. Many studies and policy reports focused on literacy rather than numeracy until recently (for example, the Millennium Development Goals only considered literacy in their targets). However, Hanushek and Woessmann (Citation2012) used a measure of math and science skills based on test scores from numerous international studies between 1964 and 2003 to estimate the effect of numeracy on economic growth. They revealed that numeracy is an even more important factor than literacy, which drove economic growth over the past decades, although both are necessary.
Even in agriculture, skills for comparing numerical proportions are essential. For example, a farmer might need to carry 50 stacks of wood. The question arises if the farmer should walk home to get a wheelbarrow or walk more often. Another example would be a microentrepreneur who could hire an employee and needs to compare costs and benefits. Both examples illustrate the far-reaching effects of basic numeracy skills on labor productivity and living standards. Thus, an overall increase in numeracy can substantially increase incomes in Sub-Saharan Africa. Crayen and Baten (Citation2010) show the impact of numeracy on GDP growth on a global scale, especially in many African countries. While literacy naturally remains a foundational skill, obtaining numeracy evidence is also relevant to enable populations to lift themselves out of poverty.
The study’s second main question pertains to how to achieve higher educational output. Thus, over the past decades, many studies investigated which inputs into the schooling system improve its efficiency. This literature has focused both on increasing student enrolment and attendance as well as actual educational output. The theoretical framework for retrospective and (quasi-)experimental studies in this field is a schooling production function (Glewwe & Kremer, Citation2006). represents a stylized version of such an education production function. The achievement of a student is determined by numerous factors, such as the time spent in school (S), the quality of schools and teachers (Q), the student’s innate ability (C), and the socioeconomic status of the household (H).
Figure 1. Stylised education production function following Glewwe and Kremer (Citation2006). Authors’ own representation.
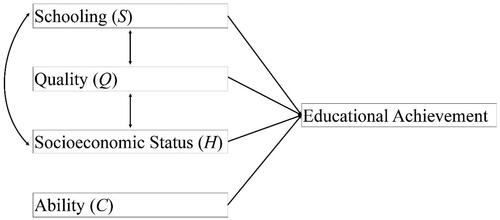
Much earlier work has focused on retrospectively estimating the parameters of such an education production function (Glewwe & Jacoby, Citation1994; Glewwe, Grosh, Jacoby, & Lockheed, Citation1995; Tan, Lane, & Coustere Citation1997). However, as most components of this function are highly endogenous, this causes severe concerns about the biasedness of the results (Glewwe & Kremer, Citation2006). Therefore, later research employed experimental or quasi-experimental designs to estimate the influence specific inputs have on attainment and hence, overall schooling efficiency. Several reviews (Evans & Mendez Acosta, Citation2021; Kremer, Brannen, & Glennerster, Citation2013; McEwan, Citation2015) have discussed the findings of this literature. However, these studies lack a comprehensive long-run perspective on the schooling efficiency for numeracy, a gap addressed by our study.
3. Data and method
3.1. Data
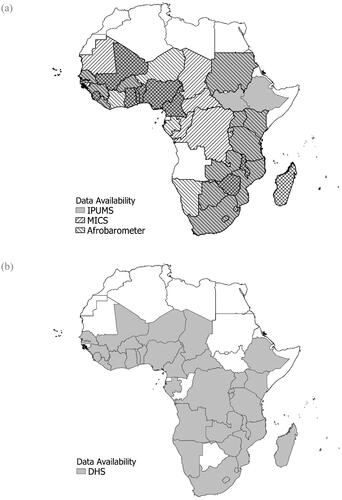
Our main data sources are four different types of surveys—censuses provided by the Integrated Public Use Microdata Series (IPUMS), Multiple Indicator Cluster Surveys (MICS), the Demographic and Health Surveys (DHS), and Afrobarometer (AB)—which are all representative at the national level. As a caveat, we should note that not all our datasets are designed to become representative at a regional level. Hence, we show in the Supplementary Material whether the regional estimates of education of the different datasets reconfirm each other. Our code and data are available in the Supplementary Material figshare files.
displays a map indicating for which country which data sources are available with (a) showing the countries for which age data is available and (b) the countries for which height data is available. Overall, the different sources allow us to cover almost the entire region. A more detailed overview of the surveys can be found in the Appendix.
Figure 2. Data availability for ABCC calculations (a) and height measures (b). Authors’ own representation.
Moreover, we use data from various sources as geographic and historical control variables in our analysis. A complete list of the controls, their definition, and sources are provided in .
3.2. Method
While data on educational inputs such as enrolment or years of schooling are available for Sub-Saharan Africa for the period between 1950 and 1999, these do not measure educational output (i.e. the skills a student learns in school, as argued above) (Pritchett, 2013; Angrist et al., Citation2021). Therefore, to estimate numeracy, we employ age heaping.
3.2.1. Numeracy
Age heaping is commonly used in the economic history literature to proxy for numerical abilities as statistics on numeracy are not available for most periods. Age heaping is the tendency of individuals to round their age to preferred terminal digits such as zero or five. For example, an individual might state 40 as his or her age when in fact it is 38 (as mentioned before). While this phenomenon is a serious problem for demographers as these false age statements prove difficult in estimations such as population forecasts, it allows us to estimate the numerical abilities of a given population.
We employ the Whipple Index, the ratio of the observed frequency of ages that end in zero or five to a uniform distribution where ages ending in zero or five should only constitute one-fifth of the entire population. To compare the development of numerical abilities over time and across space, we estimate this index for each birth decade from the 1950s to the 1990s per admin I subnational area in Sub-Saharan Africa. Admin I areas are the largest subnational divisions of a country. In a few cases, the availability of geographic indicators forced us to group some regions. Moreover, we employ the newest administrative borders in each country. In most cases, these boundaries have changed over time; however, this allows us to divide the sample into consistent subareas comparable over time and to contemporary statistics.
(1)
(1)
where i denotes the subnational area for birth decade t. The index ranges from 0 to 500, where a value of 500 indicates all individuals reporting an age that is a multiple of five. A value of 100 shows no heaping, and a value of 0 means that no individual in the respective population stated an age ending in zero or five. This implies a five-point increase in the Whipple Index, which equals one percentage point increase in the share of heaped ages. To make the index well understandable, we utilize the ABCC Index (which is a simple linear transformation of the Whipple Index)Footnote5. It displays the approximate share of individuals who correctly report their age.
(2)
(2)
We restrict the age range between 23 and 62 for multiple reasons. First, older people tend to exaggerate their age, which would bias the estimates. Second, individuals younger than 23 are excluded as age heaping is much less observed among younger people.Footnote6 Crayen and Baten (Citation2010) observed that individuals between 23 and 32 are comparably more likely to heap on even numbers than older individuals. Hence, we apply their adjustment method for the age group 23–32 (subtracting 25%).Footnote7
It is also important to consider that in a regular age distribution, there will be fewer individuals at age 54 than 50 because some people die. To avoid a potential mortality bias, we estimate numeracy separately for age groups beginning with terminal digit 3 (i.e. from 23 to 32, 33 to 42, 42 to 52, and 53 to 62). We assign each age group the birth decade that most individuals in that age group belong to. If there are several surveys for a birth decade at the subnational level available from one type of source (e.g. there is data for the 1960 birth cohort in each of the three Mali censuses), we calculate the average weighted by the respective sample size.
Previous literature (A’Hearn, Delfino, & Nuvolari, Citation2022; Földvári, Van Leeuwen, & Van Leeuwen-Li, Citation2012) has discussed several potential biases when employing the ABCC Index as a proxy for numerical abilities. These potential biases are a respondent bias (men answering on behalf of women), a marriage bias (wives adapting their age to their husbands’ age), an ageing bias (increased heaping as individuals age) and an enumerator bias (counterchecking of age statements by enumerators). Ferber and Baten (Citation2023) validate the African data and check for these potential biases. We provide a summary of their results in the appendix. They provide evidence that the ABCC Index is well suited to capture numerical abilities in Sub-Saharan Africa and does not fall prey to substantial biases. Hence, the conclusion is that the ABCC Index is an appropriate method for our endeavor.
3.2.2. Schooling efficiency for numeracy
We calculate our schooling efficiency measure by estimating the ratio of the ABCC index of numeracy (=the educational output) to the average years of schooling (=the educational input) per region and birth decade: Footnote8
(3)
(3)
This ratio between the output in numeracy skills and the year-of-schooling input helps to assess the efficiency of the educational system. We need a strategy of standardizing both variables because numeracy does not equal zero for individuals who have not been to school. Basic numeracy is partly acquired in the family and other social environments of young children (Benavides-Varela et al., Citation2016; Niklas, Cohrssen, & Tayler, Citation2016). Thus, we first standardize both components of our efficiency measure to consider this. We loosely follow the methodology of the Human Development Index that expresses an indicator between its minimum and maximum, setting the former to zero and the latter to one.
(4)
(4)
(5)
(5)
Another change we need to make is to not employ the observed maximum years of schooling. Basic numerical skills measured by the ABCC index should be achieved latest at the age of finishing primary schooling. The median length of primary schooling in Sub-Saharan Africa is six years; thus, we set the maximum number of years of schooling to this. If we did not make this adjustment—regions with very high levels of numeracy and a high number of average years of schooling would appear overly inefficient compared to regions that also have high levels of numeracy but fewer years of schooling. Yet, the former regions probably achieved basic numeracy years before they ended schooling and moved on to more advanced mathematics. However, we would not be able to capture this in our data without our standardization strategy.
For clarity, we discuss a numerical example: Assume for EquationEq. (4)(4)
(4) we only have the following
values in our dataset:
If we plug in our values in the standardization formula shown above, we get:
For
= 0/63 = 0.
As stated, the minimum value is standardized to zero.
For
The maximum value is standardized to one.
Values in between will be ∈ [0, 1] e.g.:
For
Please note that our efficiency measure considers the ratio between inputs and outputs. It does not focus on the underinvestment in school-year inputs. For example, a poor region with only one year of schooling might reach a high efficiency even with numeracy output below the average. In such a situation, the parents might support the numerical learning in the family, and other factors, such as child nutrition, might be of sufficient quality. This is not necessarily a region of high development status (because of a lack of inputs), but it will inform our analysis of why the large increase in inputs in SSA overall did not lead to a corresponding increase in skill output. In other words, we would like to emphasize that we need to understand the issue of why the significant investment increase in schooling years in Africa did not result in more numeracy output. A potential issue may be the quality of nutrition, which we discuss in the following section.
3.2.3. Nutrition
We use the average height of a given population as an indicator of nutrition during childhood. Numerous studies have demonstrated that high-quality nutrition is key for the development of cognitive abilities (Bryan et al., Citation2004) and adult height (Baten & Blum, Citation2014). A child that does not grow enough during childhood due to a lack of adequate nutrition will not catch up later in life to reach its potential height (Leroy, Ruel, Habicht, & Frongillo, Citation2015). Therefore, we use female height per admin I area as the main explanatory variable in our model.Footnote9 Our baseline specification is a pooled OLS model in which we cluster by admin I region.
(6)
(6)
where
is the estimated efficiency of schools per region per birth decade, and
is height per region and birth decade.
is a vector of control variables, and
are birth decade and larger regions fixed effects (‘larger’ regions are the regions of East, West, Central, and South Africa). Besides the geographic control variables, we include age at first marriage, the share of Muslims, and a measure of religious fractionalization as control variables (available at the admin I level).Footnote10 We opted not to use a fixed effects panel data model because schooling efficiency is highly persistent. Thus, there is not enough variation over time to find any effects in a fixed effects model.
A potential problem of the regression could be an omitted variable bias. Thus, we turn to a quasi-experimental strategy and use an instrumental variable (IV) approach. The instrument we propose for Height is the cumulative monthly negative percentage deviation (Ahmed & Ray, Citation2018) in the district of residence in the year stated as birth year plus the two years before and after.Footnote11 Another potential issue could be survivor bias of height from cohort data. A survivor bias can occur if some individuals have already died, in this case those of lower stature, and are hence not included in the data biasing the average height upwards. In the supplement, we discuss this possibility and find that it is not substantial. In addition, the IV strategy also circumvents potential measurement error issues.
There are two main arguments for the choice of IV. First, there is an extensive literature on critical period programming (Knudsen, Citation2004) that finds that nutritional conditions during the in-utero period and early infancy are crucial determinants of not only child health but also health during adulthood and adult height (see also Barker, Citation1990; Behrman & Rosenzweig, Citation2004; Black, Devereux, & Salvanes, Citation2007; Alderman, Hoddinott, & Kinsey, Citation2006; Oreopoulos, Stabile, Walld, & Roos, Citation2008). Second, according to the World Bank (Citation2022), more than 60 percent of the total employment in Sub-Saharan Africa was in agriculture in 2000, with even higher shares in earlier periods. Little land is irrigated in Sub-Saharan Africa (Barrios et al., Citation2010) such that sufficient rainfall is a key input for a good harvest (Schlenker & Lobell, Citation2010). A comprehensive overview of the link between climatic conditions and the economy is provided by Dell, Jones, and Olken (Citation2012). Further information on the reasoning and potential mechanisms is provided in the supplementary materials.
We use Version 4 of the Climate Research Unit gridded Time Series by the University of East Anglia (CRU data) for 1948–2001 (Harris, Osborn, Jones, & Lister, Citation2020). The dataset provides monthly rainfall data at a 0.5° × 0.5° resolution for the entire world, except Antarctica. The data is collected from an extensive network of weather station observations and is interpolated using angular-distance weighting. We calculate the mean rainfall per admin I region for each month between January 1948 and December 2001 and the long-term average. Next, we define the rain shock variable as the cumulative monthly negative percentage deviation for the year of birth plus the two years before and after (Ahmed & Ray, Citation2018). We calculate the value for each individual in our dataset before taking the average for each district and birth decade.
We add the two-year buffer for several reasons. First, we calculate the year of birth for each individual by subtracting the stated age from the year of the interview. Since some individuals have rounded their age, the derived year of birth will not be accurate for all observations. If non-numerate individuals heap to the closest number with the terminal digit zero or five, the margin of error is approximately two years. Second, we do not know the month of birth. It might be January or December, adding the year before and after ensures that we also cover the in-utero period and early infancy for those who stated a correct age. Naturally, there are some drawbacks given the wide margin. However, at worst, if the true year of birth is in the first year of our margin, we cover more of the infancy period, whereas if it is in the last year, we cover the pregnancy and conditions for the mother pre-pregnancy which can be relevant as well for in-utero health exposure. Thus, we believe that overall, we can capture a critical period of a child that has a lasting impact on adult outcomes.
Thus, our first stage regression is
(7)
(7)
where Rainshock is the negative rainfall shock of region i during birth decade t.
An omnipresent potential concern with IVs is the validity of the exclusion restriction. However, since rainfall is arguably exogenous and is not serially correlated over time (Paxson, Citation1992), rainfall at birth is unrelated to rainfall during later ages. Moreover, we only consider within-district variation and do not compare rainfall across regions. Therefore, as long as the negative shock caused by insufficient rainfall does not last over several years (other than its long-lasting impact on health), the exclusion restriction is fulfilled. An effect of a negative rainfall shock that could potentially last over several years is that it affects wealth. For example, a household living in subsistence agriculture might have to sell their assets accumulated over years of hard work to survive. If this shock lasts until the child starts to acquire numerical skills, then this could violate the exclusion restriction. However, for this to be the case, the rainfall shock must be very severe. Yet, our data shows more than 70 percent of observations never experienced a negative rainfall shock that is two standard deviations below the long-term average of a district. And in more than 95 percent of observations, the average number of months during pregnancy and infancy is less than one month with a severe negative rainfall shock on average. Thus, while no observational study can ever be sure that the exclusion restriction does not pose a problem, we can be reasonably sure that this problem is not of substantive dimensions here.
3.2.4. Descriptives
Summary descriptive statistics for our main variables are provided in . All estimates are at the subnational region level and per birth decade. On average, the ABCC index is about 83. However, numeracy varies between less than 30 and 100 percent. Our measure of education efficiency (in logs) is on average about 0.23. Moreover, years of schooling has a mean of 5 years in the sample.
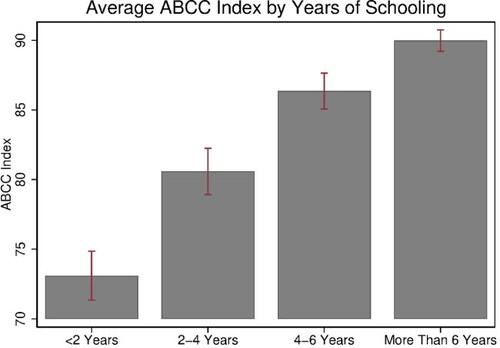
The relationship between the ABCC Index and average years of schooling in our sample is assessed in . We observe a positive relationship indicating that more education does increase numerical skills. However, the error bars indicate that there is quite some variation in each category – the efficiency of the education system differs substantially between regions.
Figure A.1. Relationship of average years of schooling and numeracy (ABCC Index). Data from IPUMS, MICS and Afrobarometer. Authors’ own representation.
4. Results
4.1. Numeracy
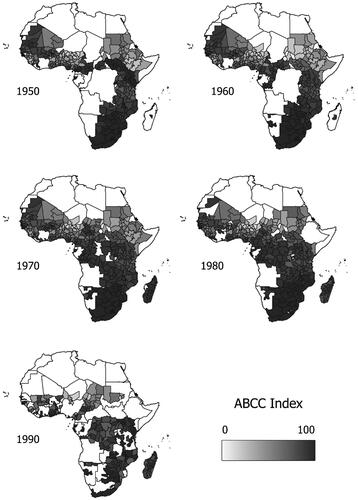
The spatial distribution of numeracy has remained highly similar and exhibited a strong path dependency. demonstrates the numeracy level for each region per birth decade. Southern Africa has achieved high levels of numeracy for the 1950 birth decade. Thus, our measure is not that useful anymore for studying this area since it cannot detect differences at higher levels of numerical abilities. Other areas with high levels of numeracy are Madagascar and the DR Congo. However, the DR Congo and Madagascar experienced a decrease in numerical abilities over time. In contrast, we observe the lowest level of numeracy in Western Africa, the Sahel area, and Ethiopia. Northern Nigeria has especially low values in all birth decades. Overall, the spatial distribution does not change much over time, and areas that only achieved low values of numeracy for the 1950s birth cohort also achieved low values for the 1990s birth cohort.
Figure 3. ABCC Index per admin I level for each birth decade between 1950 and 1990. Data from IPUMS, MICS and Afrobarometer. Authors’ own representation.
4.2. Schooling efficiency
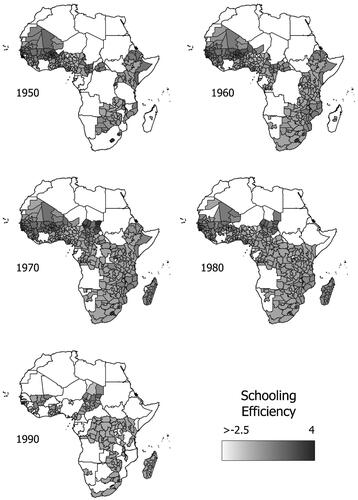
While showing a slight downward trend, given the increase in years of schooling over our observational period, the spatial distribution of schooling efficiency has also remained remarkably stable. illustrates our estimates for schooling efficiency for each region per birth decade. The countries with the highest efficiency levels according to our measure are Burkina Faso and Chad, while at the bottom end, we find Nigeria in each period and some areas of Ethiopia and Guinea. We observe strong and persistent spatial differences over time. A contributing factor to this observation could be increased class sizes and lower average ability in schools as children who were only enrolled in later decades tend to be the weaker students.
Figure 4. Schooling efficiency per admin I level for each birth decade between 1950 and 1990. Data from IPUMS, MICS, Afrobarometer and DHS. Authors’ own representation.
Next, we turn to the regression analysis results that investigate nutritional status as a driver of schooling efficiency. synthesizes the baseline results. Column (1) shows the raw correlation between height and our measure of education efficiency. This is significant at the one percent level. Subsequently, we add birth decade and African regions fixed effects in column (2), age at marriage, the share of Muslims and a measure of religious fractionalization in column (3), and our set of geographic controls in column (4). The height coefficient is of substantial size if we include the geographic controls in column (4) and remains statistically significant at the one percent level. Our results suggest that increasing average height by one centimeter increases schooling efficiency by about 6 percent.
Table 1. Baseline regression – correlation of schooling efficiency and height
As mentioned before, we need to consider potential endogeneity, arising, for example, from measurement error or omitted variable bias. Therefore, we now present the results from our instrumental variable approach in . Odd-numbered columns show the first-stage results and even-numbered columns the second-stage results. The first stage results are in all specifications highly statistically significant and exhibit F-Statistics above 10 (Stock & Yogo, Citation2005). Thus, we do not have to face a weak instrument problem. The instrumental variable results confirm our previous results that height as a proxy for nutrition during early childhood is significantly related to education efficiency. The higher the average height within a population, the more efficient the education system.
Table 2. Instrumental variable regression – the impact of nutrition on schooling efficiency
Overall, we find that height as a proxy for children’s nutrition is significantly related to education efficiency in Sub-Saharan Africa. Given that we find this based on an IV approach, we may claim causality. There can be two underlying mechanisms. On the one hand, better nourished and healthier children are more likely to attend school, and on the other hand, healthier and well-nourished children in school are better able to learn. We cannot distinguish between these two mechanisms yet provide evidence that improving children’s nutrition can be an important contributor to increasing education efficiency in Sub-Saharan Africa.
5. Robustness checks
Our main specification provides estimates for which we use the whole range of ABCC values. As there is a larger number of top-coded observations in our data, we also provide estimates using an ABCC of 95, 90, or 85 as cut-off values for a robustness check. In Supplementary Table S.2, we show that our results are not driven by a sample composition effect and hold if we use the different cut-off values. The estimates remain significant and similar in size.
Moreover, we provide alternative estimates if we alter our outcome variable slightly. As discussed, we limit years of schooling to six years as this is the median length of primary school education. Supplementary Table S.3 summarizes our results, which are virtually unchanged if we use four, five, seven, or eight years of schooling.
We also assessed the robustness of the instrument by excluding the most arid and rain-intensive part of the distribution (). Furthermore, in we provide estimates for predominantly rural and urban areas separately. Interestingly, we do find a significant difference in our estimates for rural and for urban areas indicating that the link between nutrition and schooling efficiency is stronger in rural areas. Since rural regions are on average affected more severely by poverty this could hint that undernutrition is a more severe problem in rural areas. Again, the results of can be confirmed in these alternative specifications. Additionally, Supplementary Tables S.4 and S.5 provide estimates, excluding extreme IV values and using alternative definitions of our IV. We observed that the instrument works in all robustness tests. Lastly, we show in Supplementary Table S.6 that our findings are robust to spatial autocorrelation.
Table 3. Robustness checks – exclusion of the low or high extreme rain values and by rural/urban areas
6. Concluding discussion
Ensuring every child has access to quality education is crucial for achieving long-term sustainable development. Despite increased primary school enrolment in significant portions of Sub-Saharan Africa over the past decade, the region has not witnessed the anticipated improvement in learning outcomes (Angrist et al., Citation2021). Consequently, policymakers and scholars are actively seeking tools to address this challenge.
Our paper is the first to provide long-term evidence on developing numerical skills at the sub-national level in substantial parts of Sub-Saharan Africa for the birth decades 1950 to 1990. Throughout the observational period, we notice high levels of numeracy in Southern Africa and parts of Central Africa compared to the remainder of the region. Moreover, we observe very little progress in line with contemporary findings of low educational achievement despite increasing enrolment and years of schooling (Angrist et al., Citation2021).
Therefore, we contribute to this discussion by adopting a long-term perspective. Initially, we assess the evolution of schooling efficiency over the observed period and observe minimal change. Persistent regional disparities further underscore the importance to comprehend underlying mechanisms. Secondly, we examine the impact of children’s nutrition and health on schooling outcomes, using average adult height as the primary explanatory variable. Our findings affirm the significance of children’s nutrition as a key predictor of schooling efficiency. Additionally, we employ an instrumental variable (IV) approach, using the average months of exposure to below-average district rainfall during pregnancy and infancy as our instrument. The IV results substantiate our findings, and our results remain robust across various specifications.
While the quantity of education input has increased over the last decades in SSA (Baten & Maravall, Citation2021), this does not necessarily imply that educational efficiency increased. While the input in years of schooling increased from 4.4 to 6.6 (1960s–1990s), the output has increased at a modest rate: For example, numeracy increased only slightly from 82.1 in both the 1950s and 1960s to 84.9 in the 1980s, and 86.2 in the 1990s. Hence, efficiency – which is the ratio between the two – stays at a similar level or shows slightly declining tendencies. Specifically, in some countries, efficiency decreased, while in others, it increased or remained constant. Similarly, le Nestour, Moscoviz, and Sandefur (Citation2022) observed a decrease in literacy production efficiency for several African countries, while other countries experienced literacy production efficiency increases. Our results suggest that nutritional quality mattered for these outcomes.
How can we improve the nutritional situation of school children? One of the most popular interventions worldwide to incentivize children to come to school and increase their chances of learning something at school is school-feeding programs (Aurino, Gelli, Adamba, Osei-Akoto, & Alderman, Citation2020). The rationale behind this type of intervention is that on the one hand, children receive food conditional on attending school, and, on the other hand, well-fed children are able to concentrate and participate better in school. Moreover, given the high level of malnourishment in Sub-Saharan Africa, providing children with extra food can be considered a goal. Most evidence about school feeding interventions suggests positive effects on enrolment and educational outcomes. The recent literature moves toward the view that school feeding is also cost-effective (Aurino et al., Citation2020; different nuance: Parker et al., Citation2015). We find that better-nourished children acquire better numerical skills, which is important for sustainable growth. This can change the cost-benefit analysis of school feeding programs substantially. Our analysis suggests that school-feeding programs intended for the youngest school children around age 6 or 7 can be beneficial via the nutrition effect, as at this age, children might compensate for earlier malnutrition issues partly. Even better would be preschool protein supplement programs (Hulett et al., Citation2014), although we admit that this might be prevented by financial constraints. Protein would be particularly relevant, as Case and Paxson (Citation2008) identified these as predictors of later-life abilities (and protein intake correlates with height; see also Baten et al., Citation2014, Baten & Blum, Citation2014). If these programs would be targeted specifically at the most problematic regions that we identify in the maps of (and on the poorest families within these regions), they can contribute to solving the ‘schooling crisis’.
Supplemental Material
Download PDF (585.3 KB)Acknowledgments
We thank Elias Papaioannou, and the participants at AEHN (Lund), WEHC (Paris), EHES (Groningen) and workshop participants in Tuebingen and Valencia for their comments.
Disclosure statement
No potential conflict of interest was reported by the author(s).
Additional information
Funding
Notes
1 The concept was first used by demographers to assess data quality (Bachi, Citation1951), It is now commonly used to estimate basic numeracy (Crayen & Baten, Citation2010; Hippe & Baten, Citation2012; Stolz, Baten, & Botelho, Citation2013).
2 This holds true if survivor bias is not substantial. Earlier studies found that survivor bias does not invalidate the results (Crayen & Baten, Citation2010).
3 Height evidence is from www.clio-infra.eu, reporting male height for 32 Sub-Saharan African countries for the 1960–69 and 34 in the 1980–89 birth periods (based on age groups 20–50). Similarly, the NCD Risk Factor Collaboration (NCD-RisC) (2016) study arrives at 169.7 cm for 45 Sub-Saharan African countries both for 1960–69 and 169.1 cm for the 1980–89 birth periods (including the 17-year age group and no upper limit). For the 1990s, the trend continued down to 167.8 cm. From the birth decade of the 1950s to the 1960s, an increase from 169.0–169.4 to 169.7–169.9 can be observed.
4 The demography literature provides a few contributions using the age-heaping approach to evaluate the quality of survey data (Bwalya, Phiri, & Mwansa, Citation2015; Fayehun, Ajayi, Onuegbu, & Egerson, Citation2020; Lyons-Amos & Stones, Citation2017). Yet, while these studies employ age heaping, their methodology is not completely comparable, and they do not link their estimates to the numerical abilities of respondents.
5 Named after A’Hearn, Baten, and Crayen who published this transformation in 2009, and Greg Clark who suggested it in a comment on their paper.
6 In earlier studies the age heaping of individuals aged 17–22 was characterized as being impossible to compare with the age heaping of older individuals (Crayen & Baten, Citation2010). At such young age, just having finished stature growth a few years ago, some individuals tend to round to even numbers (such as 18 or 22), others to 20, others not at all, even if they are not numerate enough to provide an exact age. Prayon (Citation2014) compared this age group (17–22) to other age groups and found a much lower signal-to-noise ratio. This probably depends on the frequency of important life events at this age, such as military service, marriage, and similar events. For all these reasons, a consensus in the literature has emerged to concentrate on the age groups 23–32, 33–42, and so on, as the age heaping-education relationship was much closer for these age groups. This does not imply that rounding on age 20 was negligible, but rounding on 18 and 22 was also very substantial, and the shifts to these ages have not been modelled yet in a way to obtain a reliable indicator. Also taking all round ages such as 18 or 22 as “heaped” does not result in a reliable proxy, that can be compared with other age groups.
7 Crayen and Baten (Citation2010) have studied a large, global sample for the birth decades of the 1870s to 1940s using a country-decade panel of 1549 observations to identify to which degree individuals of age group 23–32 rounded less on multiples of five, compared to later age groups who were born in the same birth decade, but were interviewed in later censuses. For example, those born in the 1880s, age 23–32 in 1910, were compared to the same persons born in the 1880s, but interviewed in the 1920s, when they were 33–42. Crayen and Baten (Citation2010) estimated an adjustment of the ABCC by −25% for the age groups 23–32. This resulted in a quite similar numeracy level for the same birth cohorts, independent of their age during the census. Clearly, the correct adjustment might be −24% or −26% in some cases, but we cannot identify the subtle differences. The average reduction of 25 percent moves the estimates for this age group closer to the true value.
8 We acknowledge that years of schooling as our educational input may not fully capture the educational input in a nonformal environment (i.e., the household). However, the years a child ideally spends in a school are the same in which learning in a nonformal environment needs to take place. Thus, we believe that using years of schooling is a good approximation for the time a child spends learning, whether in a school or a nonformal environment. Moreover, the average years of schooling in a region naturally declines the more people never attend school, thus, reflecting the overall availability of schooling and attendance at schools, which are crucial inputs at the early stages of educational expansion.
9 The DHS has good coverage of height data for women, but only very few surveys have data on male heights. Therefore, we opted to only use the female height data to ensure comparability between samples. Moreover, given that women and girls are the more marginalized group compared to their male counterparts, using female height data as a proxy for children’s undernutrition might even be the more reliable indicator for undernutrition. If food becomes scarce, it is often first redistributed within the household from females to males (Doss, Citation2013). Hence, female height might be more ‘sensitive’ to periods of malnutrition during childhood.
10 We include age at first marriage as a proxy for female empowerment (Baten & de Pleijt, Citation2022). We include the share of Muslims as a control variable as the average educational attainment of Muslims is on average lower than that of Christians. Similarly, we include religious fractionalization to control for the homogeneity of the religious community and religious competition has been linked to higher educational outcomes (Gallego & Woodberry, Citation2010). To calculate religious fractionalization, we follow Alesina, Devleeschauwer, Easterly, Kurlat, and Wacziarg (Citation2003).
11 We acknowledge that individuals may have moved over the course of their lives such that the conditions in the district of residence might not resemble conditions in the actual birth district. However, there is only limited information about the district of birth for a small subset of respondents. Thus, we can only calculate the rainfall shock for the current district of residence.
References
- A’Hearn, B., Baten, J., & Crayen, D. (2009). Quantifying quantitative literacy: Age heaping and the history of human capital. The Journal of Economic History, 69(3), 783–808. doi:10.1017/S0022050709001120
- A’Hearn, B., Delfino, A., & Nuvolari, A. (2022). Rethinking age heaping: A cautionary tale from nineteenth-century Italy. The Economic History Review, 75(1), 111–137. doi:10.1111/ehr.13087
- Ahmed, S., & Ray, R. (2018). Do in utero shocks have adverse effects on child health outcomes and can welfare schemes ameliorate such effects? Evidence from Andhra Pradesh, India. Journal of Biosocial Science, 50(6), 770–799. doi:10.1017/S0021932017000591
- Aizer, A., Stroud, L., & Buka, S. (2016). Maternal stress and child outcomes. The Journal of Human Resources, 51(3), 523–555. doi:10.3386/w18422
- Alderman, H., Hoddinott, J., & Kinsey, B. (2006). Long term consequences of early childhood malnutrition. Oxford Economic Papers, 58(3), 450–474. doi:10.1093/oep/gpl008
- Alesina, A., Devleeschauwer, A., Easterly, W., Kurlat, S., & Wacziarg, R. (2003). Fractionalization. Journal of Economic Growth, 8(2), 155–194. doi:10.1023/A:1024471506938
- Angrist, N., Djankov, S., Goldberg, P. K., & Patrinos, H. A. (2021). Measuring human capital using global learning data. Nature, 592(7854), 403–408. doi:10.1038/s41586-021-03323-7
- Aurino, E., Gelli, A., Adamba, C., Osei-Akoto, I., & Alderman, H. (2020). Food for thought? Experimental evidence on the learning impacts of a large-scale schoole feeding program. Journal of Human Resources, 58(1), 74–111. doi:10.3368/jhr.58.3.1019-10515R1
- Bachi, R. (1951). The tendency to round off age returns: Measurement and correction. Bulletin of the International Statistical Institute, 33, 195–222.
- Banerjee, A., Duflo, E., Postel-Vinay, G., & Watts, T. M. (2010). Long run health impacts of income shocks: Wine and phylloxera in 19th century France. Review of Economics and Statistics, 92(4), 714–728. doi:10.1162/REST_a_00024
- Barker, D. J. P. (1990). The fetal and infant origins of adult disease. British Medical Journal, 301(6761), 1111–1111. doi:10.1136/bmj.301.6761.1111
- Barrios, S., Bertinelli, L., & Strobl, E. (2010). Trends in rainfall and economic growth in Africa: A neglected cause of the african growth tragedy. Review of Economics and Statistics, 92(2), 350–366. doi:10.1162/rest.2010.11212
- Bashir, S., Lockheed, M., Ninan, E., & Tan, J.-P. (2018). Facing forward: Schooling for learning in Africa. Washington DC: World Bank.
- Baten, J., Benati, G., & Ferber, S. (2022). Rethinking age-heaping again for understanding its possibilities and limitations. The Economic History Review, 75(3), 960–971. doi:10.1111/ehr.13139
- Baten, J., Crayen, D., & Voth, J. (2014). Numeracy and the impact of high food prices in industrializing Britain, 1780–1850. Review of Economics and Statistics, 96(3), 418–430. doi:10.1162/REST_a_00403
- Baten, J., & Blum, M. (2014). Why are you tall while others are short? Agricultural production and other proximate determinants of global heights. European Review of Economic History, 18(2), 144–165. doi:10.1093/ereh/heu003
- Baten, J., & de Pleijt, A. M. (2022). Female autonomy generated successful long-term human capital development: Evidence from 16th to 19th century Europe. World Development, 158, 105999. doi:10.1016/j.worlddev.2022.105999
- Baten, J., & Maravall, L. (2021). The influence of colonialism on Africa’s welfare: An anthropometric study. Journal of Comparative Economics, 49(3), 751–775. doi:10.1016/j.jce.2021.01.001
- Baten, J., & Nalle, S. (2022). Age heaping and life course reckoning: Individual-level evidence from Spanish inquisition records. Vierteljahrsschrift Für Sozial- Und Wirtschaftsgeschichte [Journal of Social and Economics History], 109, 337–350.
- Behrman, J. R., & Rosenzweig, M. R. (2004). Returns to birthweight. Review of Economics and Statistics, 86(2), 586–601. doi:10.1162/003465304323031139
- Benavides-Varela, S., Butterworth, B., Burgio, F., Arcara, G., Lucangeli, D., & Semenza, C. (2016). Numerical activities and information learned at home link to the exact numeracy skills in 5–6 years-old children. Frontiers in Psychology, 7, 94. doi:10.3389/fpsyg.2016.00094
- Black, S. E., Devereux, P. J., & Salvanes, K. G. (2007). From the cradle to the labor market? The effect of birth weight on adult outcomes. The Quarterly Journal of Economics, 122(1), 409–439. doi:10.1162/qjec.122.1.409
- Bryan, J., Osendarp, S., Hughes, D., Calvaresi, E., Baghurst, K., & Klinken, J.-W. (2004). Nutrients for cognitive development in school-aged children. Nutrition Reviews, 62(8), 295–306. doi:10.1111/j.1753-4887.2004.tb00055.x
- Burlando, A. (2014). Transitory shocks and birth weights: Evidence from a blackout in Zanzibar. Journal of Development Economics, 108, 154–168. doi:10.1016/j.jdeveco.2014.01.012
- Bwalya, B. B., Phiri, M., & Mwansa, C. (2015). Digit preference and its implications on population projections in Zambia: Evidence from the census data. International Journal of Current Advanced Research, 4, 92–97.
- Cappelli, G., & Baten, J. (2021). Numeracy development in Africa: New evidence from a long-term perspective (1730–1970). Journal of Development Economics, 150, 102630. doi:10.1016/j.jdeveco.2021.102630
- Case, A., & Paxson, C. (2008). Stature and status: Height, ability, and labor market outcomes. The Journal of Political Economy, 116(3), 499–532. doi:10.1086/589524
- Crayen, D., & Baten, J. (2010). Global trends in numeracy 1820–1949 and its implications for long-term growth. Explorations in Economic History, 47(1), 82–99. doi:10.1016/j.eeh.2009.05.004
- Currie, J., & Rossin-Slater, M. (2013). Weathering the storm: Hurricanes and birth outcomes. Journal of Health Economics, 32(3), 487–503. doi:10.1016/j.jhealeco.2013.01.004
- Currie, J., & Vogl, T. (2013). Early-life health and adult circumstance in developing countries. Annual Review of Economics, 5(1), 1–36. doi:10.1146/annurev-economics-081412-103704
- Dell, M., Jones, B. F., & Olken, B. A. (2012). Temperature shocks and economic growth: Evidence from the last half century. American Economic Journal: Macroeconomics, 4(3), 66–95. doi:10.1257/mac.4.3.66
- Doss, C. (2013). Intrahousehold bargaining and resource allocation in developing countries. The World Bank Research Observer, 28(1), 52–78. doi:10.1093/wbro/lkt001
- Evans, D. K., & Mendez Acosta, A. (2021). Education in Africa: What are we learning? Journal of African Economies, 30(1), 13–54. doi:10.1093/jae/ejaa009
- Fayehun, O., Ajayi, A. I., Onuegbu, C., & Egerson, D. (2020). Age heaping among adults in Nigeria: Evidence from the Nigeria demographic and health surveys 2003–2013. Journal of Biosocial Science, 52(1), 132–139. doi:10.1017/S0021932019000348
- Ferber & Baten. (2023). Numeracy in Sub-Saharan Africa: The robustness of the ABCC-Index (Unpublished Manuscript). Germany: Faculty of Social Science and Economics, University of Tuebingen.
- Földvári, P., Van Leeuwen, B., & Van Leeuwen-Li, J. (2012). How did women count? A note on gender-specific age heaping differences in the sixteenth to nineteenth centuries 1. The Economic history review, 65(1), 304–313. doi:10.1111/j.1468-0289.2010.00582.x
- Gallego, F. A., & Woodberry, R. (2010). Christian missionaries and education in former African colonies: How competition mattered. Journal of African Economies, 19(3), 294–329. doi:10.1093/jae/ejq001
- Glewwe, P., & Jacoby, H. (1994). Student achievement and schooling choice in low-income countries: evidence from Ghana. The Journal of Human Resources, 29(3), 843–864. doi:10.2307/146255
- Glewwe, P., & Kremer, M. (2006). Schools, teachers, and education outcomes in developing countries. In E. Hanushek & F. Welch (Eds.), Handbook of the Economics of Education (vol. 2, pp. 945–1017). Oxford and Amsterdam: Elsevier.
- Glewwe, P., Grosh, M., Jacoby, H., & Lockheed, M. (1995). An eclectic approach to estimating the determinants of achievement in Jamaican primary education. The World Bank Economic Review, 9(2), 231–258. doi:10.1093/wber/9.2.231
- Hanushek, E. A., & Woessmann, L. (2008). The role of cognitive skills in economic development. Journal of Economic Literature, 46(3), 607–668. doi:10.1257/jel.46.3.607
- Hanushek, E. A., & Woessmann, L. (2012). Do better schools lead to more growth? Cognitive skills, economic outcomes, and causation. Journal of Economic Growth, 17(4), 267–321. doi:10.1007/s10887-012-9081-x
- Harris, I., Osborn, T. J., Jones, P., & Lister, D. (2020). Version 4 of the CRU TS monthly high-resolution gridded multivariate climate dataset. Scientific Data, 7(1), 109. doi:10.1038/s41597-020-0453-3
- Hippe, R., & Baten, J. (2012). Regional inequality in human capital formation in Europe, 1790–1880. Scandinavian Economic History Review, 60(3), 254–289. doi:10.1080/03585522.2012.727763
- Hidalgo, F. D., Naidu, S., Nichter, S., & Richardson, N. (2010). Economic determinants of land invasions. Review of Economics and Statistics, 92(3), 505–523. doi:10.1162/REST_a_00007
- Hsiang, S. M., Burke, M., & Miguel, E. (2013). Quantifying the influence of climate on human conflict. Science, 341(6151), 1235367. doi:10.1126/science.1235367
- Hulett, J. L., Weiss, R. E., Bwibo, N. O., Galal, O. M., Drorbaugh, N., & Neumann, C. G. (2014). Animal source foods have a positive impact on the primary school test scores of Kenyan schoolchildren in a cluster-randomised, controlled feeding intervention trial. The British Journal of Nutrition, 111(5), 875–886. doi:10.1017/S0007114513003310
- Knudsen, E. I. (2004). Sensitive periods in the development of the brain and behavior. Journal of Cognitive Neuroscience, 16(8), 1412–1425. doi:10.1162/0898929042304796
- Kremer, M., Brannen, C., & Glennerster, R. (2013). The challenge of education and learning in the developing world. Science (New York, N.Y.), 340(6130), 297–300. doi:10.1126/science.1235350
- le Nestour, A., Moscoviz, L., & Sandefur, J. (2022). The long-run decline of education quality in the developing world (Center for Global Development Working Paper No. 608). Washington, DC: Center for Global Development.
- Lee, C. (2014). Intergenerational health consequences of in utero exposure to maternal stress: Evidence from the 1980 Kwangju uprising. Social Science & Medicine, 119, 284–291. doi:10.1016/j.socscimed.2014.07.001
- Leroy, J. L., Ruel, M., Habicht, J. P., & Frongillo, E. A. (2015). Using height-for-age differences (HAD) instead of height-for-age z-scores (HAZ) for the meaningful measurement of population-level catch-up in linear growth in children less than 5 years of age. BMC Pediatrics, 15(1), 145. doi:10.1186/s12887-015-0458-9
- Lilenstein, A. (2020). Better measures of progress: Developing reliable estimates of educational access and quality in Francophone sub-Saharan Africa (Stellenbosch Economic Working Papers WP13/2020). Stellenbosch: Department of Economics and the Bureau for Economic Research at the University of Stellenbosch.
- Lyons-Amos, M., & Stones, T. (2017). Trends in demographic and health survey data quality: An analysis of age heaping over time in 34 countries in Sub Saharan Africa between 1987 and 2015. BMC Research Notes, 10(1), 760. doi:10.1186/s13104-017-3091-x
- McEwan, P. J. (2015). Improving learning in primary schools of developing countries: A meta-analysis of randomized experiments. Review of Educational Research, 85(3), 353–394. doi:10.3102/0034654314553127
- Meng, X., & Qian, N. (2009). The long term consequences of famine on survivors: Evidence from a unique natural experiment using China’s Great Famine (NBER Working Paper Series, No. 14917). Cambridge, MA: National Bureau of Economic Research.
- NCD Risk Factor Collaboration (NCD-RisC). (2016). A century of trends in adult human height. Elife, 5, e13410.
- Niklas, F., Cohrssen, C., & Tayler, C. (2016). Improving preschoolers’ numerical abilities by enhancing the home numeracy environment. Early Education and Development, 27(3), 372–383. doi:10.1080/10409289.2015.1076676
- Oreopoulos, P., Stabile, M., Walld, R., & Roos, L. L. (2008). Short-, medium-, and long-term consequences of poor infant health: An analysis using siblings and twins. Journal of Human Resources, 43(1), 88–138. doi:10.3368/jhr.43.1.88
- Parker, M. E., Mosites, E., Reider, K., Ndayishimiye, N., Waring, M., Nyandimbane, G., … Matthias, D. (2015). A blinded, cluster-randomized, placebo-controlled school feeding trial in Burundi using rice fortified with iron, zinc, thiamine, and folic acid. Food and Nutrition Bulletin, 36(4), 481–492. doi:10.1177/0379572115615234
- Paxson, C. H. (1992). Using weather variability to estimate the response of savings to transitory income in Thailand. The American Economic Review, 82, 15–33.
- Paxson, C. H., & Schady, N. (2007). Cognitive development among young children in Ecuador. Journal of Human Resources, XLII(1), 49–84. doi:10.3368/jhr.XLII.1.49
- Prayon, V. (2014). Contributions to the discussion on the determinants of long-term human capital development in today’s developing regions (Doctoral Dissertation). University of Tuebingen. https://bibliographie.uni-tuebingen.de.
- Schlenker, W., & Lobell, D. B. (2010). Robust negative impacts of climate change on African agriculture. Environmental Research Letters, 5(1), 014010. doi:10.1088/1748-9326/5/1/014010
- Stock, J. H., & Yogo, M. (2005). Asymptotic distributions of instrumental variables statistics with many instruments. In D. W. K. Andrews & J. H. Stock, Identification and inference for econometric models: Essays in honor of Thomas Rothenberg (pp. 109–120). Cambridge: Cambridge University Press.
- Stolz, Y., Baten, J., & Botelho, T. (2013). Growth effects of nineteenth-century mass migrations: “Fome Zero” for Brazil? European Review of Economic History, 17(1), 95–121. doi:10.1093/ereh/hes019
- Tan, J. P., Lane, J., & Coustere, P. (1997). Putting inputs to work in elementary schools: What can be done in the Philippines?. Economic Development and Cultural Change, 45(4), 857–879. doi:10.1086/452310
- World Bank. (2022). Employment in agriculture (% of total employment) (modeled ILO estimate) – Sub-Saharan Africa. Retrieved from https://data.worldbank.org/indicator/SL.AGR.EMPL.ZS?end=2000&locations=ZG&start=1991 [last accessed 19 January 2022].
Appendix
Data sources
IPUMS has data for 26 Sub-Saharan African countries available. Between one and five censuses are available per country (Table S.1a). Moreover, the census data are also representative at the subnational level. Age of the respondent and several socioeconomic variables are included.
MICS (by UNICEF) in developing/emerging economies since the 1990s. These household-based surveys mainly focus on issues affecting women and children. MICS has added modules for men (third/fourth round) for some countries. We only employ surveys that include the module for women and men (Table S.1b). Data is available for 21 Sub-Saharan African countries (one to three surveys per country). Age, education, socioeconomic background and female empowerment are included.
DHS (by USAID since the late 1980s). We use surveys for Sub-Saharan Africa for which both a female and male module is available, and which provide geo-coded information which results in 34 countries (Table S.1c, one to five surveys per country). Information on literacy, education, socioeconomic background, health, anthropometric data, and female empowerment is included. Unfortunately, the age data is not useful for our analysis of age misreporting, as the enumerators are trained to ensure that the stated age is correct instead of the respondent’s estimate.
AB surveys (since the late 1990s). Age and cover questions regarding public attitude towards governance, democracy, and the economy. Seven rounds are available with the broadest country coverage in the later rounds (Table S.1d, 33 countries; one to seven surveys per country).
Table A.1. Data set construction overview
Table A.2. Geographic control variables
Potential biases of age-heaping-based numeracy estimates
The ABCC Index is a popular method in economic history to estimate numeracy. However, the ABCC Index can potentially have biases which are addressed extensively in Ferber and Baten (Citation2023). We provide a comprehensive summary. We conclude that the ABCC Index is a suitable numeracy proxy in SSA without strong biases.
The database as well as the methodology for estimating the Whipple and the ABCC Index are the same as in this study.
Prior to addressing methodological concerns, the study seeks to bolster the ABCC Index’s credibility as a numeracy proxy in SSA by comparing age heaping patterns of older generations with math scores of their children. Using the latest MICS round which includes short math tests for children aged seven to fourteen across 12 countries, the authors examine the correlation between children’s math scores and their caretakers’ ABCC scores, both at the regional and the household level. A positive and highly significant correlation emerges, demonstrating that regions with low numeracy in parents also exhibit poorer math performance in their children. The correlation coefficient is as large as 0.67 (p = 0.00). Moreover, for the least numerate countries (Chad, Sierra Leone and Togo) an analysis at the household level shows that caretakers’ age statements with the terminal digits 0 or 5 are significantly correlated with lower math test performance of children. These findings confirm the suitability of age heaping-based numeracy estimation in SSA.
We now turn to the potential biases that have been discussed in the literature before.
Respondent bias
A potential concern in surveys is that a husband or male relative might answer questions on women’s behalf. However, MICS surveys, designed to capture women’s and children’s insights, provide confidence in women’s self-responses, while IPUMS or AB do not specifically target either gender. To verify, Ferber and Baten (Citation2023) compare ABCC Index based on IPUMS and AB data against MICS data, re-estimating the index separately by gender. A regression equation incorporates data source and gender dummies. The findings show no significant respondent bias in IPUMS, and only a minor bias in AB data.
Marriage bias
Another concern is that married women may adjust their reported ages to match their spouses’, potentially leading to an unintentional boost in the estimated numeracy levels of married women due to men’s on average higher numeracy. The authors re-estimate ABCC Index by gender and marital status, comparing single, in union, separated/divorced, and widowed individuals. Contrary to concerns, the results do not support a marriage bias.
Ageing bias
Thirdly, there is some concern that people heap more as they age such that they would appear to be less numerate in their fifties than in their thirties. If this were accurate, older birth cohorts would inherently seem less numerate (and not because they went to school in a period of lower education). To address this concern, the authors estimate the ABCC Index for different age groups within birth decades. Comparing numeracy estimates at various life stages, the results show no significant downward trend.
Enumerator bias
Enumerators’ potential age-checking bias is considered by comparing ABCC Index between overlapping IPUMS, AB and MICS data. A model with a data source dummy is estimated to detect bias. Results reveal a small bias in MICS data but not in AB data. Consequently, the MICS-derived ABCC Index is corrected by the estimated bias.
Alternative heaping patterns
Concerns about Whipple Index’s sensitivity to heaping patterns beyond zero and five are explored. Manual inspection of the data reveals some heaping on the digits two and eight in some countries. The authors estimate an alternative index that accounts for this heaping pattern and compare it to our original one. They only find minor differences between the ABCC Indices and the original ABCC Index also correlates more strongly with education indicators such as years of schooling and literacy.
Descriptives
provides summary descriptive statistics for our main variables. All estimates are at the subnational region level and per birth decade. On average, the ABCC index is about 83. However, numeracy varies between less than 30 and 100 percent. Our measure of education efficiency (in logs) is on average about 0.23. Moreover, years of schooling has a mean of 5 years in the sample.
Table A.3. Summary statistics
The relationship between the ABCC Index and average years of schooling in our sample is assessed in . We observe a positive relationship. The error bars indicate that there is quite some variation in each category – the efficiency of the education system differs substantially between regions.
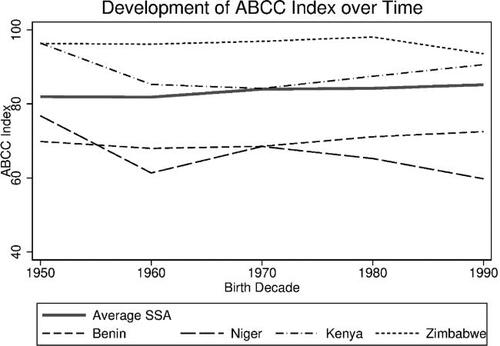
Numeracy across the continent and in some sample countries increased only modestly (.). Niger even shows a declining trend. This seems to contradict , as the increase in school years should have resulted in more numeracy. However, the relationship in depends mostly on cross-sectional variation, while the effect on numeracy over time was quite limited (and similarly the effect on literacy, see Ferber et al., 2023).
Figure A.2. Development of numeracy over time for selected countries – Benin, Niger, Kenya, and Zimbabwe. The average refers to all Sub-Saharan African countries included in the data set. Source: IPUMS, MICS and Afrobarometer. Authors’ own representation.