
 ?Mathematical formulae have been encoded as MathML and are displayed in this HTML version using MathJax in order to improve their display. Uncheck the box to turn MathJax off. This feature requires Javascript. Click on a formula to zoom.
Abstract
The author of this article uses two empirical approaches to compare online to face-to-face proctored assessment. Using data from a Dutch economics program, he shows that the relationship between grades and human capital variables remains highly significant for courses with online proctored examinations. Additionally, a search for suspicious grade patterns does not indicate an increase in cheating. Overall, the findings do not provide convincing evidence that online proctored assessment is more conducive to cheating than assessment using face-to-face proctoring. In view of the increasing evidence that unproctored online assessment may suffer from high levels of cheating, this suggests that educational institutions can reduce the risk of cheating by using online proctoring.
Even before the COVID-19 outbreak, online learning in higher education grew rapidly. Seaman, Allen, and Seaman (Citation2018) report that in 2016, almost one-third of U.S. college students took at least one online course. The pandemic has accelerated this trend by forcing institutions of higher education to switch to online delivery in the spring of 2020. In most cases, this switch included assessment, given the difficulty of maintaining the traditional way of on-campus testing under a lockdown or a social distancing regime. Across the world, schools and universities thus faced the immediate challenge of maintaining the integrity of their assessment after abruptly abandoning their familiar and trusted assessment environment. This development has put to the fore the issue of the validity of online assessment.
In the midst of the pandemic, most educational institutions have been able to maintain the continuity of their assessment by finding alternatives for student-packed exam halls. In a few cases, tests have been organized in larger proctored physical venues, such as football stadiums, to comply with social distancing rules. For small programs, oral examination via video-conferencing tools has been a viable proctored alternative. Programs also have considered nonproctored alternatives, such as take-home exams, written assignments, and unproctored online tests, possibly supplemented by oral examinations. In many cases, however, programs have tried to stay close to their familiar testing format by using webcam recording software to substitute online for in-person surveillance. The choice among these alternatives may depend on program characteristics. For example, conducting oral examinations or grading individual papers may be too costly for large programs. The choice is also determined by concerns about academic integrity and, more specifically, the potential increase in academic dishonesty when programs move to online assessment.
Academic integrity is one of the issues that determine whether online assessment is an effective alternative to traditional modes of assessment (Oosterhof, Conrad, and Ely Citation2008; Gikandi, Morrow, and Davis Citation2011). Among educators, the feeling is widespread that an online environment is more conducive to academic dishonesty (Mellar et al. Citation2018). In the literature, however, a consensus on whether online assessment increases cheating has yet to emerge. Two recent studies illustrate the lack of consensus. Examining self-reported cheating behavior, Harris et al. (Citation2020) find that online students do not report academic misconduct more often than students at residential universities. They conclude that their research “confounds the common (mis)perception that cheating is more prevalent and easier to accomplish in online learning and assessment” (419). In stark contrast, Bilen and Matros (Citation2021) report on rampant cheating in online assessment following the outbreak of COVID-19 in the spring of 2020.
Based on the weight of the current evidence, educational institutions wanting to maintain the integrity of their assessment cannot ignore the risk of cheating in unproctored online assessment. This explains the demand for online proctoring (OP) services, which are currently being offered by commercial vendors. OP makes use of a webcam to monitor the student during the examination. A big advantage over unproctored assessment is that it allows for identity authentication and prevents students from hiring the services of an expert substitute. The webcam may also capture suspicious behavior suggesting communication with others or the unauthorized consultation of resources. OP is, however, not a perfect substitute for face-to-face proctoring (F2FP). A recent report by SURF, a Dutch partnership of academic institutions on information and communication technology (ICT) issues, discusses the security concerns (SURF [Samenwerkende Universiteiten RekenFaciliteiten] Citation2020). For those students willing to cheat, the opportunities for cheating with OP are wider than in the setting of a proctored exam hall.
OP offers educational institutions an easily adoptable and low-cost solution to the problem of online assessment, provided that the risk of cheating is not too high compared to traditional testing. For most institutions, the relevant question is not whether OP is as good as F2FP but whether it is good enough to maintain confidence in the integrity of assessment.
Moving from F2FP to OP raises other concerns unrelated to academic integrity. Many students perceive the use of webcam recording in their home environment as an invasion of their privacy. The dependence on technology also makes OP assessment more vulnerable to connectivity issues and technical glitches, further increasing the levels of stress and anxiety during exam sessions that, for most students, are already intrinsically stressful. In addition, not all students may have the quiet home environment that is needed for optimal concentration and performance during an online examination. In addition to academic integrity, these factors may result in test outcomes that do not reflect students’ potential performance under F2FP and may thus compromise the reliability of assessment.
To date, most research on academic dishonesty in online assessment has focused on comparing unproctored online assessment with proctored assessment. For educational institutions unwilling to adopt unproctored online assessment, the more relevant policy question is whether OP is an acceptable substitute for F2FP. Therefore, we compare outcomes under OP and F2FP. To this end, we apply two methods that have been used previously to detect cheating in higher education. We first use the model of Harmon and Lambrinos (Citation2008) (from here on denoted as HL), which relates grades to student characteristics measuring their human capital. If the link between grades and human capital variables were much weaker under OP (compared to F2FP), this would raise doubts about the reliability of OP assessment. We additionally employ an algorithm for detecting suspicious grade patterns that was originally developed by Jacob and Levitt (Citation2003) (from here on denoted as JL) to identify cases of teacher cheating on standardized tests. The JL approach yields standardized scores, which can be compared across courses and cohorts.
While a severed link between grades and student characteristics using the HL approach and high scores using the JL approach may be suggestive of academic dishonesty, they fall short of delivering proof. Both methods offer, at best, indirect evidence of academic dishonesty and lack the rigor of an experimental design or direct observation of attempts to cheat. Unlike in a randomized controlled experiment, differences between OP and F2FP testing may result from variations in the environment in which education and testing are organized. In the context of OP, a weaker relationship between grades and student characteristics might as well be explained by increased stress and anxiety during OP exam sessions for reasons discussed above. With this important caveat in mind, we formulate our research questions as follows:
Has the move from F2FP to OP testing following COVID-19 weakened the relationship between grades and student characteristics?
Has the move from F2FP to OP testing affected the distribution of JL scores?
These formulations should convey that our objective is to look for changes in statistical patterns in moving from F2FP to OP and that we should be careful in interpreting any statistical deviations between F2FP and OP as evidence of cheating. We investigate these research questions using a large dataset of economics students from a research university in The Netherlands.
Literature review
The literature on cheating in online assessment is a small but growing subset of the literature on academic integrity in general. Holden, Kuhlmeier, and Norris (Citation2021) provide a recent review of research in this area. Academic dishonesty cannot be ignored as a minor problem, as estimates of its prevalence range from 9 percent to 95 percent (Whitley Citation1998; McCabe, Treviño, and Butterfield Citation2001). Passow et al. (Citation2006) and Nowell and Laufer (Citation1997) discuss the determinants of cheating, while Kerkvliet and Sigmund (Citation1999) investigate the effectiveness of measures to prevent cheating.
A widely debated issue is whether online assessment is more conducive to cheating than assessment using F2FP due to the absence of face-to-face contact between the student and the instructor (Kennedy et al. Citation2000; McNabb and Olmstead Citation2009; Fontaine Citation2012). Most studies assume that online assessment is unproctored, as the widespread adoption of OP is a recent trend. Unproctored online assessment suffers from the lack of identity authentication of students and the lack of monitoring of unauthorized cooperation and consultation of learning resources (Khare and Lam Citation2008; Harmon and Lambrinos Citation2008; Moten et al. Citation2013). Following the old adage that “opportunity makes the thief,” many instructors feel that academic dishonesty is more of a problem in unproctored online assessment than in traditional assessment (Hard, Conway, and Moran Citation2006; McNabb and Olmstead Citation2009; Fontaine Citation2012; Newton Citation2015; Mellar et al. Citation2018). The review of Hollister and Berenson (Citation2009) concludes that maintaining the integrity of assessment is the most reported challenge in distance learning. Based on two simple models of F2FP and unproctored online examinations, Bilen and Matros (Citation2021) conclude that higher levels of cheating should be expected in an online environment. They also note that academic dishonesty in unproctored online tests imposes a negative externality on honest students, which argues against the use of grading on the curve in online assessment. However, other studies have downplayed the risk of academic dishonesty in online assessment (Oosterhof, Conrad, and Ely Citation2008; Gaytan and McEwen Citation2007; Duers and Brown Citation2009). Kennedy et al. (Citation2000) and Yates and Beaudrie (Citation2009) argue that instructors’ concerns about cheating in online assessment result from a lack of experience in online teaching. Khare and Lam (Citation2008) argue that academic integrity may be related to students’ maturity. As students advance in their studies, they may be more intrinsically motivated to master the field of study in which they want to pursue a career. This would imply that (post-)graduate students have a lower inclination to cheat than undergraduates.
Several studies employ student surveys to measure the prevalence of cheating in online assessment. These studies either report students’ general views about the prevalence of cheating or students’ own behavior. In the latter case, one can question whether students will always self-report their cheating truthfully. The evidence from student surveys is mixed. According to Vician, Charlesworth, and Charlesworth (Citation2006), 40 percent of students think that online assessment is more conducive to cheating, whereas 42 percent see no difference with F2FP assessment. The latter percentage is even higher (59%) in the survey by Harmon, Lambrinos, and Buffolino (Citation2010). In a survey of 800 students, Grijalva, Nowell, and Kerkvliet (Citation2006) find no difference in cheating between unproctored online and F2FP assessment. Based on self-reported evidence, Stuber-McEwen, Wisely, and Hoggatt (Citation2009) find that online assessment is less conducive to cheating. Again using self-reported behavior, Harris et al. (Citation2020) find that students at an online university are no more likely to cheat than students in residential education. They also find that cheating decreases with student age. However, Stephens, Young, and Calabrese (Citation2007) and Watson and Sottile (Citation2010) find more evidence of unauthorized collaboration and the unauthorized use of notes in online assessment. In addition, a survey by Berkey and Halfond (Citation2015) finds that 84 percent of 141 students agreed that academic integrity in online assessment is a significant issue. King, Guyette, and Piotrowski (Citation2009) report that 73 percent of 121 students think that online assessment is more conducive to cheating than F2FP testing. Surveyed students also indicated that they were more than four times as likely to cheat in an online class. Mirroring the results for instructors, Kennedy et al. (Citation2000) report that students’ participation in online education reduces their estimates of the prevalence of cheating in online assessment. The recent study by Janke et al. (Citation2021) reports the results of a nationwide student survey in Germany following the shift from on-site to online examination due to COVID-19. Based on responses from more than 1,000 students, they conclude that students cheat more frequently in online than in F2FP exams. Their paper does not, however, provide information on the use of OP. Regarding the effectiveness of OP in discouraging cheating, a recent survey by Paredes, de Jesús Jasso Peña, and de La Fuente Alcazar (Citation2021) among 106 students indicates that 58 percent of students think that OP exams will stimulate students to behave more honestly.
Given the doubts about the reliability of students’ self-reported cheating, researchers have examined academic integrity using statistical models or experimental designs. Based on a statistical analysis of grades, Hollister and Berenson (Citation2009) and Yates and Beaudrie (Citation2009) find no difference in academic dishonesty between unproctored online assessment and F2FP assessment. Englander, Fask, and Wang (Citation2011) criticize the approach of Yates and Beaudrie (Citation2009) by pointing to their failure to take student ability into account. Ladyshewsky (Citation2015) finds no difference between unproctored online tests and F2FP tests in a statistical grade analysis. Comparing OP with unproctored online assessment, Alessio et al. (Citation2017) find that students scored 17 points lower and used less time under OP. Bilen and Matros (Citation2021) try to detect cheating by using access logs in Blackboard to monitor the time that students spend to correctly answer “not-so-trivial” problem-solving questions. For unproctored online tests, students spend much less time on each question than for F2FP tests, suggesting the use of online resources or private tutors. Rampant cheating in online assessment was found by Corrigan-Gibbs et al. (Citation2015). Using innovative detection techniques based on the analysis of wording and the tracking of IP addresses, they find that 26 to 34 percent of students in a massive open online course look up answers online.
A more elaborate methodology to detect cheating is to estimate regression models in which students’ grades are explained by variables measuring their human capital or academic potential and to compare the explanatory power under different testing regimes (Anderson, Benjamin, and Fuss Citation1994; Brown and Liedholm Citation2002; Coates et al. Citation2004). The idea is that academic dishonesty would distort the relationship between grades and academic potential and lower the explanatory power of the regression model. Harmon and Lambrinos (Citation2008) employ this approach to compare grades for two online courses, one of which uses unproctored assessment and the other uses proctored assessment. They find that the explanatory power is significantly lower in the case of unproctored assessment, suggesting a higher prevalence of academic dishonesty. Using the same methodology, Beck (Citation2014) fails to find any difference between proctored and unproctored assessment and argues that variable selection and test design may account for the conflicting findings. The number of observations in these studies is, however, quite small (less than 100 students per test). Recent applications of this approach are Arnold (Citation2016) and Dendir and Stockton Maxwell (Citation2020). Arnold (Citation2016) finds that the ability of student characteristics to explain the variation in unproctored test grades is slightly lower than their ability to explain proctored test grades. Adding an application of the Jacob and Levitt (Citation2003) algorithm to detect suspicious grade patterns, he concludes that unproctored online tests are more conducive to cheating than proctored tests. Dendir and Stockton Maxwell (Citation2020) conduct a quasi-experiment comparing unproctored online testing with OP testing in two online courses. They find that OP is associated with a decline in grades in both courses. In regression models using student characteristics, the explanatory power is also higher under OP.
Fask, Englander, and Wang (Citation2014) use an experimental design to compare F2FP and unproctored online examinations. On a practice test, online students scored 14 percent lower than students using F2FP. On the actual summative test, however, online students did 10 percent better. The authors conclude that the greater opportunities to cheat on an online test are somewhat offset by the disadvantages of an online test environment. Karim, Kaminsky, and Behrend (Citation2014) designed an experiment in which 295 participants from Amazon’s Mechanical Turk were randomly assigned either to an OP test or to an unproctored online test using an honor code. They show that OP is effective in reducing cheating compared to unproctored testing. Vazquez, Chiang, and Sarmiento-Barbieri (Citation2021) conducted two field experiments to examine the effects of proctoring on grades using two different classroom settings (face-to-face and online). In a face-to-face class with 426 students, students had to take a combination of unproctored and F2FP tests; in an online class with 83 students, a combination of unproctored and OP tests was used. Scores on unproctored tests were on average 11 percent higher than those in proctored tests. Interestingly, for the purpose of this article, the use of F2FP had a larger effect on test scores than the use of OP. Finally, Wuthisatian (Citation2020) compares grades for an economics course offered in two proctored environments: OP and F2FP. He finds that grades are significantly lower in the OP environment and attributes this to students’ unfamiliarity with the procedures and requirements of OP testing.
In contrast to much of the literature, the current study compares OP to F2FP. We first employ the HL regression model using a sample of 300 to 600 students per course. We hypothesize that greater cheating during OP exams would lead to a weaker relationship between grades and explanatory variables. This would manifest itself in less significant coefficients and a lower explanatory power for OP courses compared to F2FP courses. Next, we apply the JL algorithm to detect suspicious grade patterns and compare the distributions of JL scores across courses.
Setting, data, and method
Setting
This study was conducted at a research university in the Netherlands that offers a variety of programs in the field of economics and econometrics. We use data from the main bachelor program in economics and business over the period 2015–21. The nominal duration of this program is three years. The program offers students a general background in economics before they choose to specialize in a subfield in their final year. The first two years consist of obligatory core and support courses. We focus on first- and second-year courses, as these contain the highest number of observations per course. describes the curriculum in the first two bachelor years in the academic year 2019–20. Note that the Dutch lockdown started in March 2020, after the module 3 examinations.
Table 1. Curriculum BSc Economics and Business, bachelor years 1 and 2.
Each bachelor year consists of courses totaling 60 credits and is organized into five eight-week modules of twelve credits each. Due to a curriculum revamp, the curriculum offered in 2019–20 is not identical to that in prior years. In the analysis below, we focus on courses that were offered during the whole sample period, that showed no major variations in assessment method, and that used proctored individual exams as their principal means of assessment.
We use two indicators of prior performance to measure the human capital of students. The first is high school GPA, which is often used in the literature as a measure of student quality. Due to incomplete high school records, the use of school GPA severely reduces the number of observations in our sample. A further disadvantage of school GPA is that it is recorded in integer values in the research database, which reduces the variability of this measure. Where possible, we therefore use a second measure of prior performance based on grades for prior bachelor courses with F2FP examinations. For our analysis of bachelor-1 courses, we use the average grade for two courses in the first module, Accounting and Mathematics 1, to measure the human capital of students. Note that we cannot do this for the academic year 2020–21, as all bachelor-1 courses switched to OP in that year. For our analysis of bachelor-2 courses, we use the average of five F2FP bachelor-1 courses to measure human capital. These courses are indicated in with superscript b. As these five courses used F2FP in 2019–20, they can be used in the analysis of bachelor-2 courses in 2020–21.
We include two courses in modules 4–5 from the bachelor-1 curriculum that switched from F2FP examination in large exam halls to OP in 2019–20: Mathematics 2 (denoted Math2) and Organization and Strategy (denoted O&S). Five courses in modules 1–3 switched to OP in 2020–21: Accounting (denoted Account), Mathematics 1 (denoted Math1), Microeconomics (denoted Micro), Macroeconomics (denoted Macro), and Statistics1 (denoted Stats1). The courses Behavioral Economics and Philosophy of Economics are new in the 2019–20 bachelor-1 curriculum and therefore are not considered. The skills courses (ICT skills and Academic Skills) use different modes of assessment.
We include two courses in modules 4–5 from the bachelor-2 curriculum that switched from F2FP to OP in 2019–20: Introduction to Econometrics (denoted IntroEctrics) and Intermediate Accounting (denoted IntermedAccount). Four courses in modules 1–3 switched to OP in 2020–21: International Economics (denoted InterEcon), Finance (denoted Finance), Applied Microeconomics (denoted AppMicro), and Statistics2 (denoted Stats2). The courses Economics of Taxation, History of Economic Thought, and Research Project were not included due to a different mode of assessment or to major variations in assessment during the sample period. Behavioral Economics was moved from bachelor-2 to bachelor-1 and is therefore not considered. In total, we include 13 courses in the analysis.
Regarding delivery, most courses use a combination of large-scale plenary lectures and small-scale tutorials. Attendance at tutorial sessions is mandatory for bachelor-1 courses. Attendance at tutorials is optional, not registered, and typically low for bachelor-2 courses. At least 70 percent of the grade is determined by a proctored individual final exam for the courses selected for the empirical analysis. These final exams either use open questions (for 8 out of 13 courses), multiple choice questions (for 4 out of 13 courses), or a mixture of open and multiple choice questions (1 course).
Regarding the remaining 30 percent of the grade, five courses use midterm tests, three courses use assignments, and two courses use a combination of midterms and assignments. For two courses, the final exam has a weight of 100 percent. For the bachelor-1 course O&S, 30 percent of the grade consists of a paper written by two students. All midterm tests have been organized with proctoring, either using F2FP before, or OP after, the lockdown. Grade components are not separately recorded in the database of the university, which precludes an analysis on the final exam grades only. Regarding the midterm tests, this is not a major problem, as these have moved from F2FP to OP in tandem with the final exams. Regarding assignments, we must keep in mind that their use may lead to differences in the explanatory power of the regression model across courses. For this reason, we will primarily look at time variation in the explanatory power of the regression model per course. Grading follows the Dutch system, in which grades are determined on a 1–10 scale. A grade of 8 or higher corresponds to an A, a grade of 7 to a B. The cutoff score for passing is 5.5. The examination rules allow for compensation, to the effect that three failed grades (between 4.5 and 5.5) can be compensated by higher grades for related courses. Resits are limited to a maximum of three out of ten courses and are scheduled during the summer break. The empirical analysis below uses grades before resits to ensure that students sat for the same exam.
On March 13, 2020, at the end of the second week of module 4, universities were ordered by the Dutch government to close their campuses and switch to online education. From that day onwards, tutorials were organized using Zoom and plenary lectures using Panopto streaming or webcasts (using various software solutions). The examinations also moved online, using third-party e-assessment solutions (either Remindo for standard exams, the Dutch software ANS for exams requiring the use of mathematical notation, or the Dutch software Sowiso for accounting exams). In line with university recommendations, the duration of the online final exam was reduced from three to two hours, and the number of questions was proportionally reduced (for a multiple choice exam, the number of questions was reduced from 40 to 25). Exam questions are created by instructors. Students take the exams simultaneously and have the same set of questions; all exams either use multiple exam versions with a different question order or present the questions in a random order (depending on the software) to reduce cheating. OP was sourced from ProctorExam, a leading commercial provider of OP services in Europe. ProctorExam uses live proctors to monitor student behavior during the examination through the webcam. Students are also required to make a webcam scan of their room before the start of the exam. Live proctors flag suspicious behavior or violations of the rules and report to the school’s examination committee. After reviewing flagged webcam recordings, the examination committee can decide to take disciplinary measures after giving the student a fair hearing.
Data
We use data from six cohorts (2015–16 through 2020–21). Grades and data on students’ background characteristics are taken from the education research database of the university. In line with privacy regulations, the data have been anonymized. The literature on study success in economics identifies several explanatory variables. Academic performance in preparatory education, either in mathematics or more generally, is a prime determinant of student retention in economics programs (Ballard and Johnson Citation2004; Johnson and Kuennen Citation2006; Lagerlöf and Seltzer Citation2009; Arnold and Straten Citation2012). Variables that measure performance at secondary school would therefore be suitable as human capital variables in our regression model. Our dataset contains high school GPA, which we use as a measure of students’ human capital. As the coverage is incomplete, we use students’ performance in prior bachelor courses as an additional measure of their human capital. Both high school GPA and prior bachelor grades may reflect factors that are important for study success, such as students’ human capital, motivation, and/or self-efficacy. In the past, male students were thought to be better at economics due to their supposedly better math aptitude (Ballard and Johnson Citation2004). A recent survey by Johnson, Robson, and Taengnoi (Citation2014) concludes that the negative gender gap, in which female economics students perform less well than male students, has been closed over time. We include students’ gender in the regression model to account for a possible gender gap.
In much of the literature on study success, student age is an explanatory variable. We hypothesize a negative relationship between age and grades, as in the Dutch context a higher age at enrollment usually results from study delay at high school. Our regression model also accounts for possible tutorial group effects. Group effects may result for a variety of reasons, all based on the assumption that students in the same tutor group have higher social and academic integration. For courses that use assignments, this may result in close cooperation among group members in making unproctored assignments. Peer effects may also arise when high-performing students increase the learning experience for all students in the tutor group or vice versa. If OP assessment increases the opportunities for cheating through unauthorized collaboration, this could also increase group effects. Students may prefer to cheat with fellow students they know, possibly from their own tutor group.
provides descriptive statistics, making a distinction between the COVID-19-impacted cohorts and the earlier cohorts. The total number of students who enrolled in the program during our sample period is 5568, of which 1849 enrolled in the two COVID-19 cohorts. The first rows of show that the student composition of the COVID-19 cohorts is very similar to that of earlier years. Age, gender, and high-school GPA (denoted GPA(School)) in 2019–20 do not differ significantly from prior years. On average, students enroll at an age of 18.6 years; 30 percent of freshmen are females. Data on high-school performance are available for 3624 students, which leads to a considerable reduction in the sample size. The means for GPA(School) indicate that the academic potential of the COVID-19 cohorts is not significantly different from that of earlier cohorts.
Table 2. Descriptive statistics.
The remainder of reports the mean grades for the bachelor courses that have been selected for empirical analysis. Due to a sizable no-show for individual exams, differences in the number of observations across courses arise. In general, exam participation drops during the academic year. The main driver of this is student dropout during the academic year. To prevent the absence of students who drop out early from biasing the results for courses that take place later in the academic year, the empirical analysis below includes only students who have been active during the whole academic year, measured by their participation in module 5 exams. For bachelor-2 courses, the number of observations is smaller due to first-year dropouts. For each course in , a distinction is made between the mean grades on F2FP and OP examinations. A t-test for the difference between the means is also reported. For seven out of thirteen courses, mean grades in OP courses differed significantly from mean grades in F2FP courses at a 5 percent significance level. Compared to F2FP examinations, mean grades in OP examinations were significantly higher for IntroAccount, Micro, O&S, and IntermedAccount, but lower for Stats2, Math2, and IntroEctrics. No general pattern emerges from these statistics. As test difficulty can vary across cohorts, it is not possible to draw firm conclusions from these statistics.
Method
EquationEquation (1)(1)
(1) shows the specification of our regression model:
(1)
(1)
where Gradei,j,t denotes the grade of student i in course j in year t and εi,j,t denotes a random disturbance term. PriorPerfi,tdenotes the prior academic performance of student i in year t. It is measured in three ways. We estimate regressions using GPA(School) as the performance measure for all courses. For bachelor-1 courses, we add regressions using the average grade of the module-1 courses Math1 and Account as the prior performance measure. These are labeled as module-1 grades in . For bachelor-2 courses, we add regressions using the average grade of the bachelor-1 courses Math1, Account, Micro, Macro, and Stats1 as the prior performance measure. These are labeled as bachelor-1 grades in . The module-1 and bachelor-1 grades used to measure prior performance are all based on F2FP assessment. We hypothesize that high values for PriorPerfi,t indicate the presence of more human capital and/or a stronger motivation to study economics and would result in higher grades for subsequent courses. This would imply that the coefficient β1 is significantly positive. The dummy variable Genderi,t takes on the value 1 for female and 0 for male students. Agei,t measures student age. The dummy variables Groupi,g,t take on the value 1 if student i is assigned to tutorial group g and 0 otherwise. A tutorial group dummy is included when at least 5 out of 25 group members are in the sample, as lower numbers may not provide a reliable estimate of the group effect. The summation runs from g = 1 to G − 1, where G is the number of groups included in the regression.
Table 3. Summary of regression models for Bachelor-1 courses.
Table 4. Summary of regression models for Bachelor-2 courses.
Table 5. Goldfeld-Quandt tests, OP vs. F2FP cohorts.
Table 6. Summary of regression results for academically weaker students.
EquationEquation (1)(1)
(1) is estimated using Ordinary Least Squares (OLS). The R-squared statistic indicates the explanatory power of the regression model and has been used as an indication of cheating in the literature. The tighter the fit between human capital variables and grades, the more likely it is that these grades derive from students’ own ability instead of from cheating. We examine the significance of the differences in explanatory power between F2FP and OP cohorts using the Goldfeld-Quandt test. The Goldfeld-Quandt statistics are calculated excluding group effects, as these do not measure an individual student characteristic. We add two robustness checks to the regression analysis. First, we restrict the sample to bottom quartile students based on prior bachelor grades. Students in the lowest quartile run a higher risk of dropping out. With more “at stake,” the temptation to cheat may be higher. A related robustness check restricts the sample to students with GPA(School) equal to 6 (which is the lowest value). Second, we check for an interaction effect between gender and prior performance. If one of the sexes is more prone to cheating, this could result in a significant coefficient on the interaction term.
The presence of insignificant coefficients and a low R-squared in estimates of Equationequation (1)(1)
(1) may suggest cheating. However, as discussed in the introduction, there may be other reasons for a weakening of the link between grades and human capital variables in OP examinations. In addition, the regression output does not measure the likelihood of cheating at the level of individual students. We therefore apply the JL algorithm to generate scores that may be indicative of cheating at the student level. The original JL paper aims to identify teacher cheating on standardized tests, following the introduction of incentives for schools to improve their test performance. In this context, the JL score measures the gain in the test score of a class (compared to the previous year) and ranks this gain relative to the gains of other classes. Arnold (Citation2016) adjusts the formula by taking the student instead of the class as the unit of observation and by defining the gain relative to prior academic performance. In this article, we use prior bachelor grades as our measure for prior performance. For bachelor-1 courses, we use the average grade of the module-1 courses Math1 and Account; for bachelor-2 courses, we use the average grade of the bachelor-1 courses Math1, Account, Micro, Macro, and Stats1. In our application, we compare the ranked gain for an OP course with the ranked gain for an F2FP course. These choices result in the following formula:
(2)
(2)
where Scorei,OP,F2FP is the JL score for student i when comparing an OP course with an F2FP course. The term rank_gaini,OP measures the percentile rank of student i’s performance gain for a course using OP examination, where the gain is measured as the grade differential with the average of prior bachelor grades and the gain’s percentile rank is determined within the student population of the course. Rank_gaini,F2FP measures the corresponding variable for a course using F2FP examination. When student i has a large gain on an OP examination but a small gain on F2FP examination, this will result in a high value of Scorei,OP,F2FP. In case a student has the highest percentile rank for the OP examination and the lowest for the F2FP examination, Scorei,OP,F2FP will attain its maximum value of 2. In the reverse case, the value will be 0. The squares in Equationequation (2)
(2)
(2) have the effect of giving more weight to large differences between the gains for OP and F2FP examinations, allowing the measure to pick up suspicious patterns better. Both the standardization in a range between 0 and 2 and the increased weight for outliers are advantages of the JL score over simpler measures, such as the difference between grades on OP and F2FP examinations.
Comparing unproctored and F2FP tests, Arnold (Citation2016) finds that the distributions of JL scores for unproctored tests exhibit much fatter upper tails, signaling suspicious grade patterns. The application of this method requires the observation of students in both an OP and an F2FP environment, preferably in a time window that is not too long. We therefore calculate JL scores only for the 2019–20 academic year.
We would like to stress that our use of the JL score does not implicate individual students in dishonest behavior. While a high value for Scorei,OP,F2FP raises the suspicion of academic dishonesty in OP examination, it does not constitute proof. As discussed above, other factors related to OP may compromise the reliability of assessment. ICT issues and the lack of an optimal exam environment at home may increase students’ stress levels and reduce their ability to concentrate on the exam. These factors may weaken the link between students’ performance in an OP examination and their academic potential. As such, they offer an alternative explanation for a decrease in the explanatory power of the regression model in Equationequation (1)(1)
(1) . It is, however, more difficult to see how these factors could give rise to high JL scores. This would require students with high-ranked gains on F2FP examinations to suffer disproportionately from the stress and anxiety of OP examinations, moving students with low-ranked gains on F2FP examinations up on the OP ranking. Nevertheless, individual students may be sensitive to the difference in testing format or may have suffered a blackout during the F2FP examination, which may explain their high JL score. Therefore, we will not look at individual scores but at patterns in the distribution of the JL scores.
Results
Regression models
and report a summary of the estimation results of Equationequation (1)(1)
(1) for, respectively, bachelor-1 and bachelor-2 courses by course and academic year. We do not lump the pre-COVID years together as the results by year give an indication of the variation in coefficients and R-squared unrelated to COVID-19. The coefficients of Gender and Age and the group effects are not reported but will be briefly summarized to conserve space. In 41 out of a total of 139 regressions, Gender is significant at a 5 percent level. In the majority of these cases, β2 has a positive value, providing further evidence against the notion that female students are worse at economics. In 19 out of 139 regressions, the coefficient for Age has the hypothesized negative sign, which is significant at a 5 percent level. In five regressions, β3 is significantly positive.
Regarding group effects, the LR-statistics indicate that these are jointly significant in most regressions (in 60% of all regressions when using a 5% significance level). There is no clear distinction between F2FP and OP courses. For the bachelor-1 courses in , group effects are more often jointly significant in OP courses than in F2FP courses (in 73% of OP courses vs. 59% of F2FP courses). The reverse holds for bachelor-2 courses (in 31% of OP courses vs. 70% of F2FP courses). Taken together, group effects are more often jointly significant in F2FP courses than in OP courses (64% vs. 48%). The size of the group effects also has not increased following the move from F2FP to OP. The average absolute value of β4,g (not reported in and ) dropped slightly from 0.368 for F2FP courses to 0.331 for OP courses. In short, the regression results do not point to a strong increase in the size and significance of group effects due to cheating among group members following the move to OP.
We now turn to β1, our main coefficient of interest, which is reported in and . Across all courses and cohorts, the coefficient for PriorPerf is positive and significant at a 1 percent level. This holds for both bachelor-1 and bachelor-2 courses. It also holds regardless of whether we measure prior academic performance using GPA(School) or using prior bachelor grades. These measures are thus a good indicator of subsequent academic performance due to their ability to measure students’ human capital, motivation to study, and/or self-efficacy. The move from F2FP to OP seems to have had no discernable effect on the size of β1, which averaged 0.770 for F2FP courses versus 0.768 for OP courses. As discussed above, a decline in the goodness-of-fit between the human capital variables and the grades for OP courses could indicate the presence of cheating. and show that the adjusted R-squared in general is higher for the regressions that use prior bachelor grades instead of GPA(School) as a measure of prior performance. This could be explained by the larger number of observations, the larger variation in bachelor grades compared to GPA(School), and the fact that bachelor grades are a more recent measure of academic performance. Moving from F2FP to OP courses, the average R-squared drops from 0.277 to 0.228. This drop is smaller for regressions using GPA(School) (from 0.168 to 0.158) than for regressions using bachelor grades (from 0.386 to 0.298).
The significance of the changes in explanatory power is further examined using the Goldfeld-Quandt test. reports for each course the F-statistics of a pairwise comparison of error variances of the regression model for F2FP versus OP years. The changes in explanatory power are highly significant for the bachelor-1 courses Math2 and O&S and for the bachelor-2 courses InterEcon and Finance. From our regression models we conclude that, although human capital variables remain strongly related to course grades under OP, the explanatory power has weakened.
The case of the course Math2 cautions, however, against a premature conclusion that the lower explanatory power is due to increased cheating. As shows, the mean grade for Math2 in OP cohorts was significantly lower than in F2FP cohorts. This raises the alternative explanation that the stress from doing a difficult math exam in the new OP environment has led to underperformance and a weaker link between human capital variables and grades. In this interpretation, OP stress has the statistical effect of adding noise to the regression model, which leads to a reduction in the R-squared. To discriminate between these alternative explanations, we will check for suspicious grade patterns using the JL scores in the next subsection.
First, however, we repeat the regression approach for a subset of students with a relatively weak prior academic performance. As these students are more likely to fail, they may be more tempted to cheat. Due to the low variability of GPA(School), we do this analysis using only bachelor grades as a measure of prior academic performance. The subsample of weak students is determined in two ways: 1) by taking the bottom quartile (i.e., the lowest-scoring quartile for either the module-1 grades for bachelor-1 courses or the bachelor-1 grades for bachelor-2 courses) and 2) by selecting students with GPA(School) equal to 6. provides a summary of the regression results for the years 2018–20. Restricting the sample to students with a weak prior performance limits the variability in student quality, and thus has a strong negative effect on the value and significance of β1 and on the explanatory power of the regressions. The average value of β1drops to 0.29 for regressions using the bottom quartile and to 0.57 for regressions that include students with a GPA(School) equal to 6. The average R-squared is also much lower than in and and drops to 0.04 and 0.14, respectively. However, this is the case for both F2FP and OP courses. For OP courses, the average β1 in is higher than for F2FP courses, while the R-squared is similar. Overall, we find no evidence that the link between course grades and human capital has changed among weaker students after the move to OP.
We finally check for an interaction effect between gender and prior academic performance. Gender differences in academic integrity could come to the surface when OP facilitates cheating. For the final three years, we redo the regressions from and but now include the interaction term PriorPerf*Gender. The coefficients of the interaction term are reported in . Just four out of 67 interaction terms are significant at a 5 percent level, which shows that either gender differences in cheating are small or that proctoring (either F2FP or OP) works well to prevent cheating.
Table 7. Coefficients of interaction term between gender and GPA (School).
Ranked-gain scores
We now examine suspicious grade patterns using the JL methodology introduced above. For each student i, we calculate Scorei,OP,F2FP on the basis of Equationequation (2)(2)
(2) . The analysis is restricted to data for the academic year 2019–20 because in this year we can observe students’ performance in both F2FP and OP courses. For bachelor-1, we compare the ranked gain for OP courses Math2 and O&S to the F2FP courses Micro, Macro, and Stats1. In these cases, the gain is measured vis-à-vis the average grade of the module-1 courses Math1 and Account. This yields six series of JL scores. For bachelor-2, we compare the OP courses IntroEctrics and IntermedAccount to the F2FP courses AppMicro, InterEcon, and Stats2. In these cases, the gain is measured vis-à-vis the average grade of the bachelor-1 courses Math1, Account, Micro, Macro, and Stats1. This yields another six series of JL scores. plots the distributions of the scores of the OP courses vis-à-vis the F2FP courses Micro and AppMicro.Footnote1 In each case, the top graph shows the distribution for the pre-COVID period and the bottom graph the distribution for 2019. A visual inspection of the graphs shows that the top graphs are somewhat smoother than the bottom graphs, which can be explained by the larger pre-COVID sample. Apart from that, the distributions seem quite similar. The graphs also do not suggest the presence of heavier tails in the distributions for the 2019 cohort. For Scorei,MATH2,MICRO. the percentage of scores above 1.5 is 1.6 percent for the pre-COVID cohorts and 0.8 percent for 2019. For Scorei,O&S,MICRO, the percentage of scores above 1.5 is 1.5 percent for the pre-COVID cohorts and 1.0 percent for 2019. For Scorei,INTROECTRICS,APPMICRO and Scorei,INTERMEDACCOUNT,APPMICRO, the pre-COVID and 2019 percentages are very close (respectively, 1.9% vs. 2.0% and 1.8% vs. 2.2%).
Figure 1. (A) JL scores of Math2 vs. Micro. (B) JL scores of O&S vs. Micro. (C) JL Scores of IntroEctrics vs. AppMicro. (D) JL Scores of IntermedAccount vs. AppMicro.
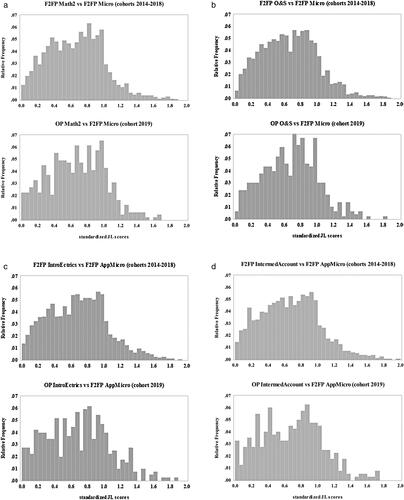
We formally test the equality of the distributions using the Mann-Whitney test and the Kolmogorov-Smirnov two-sample test. reports the statistics. For all 12 combinations of OP and F2FP courses, the statistics are insignificant, indicating that the distributions of JL scores in 2019 do not significantly deviate from those in the pre-COVID years. Our analysis of JL scores thus does not reveal suspicious grade patterns that could be indicative of academic dishonesty.
Table 8. Distribution tests for Jacob-Levitt scores.
Discussion and conclusions
We have examined the potential increase in academic dishonesty following the move from F2FP to OP examinations due to COVID-19. To this end, we have employed two statistical methods that have been used previously in the literature: the regression model of Harmon and Lambrinos (Citation2008) and the detection algorithm of Jacob and Levitt (Citation2003). Using a large dataset from a Dutch university, we have examined two research questions. The first is whether the move from F2FP to OP testing has weakened the relationship between grades and student characteristics, as the HL model would predict in case of increased cheating. The second is whether the move from F2FP to OP testing has changed the distribution of the JL scores in a way that is suggestive of increased cheating.
Regarding the first research question, we find that variables measuring students’ human capital remain strongly related to course grades following the move to OP testing. However, the ability of these variables to explain the variation in grades has decreased. While this could point to increased cheating, we cannot exclude an alternative explanation, according to which the stresses from the OP environment add “noise” to the regression model and lower the explanatory power of the student characteristics. Regarding the second research question, we find that the distributions of the JL scores have not significantly changed following the move to OP testing and do not indicate suspicious grade patterns.
Overall, our findings do not provide convincing evidence that OP examination is more conducive to cheating than F2FP examination. While OP and F2FP may not be perfect substitutes, we find no evidence that OP has compromised the integrity of assessment. This finding contrasts with increasing evidence that unproctored online assessment may suffer from high levels of cheating. It suggests that educational institutions that want to move their assessment online can reduce the risk of cheating by organizing OP examinations instead of unproctored online tests. While OP is more costly than unproctored online assessment, it still offers institutions an easily adoptable and relatively low-cost solution to the problem of online assessment.
We close with some caveats. First, we would like to stress that our analysis was not intended to uncover academic dishonesty of individual students and that the results offer no proof for this. Second, our findings are based on data from one university and should be generalized with caution. Third, it is conceivable that over time, students become more adept at circumventing webcam monitoring. This could result in an increase in cheating on OP tests and compromise the integrity of OP testing after all. One could imagine an “arms race” in which institutions are forced to continue to invest in technological solutions to counter students’ efforts at circumventing OP. Our suggestion for further research is therefore to repeat this type of research over time and in different institutional settings.
Correction Statement
This article has been republished with minor changes. These changes do not impact the academic content of the article.
Notes
1 Graphs of JL scores vis-à-vis Macro and Stats1 and InterEcon and Stats2 look similar but have been omitted out of space considerations. They are available upon request.
References
- Alessio, H. M., N. Malay, K. Maurer, A. Bailer, and B. Rubin. 2017. Examining the effect of proctoring on online test scores. Online Learning 21 (1): 146–61. doi: 10.24059/olj.v21i1.885.
- Anderson, G., D. Benjamin, and M. A. Fuss. 1994. The determinants of success in university introductory economics courses. Journal of Economic Education 25 (2): 99–119. doi: 10.2307/1183277.
- Arnold, I. J. M. 2016. Cheating at online formative tests: Does it pay off? The Internet and Higher Education 29 (April): 98–106. doi: 10.1016/j.iheduc.2016.02.001.
- Arnold, I. J. M., and J. T. Straten. 2012. Motivation and math skills as determinants of first-year performance in economics. Journal of Economic Education 43 (1): 33–47. doi: 10.1080/00220485.2012.636709.
- Ballard, C., and M. F. Johnson. 2004. Basic math skills and performance in an introductory economics class. Journal of Economic Education 35 (1): 3–23. doi: 10.3200/JECE.35.1.3-23.
- Beck, V. 2014. Testing a model to predict online cheating—Much ado about nothing. Active Learning in Higher Education 15 (1): 65–75. doi: 10.1177/1469787413514646.
- Berkey, D., and J. Halfond. 2015. Cheating, student authentication and proctoring in online programs. Boston, MA: New England Board of Higher Education. https://nebhe.org/journal/cheating-student-authentication-and-proctoring-in-online-programs/ (accessed October 5, 2021).
- Bilen, E., and A. Matros. 2021. Online cheating amid COVID-19. Journal of Economic Behavior & Organization 182 (February): 196–211. doi: 10.1016/j.jebo.2020.12.004.
- Brown, B. W., and C. E. Liedholm. 2002. Can web courses replace the classroom in principles of microeconomics? American Economic Review 92 (2): 444–49. doi: 10.1257/000282802320191778.
- Coates, D., B. R. Humphreys, J. Kane, and M. A. Vachris. 2004. “No significant distance” between face-to-face and online instruction: Evidence from principles of economics. Economics of Education Review 23 (5): 533–46. doi: 10.1016/j.econedurev.2004.02.002.
- Corrigan-Gibbs, H., N. Gupta, C. Northcutt, E. Cutrell, and W. Thies. 2015. Deterring cheating in online environments. ACM Transactions on Computer-Human Interaction 22 (6): 1–28. doi: 10.1145/2810239.
- Dendir, S., and R. Stockton Maxwell. 2020. Cheating in online courses: Evidence from online proctoring. Computers in Human Behavior Reports 2 (August–December): 100033. doi: 10.1016/j.chbr.2020.100033.
- Duers, L. E., and N. Brown. 2009. An exploration of student nurses’ experiences of formative assessment. Nurse Education Today 29 (6): 654–59. doi: 10.1016/j.nedt.2009.02.007.
- Englander, F., A. Fask, and Z. Wang. 2011. Comment on “The impact of online assessment on grades in community college distance education mathematics courses” by R. W. Yates and B. Beaudrie. American Journal of Distance Education 25 (2): 114–20. doi: 10.1080/08923647.2011.565243.
- Fask, A., F. Englander, and Z. Wang. 2014. Do online exams facilitate cheating? An experiment designed to separate possible cheating from the effect of the online test taking environment. Journal of Academic Ethics 12 (2): 101–12. doi: 10.1007/s10805-014-9207-1.
- Fontaine, J. 2012. Online classes see cheating go high-tech. Chronicle of Higher Education 58 (38): A1–A2.
- Gaytan, J., and B. C. McEwen. 2007. Effective online instructional and assessment strategies. American Journal of Distance Education 21 (3): 117–32. doi: 10.1080/08923640701341653.
- Gikandi, J. W., D. Morrow, and N. E. Davis. 2011. Online formative assessment in higher education: A review of the literature. Computers & Education 57 (4): 2333–51. doi: 10.1016/j.compedu.2011.06.004.
- Grijalva, T. C., C. Nowell, and J. Kerkvliet. 2006. Academic honesty and online courses. College Student Journal 40 (1): 180–85.
- Hard, S. F., J. M. Conway, and A. C. Moran. 2006. Faculty and college student beliefs about the frequency of student academic misconduct. Journal of Higher Education 77 (6): 1058–80. doi: 10.1353/jhe.2006.0048.
- Harmon, O. R., and J. Lambrinos. 2008. Are online exams an invitation to cheat? Journal of Economic Education 39 (2): 116–25. doi: 10.3200/JECE.39.2.116-125.
- Harmon, O. R., J. Lambrinos, and J. Buffolino. 2010. Assessment design and cheating risk in online instruction. Online Journal of Distance Learning Administration 13 (3). http://www.westga.edu/∼distance/ojdla/Fall133/harmon_lambrinos_buffolino133.html (accessed May 24, 2022).
- Harris, L., D. Harrison, D. McNally, and C. Ford. 2020. Academic integrity in an online culture: Do McCabe’s findings hold true for online, adult learners? Journal of Academic Ethics 18 (4): 419–34. doi: 10.1007/s10805-019-09335-3.
- Holden, O., V. A. Kuhlmeier, and M. Norris. 2021. Academic integrity in online testing: A research review. Frontiers in Education 6:Article 639814. doi: 10.3389/feduc.2021.639814.
- Hollister, K. K., and M. L. Berenson. 2009. Proctored versus unproctored online exams: Studying the impact of exam environment on student performance. Decision Sciences Journal of Innovative Education 7 (1): 271–94. doi: 10.1111/j.1540-4609.2008.00220.x.
- Jacob, B. A., and S. D. Levitt. 2003. Rotten apples: An investigation of the prevalence and predictors of teacher cheating. The Quarterly Journal of Economics 118 (3): 843–77. doi: 10.1162/00335530360698441.
- Janke, S., S. C. Rudert, Ä. Petersen, T. M. Fritz, and M. Daumiller. 2021. Cheating in the wake of COVID-19: How dangerous is ad hoc online testing for academic integrity? https://psyarxiv.com/6xmzh/ (accessed May 24, 2022).
- Johnson, M., and E. Kuennen. 2006. Basic math skills and performance in an introductory statistics course. Journal of Statistics Education 14 (2). http://www.amstat.org/publications/jse/v14n2/johnson.html (accessed May 24, 2022). doi: 10.1080/10691898.2006.11910581.
- Johnson, M., D. Robson, and S. Taengnoi. 2014. A meta-analysis of the gender gap in performance in collegiate economics courses. Review of Social Economy 72 (4): 436–59. doi: 10.1080/00346764.2014.958902.
- Karim, M. N., S. E. Kaminsky, and T. S. Behrend. 2014. Cheating, reactions, and performance in remotely proctored testing: An exploratory experimental study. Journal of Business and Psychology 29 (4): 555–72. doi: 10.1007/s10869-014-9343-z.
- Kennedy, K., S. Nowak, R. Raghuraman, J. Thomas, and S. F. Davis. 2000. Academic dishonesty and distance learning: Student and faculty views. College Student Journal 34 (2): 309–14.
- Kerkvliet, J., and C. L. Sigmund. 1999. Can we control cheating in the classroom? Journal of Economic Education 30 (4): 331–43. doi: 10.2307/1182947.
- Khare, A., and H. Lam. 2008. Assessing student achievement and progress with online examinations: Some pedagogical and technical issues. International Journal on E-Learning 7 (3): 383–402.
- King, C. G., R. W. Guyette, and C. Piotrowski. 2009. Online exams and cheating: An empirical analysis of business students’ views. Journal of Educators Online 6 (1). https://www.thejeo.com/archive/2009_6_1/king_guyette_piotrowski (accessed May 24, 2022). doi: 10.9743/JEO.2009.1.5.
- Ladyshewsky, R. K. 2015. Post-graduate student performance in “supervised in-class” vs. “unsupervised online” multiple choice tests: Implications for cheating and test security. Assessment & Evaluation in Higher Education 40 (7): 883–97. doi: 10.1080/02602938.2014.956683.
- Lagerlöf, J., and A. Seltzer. 2009. The effects of remedial mathematics on the learning of economics: Evidence from a natural experiment. Journal of Economic Education 40 (2): 115–37. doi: 10.3200/JECE.40.2.115-137.
- McCabe, D. L., L. K. Treviño, and K. D. Butterfield. 2001. Cheating in academic institutions: A decade of research. Ethics & Behavior 11 (3): 219–32. doi: 10.1207/S15327019EB1103_2.
- McNabb, L., and A. Olmstead. 2009. Communities of integrity in online courses: Faculty member beliefs and strategies. Journal of Online Learning and Teaching 5 (2): 208–23.
- Mellar, H., R. Peytcheva-Forsyth, S. Kocdar, A. Karadeniz, and B. Yovkova. 2018. Addressing cheating in e-assessment using student authentication and authorship checking systems: Teachers’ perspectives. International Journal for Educational Integrity 14 (1): 1–21. doi: 10.1007/s40979-018-0025-x.
- Moten, J., A. Fitterer, E. Brazier, J. Leonard, and A. Brown. 2013. Examining online college cyber cheating methods and prevention measures. Electronic Journal of e-Learning 11 (2): 139–46.
- Newton, D. 2015. Cheating in online classes is now big business. The Atlantic. http://www.theatlantic.com/education/archive/2015/11/cheating-through-online-courses/413770 (accessed May 24, 2022).
- Nowell, C., and D. Laufer. 1997. Undergraduate student cheating in the fields of business and economics. Journal of Economic Education 28 (1): 3–12. doi: 10.1080/00220489709595901.
- Oosterhof, A., R. M. Conrad, and D. P. Ely. 2008. Assessing learners online. New Jersey: Pearson.
- Paredes, S. G., F. de Jesús Jasso Peña, and J. M. de La Fuente Alcazar. 2021. Remote proctored exams: Integrity assurance in online education? Distance Education 42 (2): 200–18. doi: 10.1080/01587919.2021.1910495.
- Passow, H. J., M. J. Mayhew, C. J. Finelli, T. S. Harding, and D. D. Carpenter. 2006. Factors influencing engineering students’ decisions to cheat by type of assessment. Research in Higher Education 47 (6): 643–84. doi: 10.1007/s11162-006-9010-y.
- Seaman, J. E., I. E. Allen, and J. Seaman. 2018. Grade increase: Tracking distance education in the United States. Babson Park, MA: Babson Survey Research Group, Babson College. https://www.bayviewanalytics.com/reports/gradeincrease.pdf (accessed May 24, 2022)
- Stephens, J. M., M. F. Young, and T. Calabrese. 2007. Does moral judgment go offline when students are online? A comparative analysis of undergraduates’ beliefs and behaviors related to conventional and digital cheating. Ethics & Behavior 17 (3): 233–54. doi: 10.1080/10508420701519197.
- Stuber-McEwen, D., P. Wisely, and S. Hoggatt. 2009. Point, click and cheat: Frequency and type of academic dishonesty in virtual classroom. Online Journal of Distance Learning Administration 12 (3). https://www.westga.edu/∼distance/ojdla/fall123/stuber123.html (accessed May 24, 2022).
- SURF (Samenwerkende Universiteiten RekenFaciliteiten). 2020. White paper online proctoring. Utrecht, The Netherlands: SURFnet. https://www.surf.nl/files/2020-04/surf-rapport-online-proctoring_2020_update-april-2020.pdf (accessed May 24, 2022).
- Vazquez, J. J., E. P. Chiang, and I. Sarmiento-Barbieri. 2021. Can we stay one step ahead of cheaters? A field experiment in proctoring online open book exams. Journal of Behavioral and Experimental Economics 90 (February): 101653. doi: 10.1016/j.socec.2020.101653.
- Vician, C., D. D. Charlesworth, and P. Charlesworth. 2006. Students’ perspectives of the influence of web-enhanced coursework on incidences of cheating. Journal of Chemical Education 83 (9): 1368–75. doi: 10.1021/ed083p1368.
- Watson, G., and J. Sottile. 2010. Cheating in the digital age: Do students cheat more in online courses? Online Journal of Distance Learning Administration 13 (1). http://www.westga.edu/∼distance/ojdla/spring131/watson131.html (accessed May 24, 2022).
- Whitley, B. E. 1998. Factors associated with cheating among college students: A review. Research in Higher Education 39 (3): 235–74. doi: 10.1023/A:1018724900565.
- Wuthisatian, R. 2020. Student exam performance in different proctored environments: Evidence from an online economics course. International Review of Economics Education 35 (November): 100196. doi: 10.1016/j.iree.2020.100196.
- Yates, R. W., and B. Beaudrie. 2009. The impact of online assessment on grades in community college distance education mathematics courses. American Journal of Distance Education 23 (2): 62–70. doi: 10.1080/08923640902850601.