
 ?Mathematical formulae have been encoded as MathML and are displayed in this HTML version using MathJax in order to improve their display. Uncheck the box to turn MathJax off. This feature requires Javascript. Click on a formula to zoom.
Abstract
The aim of this longitudinal study was to examine the differences between high- and low-performing students’ development of fraction proficiency over a school year and to investigate how those differences were related to instruction in fractions versus instruction in other mathematics topics. The data for this study were drawn from a group of (n = 398) students from 21 fourth-grade classes, from which we formed two subgroups: the 25% highest performing students (n = 99) and the 25% lowest performing students (n = 100), based on their Danish national test scores. The students’ fraction proficiency levels were studied over eight months at five measurement time points. A multiple linear regression analysis with random effects was used to model the test scores. The results showed that the high-performing students developed their fraction proficiency during most of the school year—both when instructed in fractions and, more surprisingly, when instructed in other mathematics topics. In contrast, low-performing students only developed their fraction proficiency while being instructed in fractions. Finally, the gap between high- and low-performing students’ fraction proficiency widened both when the students were taught lessons on fractions and when they were taught other topics in mathematics.
Introduction
Studies have demonstrated that understanding fractions represents a critical point in students’ development of more advanced mathematical thinking (Bailey et al., Citation2012; Siegler et al., Citation2011, Citation2012; Siegler & Pyke, Citation2013). Furthermore, understanding rational numbers is specifically connected to algebra skills (Booth et al., Citation2014; DeWolf et al., Citation2015, Citation2016; Siegler et al., Citation2013). However, many students have difficulty understanding fractions (Tian & Siegler, Citation2017; Torbeyns et al., Citation2015), and these difficulties often persist as the students advance through the school system (Fazio et al., Citation2016; Schneider & Siegler, Citation2010). For example, students’ understanding of whole numbers influences their conceptualization of rational numbers, including fractions (Biddlecomb, Citation2002; Hackenberg & Tillema, Citation2009; Steffe & Olive, Citation2010). Although fraction learning has been studied by several researchers in the cognitive and educational sciences (e.g., Siegler et al., Citation2012; Tian & Siegler, Citation2017; Vamvakoussi et al., Citation2018; Ye et al., Citation2016), the ways that instruction in other mathematics topics or domains influences students’ fraction proficiency development and whether this influence depends on the mathematical abilities of the student have not been determined (Siegler & Pyke, Citation2013). The question of whether any instructional influence identified depends on the mathematical abilities of the student is of key pedagogical interest because, in the affirmative case, differentiated teaching practices may be needed (e.g., Tomlinson et al., Citation2003). However, why some students develop their fraction proficiency while others do not—in other words, why high-performing students’ fraction proficiency grows, whereas low-performing students’ development seems to stagnate—is not yet known.
Therefore, the aim of this study was to examine the differences between high- and low-performing students’ development of fraction proficiency over their fourth-grade school year in Denmark and to investigate how those differences related to instruction on fractions versus instruction on other mathematics topics, such as multiplication, division, and algebra.
In the following sections, we review theories regarding the development of fraction proficiency over time, relations between fractions and other topics in mathematics, and the development of number knowledge.
Development of students’ fraction proficiency over time
Many studies have investigated how students’ fraction understanding develops over time and have found distinct growth in certain trajectory classes differentiated by the ability to assess fraction magnitudes (Hansen et al., Citation2015; Kainulainen et al., Citation2017; Resnick et al., Citation2016; Rinne et al., Citation2017; Siegler & Pyke, Citation2013). Some students with inaccurate fraction magnitude understanding showed minimal progress, whereas others improved (Resnick et al., Citation2016). Furthermore, poor language skills, attention, whole number line estimation, and calculation fluency in third grade have been shown to increase a student’s likelihood of being in a low-growth trajectory class for fraction concepts (Hansen et al., Citation2017).
In a study by Kainulainen et al. (Citation2017), third- to fifth-grade students’ understanding of rational numbers, including fractions, was followed over a one-year period. The researchers discovered that the students’ development from the natural number-based reasoning of numbers to a mathematically correct understanding of rational numbers was almost non-existent. Hence, students continued using natural number-based reasoning when working with fractions. This is known as “whole number bias” or “natural number bias” (Ni & Zhou, Citation2005; Van Hoof et al., Citation2018), which means that students use their knowledge of natural numbers when reasoning about fractions (e.g., is bigger than
because 4 is bigger than 3). Another complicating factor is the multifaceted nature of fractions. The fraction notation can be comprehended as a quotient, a part–whole, a ratio, a measure, and an operator (e.g., Behr et al., Citation1983). However, Kainulainen et al. (Citation2017) found that the students in their study developed temporary and mediating concepts of rational numbers, indicating that the change in the understanding of numbers takes time and goes through multiple phases. Their study supported the idea of a moderate and gradually developing conceptual change in the understanding of rational numbers. In their longitudinal study, Rinne et al. (Citation2017) analyzed students’ responses to a fraction comparison task in fourth through sixth grades. Their findings aligned with those of Kainulainen et al. (Citation2017) that indicated students’ development went through phases of natural number reasoning (natural number bias). However, they argued that the development should be seen as integrated and centered around increasingly representing fractions as magnitudes.
Some researchers have observed that students with mathematical difficulties struggle persistently with their understanding of fractions and achieve only modest improvement over time (e.g., Jordan et al., Citation2017; Siegler & Pyke, Citation2013). Siegler and Pyke (Citation2013) uncovered a considerable difference in the fraction arithmetic knowledge of low- and high-achieving sixth-grade students; they reported that this difference grew over time and was much greater when the students reached eighth grade.
We propose viewing students’ fraction understanding development within the broader overall context of number knowledge development. This is supported by trajectory researchers who contend that patterns and relationships between mathematics topics, including fractions, should be considered when instructing students in mathematics (e.g., Cutting, Citation2019). This means that instruction in other topics also influences and supports students’ fraction proficiency development because of the interconnectedness that exists between mathematical concepts (e.g., Torbeyns et al., Citation2015). The multifaceted nature of fraction understanding development is associated with a complex range of general predictors for students, including working memory, reading fluency, and attention (e.g., Hansen et al., Citation2015; Resnick et al., Citation2016; Siegler & Pyke, Citation2013). In this study, we focused on how instruction in different mathematics topics supports students’ learning of fractions. We did not include general cognitive predictors.
The relation between multiplication, division, and fractions
The relationship between multiplicative reasoning and fraction understanding has long been established. To illustrate, in order to fully understand the task 6 × 3, the student must comprehend that the 3 in 6 × 3 is not just 3 “ones”; it is also of the product, 18 (Thompson & Saldanha, Citation2003). This can be described both as understanding multiplication as creating a product and as seeing the product as connected to the factors from which it was created. Several studies have evidenced this relation between multiplication and fraction understanding (e.g., Hecht et al., Citation2003; Resnick et al., Citation2016; Seethaler et al., Citation2011). Resnick et al. (Citation2016) demonstrated that fourth-grade students who had higher-than-average multiplication fact fluency were less likely to fall into low growth in fraction knowledge than were students with less developed multiplication skills. They also showed that multiplication fluency was not a significant predictor for the group that already showed a high level of accuracy in their understanding of fraction magnitudes. However, multiplication seems to play a significant role in students’ first encounter with or first development phase of fraction magnitude understanding—and it may explain why low-performing students show no growth in their fraction magnitude understanding.
Following the link between multiplication and proportional reasoning, Möhring et al. (Citation2016) revealed a strong correlation between the non-symbolic proportional part–whole reasoning of students (aged 8 to 10 years) in their study and their performance on conventional numerical fraction tasks (e.g., which fraction is smaller, or
?).
Division is the only one of the four whole-number operations for which a fraction can be the outcome. Therefore, whole-number division skills have also been shown to support the understanding of fractions (Sidney & Alibali, Citation2017; Siegler et al., Citation2013). Furthermore, Sidney and Alibali (2017) reported that seventh-grade students who had solved whole-number division tasks just before fraction division tasks had a significantly better conceptual understanding of fraction division than students who had not solved whole-number division tasks just before. Division cannot be separated from multiplication because they are inverse operations; therefore, both division and multiplication should be seen as part of multiplicative reasoning (Lamon, Citation2012; Thompson & Saldanha, Citation2003).
In summary, evidence has shown that division and multiplication skills are important in predicting fraction knowledge development. The two operations are strongly associated with the ability to perceive and understand a multiplicative or proportional structure, which also supports students in developing their understanding of fractions (Boyer & Levine, Citation2012; Möhring et al., Citation2016). Many studies have been conducted to determine how multiplicative reasoning supports the learning of fractions. However, previous studies have not investigated whether instruction in multiplication and division skills have distinct influences on high- and low-performing students’ fraction proficiency development. This study contributes to filling this gap in the literature.
The relation between algebra and fractions
The close relationship between fractions and multiplicative reasoning can be exemplified in the algebraic expression x = 5 y, where the value of x can be expressed as 5 × y or y can be expressed as without any precise magnitude assigned to x or y (DeWolf et al., Citation2015). Likewise, reducing the expression
to
is related to understanding the proportionality between the denominator and the numerator. Previous research has indicated that an understanding of fractions, often connected to the understanding of fraction magnitude, is central to algebra learning (Booth et al., Citation2014; Booth & Newton, Citation2012; Empson et al., Citation2011). Booth and Newton (Citation2012) showed that middle school students’ fraction knowledge was more closely related to what the authors defined as being ready to learn algebra than to the students’ knowledge of number magnitudes in general. Specifically, the knowledge of unit fractions was related to readiness for algebra. This was supported by the findings from the longitudinal study by Siegler et al. (Citation2012), which showed that elementary students’ understanding of fractions and division skills predicted their algebra proficiency in high school. Recently, an analysis by Liang et al. (Citation2018) confirmed this relationship, revealing that seventh-grade mathematics test scores contributed to 61% of the variance in eighth-grade algebra test scores; moreover, the sub-score for rational numbers in seventh grade was a key predictor that contributed to 48% of the variance in the algebra scores in eighth grade.
Overall, empirical studies on student understanding have shown that, for both middle school and college students, a foundational conceptual understanding of fractions and ratios predicts performance in algebra (DeWolf et al., Citation2016; Liang et al., Citation2018). Thus, the importance of achieving proficiency in fractions for algebra performance has been widely recognized, but researchers have not sufficiently inquired in the other direction: how instruction in algebra might also support students’ understanding of fractions.
Development from whole numbers to fraction understanding
Siegler et al. (Citation2011) suggested a theory in which numerical development is seen as an integrated process. According to this theory, the learning of fractions is part of the development of overall integrated number knowledge. Students first understand small numbers as a non-symbolic magnitude. They next link numbers to a symbol and begin to understand larger whole numbers. Only after this development can they extend their knowledge to include rational numbers, including fractions (Siegler, Citation2016; Siegler et al., Citation2011). Over time, students gradually understand the concept of fractions as a holistic magnitude (Siegler, Citation2016; Siegler et al., Citation2011).
Other researchers have suggested that the learning of fractions indicates a conceptual change in the understanding of numbers (e.g., McMullen et al., Citation2015; Van Hoof et al., Citation2018). Conceptual change theory emphasizes that the fraction learning process includes a change in the students’ concept of numbers, an expansion of understanding caused by progressing from knowing only natural numbers to also knowing rational numbers. One conceptual change, for example, is abandoning the understanding from whole natural numbers that the multiplication of two numbers always leads to greater results than results obtained through division. Hence, students need a conceptual change of this initial natural number understanding when rational numbers are introduced (e.g., McMullen et al., Citation2015; Vamvakoussi & Vosniadou, Citation2010).
The two theories, conceptual change and integrated theory, are not mutually exclusive, both characterizing number knowledge development as a slow change (DeWolf & Vosniadou, Citation2015; Van Dooren et al., Citation2015). Also, the integrative theories do not rule out the need for new concepts or minor changes in concepts (Siegler, Citation2016; Torbeyns et al., Citation2015). Both theories emphasize that whole number learning should be seen as a steppingstone toward subsequent fraction understanding.
We return to these theories in the discussion section where we address how they can be applied to interpret our results regarding the development of fraction proficiency for low- and high-performing students.
Present study
Although previous studies have examined the predictors of fraction knowledge and how fraction knowledge later predicts mathematical performance, fraction proficiency growth with respect to instruction in other mathematics topics has not yet been examined. Hence, this study contributes to the literature in this field by investigating how the development of high- and low-performing students’ fraction proficiency is influenced by instruction both in fractions and in other mathematics topics, such as multiplication, division, and algebra. As previously noted, these topics are mathematically related to fractions. Furthermore, they are part of the Danish grade four curriculum (Danish Ministry of Education, Citation2015).
We studied fourth-grade students’ fraction proficiency development over eight months at five measurement time points. This study’s design allowed us to observe and compare the development of mathematics learning of the sample population during this period because all the classes followed the same curriculum structure for the topics introduced during the school year, and all the participating students received similar instruction in multiplication, division, fractions, and equations, supporting the development of fraction proficiency. The key information we sought to learn through our investigation was whether high- and low-performing fourth-grade students differed in their development of fraction proficiency during the observation period, and if so, in what ways they differed" to "how those differences related to instruction on fractions versus instruction on other mathematics topics. Thus, this study addressed the following questions: Do high- and low-performing students differ in their development of fraction proficiency during the fourth grade? If so, how is the difference related to periods of instruction in other mathematics topics, such as multiplication, division, and equations?
Materials and methods
Participants
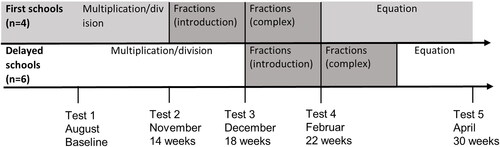
The participating students were from 11 schools in the Central Region of Denmark. The schools differed regarding the planning of the school year and local curriculum activities. Therefore, the fraction instruction periods were delayed by four weeks for six schools (see ).
Figure 1. Fraction proficiency tests during the school year. The first schools generated Dataset 1, and the delayed schools generated Dataset 2.
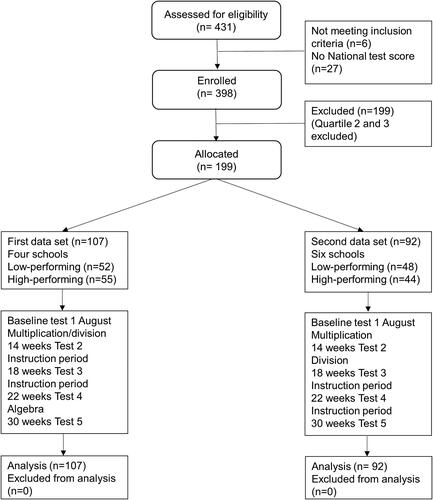
A total of 431 fourth-grade students were assessed for eligibility. Because private schools in Denmark are not obliged to participate in national testing, 27 students who came from private schools were excluded, as depicted in . (At total of 10 public schools enrolled). Another five students were excluded because of cognitive (two) or language (three) disabilities. We used the tetra scores from the national test (described in the next section) in the sub-score numbers and algebra to identify the students who scored below the 25th percentile and above the 75th percentile to create the high- and low-performing groups. This sub-score primarily targets students’ mathematical proficiency. We denote as “Dataset 1” data from the four schools that started fraction instruction first. In this dataset, the high-performing and low-performing student groups included n = 55 and n = 52 students, respectively. Dataset 2, comprising the data from the six schools that started fraction instruction later, contained n = 44 high-performing students and n = 48 low-performing students. provides an overview of the two datasets. Overall, 10 public schools and 199 grade four students participated in the study (106 girls and 93 boys). The average age was 10 years and 4 months (SD = 0.028). All school principals approved the research project, and all parents were informed of the content of the project and their right to withdraw. The procedure followed the Danish Code of Conduct and General Data Protection Regulation (GDPR). The ethnicity of the students from the participating schools was reported as 92.7% Danish origin, 6.8% non-Western immigrants, and 0.5% Western immigrants.
Figure 2. Overview of the participants in the two datasets.
Measurements
National test
The test, which was digitalized, included three subscales: numbers and algebra, geometry, and statistics and probability. The test–retest reliability was reported as .67–.75 (Styrelsen for IT og Laering (STIL), Citation2015). The criterion validity was based on a correlation with the Programme for International Student Assessment (PISA) and was reported as .48–.55 (DAMVAD, Citation2014), whereas the correlation between national test scores in grade three and examination results in mathematics at the end of grade nine was .53–.61 (Skov & Flarup, Citation2020). The test had an adaptive design by which new questions were chosen based on the student’s previous answers, meaning that the appropriate difficulty level for each student was determined based on that student’s own previous answers and the Rasch psychometric model estimation of the difficulty level.
Curriculum-based measurement (CBM) fraction proficiency test
A curriculum-based measurement (CBM) fraction proficiency test was developed by educational researchers in the Teacher Education Department at VIA University College. Curriculum-based measures determine fluency; moreover, short measurements have been documented as reliable and valid indicators of student performance in basic skill areas, such as reading and mathematics computation (e.g., Anselmo et al., Citation2017; Deno, Citation2003; Stecker et al., Citation2005). The CBM fraction assessment was pilot tested in the spring of 2018, and the content validity was ensured by evaluating 72 items. Participating in the pilot test were external experts, grade four students (n = 149), and grade four mathematics teachers (n = 7). The process led to the selection of 36 items for the final test. The assessment was further evaluated by administering it with an independent group of students (n = 233); Cronbach’s α indicated a high level of internal consistency (α = 0.90) and test–retest reliability (r = 0.74) with two weeks between tests. (See for an overview of the test items.)
Table 1. Test items examples.
The test was computerized, and time-limited to 10 minutes The test needed to be short and well organized to avoid taking too much instruction time since the study was intended to follow students’ development throughout the school year. The correlation coefficient between the CBM fraction assessment and the Danish national test score was .49. The max score on the CBM fraction assessment was 36 points: students received 1 point for every correct answer.
Instructional materials
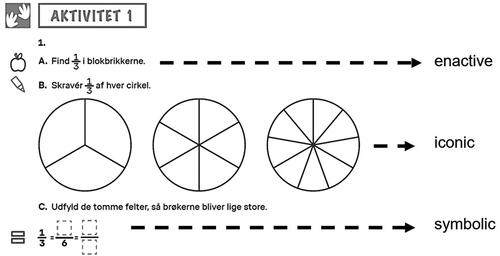
All classes used the same instructional materials for grade four, which covered multiplication and division, fractions, and equations. Educational researchers and grade four teachers collaborated to develop the content. The focus of the instructional materials was on creating an inclusive classroom in which all students were given opportunities to solve tasks in the same mathematical domain using different representations of their task-solving process. The materials were developed after completing a broad review of studies that explored how Bruner’s (Citation1966) theoretical framework could be applied in the design of instructional materials (Jerrim & Vignoles, Citation2016; Reynolds, Citation2015; Uribe-Flórez & Wilkins, Citation2017). Bruner (Citation1966) proposed three modes of representation: enactive, iconic, and symbolic (see ). The instructional materials included tasks that allowed students to use the mode that best supported their processes (Sunde et al., Citation2020). Materials were also developed to support instruction in related mathematics topics.
Figure 3. Example of task from the instructional materials in which Bruner’s three modes are present.
The multiplication and division materials focused on developing students’ conceptual understanding of multiplication and division. More specifically, the materials were designed to teach students to recognize situations involving multiplication and division, to help them understand the relationship between arithmetic operations and the development of number-based methods, and to provide them with strategies for solving problems involving multiplication and division.
The first topic introduced in the instructional materials for fractions was an introduction to fractions: the meaning of fractions (learning fraction notation) and equivalence (e.g., equals
). The last part of the materials covered more complex topics comprising finding the part (e.g.,
of 20) and finding the whole (e.g., how to find the whole magnitude when
of the whole equals 5). These last two topics have a clear relation to both division and multiplication: for example,
of 20 can be found by dividing 20 by 4, and with the knowledge that
of the whole equals 5, the whole can be determined by multiplying 5 by 4 (e.g., Behr et al., Citation1983).
The equation materials focused on the meaning of the equal sign, the abstract meaning of an unknown, and how to solve simple equations by guessing in a systematic way. They also included an instruction in how to translate a text problem into an equation.
Fidelity
To ensure that teacher instruction on the various topics was as consistent as possible across the participating schools, five full-day teacher courses were established for all fourth-grade mathematics teachers who participated in the project. The courses, which were offered during the school year, each focused on the evaluation and development of classroom instruction on mathematics topics using the instructional materials. The courses were structured to guide the teachers on how to implement the various elements of the instructional materials into their teaching practices (Mogensen et al., Citation2015; Nielsen et al., Citation2013). During the instruction period, the teachers videotaped a lesson sequence in their classroom, which they viewed in smaller groups and discussed how the instructional materials were implemented in the lesson during the teacher course. Thus, the delayed schools benefited from the first group’s experience with using the instructional materials.
Procedure
To stratify participating students into high- and low-performing groups, their test scores from the Danish national test in mathematics taken at the end of grade three were obtained. During the 2018–2019 school year, we measured students’ fraction proficiency on five occasions using the CBM fraction test. The test was first administered at the beginning of the school year (baseline), and subsequent tests were administered in the 14th, 18th, 22nd, and 30th weeks after the baseline (see ).
The idea behind the test design was to follow the fraction learning development according to the topic of instruction more closely; therefore, a test was administered during the periods in which fraction instruction occurred. All students received the same instructional materials for multiplication and division, fractions, and equations. All teachers followed the same instructional program for the four topics.
Due to the differences in the planning of the school year and local curriculum activities across different schools, the fraction instruction periods were delayed by four weeks in six schools. Consequently, the test results for the schools in Dataset 1 and those for the schools in Dataset 2 were not completely comparable. We, therefore, analyzed the results for the two datasets separately but using the same strategy for the statistical analysis. In that way, Dataset 2 could be used to validate any patterns observed in Dataset 1.
The delay was determined by how the instruction periods best fit into the local school’s practice. We considered changing the order of the topics presented to the students represented in Dataset 2 so that they received equation instruction first, followed by fraction instruction and then multiplication instruction. However, we judged this to be unethical because the arrangement would not provide the two groups with the same quality of instruction; hence, the scaffolding of mathematics learning would not be optimal for the second group.
Strategy for statistical analysis
Data were missing from some of the five measurement points due to student absences when the tests were administered. We analyzed whether our mixed model analysis was valid despite the missing data by assessing whether the students’ scores were missing at random (MAR) throughout the five measuring points. For this we employed Little’s test for missing completely at random (MCAR) using the categorical variable with levels given by the four groups (Dataset 1 high- and low-performing groups and Dataset 2 high- and low-performing groups) as an independent variable.
As mentioned in the previous section, we used the same analysis strategy for the test results for both Dataset 1 and Dataset 2. The main parameters of interest were the changes in mean test scores for each pair of consecutive tests and the possible differences in these changes between low- and high-performing students: λ12, λ23, λ34, and λ45, and η12, η23, η34, and η45 were used to denote the changes between consecutive mean test scores for the low- and high-performing groups, respectively. For instance, for a low-performing student, λ12 was the expected change in test scores from the first (baseline) test to the second. We also considered the differences δ12, δ23, δ34, and δ45 between the changes for the low- and high-performing students: for example, δ12 was the difference η12 − λ12. For a high-performing student, the expected change η12 between the first and second tests was, thus, equal to λ12 + δ12. Exemplifying this further, the expected test score for a low-performing student on the third test became β1ow + λ12 + λ23, where β1ow was the expected test score on the first (baseline) test in the low-performing group. The expected test score for a high-performing student on the third test became βhigh + (λ12 + δ12) + (λ23 + δ23), where βhigh was the expected test score on the first (baseline) test in the high-performing group. Thus, if the parameters δ12 and δ23 were zero, then the total change in the test scores from baseline to the third test would be λ12 + λ23 for both low- and high-performing students. The difference between the third test results of the low- and high-performing students would then only be due to the different baseline values of βlow and βhigh.
We also added gender as a categorical variable with associated parameter α measuring the expected difference in scores between boys and girls. The test scores were then modeled using a multiple linear regression model based on the parameters α, β1ow, βhigh, λ12, λ23, λ34, and λ45 and δ12, δ23, δ34, and δ45 (recall that the η parameters can be obtained using the λ and δ parameters).
Observations were hierarchically grouped, first according to student and then according to class; we accounted for possible between–student and between–class variations by extending the model with random student and class effects. We also considered including schools as a random effect, but no evidence of variation was observed between the schools. The resulting linear mixed regression model was fitted using the lmer procedure in the R software environment (R Core Team, Citation2017).
Results
When evaluating the CBM fraction tests’ missing values, Little’s MCAR test revealed that the missing information was completely random: χ2(53) = 72.9623, p = .99. Hence, neither imputation nor replacement of the missing values was needed.
Dataset 1
shows the estimates of the various model parameters. The estimate of the baseline difference βhigh - βlow between the high- and low-performing students showed that, initially, the high-performing students scored, on average, 5.18 points higher than the low-performing students. Moreover, the gender effect α was significant at the 5% level, with boys scoring, on average, 3.97 points higher than girls.
Table 2. Results of mixed model analysis for first and delayed datasets.
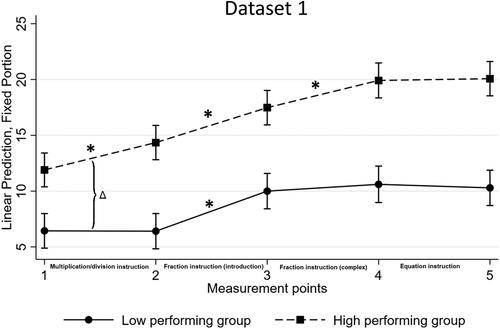
To assess the null hypothesis of no differences between the test score changes of the low- and high-performing students (i.e., δ12 = δ23 = δ34 = δ45 = 0), we initially conducted an F-test, adjusted for the missing test results for some students. The result of this test was highly significant (p < .0001). Thus, we determined the development of fraction learning over time differed for the high- and low-performing students. A closer inspection of the p values for δ12–δ34 revealed that only the parameter δ12 was significantly different (at the 5% level) from zero. As such, the difference between the high- and low-performing students’ test result changes seemed primarily attributable to the period between the baseline and second test. Here the change λ12 in the score for the low-performing students was not significantly different from zero, while the change η12 = λ12 + δ12 for the high-performing students was estimated to be 2.45 = 2.48 − 0.03. When the growth in the low-performing students’ fraction proficiency was considered, only the change δ23, estimated to be 3.59, was significantly different from zero (p < .0001). In contrast, the high-performing students showed significantly positive growth over the first three periods, estimated at 2.45, 3.11, and 2.45, respectively, and only the change over the last period, estimated at 0.16, was not significantly different from zero. The estimated development of the expected test results for low- and high-performing students is shown in (with 95% confidence intervals).
Figure 4. Multiple linear regression model with 95% confidence intervals, Dataset 1.
The estimate of within–student variance was 8.8, while the between–student and between–class variances were 18.4 and 1.2, respectively. Hence, the largest proportion (65%) of the total variance was between students, while the variation between classes was relatively small (4% of the total variance).
Dataset 2
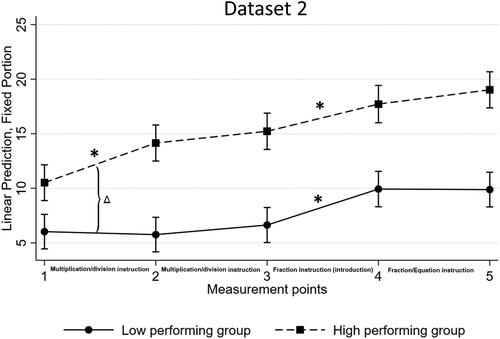
also shows the estimates of the various model parameters for Dataset 2. As for Dataset 1, the estimate of the baseline difference βhigh - βlow showed that, initially, the high-performing students scored higher (4.28 points on average) than the low-performing students. However, in contrast to the results for Dataset 1, the gender effect was not significant.
Like for Dataset 1, according to an F-test, the null hypothesis δ12 = δ23 = δ34 = δ45 = 0 was rejected. As a result, we determined the changes between the high- and low-performing students’ test scores over time were different. As it was for Dataset 1, the significant individual change difference was, again, δ12. The only significant increase in test scores for the low-performing students occurred in the third period (see result for λ34). Due to the delay, this confirmed the result for Dataset 1, where the significant increase for low-performing students was found in the second period (see ). For the high-performing students in Dataset 2, the estimated changes (η12, η23, η34, and η45) were positive for all periods, similar to those for Dataset 1. However, only the change parameters for the high-performing students for the first and third periods were significantly different from zero.
Figure 5. Multiple linear regression model with 95% confidence intervals, Dataset 2.
The estimate of within–student variance was 8.1, while the between–student and between–class variances were 15.6 and 1.2, respectively. These variance estimates closely agreed with those for Dataset 1; thus, the largest proportion of the variance (63%) was once again due to between–student variance and a much smaller part (5%) due to between–classroom variance.
Discussion
The results from the data analysis showed that the development of high- and low-performing students’ fraction proficiency over time differed significantly. The scores of the high-performing students consistently improved over all periods, except for the last equations instruction period, when the change was very small for Dataset 1, while a bigger positive change was observed for Dataset 2. Conversely, the low-performing students only experienced an improvement in the fraction instruction period.
Low-performing students
Fraction proficiency for the low-performing students (in both Dataset 1 and Dataset 2) developed only when the instruction targeted the meaning of fraction equivalence. Hence, the students primarily developed their fraction proficiency in the first introductory part of the fraction instruction period. When the instruction transitioned into a more abstract concept of fractions, during which students worked on finding the whole from the size of the fraction, their fraction proficiency development seemed to stop.
The instruction periods on multiplication, division, and equations showed no positive impact on the low-performing groups’ fraction proficiency development. Previous studies have found that fraction learning is supported by understanding whole-number multiplication (Resnick et al., Citation2016; Seethaler et al., Citation2011) and division (Sidney & Alibali, Citation2017; Siegler et al., Citation2013). However, these studies did not target low-performing students specifically. For example, Sidney and Alibali (Citation2017) conducted an experimental study comparing two groups of students, where one group solved whole-number division problems immediately before fraction division problems, and the other group solved only fraction problems. In other words, Sidney and Alibali (Citation2017) looked at the moment the students completed the test, whereas our study investigated the general influence of prior instruction on growth in fraction knowledge. Thus, our findings on low-performing students add to the literature by highlighting that transfer between whole-number knowledge and fraction knowledge may vary for different student groups.
The reason instruction in whole-number multiplication and division had no positive impact on the low-performing students’ fraction proficiency may be that the low-performing students in our study failed to reach the necessary proficiency in multiplication and division needed to support fraction development during the multiplication/division instruction periods. Moreover, we cannot rule out the possibility that the positive development in fraction proficiency for low-performing students during the fraction instruction period was reinforced by the previous instruction in multiplication and division.
One can also argue, from an integrative number knowledge development approach, that low-performing students may have been in the process of expanding their comprehension to larger whole numbers but were not yet ready to expand to rational numbers. However, they did develop their fraction proficiency during the first week of fraction instruction. From a conceptual change point of view, one can hypothesize that the low-performing students could not transfer their concepts of multiplication, division, or algebra to fractions. They may have developed a procedural approach exclusively within each topic.
High-performing students
The high-performing students showed an increase in fraction proficiency during the whole fraction instruction period as well as during instruction in multiplication and division. This was confirmed by Datasets 1 and 2, for which the same pattern emerged.
Our findings on high performers agree with those of previous studies that demonstrated fraction learning is supported by an understanding of whole-number multiplication (e.g., Resnick et al., Citation2016; Seethaler et al., Citation2011) and division (e.g., Sidney & Alibali, Citation2017; Siegler et al., Citation2013). Thus, our study may suggest that the high-performing students’ development of fraction knowledge seems to benefit from classroom instruction in multiplication and division.
We did not find growth in fraction proficiency for high-performing students in Dataset 1, nor did we for their low-performing counterparts, relative to equation instruction. However, as mentioned, previous studies have pointed to a relation the other way around—that the concept of fractions supports the learning of algebra (Booth et al., Citation2014; DeWolf et al., Citation2016; Liang et al., Citation2018). This indicates that support may exist only in one direction, meaning that understanding fractions supports the understanding of algebra, but the reverse is not true.
Overall, the findings for the high-performing students indicate the transfer of knowledge in line with the integrative theory and the findings of Torbeyns et al. (Citation2015), who argued that, for example, whole-number and arithmetic knowledge significantly positively impact fraction learning. This demonstrates that educators need to view the development of number knowledge as a process supported by multiple mathematics topics.
Differences between the low- and high-performing student groups
The high- and low-performing groups developed their understanding of fractions at different times during the school year. The low-performing students only developed fraction proficiency during the first four weeks of fraction instruction. The high-performing students revealed a different pattern, as their fraction proficiency developed both during fraction instruction and outside the fraction instruction period when they were instructed in whole-number multiplication and division. Furthermore, the gap between the groups widened. This supports the findings of Jordan et al. (Citation2017) and Siegler and Pyke (Citation2013), who reported that low-achieving students showed very little growth in their fraction knowledge over time.
Resnick et al. (Citation2016) detected three trajectory groups of students using a latent class growth analysis based on their accuracy in fraction number line estimation in grades four and six, with one group going from high to higher accuracy, a second group going from low to higher, and a third group showing continuously low levels of accuracy. Resnick et al. (Citation2016) discovered that the students with higher-than-average multiplication fluency at the beginning of their study were about 35% less likely to fall into the low-growth class than the steeper-growth class. Their findings of multiplication as a predictor of students’ growth in fraction learning resonates with our findings that instruction in multiplication seems to support high-performing students’ growth in fraction proficiency.
Overall, our results highlight the importance of distinguishing between student groups. Considering students with different mathematical abilities, one might speculate that conceptual change theory describes the low-performing students who tend to view most new topics as conceptually new and have limited ability to exploit knowledge from previously taught topics. In contrast, high-performing students seem more capable of transferring knowledge between topics, indicating their learning process is in accordance with the integrative theory.
Instructional implications
This study identified two seemingly contradictory requirements or demands for the instruction of low-performing students. While the results show that their fraction proficiency develops only during instruction in fractions, low-performing students need to develop an overall web of mathematical knowledge through which instruction in other topics also supports their fraction proficiency. This creates a dilemma for the instruction practice. More instruction in fractions at the right level will most likely support the fraction proficiency development of low-performing students; however, they also need to develop fraction knowledge when they are not receiving instruction in fractions. Otherwise, the gap between low- and high-performing students will continue to grow. A more explicit scaffolding between the different mathematics topics is needed to facilitate this learning.
We conclude that the different fraction learning development patterns for low- and high-performing students emphasize the importance of mathematics instruction that facilitates students’ understanding of the interconnection between concepts, which leads to the development of an overall integrative knowledge of numbers (Siegler et al., Citation2011, Citation2012; Torbeyns et al., Citation2015).
Limitations
This research illustrates the importance of conducting tests during a longer intervention or instruction period to follow growth in subgroups. If we had only tested the students before and after the instruction, the conclusion would have been that the instruction benefited both groups, which was not the case throughout the instruction period.
As the design in this study lacked a control group that did not receive any instruction in multiplication or division, whether multiplication and division instruction was the cause for the high-performing students’ development during this period cannot be verified. However, a control group could not be used in this study because instruction in whole-number multiplication and division for some students would be unethical because it would impede their progress in mathematics.
Further research is suggested to determine why the high-performing students showed growth in fraction proficiency when instructed in multiplication and division (e.g., if teachers only use examples containing fractions for the high-performing students). How teachers might vary their classroom teaching styles between the two groups needs further investigation as well.
A limitation of this study is that we lacked general cognitive predictors and background information about the students, and these details could have contributed to explaining the gap between the low- and high-performing students’ growth and why the gap widened during the instruction time. Indeed, our mixed model analysis showed that a substantial proportion (63–65%) of the total random variation was due to between–student variation. This suggests considerable room exists for explaining variation using more detailed student-specific information. On a related note, in classroom-based research, a large variation between classrooms is generally encountered. Nevertheless, in our study, according to our mixed model analysis, only 4–5% of the total variance was explained by between–classroom variation.
Conclusion
This study contributes to the investigation of the gap in fraction proficiency between low- and high-performing students and of why the gap widens. While high-performing students showed a steady increase in fraction proficiency over almost all instruction periods, low-performing students only improved in periods when instruction was specifically focused on fractions. We conjecture that this difference may be explained by different capability in the two groups to transfer learning between topics. However, due to the lack of a control group, we cannot verify that instruction in multiplication and division is a cause of improved fraction proficiency for the high-performing students.
Overall, future research needs to investigate how mathematical domains support high- and low-performing students’ fraction proficiency development differently so that low-performing students can be supported to develop a broader understanding of mathematical concepts and topics and the connections between them. It would be especially interesting to further examine how students transfer knowledge between topics, if this process differs for high- and low-performing students, and how we can support this transfer in mathematics. For example, can low-performing students be supported in making connections between division and multiplication instruction and fraction knowledge through explicit scaffolding?
CRediT author statement
Pedersen, Pernille Ladegaard: Conceptualization, Data curation, Writing- Original draft preparation. Aunio, Pirjo: Methodology, Supervision. Pernille Sunde: Writing and editing. Mette Bjerre: Writing. Waagepetersen, Rasmus: Formal analysis, Writing- Reviewing and Editing.
Acknowledgments
We are very grateful to the two anonymous reviewers whose detailed and constructive feedback enabled us to improve the manuscript substantially. We are also grateful to the Independent Research Fund Denmark.
Availability of data and material
doi:10.17632/xgyxmskfwp.1
Declaration of interest statement
The authors have no conflicts of interest to declare.
Additional information
Funding
References
- Anselmo, G. A., Yarbrough, J. L., Kovaleski, J. F., & Tran, V. N. (2017). Criterion-related validity of two curriculum-based measures of mathematical skill in relation to reading comprehension in secondary students. Psychology in the Schools, 54(9), 1148–1159. https://doi.org/10.1002/pits.22050
- Bailey, D. H., Hoard, M. K., Nugent, L., & Geary, D. C. (2012). Competence with fractions predicts gains in mathematics achievement. Journal of Experimental Child Psychology, 113(3), 447–455. https://doi.org/10.1016/j.jecp.2012.06.004
- Behr, M. J., Lesh, R., Post, T. R., & Silver, E. A. (1983). Rational-number concepts. In R. Lesh & M. Landau (Eds.), Acquisition of mathematics concepts and processes (pp. 91–125). Academic Press.
- Biddlecomb, B. D. (2002). Numerical knowledge as enabling and constraining fraction knowledge: An example of the reorganization hypothesis. The Journal of Mathematical Behavior, 21(2), 167–190. https://doi.org/10.1016/S0732-3123(02)00117-7
- Booth, J. L., & Newton, K. J. (2012). Fractions: Could they really be the gatekeeper’s doorman? Contemporary Educational Psychology, 37(4), 247–253. https://doi.org/10.1016/j.cedpsych.2012.07.001
- Booth, J. L., Newton, K. J., & Twiss-Garrity, L. K. (2014). The impact of fraction magnitude knowledge on algebra performance and learning. Journal of Experimental Child Psychology, 118(1), 110–118. https://doi.org/10.1016/j.jecp.2013.09.001
- Boyer, T. W., & Levine, S. C. (2012). Child proportional scaling: Is 1/3 = 2/6 = 3/9 = 4/12? Journal of Experimental Child Psychology, 111(3), 516–533. https://doi.org/10.1016/j.jecp.2011.11.001
- Bruner, J. S. (1966). Toward a theory of instruction. Belkapp Press.
- Cutting, C. (2019). Re-thinking fraction instruction in primary school: The case for an alternative approach in the early years. In G. Hine, S. Blackley, & A. Cooke (Eds.), Proceedings of the 42nd annual conference of the mathematics education research group of Australasia (pp. 204–211). MERGA.
- DAMVAD. (2014). PISA-relatering af de kriterie- baserede nationale test Delrapport 1 – formidling af resultater. https://www.uvm.dk/folkeskolen/elevplaner-nationale-test–trivselsmaaling-og-sprogproever/nationale-test/om-de-nationale-test
- Danish Ministry of Education. (2015). Forenklede Faelles Mål - Matematik. http://digitalelaereplaner.dk/l%C3%A6replan/danmark/matematik/2015
- Deno, S. L. (2003). Developments in curriculum-based measurement. The Journal of Special Education, 37(3), 184–192. https://doi.org/10.1177/00224669030370030801
- DeWolf, M., & Vosniadou, S. (2015). The representation of fraction magnitudes and the whole number bias reconsidered. Learning and Instruction, 37, 39–49. https://doi.org/10.1016/j.learninstruc.2014.07.002
- DeWolf, M., Bassok, M., & Holyoak, K. J. (2015). From rational numbers to algebra: Separable contributions of decimal magnitude and relational understanding of fractions. Journal of Experimental Child Psychology, 133, 72–84. https://doi.org/10.1016/j.jecp.2015.01.013
- DeWolf, M., Bassok, M., & Holyoak, K. J. (2016). A set for relational reasoning: Facilitation of algebraic modeling by a fraction task. Journal of Experimental Child Psychology, 152, 351–366. https://doi.org/10.1016/j.jecp.2016.06.016
- Empson, S. B., Levi, L., & Carpenter, T. P. (2011). Early algebraization. In J. Cai & E. Knuth (Eds.), Early algebraization. (pp. 409–429). Springer-Verlag. https://doi.org/10.1007/978-3-642-17735-4
- Fazio, L. K., DeWolf, M., & Siegler, R. S. (2016). Strategy use and strategy choice in fraction magnitude comparison. Journal of Experimental Psychology. Learning, Memory, and Cognition, 42(1), 1–16. https://doi.org/10.1037/xlm0000153
- Hackenberg, A. J., & Tillema, E. S. (2009). Students’ whole number multiplicative concepts: A critical constructive resource for fraction composition schemes. The Journal of Mathematical Behavior, 28(1), 1–18. https://doi.org/10.1016/j.jmathb.2009.04.004
- Hansen, N., Jordan, N. C., & Rodrigues, J. (2017). Identifying learning difficulties with fractions: A longitudinal study of student growth from third through sixth grade. Contemporary Educational Psychology, 50, 45–59. https://doi.org/10.1016/j.cedpsych.2015.11.002
- Hansen, N., Jordan, N. C., Fernandez, E., Siegler, R. S., Fuchs, L., Gersten, R., & Micklos, D. (2015). General and math-specific predictors of sixth-graders’ knowledge of fractions. Cognitive Development, 35, 34–49. https://doi.org/10.1016/j.cogdev.2015.02.001
- Hecht, S. A., Close, L., & Santisi, M. (2003). Sources of individual differences in fraction skills. Journal of Experimental Child Psychology, 86(4), 277–302. https://doi.org/10.1016/j.jecp.2003.08.003
- Jerrim, J., & Vignoles, A. (2016). The link between East Asian “mastery” teaching methods and English children’s mathematics skills. Economics of Education Review, 50, 29–44. https://doi.org/10.1016/j.econedurev.2015.11.003
- Jordan, N. C., Resnick, I., Rodrigues, J., Hansen, N., & Dyson, N. (2017). Delaware longitudinal study of fraction learning: Implications for helping children with mathematics difficulties. Journal of Learning Disabilities, 50(6), 621–630. https://doi.org/10.1177/0022219416662033
- Kainulainen, M., McMullen, J., & Lehtinen, E. (2017). Early developmental trajectories toward concepts of rational numbers. Cognition and Instruction, 35(1), 4–19. https://doi.org/10.1080/07370008.2016.1251287
- Lamon, S. J. (2012). Teaching fractions and ratios for understanding (3rd ed.). Routledge. https://doi.org/10.4324/9781410617132
- Liang, J. H., Heckman, P. E., & Abedi, J. (2018). Prior year’s predictors of eighth-grade algebra achievement. Journal of Advanced Academics, 29(3), 249–269. https://doi.org/10.1177/1932202X18770172
- McMullen, J., Laakkonen, E., Hannula-Sormunen, M., & Lehtinen, E. (2015). Modeling the developmental trajectories of rational number concept(s). Learning and Instruction, 37, 14–20. https://doi.org/10.1016/j.learninstruc.2013.12.004
- Mogensen, A., Nielsen, B. L., & Sillasen, M. K. (2015). Processer der forandrer. Mona, 1, 24–48.
- Möhring, W., Newcombe, N. S., Levine, S. C., & Frick, A. (2016). Spatial proportional reasoning is associated with formal knowledge about fractions. Journal of Cognition and Development, 17(1), 67–84. https://doi.org/10.1080/15248372.2014.996289
- Ni, Y., & Zhou, Y. D. (2005). Teaching and learning fraction and rational numbers: The origins and implications of whole number bias. Educational Psychologist, 40(1), 27–52. https://doi.org/10.1207/s15326985ep4001_3
- Nielsen, B. L., Pontoppidan, B. S., Sillasen, M. K., Mogensen, A., & Nielsen, K. (2013). QUEST: Et storskalaprojekt til udvikling af naturfagsundervisning [QUEST: A large-scale project for the development of science teaching]. Mona, 2, 49–66.
- R Core Team. (2017). R: A language and environment for statistical computing. R Foundation for Statistical Computing.
- Resnick, I., Jordan, N. C., Hansen, N., Rajan, V., Rodrigues, J., Siegler, R. S., & Fuchs, L. S. (2016). Developmental growth trajectories in understanding of fraction magnitude from fourth through sixth grade. Developmental Psychology, 52(5), 746–757. https://doi.org/10.1037/dev0000102
- Reynolds, J. M. (2015). Singapore math: A longitudinal study of Singapore math in one school district from 2007 to 2012. ProQuest LLC.
- Rinne, L. F., Ye, A., & Jordan, N. C. (2017). Development of fraction comparison strategies: A latent transition analysis. Developmental Psychology, 53(4), 713–730. https://doi.org/10.1037/dev0000275
- Schneider, M., & Siegler, R. S. (2010). Representations of the magnitudes of fractions. Journal of Experimental Psychology. Human Perception and Performance, 36(5), 1227–1238. https://doi.org/10.1037/a0018170
- Seethaler, P. M., Fuchs, L. S., Star, J. R., & Bryant, J. (2011). The cognitive predictors of computational skill with whole versus rational numbers: An exploratory study. Learning and Individual Differences, 21(5), 536–542. https://doi.org/10.1016/j.lindif.2011.05.002
- Sidney, P. G., & Alibali, M. W. (2017). Creating a context for learning: Activating children’s whole number knowledge prepares them to understand fraction division. Journal of Numerical Cognition, 3(1), 31–57. https://doi.org/10.5964/jnc.v3i1.71
- Siegler, R. S. (2016). Magnitude knowledge: The common core of numerical development. Developmental Science, 19(3), 341–361. https://doi.org/10.1111/desc.12395
- Siegler, R. S., & Pyke, A. A. (2013). Developmental and individual differences in understanding of fractions. Developmental Psychology, 49(10), 1994–2004. https://doi.org/10.1037/a0031200
- Siegler, R. S., Duncan, G. J., Davis-Kean, P. E., Duckworth, K., Claessens, A., Engel, M., Susperreguy, M. I., & Chen, M. (2012). Early predictors of high school mathematics achievement. Psychological Science, 23(7), 691–697. https://doi.org/10.1177/0956797612440101
- Siegler, R. S., Fazio, L. K., Bailey, D. H., & Zhou, X. (2013). Fractions: The new frontier for theories of numerical development. Trends in Cognitive Sciences, 17(1), 13–19. https://doi.org/10.1016/j.tics.2012.11.004
- Siegler, R. S., Thompson, C. A., & Schneider, M. (2011). An integrated theory of whole number and fractions development. Cognitive Psychology, 62(4), 273–296. https://doi.org/10.1016/j.cogpsych.2011.03.001
- Skov, P. R., & Flarup, L. H. (2020). De nationale tests samvariation med karakterer. Delrapport 2: Evalueringen af de nationale test. VIVE.
- Stecker, P. M., Fuchs, L. S., & Fuchs, D. (2005). Using curriculum-based measurement to improve student achievement: Review of research. Psychology in the Schools, 42(8), 795–819. https://doi.org/10.1002/pits.20113
- Steffe, L. P., & Olive, J. (2010). Children’s fractional knowledge. Springer US. https://doi.org/10.1017/CBO9781107415324.004
- Styrelsen for IT og Laering (STIL). (2015). Bilagsnotat til: De nationale tests måleegenskaber. Ministeriet for Børn Undervisning og Ligestilling. https://www.uvm.dk/folkeskolen/elevplaner-nationale-test–trivselsmaaling-og-sprogproever/nationale-test/om-de-nationale-test
- Sunde, P. B., Jóelsdóttir, L. B., & Pedersen, P. L. (2020). Blokmodellen: En overset repraesentation i dansk matematikundervisning? [The block model: An overlooked representation when teaching mathematics in Denmark?]. MONA – Matematik – Og Naturfagsdidaktik, 2020(2), 23–46. https://tidsskrift.dk/mona/article/view/120783
- Thompson, P. W., & Saldanha, L. A. (2003). Fractions and multiplicative reasoning. In J. Kilpatrick, G. Martin, & D. Schifter (Eds.), Research companion to the principles and standards for school mathematics (pp. 95–114). National Council of Teachers of Mathematics. https://doi.org/10.1016/j.jmathb.2009.04.004
- Tian, J., & Siegler, R. S. (2017). Fractions learning in children with mathematics difficulties. Journal of Learning Disabilities, 50(6), 614–620. https://doi.org/10.1177/0022219416662032
- Tomlinson, C. A., Brighton, C., Hertberg, H., Callahan, C. M., Moon, T. R., Brimijoin, K., Conover, L. A., & Reynolds, T. (2003). Differentiating instruction in response to student readiness, interest, and learning profile in academically diverse classrooms: A review of literature. Journal for the Education of the Gifted, 27(2-3), 119–145. https://doi.org/10.1177/016235320302700203
- Torbeyns, J., Schneider, M., Xin, Z., & Siegler, R. S. (2015). Bridging the gap: Fraction understanding is central to mathematics achievement in students from three different continents. Learning and Instruction, 37, 5–13. https://doi.org/10.1016/j.learninstruc.2014.03.002
- Uribe-Flórez, L. J., & Wilkins, J. L. M. (2017). Manipulative use and elementary school students’ mathematics learning. International Journal of Science and Mathematics Education, 15(8), 1541–1557. https://doi.org/10.1007/s10763-016-9757-3
- Vamvakoussi, X., & Vosniadou, S. (2010). How many decimals are there between two fractions? Aspects of secondary school students’ understanding of rational numbers and their notation. Cognition and Instruction, 28(2), 181–209. https://doi.org/10.1080/07370001003676603
- Vamvakoussi, X., Christou, K. P., & Vosniadou, S. (2018). Bridging psychological and educational research on rational number knowledge. Journal of Numerical Cognition, 4(1), 84–106. https://doi.org/10.5964/jnc.v4i1.82
- Van Dooren, W., Lehtinen, E., & Verschaffel, L. (2015). Unraveling the gap between natural and rational numbers. Learning and Instruction, 37, 1–4. https://doi.org/10.1016/j.learninstruc.2015.01.001
- Van Hoof, J., Degrande, T., Ceulemans, E., Verschaffel, L., & van Dooren, W. (2018). Towards a mathematically more correct understanding of rational numbers: A longitudinal study with upper elementary school learners. Learning and Individual Differences, 61, 99–108. https://doi.org/10.1016/j.lindif.2017.11.010
- Ye, A., Resnick, I., Hansen, N., Rodrigues, J., Rinne, L., & Jordan, N. C. (2016). Pathways to fraction learning: Numerical abilities mediate the relation between early cognitive competencies and later fraction knowledge. Journal of Experimental Child Psychology, 152, 242–263. https://doi.org/10.1016/j.jecp.2016.08.001