
 ?Mathematical formulae have been encoded as MathML and are displayed in this HTML version using MathJax in order to improve their display. Uncheck the box to turn MathJax off. This feature requires Javascript. Click on a formula to zoom.
Abstract
Multisite cluster randomized trials (MCRTs), in which, the intermediate-level clusters (e.g., classrooms) are randomly assigned to the treatment or control condition within each site (e.g., school), are among the most commonly used experimental designs across a broad range of disciplines. MCRTs often align with the theory that programs are delivered at a cluster-level (e.g., teacher professional development) and provide opportunities to explore treatment effect heterogeneity across sites. In designing experimental studies, a critical step is the statistical power analysis and sample size determination. However, the statistical tools for power analysis of moderator effects in three-level MCRTs are not available. In this study, we derived formulas for calculating the statistical power and the minimum detectable effect size difference (MDESD) with confidence intervals for investigating the effects of various moderators in three-level MCRTs. We considered the levels of the moderators (level-1, −2, and −3), the scales of the moderators (binary and continuous), and random and nonrandomly varying slopes of the (moderated) treatment effects. We validated our formulas through Monte Carlo simulations. Finally, we conclude with directions for future work.
The quality of study designs in educational and psychological research has been increasingly emphasized in the production of rigorous evidence of the effects of programs and policies. Because the organization of many social structures (e.g., schooling) typically involves multilevel data structure (e.g., students are nested within classrooms, and classrooms are nested within schools), multilevel experiments are widely used in research and program evaluation in these areas. Multisite cluster randomized trials (MCRTs), in which, the intermediate-level clusters (e.g., classrooms) are randomly assigned to the treatment or control condition within each site (e.g., schools), are the most commonly used experimental designs, followed by cluster randomized trials (CRTs), in which, the units for random assignment are the top-level clusters (Spybrook et al., Citation2016; Spybrook & Raudenbush, Citation2009). MCRTs align with the theory that many programs are delivered at the cluster-level (e.g., teacher professional development) and provide opportunities to explore treatment effect heterogeneity across sites (Kelcey et al., Citation2017; Weiss et al., Citation2014).
In addition to detecting simple average effects to addresses “what works” questions, researchers and policy makers are increasingly interested in additional questions regarding for “whom, and under what circumstances” programs work for, and interpreting and exploring the sources of the treatment effect variation using moderation analyses (Weiss et al., Citation2014). For example, it is possible that the effects of a teacher development program vary across schools or districts, and that there are heterogeneous responses by students across different subgroups defined by students’ characteristics (e.g., race, gender, SES, and pretest), teachers’ characteristics (e.g., teaching experience, race, and gender), schools’ and districts’ characteristics (e.g., size, urbanity, poverty level, and average achievement), and program implementation. These characteristics may be potential moderators, which are the variables that affect the direction and/or magnitude of the relation between the treatment variable and the outcome variable (Baron & Kenny, Citation1986). Understanding the context in which an intervention is likely to be (more) effective is fundamental to understanding the extent to which results are applicable and scalable to a wide range of schools and students.
In designing such studies, a critical step is the statistical power analysis. The statistical power analysis is now routinely required to demonstrate sufficient power to detect the treatment effects if they exist (e.g., Kelcey et al., Citation2019; US DoE & NSF, 2013). There exist the tools for power analyses of the main effects of multisite randomized trials (MRTs) (e.g., Borenstein & Hedges, Citation2012; Dong & Maynard, Citation2013; Konstantopoulos, Citation2008; Raudenbush et al., Citation2011) and for power analyses of moderator effects in two- and three-level CRTs (e.g., Dong et al., Citation2018, Citation2021; Spybrook et al., Citation2016). Although Dong et al. (Citation2021) and Raudenbush and Liu (Citation2000) provided a framework for power analysis of moderator effects in two-level multisite individual randomized trials, and Bloom and Spybrook (Citation2017) developed formulas for the minimum detectable effect size difference (MDESD) for the site-level binary moderator in MRTs, there is no comprehensive statistical tool for power analyses of moderator effects in three-level MCRTs. It is still not clear how the intraclass correlations at levels 2 and 3, the sample size allocations, the covariates, the scales and levels of moderators, and the treatment effect variation/heterogeneity coefficients affect the statistical power of the moderator effects in three-level MCRTs. Given the increasing uses of three-level MCRTs in program evaluation, the statistical tools and software for power analyses of the effects of moderators at different levels would enhance the capacity of researchers to design rigorous studies to answer research questions related to the treatment effect heterogeneity.
To address this gap, the purpose of this study is to develop a statistical and empirical framework for designing three-level MCRTs to investigate the moderated treatment effect. Specifically, we will derive formulas for calculating the statistical power and the minimum detectable effect size difference (MDESD) with confidence intervals for investigating the effects of various potential moderators in three-level MCRTs. In the following, we first provide an illustrative example of teacher professional development for investigating moderation effects in three-level MCRTs. We then present the formulas for the standard error (SE), statistical power, and the MDESD and its confidence intervals for the moderator effect at level 1 followed by levels 2 and 3. Within this scope, we begin by detailing the case of continuous moderators with random slopes and then extend these cases to allow for binary moderators and nonrandomly varying slope models. We use Monte Carlo simulations to assess the validity of the formulas we derived. Finally, we conclude with directions for future work.
An illustrative example for investigating moderation effects in MCRTs
Universal prevention interventions have been implemented in schools to reduce student problem behaviors. For instance, using MCRTs, several classroom management programs have been found effective in reducing students’ emotional dysregulation (Reinke et al., Citation2018) and concentration problems (Herman, Reinke et al., 2022). In addition, the results of these two projects indicated that the treatment effects were moderated by the pretest (Reinke et al., Citation2018), by the special education status (Reinke et al., Citation2021), and by the student risk of behavior problems (Sinclair et al., Citation2021). However, the demographic information such as gender, race, and free lunch status were not found to be significant moderators in some universal interventions (e.g., Domitrovich et al., Citation2016; Herman, Dong et al., Citation2022; Ialongo et al., Citation2019; Reinke et al., Citation2018).
Although researchers have begun examining whether the effects of teacher professional development on student outcomes are moderated by the student level variables, there is no comprehensive framework to guide the design and analyses of moderator effects. The alignment of the analytic design with the substantive theory underlying the program can inform the rigorous design of teacher development studies (e.g., Rossi et al., Citation2004; Wayne et al., Citation2008). Recent literature has highlighted the importance of the designs and data collection regimes in the studies of professional development because they affect the scale of data collections and the types of research questions that we can address (Kelcey & Phelps, Citation2013; Schochet, Citation2011).
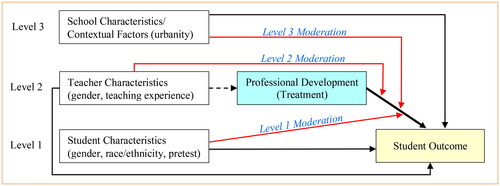
To provide an illustration of the complexity of the designs and the capacity to answer research questions, a simplified conceptual framework for investigating moderation effects of professional development using three-level MCRTs is illustrated in . This is a common study of a teacher professional development program (treatment) that is designed to improve student outcomes (e.g., social and behavioral outcome). The treatment (teacher professional development) is at the intermediate or second level. In a three-level MCRT, where teachers within each school are randomly assigned to receive professional development, teacher characteristics are not related to the treatment; in non-experimental designs, the teacher characteristics may be related to the treatment status. The schools are at level 3, i.e., the schools serve as blocks or sites under which there are two treatment conditions (receiving professional development or not) in each school. The students are at level 1. The characteristics of students, teachers, and schools may be related to the student outcome (black arrows), which will not affect the accuracy of the main effect estimates of the professional development under random assignment but may affect the precision (e.g., standard error, power) of the treatment effect estimates. The key research questions may include: (1) what are the average/main effects of the professional development on the student outcome, and (2) is there any variation in the effects of the professional development across the schools (sites/blocks), and do the effects differ by the characteristics of students, teachers, and schools (red arrows indicating the moderation)? Note that it is also common to probe the mediation effect, e.g., the effect of the teacher professional development is mediated by teacher knowledge or instruction (Kelcey et al., Citation2019; Citation2020), however, this article focuses on Research Question 2 above by studying multisite moderation analyses.
Figure 1. A conceptual framework for investigating moderation effects of professional development.
Statistical framework
In designing moderation studies in three-level MCRTs (), there are multiple considerations concerning the potential form of the moderation including (a) level(s) of the moderator variables, (b) the random or nonrandomly varying slopes (coefficients) of the treatment and moderator variables, and (c) the scale of the moderator(s) (e.g., continuous or categorical). presents the list of moderation designs in three-level MCRTs. For example, Model MRT3-2R-1 refers to a three-level multisite randomized trial with the treatment at level 2 and a moderator at level 1, and with a random slope for the moderation. Below we describe how we develop the formulas for the standard error (SE), statistical power, and the MDESD and its CIs for the moderator effect at level 1 followed by levels 2 and 3. Within this scope, we first detail the case of continuous moderators with random slopes and then extend these cases to allow for binary moderators and nonrandomly varying slope models.
Table 1. List of design and software modules of three-level multisite cluster randomized trials (MCRTs).
The random slope Model
A random slope model assumes that the moderator effect randomly varies across sites when the moderator is at levels 1 or 2, or the treatment effect randomly varies across sites after controlling for the level-3 moderator.
Moderator at level 1
Suppose there are n students in each teacher’s classroom. There are J teachers per school, where a proportion (P) of the teachers within each school are randomly assigned to the treatment group to receive professional development, and there are total K schools which serve as blocks or sites. For example, a research question may probe the extent to which the effects of a professional development program on a student outcome vary by the students’ pretest or gender (i.e., the moderated treatment effects) while the moderated treatment effects also varying randomly across schools. This design corresponds to Model MRT3-2R-1 in .
To test for this cross-level moderation in the presence of heterogeneous effects across schools, we use three-level random slope hierarchical linear modeling (HLM) (Raudenbush & Bryk, Citation2002):
(1)
(1)
(2)
(2)
(3)
(3)
is the outcome for student i with teacher j in school k. The treatment variable,
is a binary variable indicating whether the teachers receive the professional development.
is a level-1 covariate and
is a level-2 covariate.
is a continuous level-1 moderator, and
can be viewed as a grand-mean centered variable. Of interest for the moderator analysis is the parameter
which represents the site-specific moderation effect and consists of the cross-site average moderated treatment effect (
) and the random site-specific deviation from that average (
).
can also be interpreted as the average difference on the association of the variable
and the outcome between the treatment conditions.
By extending Snijders (Citation2001, Citation2005) work on the variance of the estimated regression coefficients of a level-1 variable with a random slope, Dong et al. (Citation2021) showed that the variance of the cross-level moderation effect estimate in two-level multisite randomized trials is associated with the residual variance in the level-1 slope, the variance of the level-1 residuals, and the variances of the moderator and treatment variables in addition to sample sizes (Dong et al., Citation2021, EquationEquation (8)(8)
(8) ). We extend Dong et al. (Citation2021) and Snijders (Citation2001, Citation2005) to three-level MCRTs, and the standard error of the moderator effect estimate (
) can be expressed as:
(4)
(4)
The standard error of the moderation effect is associated with the variance () of the random slope of the moderation (
) across sites/blocks (level 3), the variance (
) of the random slope of the moderator (
) among level-2 clusters conditional on treatment, the variance (
) of level-1 residuals conditional on
and
the variance of
the variance [
] of the treatment variable, and the sample sizes (K, J, n).
Note that when is a binary variable with a proportion of
in one subgroup and (1-
) in another subgroup,
∼ Bernoulli (
):
(5)
(5)
We insert Expression 5 into Expression 4, and the standard error of the moderator effect estimate for a binary level-1 moderator can be expressed as:
(6)
(6)
Moderator at level 2
The research question is whether the effects of the professional development on student outcome vary by the teachers’ teaching experience or gender (i.e., the moderated treatment effects) while the moderated treatment effects also varying randomly across schools. This design corresponds to Model MRT3-2R-2 in .
To test for this same-level moderation, we use three-level random slope HLM (Raudenbush & Bryk, Citation2002):
(7)
(7)
(8)
(8)
(9)
(9)
is a continuous level-2 moderator, and
The parameter,
represents the site-specific moderation effect and consists of the cross-site average moderated treatment effect (
) and the random site-specific deviation from that average (
).
By extending Dong et al. (Citation2021) and Snijders (Citation2001, Citation2005) to three-level MCRTs, the standard error of the moderator effect point estimate () can be expressed as:
(10)
(10)
Similarly, when the level-2 moderator is a binary variable with a proportion of
in one subgroup,
∼ Bernoulli (
):
The standard error of the moderator point estimate for a binary level-2 moderator can be expressed as:
(11)
(11)
Moderator at level 3
A level-3 moderator example research question in the current context is whether the effects of the professional development program on a student outcome vary by the site-level characteristics (e.g., school size, urbanity) while also varying randomly across schools. This design corresponds to Model MRT3-2R-3 in .
To test for this cross-level moderation, we use three-level random slope HLM (Raudenbush & Bryk, Citation2002):
(12)
(12)
(13)
(13)
(14)
(14)
is a continuous level-3 moderator, and
The parameter,
represents the site-specific treatment effects that include three components: (1) the average treatment effects across sites (
), (2) the average moderation effect (
) across sites, and (3) the random treatment effects across sites (
).
By extending Dong et al. (Citation2021) and Snijders (Citation2001, Citation2005) to three-level MCRTs, the standard error of the moderator effect estimate () can be expressed as:
(15)
(15)
Similarly, when the level-3 moderator is a binary variable with a proportion of
in one subgroup,
∼ Bernoulli (
):
The standard error of the moderator point estimate for a binary level-3 moderator can be expressed as:
(16)
(16)
Power formulas
We can test
and
using a t-test. Assuming the alternative hypothesis is true, the test statistic follows a non-central t-distribution, T’, and the noncentrality parameters (unstandardized) for the continuous moderators are:
(17)
(17)
(18)
(18)
and
(19)
(19)
Note that the treatment may affect the variance of the outcome and the association of the outcome with the covariate and moderator for the treatment group. We use the common assumption of homogeneous variance of residuals between the treatment and control groups; that is, the variances are equal between the treatment and control groups after the treatment effect is accounted for. For instance, this assumption implies that the variance () of the level-1 moderator slope among level-2 clusters conditional on treatment from the analysis of data including both treatment and control groups is equal to the variance (
) from the analysis of data only from the control group. In addition, we use the variance components (
and
are levels-3, 2, and 1 variances) in the three-level unconditional HLM for standardization.
(20)
(20)
(21)
(21)
(22)
(22)
Let and
the noncentrality parameter (standardized) for the continuous level-1 moderator is:
(23)
(23)
is the unconditional intraclass correlation coefficient (ICC) at level 3,
is the unconditional ICC at level 2,
indicates the standardized effect variability of the moderation (
) across blocks (level 3).
indicates the standardized effect variability of the random slope of the level-1 moderator (
) among level-2 clusters conditional on the treatment variable (
).
is the proportion of variance at level 1 that is explained by the level-1 covariate (
) and moderator (
):
The standardized noncentrality parameter for the binary level-1 moderator is:
(24)
(24)
The statistical power for a two-sided test with the degrees of freedom of is:
Let and
the noncentrality parameter (standardized) for the continuous level-2 moderator is:
(25)
(25)
indicates the standardized effect variability of the random slope of the moderation (
) across sites (level 3).
is the proportion of variance at the level-2 intercept that is explained by the level-2 covariate (
), moderator (
), treatment variable (
), and the interaction (
):
The standardized noncentrality parameter for the binary level-2 moderator is:
(26)
(26)
The statistical power for a two-sided test with the degrees of freedom of is:
Let and
the noncentrality parameter (standardized) for the continuous level-3 moderator is:
(27)
(27)
indicates the standardized effect variability of the treatment effect (
) across blocks (level 3), where
is the variance of the treatment effect that is unconditional on any moderator.
The standardized noncentrality parameter for the binary level-3 moderator is:
(28)
(28)
The statistical power for a two-sided test with the degrees of freedom of is:
Note that the effect size of the moderation effect is defined as the standardized coefficient for a continuous moderator in Expressions 23, 25, and 27, and as the standardized mean difference for a binary moderator in Expressions 24, 26, and 28. The parameters (
and
) can be estimated from the data in observational studies without any interventions, or data from the intervention studies controlling for the treatment variables, while the parameters (
and
) must be estimated from the intervention studies.
Formulas for the minimum detectable effect size difference with confidence interval
In addition to knowing the statistical power for a study to detect a desired effect size, it is useful to know the minimum effect size difference that a moderation study can detect with sufficient power (e.g., 80%) given sample sizes. The minimum detectable effect size difference (MDESD) can be expressed as (Bloom, Citation1995, Citation2005, Citation2006; Dong et al., Citation2018; Dong, Spybrook, & Kelcey et al., Citation2020; Murray, Citation1998; Spybrook, Kelcey, & Dong et al., Citation2016):
(29)
(29)
where
for one-tailed tests with v degrees of freedom, and
for two-tailed tests.
is the standard error of the moderation effect estimate as in Expressions 4, 6, 10, 11, 15 & 16.
is the standard deviation of the outcome measure (Y), and is defined as the square root of the total unconditional variance in Expressions 20-22,
Hence, the MDESD regarding the standardized coefficient for a continuous level-1 moderator is:
(30)
(30)
where the degrees of freedom of
The 100*(1-α)% confidence interval for is given by:
(31)
(31)
The MDESD regarding the standardized mean difference for a binary moderator is:
(32)
(32)
The 100*(1-α)% confidence interval for is given by:
(33)
(33)
Similarly, the MDESD and its 100*(1-α)% confidence interval for a continuous or binary level-2 or −3 moderator are presented in .
Table 2. Summary of standardized noncentrality parameters, MDESD and 100*(1-α)% confidence intervals for three-level MCRTs.
The nonrandomly varying slope model
A nonrandomly varying slope model assumes that the moderator effect does not randomly varies across sites when the moderator is at level 1 or 2, and/or the treatment effect does not randomly vary across sites after controlling for the level-3 moderator. An approach similar to that of the random slope model can be used for deriving formulas for the power and the MDESD for the designs in . For example, for Model MCRT3-2N-1, where the treatment effect is assumed to nonrandomly varying, i.e., only varying by the moderator but not randomly varying across schools, and the coefficient of the level-1 moderator () is not randomly varying across level-2 clusters, hence, only the third component under the square root in Expressions 4 & 6 is left for the standard error of the moderator effect estimate (
).
Similarly, the moderation effect does not randomly vary across sites for Model MCRT3-2N-2 and the treatment effect does not randomly vary across sites after controlling for level-3 moderator for MCRT3-2N-3, the standard error of the moderator effect estimate is only associated with the second and third components under the square root in Expressions 10, 11, 15, and 16. It results in the same power and MDESD formulas for MCRT3-2N-2 and MCRT3-2N-3 (). All the formulas for power and MDESD for the nonrandomly varying slope model in three-level MCRTs are presented in .
Monte Carlo simulations
We conducted Monte Carlo simulations to examine whether the standard error and power formulas that we derived were consistent with the simulated results. The procedures for the Monte Carlo simulation are below:
We generated data using six HLMs in . For each model, we generated data for a continuous and a binary moderator separately, and with a nonzero and zero moderator effect separately. Hence, there were 24 scenarios: 3 (levels of moderators) × 2 (random and nonrandomly varying slopes) × 2 (scales of the moderator: continuous and binary) × 2 (nonzero and zero moderator effect).
We used SAS PROC MIXED to analyze the datasets. We estimated the unconditional ICCs at school and teacher levels using the unconditional HLMs. We calculated the moderator effect, the standardized effect variability of the moderation across sites for level-1 moderator,
the standardized effect variability of the moderation across sites for level-2 moderator,
The moderator effect was standardized to the standardized mean difference for the binary moderators or the standardized coefficient for the continuous moderators; a p-value of the moderator effect that is less than 0.05 was coded a rejection of the null hypothesis of no moderation.
We replicated Steps (1) to (3) 2,000 times and calculated the means of the moderator effect size and the other parameters; The standard deviation of 2,000 moderator effect sizes served as the standard error estimate based on the empirical distribution of the moderator effect; We also calculated the standard error based on our formulas, and constructed the 95% confidence interval (CI) for each point estimate; we calculate the absolute difference and relative difference between the standard errors based on our formulas and that from the empirical distribution; we calculate the coverage rate of the 95% CI as the percentage of the 95% CI based on our formulas covering the true moderator effect. The proportion of times the null was rejected across the 2,000 replications estimated the Type I error rate when the moderation effect was set to 0 and the empirical power when the moderation effect was not set as 0; We compared the power and Type I error rate calculated from our derived formulas with those estimated from simulation.
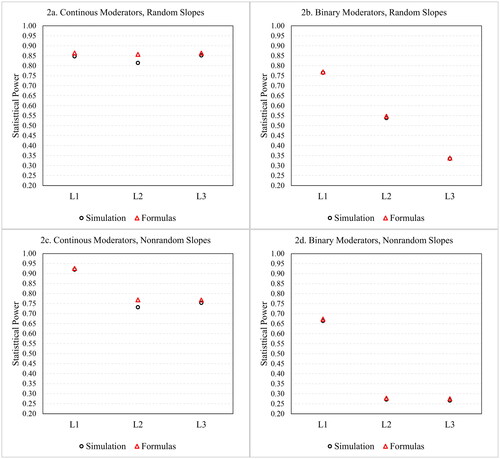
The results provided evidence of the close correspondence on standard errors and power (or Type I error) between our formulas and the empirical distribution from the simulation. For example, in all scenarios the absolute difference and relative difference between the SE based on the empirical distribution of the moderator effect estimates and SE calculated from our formulas range from 0.000 to 0.005 and from −6.1% to 0.0%, respectively. The coverage rate of the 95% confidence interval (CI) ranges from 0.94 to 0.97. The absolute difference between the Type I error calculated from the formulas and that estimated from simulation ranges from 0.001 to 0.012; The absolute difference between the power calculated from the formulas and that estimated from simulation ranges from 0.004 to 0.043. presents the plots of power of levels-1, −2, and −3 moderators from simulation and formulas varying by the scales of moderators (continuous and binary) and slopes (random or nonrandom). Black circles represent power from simulation, and red triangles represent power from formulas.
Figure 2. Power from simulation and formulas.
Note. Simulation results were based on 2,000 replications. Under the assumptions: The intraclass correlation coefficients at Level-2 and 3: = 0.1, and
= 0.2; The proportions of variances at level 1 and level 2 explained by covariates:
=
= 0.50; The proportion of clusters assigned to the treatment group, P = 0.5;
=
=
= 0.5 for binary moderators. For random slope models, the standardized effect variability of the moderation across sites for Level-1 moderator (
) and Level-2 moderator (
) are 0.05, the standardized variability of the treatment effect across sites for Level-3 moderator (
) is 0.09, the standardized effect variability of Level-1 moderator across Level-2 units (
) is 0.05, the moderator effect size = 0.20, sample size per level-2 unit (n) is 20, sample size per site (J) is 10, and total sample size of sites (K) is 20. For nonrandom slope models, the moderator effect size = 0.10, sample size per level-2 unit (n) is 20, sample size per site (J) is 4 for level 1 moderator and 10 for levels-2 and 3 moderators, and total sample size of sites (K) is 20 (except for binary level-1 moderator, K = 40).
Conclusion
This study provided a conceptual and statistical framework to guide the design and analysis of MCRTs. We derived the formulas to calculate the statistical power and MDESD with confidence intervals, and validated our formulas with Monte Carlo simulation. The results will have the potential to substantively impact our understanding of treatment effect variation by providing comprehensive tools to researchers to design rigorous multisite moderation studies. The framework and statistical formulas are expected to expand the scope and enhance the quality of evidence in examining the programs “work for whom and under what circumstances”. Some suggestions are below.
First, when we design a three-level MCRT to investigate the treatment effect heterogeneity, we have multiple options to consider: the individual or contextual factors that may moderate the treatment effect, and these moderators can be at either level-1, −2, or −3; the moderators can be either binary or continuous; the (moderated) treatment effect can be either random or nonrandomly varying. It is important to be inclusive by focusing on confirmatory hypothesis testing based on program theory as well as additional exploratory hypothesis testing of moderation. For example, a MCRT with adequate power for the main effect analysis will likely also be adequately powered to for the level-1 moderator effect analysis. Similarly, a MCRT with adequate power for the level-2 moderator effect analysis will be very likely for the main effect and level-1 moderator effect analysis with adequate power.
Second, our formulas assume that the sample size n is same across level-2 clusters and j is the same across sites, is the same across level-2 clusters, and P and
are the same across sites. In practice, it is more likely to have an unbalanced design. Dong et al. (Citation2021) conducted a simulation in two-level MRTs and found that the power calculation based on the geometric means of these sample sizes approximated the power from the simulation very well, the geometric means performed better than the harmonic means which underestimated the actual power and the arithmetic means which overestimated the actual power. We suggest using the geometric means of the sample sizes in the calculation of power or MDESD for the unbalanced designs.
Finally, it is important to justify the parameters used for a power analysis based on the literature or pilot studies (Bloom et al., Citation2007; Dong et al., Citation2016, Citation2022; Hedges & Hedberg, Citation2007, Citation2013; Phelps et al., Citation2016). The power is sensitive to some parameters (e.g., ) and less sensitive to other parameters (e.g., P,
and
when they are close to 0.5). The researchers may conduct a series of power analysis with a range of parameter values, especially for the parameter values that are less documented in the literature such as the treatment/moderator effect heterogeneity.
Hence, one direction for future research is to conduct more empirical studies to report the design parameters in three-level design such as ICCs, treatment/moderator effect heterogeneity, and meaningful size regarding the moderator effects. Furthermore, this study focused on three-level MCRTs where treatment is at level 2. The extension to three-level MRTs with treatment is at level 1 may enhance researchers’ capacity to investigate multisite moderation with level-1, −2, and −3 moderators. In addition, although we expect that the power formulas are fairly robust to violation of normality assumptions for moderators based on prior research (Dong et al., Citation2021), the power can be affected by unreliability in the measurement of the moderator and outcome (Kelcey, Cox, & Dong et al., Citation2021), additional partially nested data structures (Cox et al., Citation2022), and missing data. Future studies to address these aspects are also needed. Finally, based on the formulas presented in this article, creating free publicly available software packages with a tutorial would facilitate applied researchers in their design of multisite moderation studies.
Additional information
Funding
References
- Baron, R. M., & Kenny, D. A. (1986). The moderator-mediator variable distinction in social psychological research: Conceptual, strategic and statistical considerations. Journal of Personality and Social Psychology, 51(6), 1173–1182. https://doi.org/10.1037//0022-3514.51.6.1173
- Bloom, H. S. (2006). The core analytics of randomized experiments for social research. MDRC Working Papers on Research Methodology. http://www.mdrc.org/ publications/437/full.pdf
- Bloom, H. S. (1995). Minimum detectable effects: A simple way to report the statistical power of experimental designs. Evaluation Review, 19(5), 547–556. https://doi.org/10.1177/0193841X9501900504
- Bloom, H. S. (2005). Randomizing groups to evaluate place-based programs. In H. S. Bloom (Ed.), Learning more from social experiments: Evolving analytic approaches, 115–172. New York: Russell Sage Foundation.
- Bloom, H. S., Richburg-Hayes, L., & Black, A. R. (2007). Using covariates to improve precision for studies that randomize schools to evaluate educational interventions. Educational Evaluation and Policy Analysis, 29(1), 30–59. https://doi.org/10.3102/0162373707299550
- Bloom, H. S., & Spybrook, J. (2017). Assessing the precision of multisite trials for estimating the parameters of a cross-site population distribution of program effects. Journal of Research on Educational Effectiveness, 10(4), 877–902. https://doi.org/10.1080/19345747.2016.1271069
- Borenstein, M., & Hedges, L. V. (2012). CRT-power – power analysis for cluster-randomized and multi-site studies [Computer software]. Biostat.
- Cox, K., Kelcey, B., & Luce, H. (2022). Power to detect moderated effects in studies with three-level partially nested data. The Journal of Experimental Education, Advance Online Publication, 1–24. https://doi.org/10.1080/00220973.2022.2130130
- Domitrovich, C., Bradshaw, C. P., Berg, J., Pas, E. T., Becker, K., Musci, R., Embry, D. D., & Ialongo, N. (2016). How do school-based prevention programs impact teachers? Findings from a randomized trial of an integrated classroom management and social-emotional program. Prevention Science : The Official Journal of the Society for Prevention Research, 17(3), 325–337. https://doi.org/10.1007/s11121-015-0618-z
- Dong, N., & Maynard, R. A. (2013). PowerUp!: A tool for calculating minimum detectable effect sizes and minimum required sample sizes for experimental and quasi-experimental design studies. Journal of Research on Educational Effectiveness, 6(1), 24–67. https://doi.org/10.1080/19345747.2012.673143
- Dong, N., Herman, K. C., Reinke, W. M., Wilson, S. J., & Bradshaw, C. P. (2022). Gender, racial, and socioeconomic disparities on social and behavioral skills for K-8 students with and without interventions: An integrative data analysis of eight cluster randomized trials. Prevention Science, https://doi.org/10.1007/s11121-022-01425-w
- Dong, N., Kelcey, B., & Spybrook, J. (2018). Power analyses of moderator effects in three-level cluster randomized trials. The Journal of Experimental Education, 86(3), 489–514. https://doi.org/10.1080/00220973.2017.1315714
- Dong, N., Kelcey, B., & Spybrook, J. (2021). Design considerations in multisite randomized trials to probe moderated treatment effects. Journal of Educational and Behavioral Statistics, 46(5), 527–559. https://doi.org/10.3102/1076998620961492
- Dong, N., Reinke, W. M., Herman, K. C., Bradshaw, C. P., & Murray, D. W. (2016). Meaningful effect sizes, intraclass correlations, and proportions of variance explained by covariates for panning two- and three-level cluster randomized trials of social and behavioral outcomes. Evaluation Review, 40(4), 334–377. https://doi.org/10.1177/0193841X16671283
- Dong, N., Spybrook, J., Kelcey, B., & Bulus, M. (2021). Power analyses for moderator effects with (non)random slopes in cluster randomized trials. Methodology, 17(2), 92–110. https://doi.org/10.5964/meth.4003
- Hedges, L. V., & Hedberg, E. (2007). Intraclass correlation values for planning group randomized trials in education. Educational Evaluation and Policy Analysis, 29(1), 60–87. https://doi.org/10.3102/0162373707299706
- Hedges, L. V., & Hedberg, E. (2013). Intraclass correlations and covariate outcome correlations for planning two- and three-level cluster-randomized experiments in education. Evaluation Review, 37(6), 445–489. https://doi.org/10.1177/0193841X14529126
- Herman, K. C., Dong, N., Reinke, W. M., & Bradshaw, C. P. (2022a). Accounting for traumatic historical events in randomized controlled trials. School Psychology Review. Advance Online Publication, 1–17. https://doi.org/10.1080/2372966X.2021.2024768
- Herman, K. C., Reinke, W. M., Dong, N., & Bradshaw, C. (2022b). Can effective classroom behavior management increase student achievement in middle school? Findings from a group randomized trial. Journal of Educational Psychology, 114(1), 144–160. https://doi.org/10.1037/edu0000641
- Ialongo, N. S., Domitrovich, C., Embry, D., Greenberg, M., Lawson, A., Becker, K. D., & Bradshaw, C. A. (2019). Randomized controlled trial of the combination of two school-based universal preventive interventions. Developmental Psychology, 55(6), 1313–1325. https://doi.org/10.1037/dev0000715
- Kelcey, B., & Phelps, G. (2013). Considerations for designing group randomized trials of professional development with teacher knowledge outcomes. Educational Evaluation and Policy Analysis, 35(3), 370–390. https://doi.org/10.3102/0162373713482766
- Kelcey, B., Cox, K., & Dong, N. (2021). Croon’s bias-corrected factor score path analysis for small to moderate sample multilevel structural equation models. Organizational Research Methods, 24(1), 55–77. https://doi.org/10.1177/1094428119879758
- Kelcey, B., Hill, H., & Chin, M. (2019). Teacher mathematical knowledge, instructional quality, and student outcomes: A multilevel mediation quantile analysis. School Effectiveness and School Improvement, 30(4), 398–431. https://doi.org/10.1080/09243453.2019.1570944
- Kelcey, B., Phelps, G., Spybrook, J., Jones, N., & Zhang, J. (2017). Designing large-scale multisite and cluster-randomized studies of professional development. The Journal of Experimental Education, 85(3), 389–410. https://doi.org/10.1080/00220973.2016.1220911
- Kelcey, B., Spybrook, J., & Dong, N. (2019). Sample size planning in cluster-randomized studies of multilevel mediation. Prevention Science : The Official Journal of the Society for Prevention Research, 20(3), 407–418. https://doi.org/10.1007/s11121-018-0921-6
- Kelcey, B., Spybrook, J., Dong, N., & Bai, F. (2020). Cross-level mediation in school-randomized studies of teacher development: Experimental design and power. Journal of Research on Educational Effectiveness, 13(3), 459–487. https://doi.org/10.1080/19345747.2020.1726540
- Konstantopoulos, S. (2008). The power of the test for treatment effects in three-level block randomized designs. Journal of Research on Educational Effectiveness, 1(4), 265–288. https://doi.org/10.1080/19345740802328216
- Murray, D. (1998). Design and analysis of group-randomized trials. Oxford University Press.
- Phelps, G., Kelcey, B., Liu, S., & Jones, N. (2016). Informing estimates of program effects for studies of mathematics professional development using teacher content knowledge outcomes. Evaluation Review, 40(5), 383–409. https://doi.org/10.1177/0193841X16665024
- Raudenbush, S. W., & Bryk, A. S. (2002). Hierarchical linear models: Applications and data analysis methods (p. 485). SAGE.
- Raudenbush, S. W., & Liu, X. (2000). Statistical power and optimal design for multisite randomized trials. Psychological Methods, 5(2), 199–213. https://doi.org/10.1037/1082-989x.5.2.199
- Raudenbush, S. W., Spybrook, J., Congdon, R., Liu, X., & Martinez, A. (2011). Optimal design software for multi-level and longitudinal research (version 2.01) [Computer software]. www.wtgrantfoundation.org.
- Reinke, W. M., Herman, K. C., & Dong, N. (2018). The incredible years teacher classroom management program: Outcomes from a group randomized trial. Prevention Science : The Official Journal of the Society for Prevention Research, 19(8), 1043–1054. https://doi.org/10.1007/s11121-018-0932-3
- Reinke, W. M., Stormont, M., Herman, K. C., & Dong, N. (2021). The incredible years teacher classroom management program: Effects for students receiving special education services. Remedial and Special Education, 42(1), 7–17. https://doi.org/10.1177/0741932520937442
- Rossi, P. H., Lipsey, M. W., & Freeman, H. E. (2004). Evaluation: A systematic approach. Sage.
- Schochet, P. Z. (2011). Do typical RCTs of education interventions have sufficient statistical power for linking impacts on teacher and student outcomes? Journal of Educational and Behavioral Statistics, 36(4), 441–471. https://doi.org/10.3102/1076998610375840
- Sinclair, J., Reinke, W. M., Herman, K. C., Dong, N., & Stormont, M. (2021). Effects of a universal classroom management intervention on middle school students at risk for behavior problems. Remedial and Special Education, 42(1), 18–30. https://doi.org/10.1177/0741932520926610
- Snijders, T. (2001). Sampling. In A. H. Leyland & H. Goldstein (Eds.), Multilevel modeling of health statistics (pp. 159–173). John Wiley.
- Snijders, T. (2005). Power and sample size in multilevel linear models. In B. S. Everitt & D. C. Howell (Eds.), Encyclopedia of statistics in behavioral science (Vol. 3, pp. 1570–1573). Wiley.
- Spybrook, J., & Raudenbush, S. W. (2009). An examination of the precision and technical accuracy of the first wave of group-randomized trials funded by the institute of education sciences. Educational Evaluation and Policy Analysis, 31(3), 298–318. https://doi.org/10.3102/0162373709339524
- Spybrook, J., Kelcey, B., & Dong, N. (2016). Power for detecting treatment by moderator effects in two and three-level cluster randomized trials. Journal of Educational and Behavioral Statistics, 41(6), 605–627. https://doi.org/10.3102/1076998616655442
- Spybrook, J., Shi, R., & Kelcey, B. (2016). Progress in the past decade: An examination of the precision of cluster randomized trials funded by the U.S. Institute of Education Sciences. International Journal of Research & Method in Education, 39(3), 255–267. https://doi.org/10.1080/1743727X.2016.1150454
- U.S. Department of Education Institute of Education Sciences & National Science Foundation. (2013). Common guidelines for education research and development (NSF 13-126). Retrieved February 15, 2014, from http://ies.ed.gov/pdf/CommonGuidelines.pdf
- Wayne, A. J., Yoon, K. S., Zhu, P., Cronen, S., & Garet, M. S. (2008). Experimenting with teacher professional development: motives and methods. Educational Researcher, 37(8), 469–479. https://doi.org/10.3102/0013189X08327154
- Weiss, M., Bloom, H. S., & Brock, T. (2014). A conceptual framework for studying the sources of variation in program effects. Journal of Policy Analysis and Management, 33(3), 778–808. https://doi.org/10.1002/pam.21760