
Abstract
Spatial thinking is a crucial aspect of geography education with which all citizens should be equipped. This study employs eye-tracking technology to research strategies (their repertoire, distribution, effectiveness, and adaptiveness) used by upper-secondary students when analyzing spatial patterns with thematic maps. The results show that students have a broad repertoire of strategies and are mostly able to adapt them to the specific task demands. Moreover, the efficiency of students’ strategies gradually increases as they get familiar with the task type and the maps analyzed. Based on the findings, how to appropriately develop students’ strategies in geography lessons is suggested.
Introduction
Geography education generally aims to enhance students’ geographical thinking. Therefore, geography educators around the world develop teaching activities and pedagogical principles to teach students to reason spatially (Ford Citation1984), to understand spatial patterns by analyzing and interpreting different representations (Metoyer and Bednarz Citation2017), to think about human–nature interactions (International Geographic Union – Commission on Geographical Education Citation2016), and to construct reliable theories to help them better understand the world (Leat Citation2008).
It is obvious that geographical thinking requires, inter alia, the application of spatial thinking and its components (Metoyer and Bednarz Citation2017). Specifically, it requires knowing the concepts of space (such as spatial associations, spatial patterns, and networks – see, e.g., Gersmehl and Gersmehl Citation2007; Golledge Citation2002), using various tools of representation (maps, sketches, models), and applying processes of reasoning (recognizing, evaluating, synthesizing, generalizing) (National Research Council Citation2006). This specific way of thinking is especially valued for its high applicability to everyday problem-solving, with which all reasoning citizens should be equipped (Marsh, Golledge, and Battersby Citation2007; Battersby, Golledge, and Marsh Citation2006; National Research Council Citation2006; Golledge Citation2002).
In geography, spatial thinking is almost exclusively related to “the geographical space.” As a result, the term geospatial thinking is used to distinguish it from spatial thinking in STEM fields in some studies (Lobben and Lawrence Citation2015; Ishikawa Citation2013). Notwithstanding slightly different definitions of and approaches to (geo)spatial thinking, varying, among other things, in the list of cognitive skills and operations included (Hanus and Havelková Citation2019; Albert et al. Citation2016; Gökçe Citation2015; Shin Citation2006; Wiegand Citation2006; Anderson Citation1985; Meyer Citation1973), there is a consensus that (geo)spatial thinking can be taught and learned (Lee and Bednarz Citation2009; Wright et al. Citation2008; etc.).
Despite the importance of spatial thinking in geography education and the fact that the body of knowledge of how it develops is growing, no model explaining its development is widely accepted (Metoyer and Bednarz Citation2017). For this reason, there is still a need for further research. To understand more complexly how students develop and use their spatial thinking skills, it is crucial to be aware of the strategies used to solve spatial tasks. Even more important is to subsequently recognize the cognitive variability of these strategies, which enables students to flexibly adapt to tasks’ inherent characteristics and to transitory situational demands. Given that, research on the strategy repertoire (Which strategies are used?), strategy distribution (When is each strategy used?), strategy efficiency (How is each strategy executed?), and the adaptiveness of strategy choice (How are strategies chosen?) is needed (Lemaire and Siegler Citation1995).
Therefore, this study aims to investigate the strategies that students choose when applying spatial thinking, specifically for analysis of spatial patterns and spatial relations using different types of maps. The article thus addresses the following research questions:
What are the strategy repertoire, distribution, and efficiency of students when solving multiple-choice problems requiring use of maps?
Are the strategy choice and its adaptiveness influenced by the task demand and by the type of map used?
The process of spatial problem-solving and the strategies used are still inadequately studied, although researchers have been paying attention to this issue for several decades (Kim et al. Citation2015; Wigglesivorth Citation2003; Rozencwajg Citation1991; Carpenter and Just Citation1983; Snow Citation1980; Barratt Citation1953). The studies have applied various research methods (written report, thinking aloud interview, retrospective thinking aloud, retrospective questionnaire, video study, etc.), to bring insights on this issue. Nevertheless, most of them operated with mediated data, i.e., participants’ self-reported strategies, which limits the objectivity, usability, and overall reliability of the results. Given that, other research techniques and data collection methods must be implemented to avoid this limitation.
Specifically, modern devices allow the development and implementation of more objective research methods based on the tracking of eye movement. The eye tracking enables one to evaluate not only the behavior, and therefore directly identify the strategies, of users when solving a wide variety of tasks, but also the influence of selected independent variables on them (e.g., Sun, Lu, and Wang Citation2020; Gołębiowska, Opach, and Rød Citation2017; Kim et al. Citation2015; Mason, Pluchino, and Ariasi Citation2014). The knowledge of strategies, their dimensions, and factors affecting them can be useful to model the enhancement of spatial thinking and, subsequently, to improve educational principles. Moreover, understanding the diversity of strategies used in problem-solving with maps can help educators when modeling the “optimal” (the most effective) strategies and when identifying pedagogical and cognitive bottlenecks during spatial thinking development (Havelková and Gołębiowska Citation2020; Havelková and Hanus Citation2019b).
Strategies of spatial analysis
Kerski (Citation2013) defines spatial thinking as identifying, analyzing, and understanding the location, scale, patterns, and trends of the geographic and temporal relationships among data, phenomena, and issues. Spatial thinking, then, is a way of processing spatial data using various cognitive strategies. Strategies are understood as the ways (sequences of operations) in which individuals process a given cognitive task (Eme and Marquer Citation1999). Nazareth, Odean, and Pruden (Citation2016) argue that exposure to spatial content, activities, or tasks results in activation of cognitive strategies to solve spatial problems, i.e., it results in spatial thinking. Therefore, capturing those spatial components (e.g., map elements, sketches, and models) which the individual deems to be attention-worthy and the order in which the individual is processing spatial data reveals their strategies of spatial thinking (Duchowski Citation2007).
Strategies are highly variable and dependent on various factors, for example, experience level or educational background (Dong et al. Citation2018; Çöltekin et al. Citation2017; Ooms, De Maeyer, and Fack Citation2014; Gerber, Lidstone, and Nason Citation1992). They can be described and compartmentalized using fundamental theories from the areas of educational and cognitive psychology, such as the theory of learning, the theory of mental representation, the theory of cognitive load, and other theories that are relevant to the problem-solving process in general (Paas, Renkl, and Sweller Citation2003; Haider and Frensch Citation1996; MacEachren Citation1995; Svenson Citation1992; J. R. Anderson Citation1983; Gagné Citation1977).
Considering the aims of the study, the framework of the differentiation and consolidation theory of decision-making was used to describe strategies in this article (Svenson Citation1992). It models human decision-making as an active process in which one alternative is gradually differentiated from other available alternatives. The basic assumption of this theory is that it is not enough to choose one of the alternatives, but that a decision involves the selection and creation of the alternative that is sufficiently superior (Svenson Citation1992).
The process of decision-making when solving a problem can be differentiated into several phases: (1) problem recognition, (2) gathering information relevant to solving the problem, (3) evaluation of obtained information, (4) selection of the superior alternative, and (5) consolidation and evaluation of the decision (Svenson Citation1992).
To identify and distinguish the individual phases of decision making, the eye-mind hypothesis can be employed. This hypothesis states that there is a strong correlation between where an individual is looking and what he or she is thinking about, i.e., what information he or she is processing in his or her mind (Just and Carpenter Citation1976). Considering this, we can observe what information is used in different phases of the decision-making process using eye-tracking. Then, the eye-tracking data have the potential to explain the solving behavior and the strategies for spatial tasks (Fehringer Citation2020).
The implementation of the eye-mind hypothesis (and the eye-tracking technology) can be supported by a compartmentalization of solved tasks. Specifically, (problem-oriented) multiple-choice tasks consist of three general elements: a task assignment (hereinafter termed “task”), decision alternatives, and supplementary materials containing information (ir)relevant for making a decision/solving the problem. The task compartmentalization, together with Svenson’s decision-making structure and the expert cognitive walkthrough sessions (Polson et al. Citation1992), can be employed to set possible strategies of problem-solving.
This approach was used in the pilot study (Havelková and Hanus Citation2019b) to set and validate hypothetical strategies for solving spatial analysis multiple-choice tasks that require the use of maps. Each proposed strategy starts with the study of the task assignment based on Svenson’s (Citation2003) assumption that each process starts with recognizing the problem. In subsequent research by Havelková and Gołębiowska (Citation2020), these hypothetical strategies were structured into four general strategy types based on the order of problem-solving (decision-making) phases.
When applying these general strategy types to the process of spatial thinking using maps, more specific hypothetical strategies can be deduced. For this reason, each of the multiple-choice tasks used in this study was compartmentalize into basic elements, i.e., five areas of interest (AOIs) were designated: task assignment (T), map face (M), legend (L), decision alternatives (A), and other map layout elements, i.e., scale and north arrow (S). According to the order in which individuals process information from these basic task elements, four general types of strategies used to solve the map tasks are described (see also ):
Figure 1. Four general types of strategies used for solving multiple-choice tasks with examples. Note: Individual AOIs are highlighted using the gray boxes.
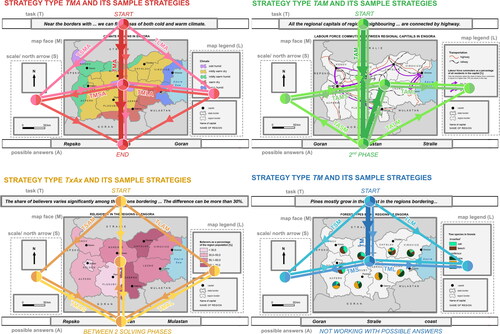
TMA type and its strategies – Task » MapFootnote1 » Answers – study the task assignment (T) to become familiar with the problem, then use a map to gather information and solve the problem, and, subsequently, compare the solution with the given alternatives (A).
TAM type and its strategies – Task » Answers » Map – study the task assignment (T) to become familiar with the problem, then check given possible answers (A) and, finally, solve the problem/verify the alternatives using the information in the map.
TxAx type and its strategies – Task » Map » Answers » Map – study the task assignment (T) to become familiar with the problem, then start to solve the problem using a map, check the given alternatives (A), and, finally, solve the problem. This strategy is a combination of the previous two types – it starts as the TMA type, but in the middle of the process, it shifts to the verification of given alternatives (according to TAM).
TM type and its strategies – Task » Map – study the task assignment (T) to become familiar with the problem, then use a map to gather information and solve the problem. This type would be typical for open-ended tasks; however, some participants may use it to solve the multiple-choice task with no need to pay attention to given alternatives.
Based on these assumptions, a list of all potentially used strategies was created (Havelková and Gołębiowska Citation2020; Havelková and Hanus Citation2019b) and used to address this study’s research questions, employing a spatiotemporal theory-driven approach for the identification and analysis of students’ strategies. The theory-driven approach for strategy identification was preferred over data-driven approaches considering the results of previous studies that showed that deriving strategies simply from acquired eye-tracking data is appropriate only for relatively easy tasks that all students solve quickly, not for cognitively more demanding tasks. Since the presumable excessive difference in the process of solving these tasks and in its duration among individuals hinders the data-driven identification of similarities in strategies and, thus, their classification into general strategy types, and interpretation of findings toward educational practice (for more details, see Havelková and Hanus Citation2019b).
Based on the chosen theory-driven approach, students can solve a task in one or more solving cycles into which their task-solving process can be divided. The new solving cycle starts, in accordance with Svenson’s (Citation1992) theory, when students are getting familiar with the given task (i.e., are reading the task assignment). In each solving cycle, students pay attention to/work with task elements in a chosen order that defines a chosen strategy (see ). When students need more than one solving cycle to solve a task, they can repeatedly choose the same strategy in all the cycles, or they can combine a few different strategies. As mentioned above, these strategies were categorized into four general strategy types (TMA, TAM, TxAx, and TM). From this point of view, students can use different strategies in each solving cycle (throughout their task-solving process) but from one strategy type or different strategies from different strategy types.
Table 1. Explanation of the strategy abbreviations based on the order of the processed task elements.
Several previous studies focusing on students’ spatial-thinking or problem-solving strategies found that many students have a rich set of strategies that they can use to solve a given task (e.g., Maresch Citation2018; Strasser et al. Citation2010; Luwel, Torbeyns, and Verschaffel Citation2003; Lemaire and Siegler Citation1995). According to Lemaire and Siegler (Citation1995) model of strategic change, the acquired set of strategies is only one of the four dimensions of strategic competence which influence the overall efficiency of task solving process. Thus, to understand the development of strategy proficiency, it is necessary to not only identify the variety of student’s strategies used for a particular class of tasks, i.e., strategy repertoire, but the relative frequency of each strategy use, i.e., strategy distribution, the accuracy and the speed of strategy execution, i.e., strategy efficiency, and the adequacy of strategy choice in relation to certain task specifics, i.e., adaptiveness of strategy choice.
Methods
Study design
Previous studies
The present study follows up on a previously conducted study (see Havelková and Hanus Citation2019b). Its aim was firstly to pilot the eye-tracking version of the previously developed achievement test for identification of map skill level and to verify its applicability to strategy identification (Havelková and Hanus Citation2018). Secondly, the usability of various methodological approaches commonly used to identify strategies based on collected eye-tracking data for research on problem-solving with maps was evaluated.
Participants
A total of 53 students from 10 school classes in six gymnasia (i.e., selective secondary schools) in Prague (Czechia) participated in the present study. All participating students were in the penultimate (3rd) or last (4th) year of gymnasium and had finished their mandatory geography education. Given that, their level of map skills and strategies used for map task-solving should be the highest possible developed by Czech upper secondary education. The average age of students was 17.7 (± 0.9) years. All students had normal or corrected-to-normal vision and completed the experiment independently.
The study was carried out in accordance with the recommendations provided by the ethical committee of the university where both authors are affiliated with written informed consent from all subjects. The students voluntarily participated in the study and anonymity of acquired data was guaranteed. The students did not receive any reward for participation.
Materials
Various methods of data collection were employed, both qualitative and quantitative. The eye-tracking was used for the identification of participants’ strategies (their repertoire, distribution, efficiency, and adaptiveness of their choice). Moreover, the follow-up questionnaire was used given that eye-tracking itself is not sufficient to understand the reasoning behind the students’ strategy choice and adaptation thereof.
For the eye-tracking experiment, a modified and piloted version of the achievement test was used (see Havelková and Hanus Citation2019b, Citation2018). The test consists of 12 tasks focusing on thematic map analysis. Each task was presented as an individual stimulus together with the map, its basic map layout elements (i.e., legend, graphic scale, and north arrow), and three possible answers (one correct answer and two distractors; see ).
The tasks can be divided into four sets based on the mapping method used. The widely used mapping methods in school atlases and geography textbooks were chosen, namely area-shading, line symbols, choropleth mapping, and diagram mapping (Havelková and Hanus Citation2018). Different mapping methods were used to test if and, if yes, how the chosen visual representation influences the dimensions of the strategies (specifically distribution and adaptiveness of choice) used by the students. All other characteristics of map design and map layout were homogenized. The maps represent a fictional area (country) and data to avoid the potential influence of previous knowledge about depicted phenomena and familiarity with the area.
In addition, the task demand was manipulated to investigate its impact on the strategy distribution and adaptiveness of strategy choice. All tasks require students to analyze a thematic map, specifically, to analyze the spatial distribution of phenomena. The tasks differ only in the means used during the analysis of the distribution. The first tasks for each given mapping method do not require any special means. The second tasks are focused on analyzing the distances, i.e., using a map scale. The third tasks are focused on using the cardinal points for the description of the spatial distribution (see ).
Table 2. Tasks used in the eye-tracking experiment.
The follow-up questionnaire focused on three main aspects of the eye-tracking testing: its perceived difficulty by participants, participants’ explanation of incorrectly solved tasks, and on participants’ view of strategy/strategies used. Regarding the strategies, participants were asked to state if they worked with and how frequently they went back to individual task elements (e.g., north arrow, map legend) and to explain why. Moreover, they were asked to describe how they proceeded when they were solving the tasks through ordering the task elements in a sequence in which they prevailingly worked with them. The description of their strategy was followed by questions focused on the participant’s view on how their choice of strategy changed during the testing and the influence of the task demand and map type on it.
Eye-tracking apparatus and setting
For the collection of eye movement data, the SMI RED250 system with a sampling rate of 250 Hz was used. The apparatus tracks participant eye movements using a camera attached below the laptop monitor. A 15.6-inch monitor (1920 × 1080) was used, in front of which the participants were properly seated at a viewing distance of 65 ± 5 cm.
The experiment was conducted in a dedicated room with appropriate lighting and no disruptions in the participating schools. Participants’ eyes were calibrated with a 9-point, full-screen calibration directly prior to the eye-tracking experiment. A calibration threshold was set at 1° of visual angle, as is commonly recommended (Duchowski Citation2007).
Procedure
After getting acquainted with the study framework and aims and signing the informed consent, the participants were instructed regarding the eye-tracking experiment. Among other things, they were told to take as much time as they need for solving each task and to say their chosen answer aloud to the researcher seated next to them who then displayed the next task and noted the spoken answer in the protocol. Participants’ comprehension of the instructions was verified by solving a training task. After the instructional phase, the eye-tracking test itself started.
For the eye-tracking test, a mixed design was adopted to fulfill the set aims. Specifically, the task demand and the used mapping method were the within-subject independent variables, as all participants solved all tasks. Nevertheless, the order of mapping methods (i.e., also of task sets) differed and, therefore, was a between-subjects independent variable. This variable was designated to ensure that the difference in strategy dimensions among various mapping methods was not caused by a learning effect.
Thus, the participants were randomly divided into two groups. The order of the mapping method for version A was area-shading, linear symbols, choropleth and diagram mapping (see ). For version B, the order was choropleth and diagram mapping, area-shading, and linear symbols.
The eye-tracking experiment took from 3.1 to 11.9 minutes (mean duration = 7.0 min). Once the participants finished the eye-tracking experiment, they were given the follow-up questionnaire. In total, all study phases lasted approximately 35 minutes for each participant.
Data analysis
The eye-tracking data were exported from the SMI application BeGaze, converted, and imported into the open-source application OGAMA (Vosskühler et al. Citation2008). For data conversion, the SMI2OGAMA convertor was used (http://eyetracking.upol.cz/smi2ogama). The fixation threshold was set to a duration of 80 ms and a radius of 50 px based on Popelka’s (Citation2014) recommendations.
Prior to the eye-tracking data analysis, the relative share of data loss was calculated for each participant and each task. Based on the calculation, one participant with average data loss higher than 5% and one participant with data loss higher than 15% for three tasks were excluded from the research sample.
Strategy identification
To identify participants’ strategies, the collected eye-tracking data were analyzed using the GazeReplay method, i.e., by analyzing the video recordings of participants’ eye movements. Based on detailed and repeated analysis of the recordings, both authors independently coded the strategies that participants used when they were solving the tasks. During the coding, the used strategies were assigned to the previously presented, theoretically set strategies. See also the online supplemental material with four examples of eye-tracking recordings; each shows a strategy representing one of the four strategy types and is complemented by an illustration of the coding process; the material is available at FigShare (https://doi.org/10.6084/m9.figshare.14625771). The coding followed the coding scheme developed by the authors (Havelková and Hanus Citation2019b).
Specifically, during the replay of eye-tracking data recordings of a given participant, the start of a new solving cycle was always identified first. The cycle start was indicated by participant reading the task, i.e., by fixating on more than half of the task assignment (to ascertain that the attention devoted to the task was caused by the necessity to get familiar with the problem (Svenson Citation2003)). Then the strategy used in the given solving cycle was identified during the eye-tracking data replay. Concretely, the task elements and the order in which participants paid attention to them (i.e., fixated their eyes on them) were marked down using the presented abbreviations (see and ). If the participant fixated alternately on two or more task elements (e.g., legend » map face » legend » map face » legend), these elements were marked down only the first time the attention was devoted to them during the video replay (i.e., as legend » map face). Given that, this flitting does not change the nature of the used strategy and strategy type. For that reason, no coded strategy includes the same character twice (e.g., the code TMAMAL is not possible, this process is coded as TMAL strategy). After identifying the strategy in the first cycle, the same coding process was applied for the rest of the solving cycles if the participant did not solve the task in a single solving cycle (i.e., only once read a half or more of the task assignment before using the other task elements). In a case of disagreement in a strategy code, the authors reviewed the respective recording together and discussed it until they reached agreement.
Results
The results section is structured according to the four dimensions of strategies and their change, i.e., Lemaire and Siegler (Citation1995) model.
Strategy repertoire
Each of the 51 participants solved 12 map tasks in the experiment. As a result, the pool consists of 612 participant-tasks (cases) that were solved using 49 different strategies (see for strategies used more than once). Besides the four distinguished strategy types, it was necessary to introduce an “Other” category that contains strategies that could not be assigned to any of the previously defined types. These are especially incomplete/partial strategies without the usage of the map face.
Table 3. Strategy repertoire and frequency of strategy choice.
All 51 participants used a variable set of strategies to solve all the tasks. The vast majority of students used strategies falling into all strategy types. Only two of them did not use all types – one student left out all strategies from TAM type (see for the explanations of the used abbreviations), and another from the TxAx type. Both, together with 12 other participants, did not use any strategy from the category Other. In case of 10 students, more than half of the tasks were solved using strategies from one type – always from TMA. The rest of the students used the strategies from each type more evenly.
Strategy distribution
A total of 1,628 solving cycles were identified in the pool of 612 participant-tasks. In 41.6% of the cycles, strategies from the TMA type were used. According to the frequency in the solving cycles, the TM, TxAx, and TAM types follows. On the level of strategies, the most frequently used were TLMA and TM, followed by TMA and TMLA. All the most frequently used strategies fall into the TMA and TM types. These two types, which are very close in nature (since the solving process might be the same, only the attention in case of the TM type was not paid to given possible answers) together account for 69.3% of the solving cycles. The most frequent strategies from other types were used in approximately 5% of the cases (TAM and TMAL). The rest of the strategies appeared at a frequency lower than 5%.
Considering the number of solving cycles used and the number of participant-tasks, it is clear that most of the participants used two or more cycles to solve the tasks in the experiment − 2.7 cycles per task and participant on average. A single solving cycle was used for the complete solution of 101 participant-tasks. Specifically, seven participants (of 51) used a single cycle to solve approximately half of the tasks. On the other hand, 25.5% of the participants used exclusively two or more cycles in all tasks. Almost two-thirds (62.7%) of students used five or more cycles in at least one of the tasks. The highest identified number of solving cycles was seven and 13.7% of participants needed it (at least once) to find the task solution.
In those cases when only a single cycle was used to solve a task, the most frequently used strategy type was, again, TMA (66 cases of 101), especially its strategies TLMA and TMLA. The fact that no student only used strategies from the category Other to solve a task confirms the assumption that these are partial strategies used in the combination with other strategies to support the solution of the problem. Since the TM strategy type was also exclusively used in the combinations, it is apparent that the task type strongly affects the choice of strategy, as a separate use of the TM type is expected in the open-ended tasks with no possible answers offered.
In contrast to the tasks solved in a single cycle, 511 participant-tasks were solved in two or more solving cycles – in some cases by multiple use of the same strategy, in others by a combination of strategies from the same type or across different types. The list of the most multiply used strategies almost corresponds to the list of generally most used strategies – the most frequent were TMA and TLMA from the TMA type. Almost one-third of multiply used strategies were from the TM type, with TM strategy ranking third among all strategies.
As the previous text indicates, most of the tasks were solved in two or more solving cycles; the used combinations of strategies were divided into 1,555 pairs of strategies for further analysis (e.g., a combination of TM, TMLA, and TSMA strategies was rewritten as three pairs of strategies, i.e., TM & TMLA, TM & TSMA, and TMLA & TSMA). Because of their frequent use, most combinations were with strategies from the TMA or TM type, and the mutual combinations of these two types were the most frequent. The most frequent combinations on the level of individual strategies were TM + TMA (45 cases), TM + TMLA (37 cases), and TML + TMLA (35 cases). These results again indicate close relationships between the TM and TMA strategy types. However, both types (TM and TMA) were also often used together with the TAM type and TxAx type (see ).
Table 4. Relative structure of combinations between strategy types.
Adaptiveness of strategy choice
Despite the considerable dominance of the strategies from the TMA and TM types, changes in participants’ chosen strategies during the test, i.e., adaptiveness of strategy choice, were identified. Participants mainly adapted their choice of strategy to the specific task demand. The substantial difference in strategies chosen is mainly between the second tasks requiring the use of map scale in order to describe spatial distribution and the rest of the tasks (i.e., the first and third; see ). For the map scale tasks, participants chose the strategies from the TxAx type more frequently (see and ). Participants started to solve the problem, then got familiar with the possible answers given, and afterwards went back to solving the problem. Contrary to the first part of the problem-solving, when they used the map face itself (sometimes together with the map legend), in the second part, they focused on the map scale (i.e., the strategies TMAS, TMLAS, and TLMAS). Additionally, the use of the map scale influenced the most frequently chosen strategies from the TMA type, i.e., TLMSA, TMLSA, and TMSA, two of which are the most complex strategies from this type, as they combine all distinguished task elements (). The strategies from both TMA and TxAx strategy types were also used together with complementary TM strategies. While the combination of TMA and TM strategy types was used in the majority of the tasks, the combination of TM and TxAx strategies was specific to the tasks demanding the map scale use.
Table 5. Accuracy of strategy execution grouped into strategy types and their combinations.
Given that the third tasks, similarly to the second tasks, required the use of an additional element, in this case the north arrow, similar strategies were expected. However, the distribution of used strategies shows that participants did not need to use the north arrow to solve the tasks (see ). As a result, the distribution of used strategies is alike for the first and third tasks for each map – only participants more often needed to work with the map legend when they first encountered the map. This difference especially manifested in more frequent use of the strategies TLMA, TMLA, TML, and TLM. In addition, participants more often got familiar with the given possible answers prior to solving the task during the third tasks than in the case of the first and second.
In contrast to the task demand, the mapping method used did not influenced the participants’ choice of strategy, since both absolute and relative distribution of the strategy types is almost identical for all four maps (). Minor differences can be found in the frequencies of specific strategies. They primarily relate to the necessity of map legend use for understanding the information depicted on the map. The results indicate that it was easier for students to get familiar with the linear symbol map and particularly with the choropleth map, as they did not use their legends prior to focusing on the map face and repeatedly as often ().
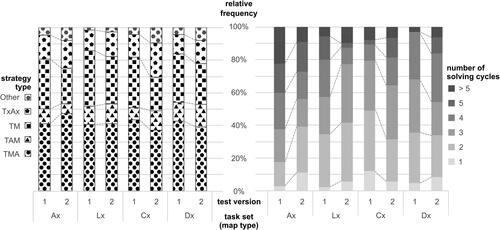
The minor influence of map type on the strategy choice indirectly implies that participants did not substantially change their strategy throughout the test. This assumption is supported by the overall similarity of strategy distribution between the participants solving the first and second versions of the test, which differed in the mapping method order (see the subsection Procedure). Notwithstanding, the familiarity with the task demands influenced the participants’ solving behavior. They gradually needed fewer solving cycles to come to the solution, i.e., more participants did not return to the first phase of problem-solving several times (see ).
Figure 2. The distribution of chosen strategy types and needed number of solving cycles among participants in the task sets. Note: A – area-shading, L – linear symbols, C – choropleth mapping, D – diagram mapping, x – whole set of three tasks for the given map type. For the explanation of the abbreviations used for the strategy types, see .
Strategy effectiveness
The efficiency of the used strategies is identified based on the answer correctness for the given tasks, i.e., their accuracy, and the duration of the task-solving process, i.e., their speed of execution. The accuracy and execution speed of individual strategies cannot be evaluated, since the repertoire of used strategies is wide and many participants used a combination of two or more strategies. Therefore, the efficiency of most of the strategies would be strongly influenced by the characteristics of the participant(s) that chose them and the specifics of the task(s) for which they were chosen. For that reason, the strategy efficiency is evaluated on the more general level of strategy types. In case a combination of general strategy types was used, the accuracy and speed of this combination is evaluated. To reduce the impact of individual characteristics, only the strategy types and their combinations that four or more participants used to solve a given task are considered.
Participants’ success rate was 78% on average (±13%) in the test. Not only does the average success rate differ among the tasks, but the average accuracy of the strategy types also differs for most of the tasks (). The success rate of participants that used strategies belonging to the TMA strategy type, both separately and in combination with strategies from the TM strategy type, was higher than average for most of the tasks. On the contrary, participants that used the TM strategy type together with TxAx strategies and participants that used strategies from more than two types were less successful in the particular task.
The higher identified accuracy of the TMA & TM strategy combination to the combination of TM & TxAx was not caused by the different order of these strategy types, since in both cases, participants first familiarized themselves with the task and map and only then, in following solving cycle(s), got familiar with possible answers. The difference was likely caused by the late or no attention that participants using TM & TxAx strategy types paid to the map legend.
Participants on average needed 34.6 seconds (±20 sec) to solve a task. The median task duration during the test was 29.5 sec. From the standard deviation value and , it is apparent that the task duration differs among both the participants and the tasks. The relation between the task success rate and the task duration is ambiguous, since for the tasks with a high success rate, participants sometimes needed more or less time than for the rest of the tasks (cf. and ).
Figure 3. Task duration and median speed of strategy execution. Note: Only the basic types of strategies and their combinations that four or more participants used to solve a given task are visualized. For the task formulations, see . For the explanation of the abbreviations used for the strategy types, see .
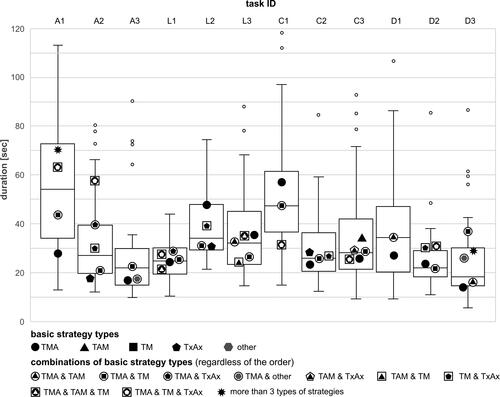
Similarly, the relationship between a strategy’s accuracy and speed is not uniform for most of the frequently used strategies. However, the combination of more than two strategy types was not only less accurate but also slower to execute than the median (). Additionally, compared with the speed of execution of the TM & TxAx combination, the combination of strategy types TMA & TM was faster. The combination of these two strategy types was also faster in execution than separate use of strategies belonging to the type TMA in some of the tasks. Nevertheless, in other cases, participants that chose the TMA strategy type were the fastest on average, or at least in the faster half of the tested students ().
The described ambiguous relation between strategy accuracy and speed of execution could be partially the result of different numbers of solving cycles that participants needed to solve the task. The use of single strategy type does not mean that a participant solved the tasks in a single solving cycle but that in all the cycles, he or she used strategies belonging to a single strategy type (see ). The influence of the number of solving cycles on the task duration, though, was proven to be significant only for the tasks requiring the use of an area-shading map (A1: H(6,51)=24.82, p=.000; A2: H(6,51)=33.81, p=.000; A3: H(6,51)=23.17, p=.001).
Discussion
The study focused on upper-secondary students’ strategies for spatial tasks requiring map use. To identify them and understand them in detail, two fundamental theoretical frameworks were applied – those of Svenson (Citation1992) and Lemaire and Siegler (Citation1995).
Svenson’s (Citation1992) theory of decision-making made it possible to distinguish individual strategies and categorize them into four general strategy types according to the order of decision-making (problem-solving) phases. The proposed typology of strategies proved to be convenient and useful not only for identification of students’ strategies based on vast eye-tracking data but for comprehending general differences in the spatial task-solving process among students. Thanks to its theoretical grounding and generality, the strategy typology is independent of the chosen tool of information representation and of task demand. Therefore, it is possible to similarly identify and analyze strategies for solving differently focused tasks (e.g., using charts, tables, and/or satellite images) in future studies. Nevertheless, the theory-driven approach of strategy identification from eye-tracking data also has its drawbacks as a coder needs to analyze the eye-tracking recordings manually instead of using the algorithms built in the eye-tracking software. In most cases, researchers need to repeat the process to be certain of the chosen strategy code (in particular, when participants swiftly change objects of their attention). Moreover, to increase the trustworthiness and ensure the consistency of strategy classification, at least two independent coders should be involved. For these reasons, the theory-driven approach of strategy identification is more time-demanding.
To be able to enhance the educational principles needed for appropriate strategy acquisition, it has proved useful to distinguish four dimensions of strategies (repertoire, distribution, effectiveness, and adaptiveness of choice) and their change, i.e., to apply Lemaire and Siegler (Citation1995) theoretical model.
The results showed that upper-secondary students have a broad repertoire of strategies for solving multiple-choice tasks requiring spatial analysis of information depicted on a map. Some of the participants solved the given tasks relatively uniformly, i.e., they preferred one strategy type over the rest. Most of the participants, however, used a few strategy types in similar frequency. Notwithstanding, they most frequently processed the task-solving in a way in which they first got familiar with the task assignment, then started to solve the task using the map and its layout elements (largely the map legend), and only after that verified if their found solution matched the provided decision alternatives. Therefore, the most frequently used strategy type was TMA, and additionally from the point of view of individual strategies, most of the frequently chosen ones were from this type. The strategies from the TMA type also dominated if the student combined strategies from different types. Typically, they combined strategies from the TMA type with strategies belonging to the TM type, which can be considered as a shortened/unfinished version of the TMA type, as it does not include verifying the found solution with the given alternatives.
Since strategies from TMA and TM were the most preferred from the participants’ repertoire, it is apparent that students do not take full advantage of multiple-choice tasks. From a theoretical viewpoint, the optimal strategy type for solving the multiple-choice map tasks is TAM, where the problem-solving is considerably narrowed down (e.g., from the point of the area of the map face that need to be processed or the number of signs that is necessary to understand/search for) by getting familiar with the given solution alternatives before starting to solve the problem (Svenson Citation2003). The reason behind students’ preference for strategies suitable for open-ended tasks can be a lack of awareness about the efficiency of TAM strategies. The frequency of strategy types’ choice could also be influenced by the task structure, as people ordinarily proceed linearly from top to bottom and left to right (Matheson and MacCormack Citation2020). Thus, their strategy could be partially data-driven, which is one of the basic characteristics of novice strategies (Ooms, De Maeyer, and Fack Citation2014; J. R. Anderson Citation1983).
From the perspective of strategy repertoire and distribution, the findings are consistent with those of previously conducted studies (Havelková and Gołębiowska Citation2020; Havelková and Hanus Citation2019b). Both the strategy repertoire and the frequency of strategy choice of the majority of tested upper-secondary students are very similar to the strategy repertoire and distribution of average tested geography undergraduate students and even of some cartographers (Havelková and Gołębiowska Citation2020; Havelková and Hanus Citation2019b). On top of that, the average success rate of the upper-secondary participants is almost identical (78% vs. 80%) to that of geography undergraduates and cartographers (Havelková and Gołębiowska Citation2020).
As stressed before, the accuracy of specific strategies could not be evaluated due to the large number of strategies (49), and even the analyzed accuracy of general strategy types and its difference among them needs to be interpreted cautiously, as the participants often combined two or more types. For the more detailed evaluation of strategy accuracy, a larger sample of participants and tasks would be needed. Nevertheless, the combination of strategies from more than two types was characteristic of incorrect solutions, as in previous studies (Havelková and Gołębiowska Citation2020; Luwel, Torbeyns, and Verschaffel Citation2003), and consistent with psychological theories. Given that, this behavior is typical of novice users who have difficulties solving a task and thus try to use various strategies to find the correct answer or, eventually, switch among strategies due to losing the track, i.e., the hierarchical structure of task-solving goals (J. R. Anderson Citation1983).
As can be expected, the participants using a combination of a few strategy types also needed on average more time to solve the task. Nevertheless, the longer duration of task-solving and higher number of solving cycles did not always signify less efficient strategies, as some participants devoted their time not only to solving the task but also to verifying the found solution by another strategy or to verifying that they properly understood the given task (Havelková and Gołębiowska Citation2020). Hence, a high number of solving cycles needed to solve the task may not indicate difficulties in spatial analysis. In cases when students were not successful in task-solving, this may have been caused by insufficiently developed verbal strategies, resulting in repeated returning to the task assignment and its misunderstanding (similarly in Lee and Bednarz Citation2012).
Concerning the adaptiveness of strategy choice, the strategies of the tested students can be considered as fully developed. The upper-secondary students suitably adapted their choice of strategy to the specific task demand (in consistence with the findings of Kim and Kim (Citation2018) and Kim et al. (Citation2015)). Adaptiveness was most apparent in the tasks requiring the use of the map scale. Contrary to the rest of the tasks, the participants paid attention to the graphic scale and did not work with the map legend when it was not necessary. Moreover, many students understood that it was not possible to answer correctly without knowing the given possible answers, as the distance could be only estimated not precisely determined, and therefore more frequently used strategies from the TxAx type, i.e., they get familiar with the answers and then continue solving the task by evaluating which of the given answers is the correct one. Contrary to the task demand, participants did not change their strategy due to the different map types (mapping methods) used. Since the participants in almost all the cases paid attention only to elements containing relevant information for the given task and were not substantially influenced by the map design, their strategies can be considered as expert-like (Ooms, De Maeyer, and Fack Citation2014; Çöltekin, Fabrikant, and Lacayo Citation2010; J. R. Anderson Citation1983).
In general, the tested students were consistent in their strategy choice throughout the test, and moreover, they were aware of this consistency, as the follow-up questionnaire showed. Their answers also confirmed the learning effect identified from the eye-tracking data. Students stated that they did not change their general strategy but gradually got used to the task structure, learned how to better orient in the map face, were more cautious during first task assignment reading, etc., and for these reasons were more efficient, mainly faster, in task-solving.
Implications for education
Spatially literate students who have developed appropriate levels of spatial knowledge and skills should, among others, command over spatial reasoning in a variety of ways using spatial representations, understanding of spatial concepts, and applying cognitive processes of reasoning (National Research Council Citation2006). To become spatially literate, students need formal training, e.g., to solve spatial tasks of different levels of complexity (Jo, Bednarz, and Metoyer Citation2010). Although upper-secondary students in this study mostly succeeded in solving cognitively demanding spatial tasks, it is necessary to pay attention to the ways, i.e., strategies, used in the process of task solution.
According to the findings, it can be concluded that there is not only one (nor simple) strategy applicable to or even optimal for all spatial tasks with maps. In this regard, the key challenge of the education is to equip students with a rich repertoire of strategies for spatial tasks; teach them how, where, and when to use individual strategies; and pass on the critical awareness of the strengths and limitations of each strategy (National Research Council Citation2006).
This article contributes to this challenge with the list of strategies/strategy types used by upper secondary students to solve spatial tasks using thematic maps. It should be easier for teachers to develop students’ strategies when being aware of the repertoire of strategies and their characteristics possibly used in the domain-specific context or the context of the specific materials. Following the principles of pedagogical scaffolding (Wood, Bruner, and Ross Citation1976), teachers should start (exemplarily on primary or lower secondary level) building the strategy repertoire with simple tasks (cognitively less demanding) that require the use of a limited number of map elements and concurrently with generalized maps that use highly intuitive means of data visualization and depict a familiar area. Followingly, teachers should gradually promote more complex and cognitively demanding tasks (Sun, Lu, and Wang Citation2020), especially those tasks requiring a combination of strategies.
The building of the strategy repertoire should be done systematically and under the permanent control of the specifics of learning situations (materials, types of tasks, topic learned, etc.). The Taxonomy of spatial thinking could help structure the tasks (Jo and Bednarz Citation2009). Such structured and systematic practice dramatically improves the speed and accuracy of spatial thinking development (National Research Council Citation2006).
Moreover, it is important to develop in students not only the strategy repertoire but the metacognitive knowledge of each strategy (e.g., What are the specifics of the strategy?, How to use it?, When is its use efficient? When and why it should not be used?). Students must be aware that there are many possible strategies to solve spatial tasks, but only some are suitable (and efficient) for a given task (e.g., in terms of task type, task demand, type of spatial representation). Teachers should pay attention to solving different task types, directly develop students’ ability to distinguish them, and teach appropriate strategies for solving them (Svenson Citation2003).
It seems crucial to make a difference between open-ended and close-ended tasks. The open-ended tasks are efficiently solved by reading the task and then using the map (and its elements) to answer them (TM strategy type). On the contrary, efficient and successful close-ended-task solving should benefit from the answers offered. Precisely, the task should be read first. Then students should check the possible answers and distinguish between the correct and incorrect ones (TAM strategy type). This strategy type allows students to focus only on the relevant map elements and information and, subsequently, shorten the time and increase the efficiency of the solution process (Svenson Citation2003). However, this strategy type is suitable for the use of familiar map type of familiar area. In the case of an unaccustomed map type of foreign area, the findings of our study suggest that it can be more efficient to become familiar with the map, especially its legend, before starting to solve the task. Therefore, students should read the tasks, then use the map legend and map face, and check the answers offered (TMA strategy type). After students are familiar with each strategy type’s strengths and limitations, teachers can promote the combinations of strategy types suitable for solving more complex tasks.
Considering the differences mentioned above, students should be provided with sufficient time to preliminarily scan the task to choose the most appropriate strategy from their repertoire according to their metacognitive knowledge and stick to it until it shows to be inappropriate. This could eliminate the ineffective trial-error approach to task-solving. Additionally, teachers should provide students with sufficient instructions and time to develop strategies to verify the correctness of the found solution. Such verification strategies could be of the same or different type to those used for solving the task.
Moreover, as not only the present study (see, e.g., Kim et al. Citation2015) has shown that the learning effect is substantial even after only a handful of tasks with similar task demand, teachers should not be skeptical about their students’ skill level on more cognitively demanding (spatial) skills. Instead, they should allow their students to find the most effective task-solving strategy by preparing task sets related to the curricula focused on specific spatial skills.
When planning the development of strategies for spatial tasks, teachers should consider not only the variability of tasks, maps, and strategies used. They should also take the individual differences (e.g., biological, psychological; Havelková and Hanus Citation2019a) between students into account. Not all the presented strategies are suitable to be used by all students. However, there is still a lack of evidence, and more profound research into how students’ learning and cognitive styles influence the choice and efficiency of strategies is necessary.
Moreover, some of the educational implications result from the bottlenecks identified in the experiment, specifically in the map use. Primarily it was the late or no attention devoted by students to the map legend that led to the incorrect or inefficient task solution process. This could be attributed to over-reliance on the intuitiveness of the used cartographic means of visualization. Moreover, not using the north arrow in the tasks requiring the use of cardinals seems inappropriate. This could be caused by the students’ misconceptions that a map always faces north.
Last but not least, finding that should educators be interested in is that from the point of view of the success rate, upper-secondary students were able to solve cognitively demanding spatial tasks, despite studies showing that geography teachers concentrate mainly on simple operation with maps in their lessons (Hanus and Havelková Citation2019; Gökçe Citation2015). Therefore, it is highly recommended to support this with a systematic development of spatial thinking (i.e., the cognitively more demanding skills) fully exploiting the educational potential of various tools of spatial representations (including maps).
Finally, it is necessary to be aware that although eye-tracking technology provides a measure of the cognitive processes it is still partly an indirect measure (Nazareth, Odean, and Pruden Citation2016). One can argue that identified strategies are rather only descriptions of the order in which students checked the components of the tasks and the real “thinking” should be measured preferably by neuroscience techniques. However, the identification of the strategies of processing spatial data (as a component of spatial thinking) has a significant educational implication, and the use of eye-tracking technology is a big step forward to results’ objectivity from the previous studies based on self-reporting techniques.
Conclusion
The upper-secondary students had on average developed equally broad repertoires of strategies as university students and cartographers for solving tasks focused on analysis of spatial relations and patterns from thematic maps. Moreover, many of the students properly adapted their choice of strategies to specific task demands and used them efficiently in most cases. Given that, it is important to pay attention in future studies to lower-secondary and primary students to deepen our understanding of the development of strategies used for thematic map analysis tasks (their repertoire, distribution, efficiency, and adaptiveness of their choice). In addition, it is necessary to focus on strategies used for even more cognitively demanding spatial skills, where the average success rate can be substantially lower and differentiated among students, as the previous study showed, and as a result, students can be more influenced by the map type used (Havelková and Hanus Citation2018).
Additional information
Funding
Notes on contributors
Lenka Havelková
Lenka Havelková is an assistant professor at Charles University in Czechia. Her teaching and research activities are centred around educational cartography. She has developed a particular research interest in students’ strategies for solving problem tasks with maps and misconceptions that influence students’ understanding and use of maps. Moreover, she enjoys exploring and employing various methodological approaches from which geographical education research can benefit, such as eye-tracking experiments and conceptual tests. She translates the results of her research into practice, mainly during courses for pre-service geography teachers and when developing methodological guidelines and good-practice papers for in-service teachers.
Martin Hanus
Martin Hanus is an assistant professor at the Centre for Geographical and Environmental Education, Department of Social Geography and Regional Development, Faculty of Science, Charles University, Prague. His research activities focus mainly on map skills and related aspects of geography education (including curriculum, teaching, strategies, and educational outcomes). Moreover, he is interested in research in geography education in general, such as world-mindedness of young people, geography skills, geocapabilities, and geographical disparities.
Notes
1 In this general description of the strategy types, the term “Map” means the general source of information and indicates the possible use of any or all map elements (the map itself – map face, map legend, map scale, and north arrow). These elements are used individually in more detailed description of strategies later in the text (see Table 1 as well).
References
- Albert, G., V. Ilyes, D. Kis, C. Szigeti, and D. Varkonyi. 2016. Testing the map reading skills of university students. In 6th international conference on cartography and GIS, ed. T. Bandrova and M. Konecny, 188–99. Sofia: Bulgarian Cartographic Association.
- Anderson, J. 1985. Teaching map skills: An inductive approach: Part one. Journal of Geography 84 (1):25–32. doi: https://doi.org/10.1080/00221348508979265.
- Anderson, J. R. 1983. The architecture of cognition. Cambridge: Harvard University Press.
- Barratt, E. S. 1953. An analysis of verbal reports of solving spatial problems as an aid in defining spatial factors. The Journal of Psychology 36 (1):17–25. doi: https://doi.org/10.1080/00223980.1953.9712874.
- Battersby, S. E., R. G. Golledge, and M. J. Marsh. 2006. Incidental learning of geospatial concepts across grade levels: Map overlay. Journal of Geography 105 (4):139–46. doi: https://doi.org/10.1080/00221340608978679.
- Carpenter, P. A., and M. A. Just. 1983. Spatial ability: An information processing approach to psychometrics. In Advances in the psychology of human intelligence, ed. R. J. Sternberg, 221–53. Hillsdale: Lawrance Erlbaum Associates.
- Çöltekin, A., A. Brychtová, A. L. Griffin, A. C. Robinson, M. Imhof, and C. Pettit. 2017. Perceptual complexity of soil-landscape maps: A user evaluation of color organization in legend designs using eye tracking. International Journal of Digital Earth 10 (6):560–81. doi: https://doi.org/10.1080/17538947.2016.1234007.
- Çöltekin, A., S. I. Fabrikant, and M. Lacayo. 2010. Exploring the efficiency of users’ visual analytics strategies based on sequence analysis of eye movement recordings. International Journal of Geographical Information Science 24 (10):1559–75. doi: https://doi.org/10.1080/13658816.2010.511718.
- Dong, W., L. Zheng, B. Liu, and L. Meng. 2018. Using eye tracking to explore differences in map-based spatial ability between geographers and non-geographers. ISPRS International Journal of Geo-Information 7 (9):1–17. doi: https://doi.org/10.3390/ijgi7090337.
- Duchowski, A. 2007. Eye tracking methodology: Theory and practice. London: Springer London.
- Eme, P.-E., and J. Marquer. 1999. Individual strategies in a spatial task and how they relate to aptitudes. European Journal of Psychology of Education 14 (1):89–108. doi: https://doi.org/10.1007/BF03173113.
- Fehringer, B. C. O. F. 2020. Spatial thinking from a different view: Disentangling top-down and bottom-up processes using eye tracking. Open Psychology 2 (1):138–212. doi: https://doi.org/10.1515/psych-2020-0105.
- Ford, L. R. 1984. A core of geography: What geographers do best. Journal of Geography 83 (3):102–6. doi: https://doi.org/10.1080/00221348408980474.
- Gagné, R. M. 1977. The conditions of learning. New York: Holt, Rinehart and Winston.
- Gerber, R., J. Lidstone, and R. Nason. 1992. Modelling expertise in map reading: Beginnings. International Research in Geographical and Environmental Education 1 (1):31–43. doi: https://doi.org/10.1080/10382046.1992.9964879.
- Gersmehl, P. J., and C. A. Gersmehl. 2007. Spatial thinking by young children: Neurologic evidence for early development and ‘educability’. Journal of Geography 106 (5):181–91. doi: https://doi.org/10.1080/00221340701809108.
- Gökçe, N. 2015. Social studies in improving students’ map skills: Teachers’ opinions. Educational Sciences: Theory and Practice 15 (5):1345–62.
- Gołębiowska, I., T. Opach, and J. K. Rød. 2017. For your eyes only? Evaluating a coordinated and multiple views tool with a map, a parallel coordinated plot and a table using an eye-tracking approach. International Journal of Geographical Information Science 31 (2):237–52. doi: https://doi.org/10.1080/13658816.2016.1191636.
- Golledge, R. G. 2002. The nature of geographic knowledge. Annals of the Association of American Geographers 92 (1):1–14. doi: https://doi.org/10.1111/1467-8306.00276.
- Haider, H., and P. A. Frensch. 1996. The role of information reduction in skill acquisition. Cognitive Psychology 30 (3):304–37. doi: https://doi.org/10.1006/cogp.1996.0009.
- Hanus, M., and L. Havelková. 2019. Teachers’ concepts of map-skill development. Journal of Geography 118 (3):101–16. doi: https://doi.org/10.1080/00221341.2018.1528294.
- Havelková, L., and I. M. Gołębiowska. 2020. What went wrong for bad solvers during thematic map analysis? Lessons learned from an eye-tracking study. ISPRS International Journal of Geo-Information 9 (1):27. doi: https://doi.org/10.3390/ijgi9010009
- Havelková, L., and M. Hanus. 2018. The impact of the map type on the level of student map skills. Cartographica: The International Journal for Geographic Information and Geovisualization 53 (3):149–70. doi: https://doi.org/10.3138/cart.53.3.2017-0014.
- Havelková, L., and M. Hanus. 2019a. Map skills in education: A systematic review of terminology, methodology, and influencing factors. Review of International Geographical Education Online 9 (2):361–401. doi: https://doi.org/10.33403/rigeo.591094
- Havelková, L., and M. Hanus. 2019b. Research into map-analysis strategies: Theory- and data-driven approaches. Geografie 124 (2):187–216. doi: https://doi.org/10.37040/geografie2019124020187.
- International Geographic Union – Commission on Geographical Education. 2016. International Charter on Geographical Education. International Geographic Union – Commission on Geographical Education.
- Ishikawa, T. 2013. Geospatial thinking and spatial ability: An empirical examination of knowledge and reasoning in geographical science. The Professional Geographer 65 (4):636–46. doi: https://doi.org/10.1080/00330124.2012.724350.
- Jo, I., and S. W. Bednarz. 2009. Evaluating geography textbook questions from a spatial perspective: Using concepts of space, tools of representation, and cognitive processes to evaluate spatiality. Journal of Geography 108 (1):4–13. doi: https://doi.org/10.1080/00221340902758401.
- Jo, I., S. W. Bednarz, and S. Metoyer. 2010. Selecting and designing questions to facilitate spatial thinking. The Geography Teacher 7 (2):49–55. doi: https://doi.org/10.1080/19338341.2010.510779.
- Just, M. A., and P. A. Carpenter. 1976. Eye fixations and cognitive processes. Cognitive Psychology 8 (4):441–80. doi: https://doi.org/10.1016/0010-0285(76)90015-3.
- Kerski, J. 2013. A working definition of spatial thinking. Esri Community. Accessed August 30, 2021. https://community.esri.com
- Kim, K., and M. Kim. 2018. Effects of task demand and familiarity with scenes in visuospatial representations on the perception and processing of spatial information. Journal of Geography 117 (5):193–204. doi: https://doi.org/10.1080/00221341.2018.1424229.
- Kim, K., M. Kim, J. Shin, and J. Ryu. 2015. Eye-movement analysis of students’ active examination strategy and its transfer in visuospatial representations. Journal of Geography 114 (4):133–45. doi: https://doi.org/10.1080/00221341.2014.991420.
- Leat, D. 2008. Thinking through geography. 5th ed. London: Chris Kington Publishing.
- Lee, J., and R. Bednarz. 2009. Effect of GIS learning on spatial thinking. Journal of Geography in Higher Education 33 (2):183–98. doi: https://doi.org/10.1080/03098260802276714.
- Lee, J., and R. Bednarz. 2012. Components of spatial thinking: Evidence from a spatial thinking ability test. Journal of Geography 111 (1):15–26. doi: https://doi.org/10.1080/00221341.2011.583262.
- Lemaire, P., and R. S. Siegler. 1995. Four aspects of strategic change: contributions to children’s learning of multiplication. Journal of Experimental Psychology. General 124 (1):83–97.
- Lobben, A., and M. Lawrence. 2015. Synthesized Model of Geospatial Thinking. The Professional Geographer 67 (3):307–18. doi: https://doi.org/10.1080/00330124.2014.935155.
- Luwel, K., J. Torbeyns, and L. Verschaffel. 2003. The relation between metastrategic knowledge, strategy use and task performance: Findings and reflections from a numerosity judgement task. European Journal of Psychology of Education 18 (4):425–47. doi: https://doi.org/10.1007/BF03173245.
- MacEachren, A. M. 1995. How maps work: Representation, visualization, and design. New York: Guilford Press.
- Maresch, G. 2018. Development of spatial ability: Results from the research project GeodiKon. In International perspectives on the teaching and learning of geometry in secondary schools, ed. P. Herbst, U. H. Cheah, P. R. Richard, and K. Jones, 215–30. Cham: Springer International Publishing.
- Marsh, M., R. Golledge, and S. E. Battersby. 2007. Geospatial concept understanding and recognition in G6–college students: A preliminary argument for minimal GIS. Annals of the Association of American Geographers 97 (4):696–712. doi: https://doi.org/10.1111/j.1467-8306.2007.00578.x.
- Mason, L., P. Pluchino, and N. Ariasi. 2014. Reading information about a scientific phenomenon on webpages varying for reliability: An eye-movement analysis. Educational Technology Research and Development 62 (6):663–85. doi: https://doi.org/10.1007/s11423-014-9356-3.
- Matheson, I. A., and J. MacCormack. 2020. Avoiding left-to-right, top-to-bottom: An examination of high school students’ executive functioning skills and strategies for reading non-linear graphic text. Reading Psychology 42 (1):1–21.
- Metoyer, S., and R. Bednarz. 2017. Spatial thinking assists geographic thinking: Evidence from a study exploring the effects of geospatial technology. Journal of Geography 116 (1):20–33. doi: https://doi.org/10.1080/00221341.2016.1175495.
- Meyer, J. M. W. 1973. Map skills instruction and the child’s developing cognitive abilities. Journal of Geography 72 (6):27–35. doi: https://doi.org/10.1080/00221347308981316.
- National Research Council. 2006. Learning to think spatially. Washington, D.C.: The National Academies Press.
- Nazareth, A., R. Odean, and S. M. Pruden. 2016. The use of eye-tracking in spatial thinking research. In Eye-tracking technology applications in educational research, ed. C. Was, F. Sansosti, and B. Morris, 239–60. Hershey, PA: IGI Global.
- Ooms, K., P. De Maeyer, and V. Fack. 2014. Study of the attentive behavior of novice and expert map users using eye tracking. Cartography and Geographic Information Science 41 (1):37–54. doi: https://doi.org/10.1080/15230406.2013.860255.
- Paas, F., A. Renkl, and J. Sweller. 2003. Cognitive load theory and instructional design: recent developments. Educational Psychologist 38 (1):1–4. doi: https://doi.org/10.1207/S15326985EP3801_1.
- Polson, P. G., C. Lewis, J. Rieman, and C. Wharton. 1992. Cognitive walkthroughs: A method for theory-based evaluation of user interfaces. International Journal of Man-Machine Studies 36 (5):741–73. doi: https://doi.org/10.1016/0020-7373(92)90039-N.
- Popelka, S. 2014. Optimal eye fixation detection settings for cartographic purposes. In Proceedings of the 14th SGEM GeoConference on Informatics, Geoinformatics and Remote Sensing, 17–26. Albena, Bulgaria. doi: https://doi.org/10.5593/SGEM2014/B21/S8.091.
- Rozencwajg, P. 1991. Analysis of problem solving strategies on the Kohs block design test. European Journal of Psychology of Education 6 (1):73–88. doi: https://doi.org/10.1007/BF03173149.
- Shin, E. 2006. Using Geographic Information System (GIS) to Improve Fourth Graders’ Geographic Content Knowledge and Map Skills. Journal of Geography 105 (3):109–20. doi: https://doi.org/10.1080/00221340608978672.
- Snow, R. E. 1980. Aptitude processes. In Aptitude learning and instruction: Cognitive process analyses, ed. R. E. Snow, P. A., Federico, W. E. Montage, 27–63. Hillsdale: Lawrence Erlbaum Associates.
- Strasser, I., I. Koller, S. Strauß, M. Csisinko, H. Kaufmann, and J. Glück. 2010. Use of strategy in a 3-dimensional spatial ability Test. Journal of Individual Differences 31 (2):74–7. doi: https://doi.org/10.1027/1614-0001/a000013.
- Sun, Y., X. Lu, and Y. Wang. 2020. Using eye tracking to explore differences between high and low map-based spatial ability. Journal of Geography 119 (6):215–25. doi: https://doi.org/10.1080/00221341.2020.1810301.
- Svenson, O. 1992. Differentiation and consolidation theory of human decision making: A frame of reference for the study of pre- and post-decision processes. Acta Psychologica 80 (1–3):143–68. doi: https://doi.org/10.1016/0001-6918(92)90044-E.
- Svenson, O. 2003. Values, affect, and processes in human decision making: A differentiation and consolidation theory perspective. In Emerging Perspectives on Judgment and Decision Research, eds. James Shanteau, Sandra L. Schneider, 287–326. New York: Cambridge University Press.
- Vosskühler, A., V. Nordmeier, L. Kuchinke, and A. M. Jacobs. 2008. OGAMA (Open Gaze and Mouse Analyzer): Open-source software designed to analyze eye and mouse movements in slideshow study designs. Behavior Research Methods 40 (4):1150–62. doi: https://doi.org/10.3758/BRM.40.4.1150.
- Wiegand, P. 2006. Learning and teaching with maps. New York: Routledge.
- Wigglesivorth, J. C. 2003. What is the best route? Route-finding strategies of middle school students using GIS. Journal of Geography 102 (6):282–91. doi: https://doi.org/10.1080/00221340308978560.
- Wood, D., J. S. Bruner, and G. Ross. 1976. The role of tutoring in problem solving. Journal of Child Psychology and Psychiatry, and Allied Disciplines 17 (2):89–100. doi: https://doi.org/10.1111/j.1469-7610.1976.tb00381.x.
- Wright, R., W. L. Thompson, G. Ganis, N. S. Newcombe, and S. M. Kosslyn. 2008. Training generalized spatial skills. Psychonomic Bulletin & Review 15 (4):763–71. doi: https://doi.org/10.3758/pbr.15.4.763.