
Abstract
Amid the shift to virtual learning during the COVID-19 pandemic, educators across disciplines were faced with developing new strategies for active learning. This article discusses findings from a case study of using Google Earth for virtual field trips and projects in an undergraduate Geography of North America course, assessing the process of incorporating Google Earth and student perspectives on their engagement with this technology. With broader applications to secondary and post-secondary education contexts, findings suggest increased student engagement and an appreciation for the opportunity to work with a geospatial technology mapping platform without needing prior coding, software, or mapping experience.
Introduction
Amid the sudden shift to virtual and remote teaching and learning due to the onset of the COVID-19 pandemic in 2020 (Day et al. Citation2021; Keough and Kaplan Citation2021), educators across disciplines were faced with learning and developing new and innovative teaching strategies to promote active learning and student engagement. Some educators had experience teaching in multiple formats—face-to-face, hybrid, and online—while others were treading into uncharted territory. Yet, online education pedagogies, best practices, and resources in geography were well-established prior to the pandemic, and the opportunity for online education to reach broader and more diverse populations is well-documented (Jain and Getis Citation2003; Lynch et al. Citation2008; Dittmer Citation2010; Schultz Citation2012; Schultz and DeMers Citation2020). Indeed, as Schultz and DeMers (Citation2020, 142) observe, “geography education online is neither new nor innovative but is well established as a means of providing rich geographical education to many students.” As the pandemic lingers on, educators are pursuing new forms of student engagement (Day et al. Citation2022).
Geography and other educators have a multitude of virtual resources to incorporate into their teaching practices. Secondary and post-secondary educators have been innovative with incorporating new technologies into their face-to-face and virtual classrooms. Now, with a further increase and interest in virtual and online learning, the need to be more innovative is even greater to reach a broader range of faculty and students who may not have previously had as much experience with online learning. Advances in freely available geovisual technology—including virtual globes and other open source online mapping visualization platforms, along with their use in the implementation of virtual field trips and the construction of geovisual narratives and story mapping—allow for ways to creatively incorporate this technology into the classroom, via its use in lectures, discussions, assignments, and larger semester-length projects.
This article discusses findings from a case study of implementing virtual globe technology—specifically Google Earth—for virtual field trips and semester projects in an undergraduate upper-level Geography of North America course. An IRB-approved online survey of participating students assessed the process and engagement related to the use of Google Earth. Specifically, the results inform two categories of findings: (1) the process and outcomes of incorporating Google Earth into the course; and (2) student perspectives on the use of this technology as a mechanism for enhancing student success and engagement. These questions emerged through the process of the author of this article—the instructor of the course comprising this article’s case study—attempting to incorporate new types of technologies into the online classroom amid the pandemic to further engage students while also providing opportunity to practice creating with different types of technology. After having taught Geography of North America, as well as other regional geography (including Europe and World Regional Geography) and systematic/thematic geography (including Introduction to Human Geography, Health Geography, Population Geography, and Urban Geography) courses, annually since 2015, typically incorporating a traditional research paper style semester project, amid the pandemic the author began incorporating other teaching strategies in this course, including the incorporation of virtual globe technology through the use of Google Earth for virtual field trips and student activities and projects in regional geography courses and the incorporation of ArcGIS Online and story mapping technology in thematic geography courses. Each of these attempts at integrating geospatial technology into regional and systematic geography courses had to be implemented in a way that was mindful of the fact that at least half or more of the enrollment in these courses are often comprised of students coming from other majors completing upper-division elective/related studies requirements who may not have had prior exposure to or experience with geospatial technology. As such, the author was interested in not only the processes and outcomes of incorporating Google Earth into this course, but also student perspectives on their use of and engagement with this technology.
As a result, there was also interest in generating information useful for evaluating this teaching strategy to inform the use of this technology in other geography classes as well as classes in other disciplines in different types of educational settings. Findings suggest increased student engagement and the appreciation for being introduced to and given the opportunity to work with a new type of technology and mapping platform without needing prior coding, software, or mapping experience. This case study also exemplifies how such technology may be incorporated not only in other geography courses but also courses in other disciplines across different curriculums for different age ranges in higher education as well as secondary education settings. This article proceeds with an engagement with the relevant scholarship, followed by a discussion of the case study and course, the use of Google Earth for virtual field trips and Google Earth Projects for the major semester project for the course, followed by a discussion of findings from an online feedback survey and concluding comments.
Virtual globes and online mapping for virtual field trips and geovisual narratives
Spatial thinking is essential to understanding physical and human phenomena and is critical in most areas of modern life (Lee and Bednarz Citation2012; Collins Citation2018). Scholars have noted the relevance of the ability to think spatially and spatial and geographic literacy to everyday life, workplaces across societal sectors, and scientific endeavors (Golledge Citation2002; Bednarz Citation2004; Battersby, Golledge, and Marsh Citation2006; Marsh, Golledge, and Battersby Citation2007; Lee and Bednarz Citation2012; Zhu, Pan, and Gao Citation2016; Collins Citation2018; Siebeneck, Schumann, and Kuenanz Citation2019; Schumann and Tunks Citation2020). Schultz, Kerski, and Patterson (Citation2008) suggested that as an integrating discipline, geography facilitates students’ understanding of, participation in, and application among the broader world. Furthermore, geography provides opportunity for the incorporation of geospatial technologies into the classroom as innovative approaches to teaching and learning geography (Hazen and Alberts Citation2021; Kerski Citation2021). Yet, the costs, complexities, and learning curves of certain types of hardware and software have delayed their classroom adoption and adaptation (Schultz, Kerski, and Patterson Citation2008). However, as Schultz, Kerski, and Patterson (Citation2008) observed, virtual globes are not only exciting but are a compelling means for reinforcing connections among people, spaces, and places across scales. Virtual globes are also a way to diminish challenges and barriers that accompany the implementation of standard GIS software and practice in an undergraduate classroom that may include students from other majors beyond geography (Schultz, Kerski, and Patterson Citation2008). “The decrease in costs of hardware and software, better data availability, user-friendly graphical user interfaces, and the proliferation of the Internet that has significantly enhanced our interconnectedness across societies,” Schultz, Kerski, and Patterson (Citation2008) observed, “have converged to allow geospatial information to be a driving force in educational enablement. The emergence of virtual globe software could be one of the most important visualization tools of our lifetimes.”
Digital and geospatial technology is a tool for cultivating active learning opportunities in various classroom modalities to support significant learning experiences (Fink Citation2003; Fink and Ganus Citation2009; Fournier Citation2009; Holloway et al. Citation2021). Active learning takes many forms and is essentially about learning by doing whereby instructors select methods that help meet the learning goals for the class, with structured activities that may involve, for instance, class discussion, role playing, problem-based learning, field work, or a computer simulation (Fournier Citation2009). With advances in geospatial technology and its accessibility and availability in multiple formats and on different types of devices, integrating use of geospatial technology for active learning experiences in different types of classroom modalities has become more efficient. Virtual globes and freely available online mapping platforms are accessible to educators and effectively engage students in innovative ways with interactive technology and geospatial visualizations (Patterson Citation2007; Schultz, Kerski, and Patterson Citation2008; Wang and Chen Citation2013; Hsu, Tsai, and Chen Citation2018). While the learning curve for GIS software is high and processing spatial data can be cumbersome and time-consuming, virtual globe platforms such as Google Earth allow educators to use processed data to teach content knowledge with minimal preparation and time investment (Hsu, Tsai, and Chen Citation2018). Teaching with online mapping platforms has also shown great potential for nurturing students’ spatial-thinking abilities (Bodzin and Cirucci Citation2009; Bodzin, Anastasio, and Kulo Citation2014; Xiang and Liu Citation2017; Collins Citation2018; Hsu, Tsai, and Chen Citation2018; Patterson Citation2020), improving geographic literacy (Kerski Citation2015; Zhu, Pan, and Gao Citation2016) and topographic map reading ability (Hsu, Tsai, and Chen Citation2018), and developing a stronger sense of place (Ratinen and Keinonen Citation2011; Hsu, Tsai, and Chen Citation2018).
In particular, geographic literacy is a crucial skills set in the twenty-first century for “applying critical geographic knowledge to solve problems and make decisions in daily lives from a geographic perspective” (Zhu, Pan, and Gao Citation2016). The use of technology like virtual globes is an increasingly important component of building geographic literacy. For instance, Lamb and Johnson (Citation2010, 81) observed the following regarding virtual globes and online mapping platforms:
Whether taking a virtual hike to learn more about glaciers and geysers or exploring social issues related to land use or invasive species, online tools such as Google Earth allow young people to take virtual adventures to far off places around the world, under the ocean, and even into space. We can bring literature alive through visualizing the settings of picture books and novels. Teachers can add relevance to social studies, sciences, and math activities with access to endless real-world data sources. They can enrich cultural and language studies with an exploration of geography and travel. Immerse young people in history by following the Oregon Trail, tracking the movement of troops through conflicts, and imagining life on the Silk Road using satellite images, photographs, and maps.
Virtual globes allow for the combination of place-based learning and global exploration to better engage learners through interdisciplinary approaches (Lamb and Johnson Citation2010).
Yet, some may question whether a virtual environment is an adequate substitute for real world field-based experiential learning. Carl Sauer (Citation1956, 287) noted that “fieldwork should be central to geography curriculum,” and Tuan (Citation1975) observed the importance of experience in cultivating a sense of place. Indeed, in geography courses, as Martin (Citation2003, 35) observed, “knowledge of a local area is especially useful for demonstrating geographic principles. These classroom examples are further enhanced when students conduct their own field observations, with direction from the instructor.” Field trips have also “long been a favorite tool to confront geography students with the reality of phenomena and processes taught in class” (Gaillard and McSherry Citation2014). Field trips are an effective method for active and experiential learning (Slinger-Friedman Citation2018). Course discussions and assignments linked to strategies of active and experiential learning, which include field trips, community service learning, and applied projects, help create further opportunities to impact student success (Slinger-Friedman Citation2018), and field experiences beyond the classroom are no doubt crucial to community-engaged and service-learning endeavors (Buch and Harden Citation2011; Hawthorne Citation2011; Hawthorne, Atchison, and LangBruttig Citation2014; Schuch et al. Citation2018; Fischer et al. Citation2021; Shannon et al. Citation2021).
Despite the high value of field-based and experiential learning to student success, the increase in online and distance education across the curriculum in general and the further increase in virtual learning amid the COVID-19 pandemic (Day et al. Citation2021; Day et al. Citation2022) has led geography educators to be even more innovative in their approach to incorporating field experiences into curriculums (Gibbes and Skop Citation2022; Mercer et al. Citation2022), particularly in online courses. Although not a substitute for the immersive learning experiences of an in-person fieldwork, field trip, or study abroad experience, virtual field trips and virtual visits via virtual globe online platforms are an accessible method, requiring minimal financial resources to implement other than access to a computer with Internet, for educators to incorporate technology into the classroom to enhance student learning and engagement about key concepts, spaces, places, and interconnections (Stainfield et al. Citation2000). The visualizations virtual globes such as Google Earth provide offer perspectives via the use of aerial, satellite, and 3 D imagery, and terrestrial photography, to students that would be impossible to achieve via in-person visits to the same locations. Krakowka (Citation2012) outlined three different types of field trips, including a neighborhood field trip, a scavenger hunt field trip, and a virtual field trip using Google Earth. The latter is an example of how educators can utilize a platform such as Google Earth to further enrich their in-person and online classroom environments. Krakowka (Citation2012, 241) observed that Google Earth was invaluable for implementing a virtual field trip, allowing students to “visit streets of cities hundreds of miles away, or look at geologic features such as mountains, or view farm locations in the tropics.” In-person and virtual field trips can both improve understanding of real-world issues and strengthen spatial thinking skills. Virtual field trips, through a platform like Google Earth, also allow for the latter through an interactive and dynamic platform (Krakowka Citation2012).
As with field trips and experiential learning to enhance geographic literacy, writing is certainly a valuable skill to cultivate via multiple formats and methods, including in teaching geography, to communicate with broad, diverse audiences (Patterson and Slinger-Friedman Citation2012). Yet students often perceive the act of writing to be a pedantic task (Slinger-Friedman and Patterson Citation2012). Moving beyond virtual fields trips, geovisual narratives—often referred to as story maps—are compelling for communicating a variety of information about many different topics via geospatial visualization and writing (Molden Citation2020; Caquard Citation2013). “Online mapping software,” according to Molden (Citation2020), “has become a popular medium for creating and telling story maps with data graphics, videos, photographs, interactive maps, or other visual components. These tools have been used to story map information from a variety of sources including literature, large data sets, and personal experiences.” The potential use for these teaching tools is far-reaching.
An increasing variety of online mapping platforms and virtual globes, such as Google Earth, are freely available with minimal resources for people to use with no prior mapping or coding experience. In particular, instructors can use online mapping platforms, such as Google Earth Projects as one example, to create geovisual story narratives to present information about a variety of subjects across different curriculum areas. Instructors can also employ online mapping tools to create interactive assignments and projects for students to learn how to work with new technology, how to organize information from a variety of types of sources into a compelling visual narrative, and present different types of written information alongside geovisualizations in a format different from a traditional written research paper/term paper type of assignment. Mercier and Rata (Citation2017, 75) identified four unique learning outcomes for students engaged in digital story mapping: “mapping diversifies the learning experience; mapping promotes acquisition of a different skill set; online mapping allowed more open sharing of work and; mapping promotes place-based learning.” With this broader context in mind of incorporating geospatial technology into courses to create active learning experiences for student success and engagement, the next section describes the case study of implementing Google Earth for virtual field trips and the major semester project in a Geography of North America course.
Case study: Geography of North America
The aim of this case study project is to assess the impact of using virtual globe technology, specifically the Google Earth platform, in an upper-division undergraduate Geography of North America course for both teaching about the sub-regions of North America and through Google Earth Projects as the major semester project for the class, rather than a traditional “term paper” or “research paper.” As Martis (Citation2005, 85) observed, “region and area studies are one of the classic ‘traditional’ areas of geographic research and teaching.” Regional geography presents a framework to explore ways in which the diverse systematic processes of physical and human geography “construct, deconstruct, and reconstruct dynamic characteristics of particular places and regions” (McDaniel Citation2020, 362). Regional geography applies knowledge from various geography topics to interpret their relevance for distinct regions. Learning to read the landscape about such processes in distinct places is part of cultivating a sense of place about locales within the context of broader forces fomenting regional change over time (Hudson Citation2020). Regional geography is important to a well-rounded geography education and for cultivating geographic literacy. Geographers have also encouraged more critical engagement with long-held regional and sub-regional conceptions common in regional geography courses (Nagel Citation2018). More nuanced incorporation of geospatial technology into such courses can help illustrate to students the often fuzzy and noncontiguous boundaries of broader processes of economic, political, cultural, and social globalization that intersect across space and time. Moreover, a Geography of North America course offered at higher education institutions in North America provides an opportunity for many students who are mostly from the region to gain a further grasp of the physical and human geographic diversity of their home continent, including of places and regions with which they may already have experience and preconceived perspectives.
Why Google Earth? Google Earth is a virtual globe geobrowser that accesses satellite and aerial imagery, topography, ocean bathymetry, and other geographic data over the Internet to represent the Earth as a three-dimensional globe. Geobrowsers are alternatively known as virtual globes or Earth browsers. Other examples of geobrowsers are NASA's World Wind, ESRI's ArcGIS Earth, and GeoFusions’s GeoPlayer. Google Earth was selected as the online mapping platform for use in this class for several reasons. Google Earth is freely available to use for anyone with access to the Internet and is free to use for creating Google Earth Projects for anyone with a free Google account. As such, minimal resources are required other than access to a computer and Internet. Google Earth, compared to other online mapping platforms, is simple to learn and does not require prior knowledge of coding, software development, or mapping. Google Earth has built in accessibility features and automatically adjusts to different screen sizes and different devices, including regular computer monitors, smart tablets, and smart phones. Google Earth also has a free app available for use on smart tablets and smart phones. In addition to Google Earth Online, Google Earth Pro is also free to download and use on one’s own computer for those preferring more advanced features that may not be available in the online web version.
Examples of ways in which geography and other educators have incorporated Google Earth into their teaching at the secondary and post-secondary levels are varied, including teaching geomorphology of North American physiographic regions (Allen Citation2008), using Google Earth to explore and evaluate the Aral Sea (Evaniuck Citation2015); mapping the trade of pineapples, notions of hospitality, and slavery in early America (Dawson and Mitchell Citation2017); mapping ocean currents and pollution (Mitchell and Hance Citation2014); and changes in Arctic sea ice as an indication of climate change (Bock Citation2011). Another example is the use of Google Maps paired with autoethnography as a transformational learning experience within a study abroad context (Stephenson, Harper, and Klump Citation2019). Google Earth and Virtual Reality (VR) have also been combined in geography courses to facilitate virtual visits to locations described in each lecture (Hagge Citation2021).
Like all virtual globes and mapping software, there are some limitations to consider. Elwood (Citation2009, 257) remarked that spatial and geovisualization technologies are many things simultaneously, including “digital systems for storing and representing spatial information…complex arrays of social and political practices; and…ways of knowing and making knowledge.” As such, Elwood (Citation2009, 259), alluding to some of the broader critical and conceptual issues emerging with the increasing prevalence of geovisualization technology, observed that “geotagged photos, video, and text and the information shared through interactive geovisualization platforms often represents individuals’ observations or interpretations of places experienced in everyday life, described in ordinary ‘natural language’ rather than the scripted terms of a geospatial database.” Lamb and Johnson (Citation2010) described additional potential issues and limitations to keep in mind from the perspective of practical implementation of their use in the classroom. These include accessibility issues, student and teacher access to adequate Internet and Wi-Fi bandwidth, versions of software used, and accuracy in geotagging of some photos and sources that may be linked to the geovisualization software and the need to cross-check sources.
This case study focuses on the use of Google Earth as a virtual field trip teaching tool and the use of Google Earth Projects for students to create digital geovisual story narratives. These activities were implemented in two fully online, asynchronous sections of an upper-division undergraduate Geography of North America class in the Spring and Summer 2021 semesters at Kennesaw State University, a large, public, Carnegie R2 classified university in metropolitan Atlanta, Georgia, in the southeastern United States. provides descriptive characteristics of these two course sections. In both sections, the author created virtual field trip visits in Google Earth to each North American sub-region covered throughout the course, and students created digital story narratives about a particular topic of their choice relating to the Geography of North America using the Google Earth Project platform as their major semester project, rather than a traditional research “term paper,” which had been the major semester project in this class in previous years. The author assessed the impact of using this visually engaging technology in the classroom and its impact on student experiences and engagement in this Geography of North America course.
Table 1. Characteristics of two case study sections of geography of North America.
Although the Geography of North America course in which Google Earth was used and implemented is an upper-level course in which many geography majors regularly enroll, it is also frequently included as an upper-level elective and related studies course in many other majors. As indicates, only around one-half of the students in the spring 2021 section and only around one-third of the students in the summer 2021 section were geography or geospatial sciences majors. As such, students from other majors in most cases will not have had prior training in more advanced mapping or GIS software typically covered and included as part of a geography, geographic information science, or geospatial sciences major degree curriculum. Geography instructors of courses that include a variety of both geography and non-geography majors wanting to incorporate geography and geospatial technology in their courses must be creative and innovative in designing assignments and projects that integrate such technology for students from different backgrounds who may have no prior mapping software experience. Freely available online mapping platforms and virtual globes such as Google Earth, although they do not contain the advanced geospatial analytical tools of many GIS software platforms, do provide a variety of features for instruction and learning for students from diverse disciplines.
Throughout the course, to supplement course readings, class lectures, and discussions, the author created and implemented virtual field trip visits through each of the North American sub-regions covered in the course. For consistency, there were fourteen sub-regional virtual field trips that aligned with the fourteen chapter sub-regions covered in the assigned textbook used in this course. Although there are several current North America geography textbooks on the market, this online course had already previously been designed and approved through the Quality Matters peer-review process for best practices in online teaching and learning with a course structure designed around the use of Hardwick, Shelley, and Holtgrieve (Citation2013) textbook, The Geography of North America: Environment, Culture, Economy. This particular text delineates fourteen North American sub-regions: the Atlantic Periphery; Quebec; Megalopolis; the Great Lakes and Corn Belt; the Inland South; the Coastal South; the Great Plains; the Rocky Mountain Region; the Intermontane West; MexAmerica; California; the Pacific Northwest; Hawai’i and the Pacific Islands; and the Far North (Hardwick, Shelley, and Holtgrieve Citation2013). maps the fourteen virtual field trips created for this course as they align with the fourteen sub-regions from the selected text used in this course.
Figure 1. Fourteen North America Sub-Region Virtual Field Trips in Google Earth with the point locations of each stop included in each virtual tour, which include a mix of both physical geography and human geography examples in each sub-region. The fourteen sub-regions are based on the delineation from the textbook used in this course: Hardwick, Susan Wiley, Fred M. Shelley, and Donald G. Holtgrieve. 2013. The Geography of North America: Environment, Culture, Economy. Boston: Pearson. Map data: Google, Data SIO, NOAA, U.S. Navy, NGA, GEBCO Landsat / Copernicus, IBCAO, U.S. Geological Survey, INEGI.
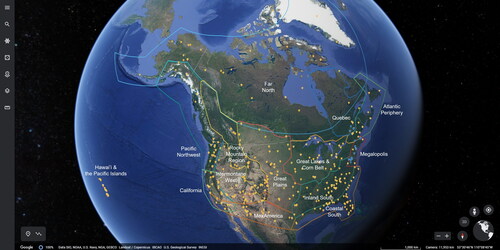
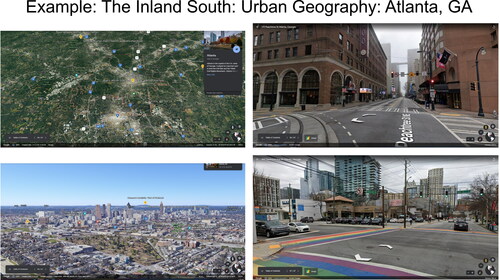
Specifically, expanding from Allen’s (Citation2008) use of virtual globes in teaching geomorphology of North American physiographic regions, for each North American sub-region representative locations that served as examples of both physical geography and human geography were selected. The physical and human geography examples included in each sub-region virtual field trip are featured in the textbook, in course lectures, in maps used in the text and lectures, and/or are also places more popularly known. Within each sub-region virtual field trip, a stop at a particular site often included multiple subsequent views, including a 2 D view from above, a 3 D view (i.e., airplane window view), and a street view (made possible by the integration of Google Earth with Google Maps Street View feature), as well as the inclusion of contextual overview text for each stop along the tour, and at times additional photo examples of the particular location. and , for illustrative purposes, demonstrate different aspects of a virtual field trip for the Inland South sub-region, including examples of physical geography () and urban geography () with different types of view perspectives. These virtual field trips, which were created using the Google Earth Projects platform in Google Earth, also served as examples throughout the course students could view as they worked on their own Google Earth Projects.
Figure 2. Physical geography examples from the Inland South virtual field trip in Google Earth. Clockwise from top right: 3D view of Brasstown Bald (4,784 ft.), highest point in Georgia; Google street view from summit of Brasstown Bald; Google street view from summit of Mt. Mitchell; 3D view of Mt. Mitchell (6,684 ft.), highest point in North Carolina and highest point in the U.S. east of the Mississippi River. Map data: Google, Landsat / Copernicus, Data SIO, NOAA, U.S. Navy, NGA, GEBCO.
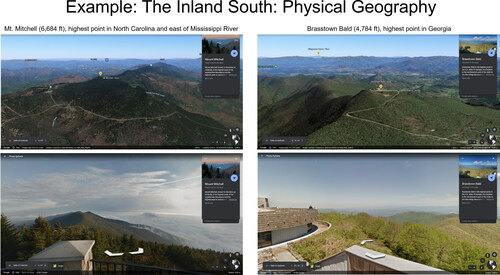
Figure 3. Urban geography examples of Atlanta, Georgia, from the Inland South sub-region virtual field trip in Google Earth. Clockwise from top right: Google street view of Peachtree Street in downtown central business district of Atlanta, Georgia; Google street view of intersection of Tenth Street NE and Piedmont Avenue NE in Midtown Atlanta, Georgia; 3D view of Atlanta skyline as seen from the southeast looking northwest toward Kennesaw Mountain; 2D view of Atlanta metro area. Map data: Google, Landsat / Copernicus, Data SIO, NOAA, U.S. Navy, NGA, GEBCO.
Over the course of the semester, students designed and produced interactive and visual digital story mapping projects using the Google Earth Projects platform. The project was conducted through several steps, with the final product being an argument-driven creative interactive digital map story tour of a particular topic as it occurs in a particular place or region of North America. Student projects explored the significance of geographic space, place, and geography to their selected topic. They employed a geographic spatial approach to help them consider relationships among places related to a given topic. Students were also given much creative latitude in their approach to creating their project.
At the outset, students were aware that working with a digital platform and building their own maps and text narrative may seem time consuming at first but is also rewarding and an alternative to a typical term paper. Some students were also more intimidated by this technology at first if they had little experience with digital mapping. However, with the introductory material offered, students became aware that no prior coding, software, or mapping experience was needed. Through the gradual scaffolded steps built in throughout the semester, including the specific step-by-step guidance, multiple checkpoints and feedback opportunities, and the instructor-created examples provided, the project was approachable for all students no matter their prior experience level with digital mapping platforms.
Google Earth project overview and steps
A Google Earth Project may include many interactive components. Different types of map views are available using a two-dimensional perspective from directly above such as a satellite view from space or a three-dimensional perspective such as a “bird’s eye” or “aircraft window seat” view, with varying zoom levels. The three-dimensional view also incorporates three-dimensional buildings and infrastructure in many urban areas. Additionally, Google Street Views may be incorporated into stops along a tour within a Google Earth Project to illustrate an interactive terrestrial photographic visual of a particular location. Other photos by the project author or by others may also be incorporated into the project, along with customizable text narrative embedded in boxes to the side or incorporated into their own section break slides as well as in the use of an introduction and conclusion slide at the beginning and end of a project. Other cartographic features, such as place marks, lines, and shapes may also be added throughout a project to delineate locations and points of importance relevant to the project narrative.
The full semester project occurred via several scaffolded steps, each of which was a component of the overall project grade and represented a checkpoint opportunity for feedback and suggestions from the instructor and from other students in the class. First, during the initial week of class, the instructor introduced and discussed the overall project, the different steps of the project that students would complete by set due dates throughout the course, and the actual process and procedure for getting started with using an online mapping platform.
Second, each student selected a project topic of focus that relates to the geography of North America. Regional geography is broad and encompasses many subjects spanning the various subfields of geography, including physical and environmental geography, human geography, historical geography, population geography, cultural geography, economic geography, political geography, urban geography, and rural geography, among others. Students were instructed that, regardless of the topic they select, their topic: must relate to the broader course focus on North America or one of its sub-regions, have a clear spatial component that is driven by a central question, and must be of strong interest to the student. In selecting their topics and formulating their projects, students were also instructed to consider the significance of where events happen, where people are from, how geography affects people, and how they might incorporate one or more of the five themes of geography—location, place, human-environment interaction, movement, and region—into their analysis and presentation of their selected topics. Students had access to a detailed list of example topics ranging from physical geography and human geography of particular places and sub-regions of North America, or they could choose their own topic and place or region of focus as long as it related to the geography of North America. lists examples of topics students selected.
Table 2. Geography of North America project topics completed by students.
Third, students then prepared a project storyboard assignment based on a storyboard planning template. This graded assignment was designed to help students plan and organize the layout of their project narrative in the online mapping platform, including the stops and scenes a viewer would encounter when progressing through the project narrative, and the types of map views, street views, photos, narrative text, and references, that students would need to incorporate into their project. Students submitted their completed storyboards via an online discussion forum so that not only the instructor could provide feedback about each project plan, but each student could learn from one another about the different creative ways in which students could plan out projects about different topics and also provide feedback to one another. Both the storyboard planning assignment and the planning discussion forum were graded activities.
Fourth, using feedback from the storyboard planning assignment and the planning discussion forum, students prepared a draft of their Google Earth Project, which they then submitted for feedback from the instructor. The draft version of the project was also a graded assignment. Through this process the instructor provided feedback to each student that they then used as they prepared final versions of their projects to submit at the end of the course. The instructor also identified aspects of the project that some students were struggling with—such as time management, technical issues, and misunderstanding steps.
Fifth, students submitted the web links to the final versions of their projects for the instructor to assess for the final project grade. Students also submitted screen capture video recordings of their final project presentations to the class, which was also a separate graded component of the overall project. The final step was for students to submit their final project web link and presentation to a final project discussion forum, which was also a separate graded component of the overall project. In this discussion forum, students were able to view each other’s final projects in Google Earth and also view each other’s final project presentations, as well as provide commentary and ask questions about each final project.
Google Earth enhances student engagement with regional geography
To assess the use of Google Earth for virtual field trips and course projects in Geography of North America, following the submission of final course grades in each section of the course, students had the opportunity to complete an IRB-approved online survey (see Appendix A. IRB approval was obtained through the Institutional Review Board of the author’s university, approval number IRB-FY21-572), implemented via Qualtrics, to evaluate the impact of using Google Earth technology and to glean student perspectives on the use of Google Earth in their learning process and engagement. After the conclusion of the semester in which students were enrolled in the course, the author invited students on multiple occasions in May, June, July, and August 2021 to participate in the survey via the course’s online learning management system. There were 13 completed surveys out of a possible 66 total students from the spring and summer sections of the class. This represents a survey participation response rate of 20 percent, which, although relatively low, is not unexpected (Porter and Umbach Citation2006). Possible explanations for a low response rate by students on this, and other, surveys include course relevance to a student’s major course of study (Adams and Umbach Citation2012), survey fatigue (Adams and Umbach Citation2012), overall fatigue amid the pandemic (Day et al. Citation2022), and the fact that due to IRB stipulations the survey was administered after the end of the term in which the course occurred and final course grades had already been submitted. Regarding the latter, when the invitation to participate in the survey was distributed, some students from the class simply may have overlooked it or had already moved on beyond the class to other activities. Additionally, Adams and Umbach (Citation2012) observe that salience—or relationship to a student’s major course of study—is related to student evaluation survey response rate. includes demographic details about survey participants and information about the response rate for each of the two course sections. Most respondents (9 out of 13, or 69.2 percent) are geography majors, aligning with Adams and Umbach (Citation2012), despite geography and geospatial sciences majors being in the minority (28 out of 66, or 42.4 percent) for overall total course enrollment by major for the two case study course sections as reported in .
Table 3. Characteristics of survey participants in two case study geography of North America course sections.
lists results from the survey’s Likert scale items that elicited information about prior knowledge and impact of Google Earth on learning course content. As summarizes, regarding prior knowledge before completing the course, most survey respondents indicated a moderate level of personal knowledge about the geography of North America. Regarding prior knowledge of Google Earth, 31 percent of respondents said they were not familiar at all while 46 percent indicated a moderate level of familiarity with Google Earth. After completing the course, students overwhelmingly indicated that the use of Google Earth was very impactful (46 percent) or extremely impactful (31 percent) on their understanding of the geography of North America, whereas 23 percent indicated that it was moderately impactful. Furthermore, students indicated that the use of Google Earth increased their general understanding of the geography of North America by a moderate amount (23 percent), by a lot (39 percent), or by a great deal (39 percent). Most students also said that the use of Google Earth changed their understanding about the geography of North America by a moderate amount (54 percent), by a lot (31 percent), or by a great deal (15 percent). If given the option to complete either a traditional research/term paper or a Google Earth Project, all survey respondents said they would select the Google Earth Project.
Table 4. Results from survey Likert scale items.
While the quantitative results from the survey’s closed-ended items are helpful to inform understanding about the student perspectives on both process and engagement related to implementing use of Google Earth in the course, student qualitative responses to the survey’s open-ended items garner greater depth and breadth about their perspectives on the overall process and the extent of their engagement. However, while all survey participants responded to the closed-ended items as reported in , a few of the respondents only partially responded to the open-ended items, which is revealed in the subsequent narrative below. All geography major survey participants fully responded to the open-ended items, yet the non-geography major participants only responded to some of these items, and one psychology major participant did not respond to any of the open-ended items. Again, this is likely due in part to the saliency of evaluation surveys related to a student’s major as reported by Adams and Umbach (Citation2012).
Students reported that using virtual globe technology, such as Google Earth, in a regional geography course enhanced their engagement in several ways. First, students conveyed that they gained more from the visual, creative, and interactive nature of completing a Google Earth Project than from a traditional research term paper for this course. In previous sections of Geography of North America, a traditional research term paper was the major project for the semester. In the version of this course offered in 2021, the Google Earth Projects replaced a traditional term paper as the major semester project. Students were asked how the use of Google Earth Projects in this course advanced their understanding of the geography of North America in ways that perhaps may be different from a traditional research paper type of project. One geography major observed that “The Google Earth Project was more hands on…This information was not just about the topic but once the student got onto Google Earth, one could get lost just investigating. Plus, term papers are boring and the information is lost soon after submitting it.” Another student who did not identify their major noted that “instead of writing about something, it was interactive and hands on;” while another geography major described how “locations were placed in context, and the topography was much more vivid and had more impact than simple photographs.” “Being able to visually present geographic information is easier to do when using Google Earth than trying to describe locations and spatial relationships in a paper,” observed another geography major. Students conveyed that the use of Google Earth for the major semester project led to more engaging and creative research. For instance, one geography major stated that “It was more interesting, and it gave me the ability to find out things for myself and not simply paraphrase research reading. It gave me a chance to use my own photos and by looking at the work of my classmates, I learned so much about the physical space we share. For example, I've never been to Kansas City but I was able to ‘explore’ it through my classmate’s project.” “I liked doing a visual project over typing a research paper,” noted a history education major. And as another geography major mentioned, “Google Earth allowed me to explore a more spatial analysis of a subject. Term papers generally require so much research and processing of information into an eloquent format that the overall spatial analysis can be lost. Google Earth allows you to incorporate the main highlights that would be included in a paper while also giving a clear spatial analysis of a region. It also helps map out the visual to help the viewer to better understand the subject material.”
Second, the use of Google Earth for course interaction and for the semester project allowed students to learn aspects of the geography of North America in greater depth and breadth. Students were asked to describe something they learned about that they were not previously aware of through using Google Earth. For instance, one geography major mentioned that they learned “how places relate to other locations. Distances, mountain heights, and I liked feeling like what I was seeing was what things look like in real time as opposed to scenes in a textbook printed years ago.” Another geography major observed that the use of Google Earth helped with better understanding “How interconnected we truly are with each other and the environment.” One history education major mentioned learning “How much landscapes have in common and vary at the same time.” “I never realized just how diverse regions are in North America, even in a relatively local scale,” as another geography major observed, “Using Google Earth helped me realize the proximity of some of the major geographical changes.” Another geography major stated, “I selected a particular region of the United States. I was able to go to the locations, travel around them and then research the history of those sites.” Some students described particular areas with which they gained greater familiarity, such as the following comment from a history education major: “I did not realize how similar yet different the terrain was in different parts of the Appalachian mountains.”
Third, students conveyed clearly that the use of virtual globe technology such as Google Earth enhanced their engagement with regional geography. When asked, “what did you like most about using Google Earth in this course on the geography of North America?” one geography major described that they “liked using it for a different perspective. It went really well with the reading. It was neat to read something and then to view it on Google Earth.” Another geography major mentioned that the use of Google Earth “was different” and “allowed for more creativity.” Similarly, a history education major mentioned the variety that they could add to their projects, such as “different view types, outlines, pictures, etc.” Another geography major described how much they liked learning and using Google Earth because it allowed them opportunity to see various landscapes from different views that they may not have an opportunity to visit in-person: “Seeing the landscapes from street side, and in my case, going to Bavaria [one student created a project about Helen, Georgia, and other ‘Bavarian’ themed towns in the U.S.]. I will never travel to these places, but my interest in and thirst for seeing the world is real. Google Earth lets me get up close and personal.” Yet, as another geography major observed, “Google Earth presented the content in a visually appealing way that enhanced the material;” while another geography major mentioned that it presented opportunity for “creative and realistic research” noting that “being able to go to the sites and visually see them. I connected the research with the real locations. You can walk around the sites, see the surrounding environments and distances from other locations.”
Fourth, students also shed light on the process of implementing virtual globe technology, such as Google Earth, into a regional geography course. As with the introduction and use of any new technology and teaching innovation in the classroom, there are limitations and challenges. Students, when asked what could be improved upon for future use of Google Earth in this and other courses, had several suggestions that can help inform the process of implementing the use of Google Earth. Although documentation and guidance were provided in both course sections, some students noted that more technical instruction on how to create in Google Earth would be helpful right from the start of the course. For instance, as one geography major observed, “more technical instruction might be helpful. I relied a lot on YouTube for instructions on how to use the technology and create the project.” Another geography major stated that “it was a little confusing on what we were supposed to do exactly with our project;” while another geography major mentioned that “more detailed instructions of what is expected for a final result” would be useful. One geography major proposed a “Google Earth 101 briefing,” stating “I seemed to spend more time learning the system that I could have devoted to getting into the meat of the subject matter and making my slides perhaps a little more creative.” Another geography major further conveyed: “I really like the idea of a more creative project rather than the research paper, although I am sure there are plenty of students who are more comfortable with term paper format for a major project. One can be more creative and perhaps even a bit artistic with Google Earth, but there are those students whose artistry is in the written paper. Perhaps there could be an option of one or the other? Google Earth did provide me with some frustrating moments, and I think some things in the system could be tweaked, but on the whole, I found it to be an interesting experience.” Another geography major commented that additional tips for using Google Earth would be helpful: “Maybe tips on how to deal with common problems with Google Earth.” Yet, as one geography major described, “I liked the professor’s projects and with more experience I think I could make a more professional looking presentation. This includes adding music and voice;” with another geography major stating that “this would be a great tool to use in other geography classes.”
Lastly, students reported several important overarching points from their use of Google Earth in this regional geography course. As one geography major conveyed, “I am happy to report that I can make a project using Google Earth which will be helpful in future classes and when I am teaching.” Another student noted that, while some students were previously familiar with the existence of Google Earth, they did not know that they could create in Google Earth. One geography major simply said that their important take-away is “that you can create projects and presentations using Google Earth.” Another geography major noted more broadly that “technology helps us learn tremendously” and that this experience was “a nice change from a traditional term paper.” “I really see it as a terrific learning tool,” one geography major said. Another geography major observed that “Google Earth has definitely shown me that there are other methods in relaying geographical information to an audience.” “I really like the creative aspect,” noted another geography major, “I could research and create my own presentation at the same time…I hope to be able to use Google Earth in my profession or another class. I have written dozens of research papers in college and it was refreshing to allow more creativity in your research and presentations.” Another geography major mentioned that “Google Earth Projects is a great tool to use for many different projects.”
Discussion and recommendations
Survey results are already informing the way in which the author is revising how virtual globe technology, such as Google Earth, is being used within ongoing sections of Geography of North America, as well as in implementation in other upper- and lower-division regional geography courses, including World Regional Geography and Geography of Europe. Regarding considerations that the author learned and will plan to implement when using Google Earth again for virtual field trips and student semester projects, there are several recommendations. First, to better gauge student knowledge of virtual globes, particularly how to create in Google Earth, a survey at the beginning of the semester about Google Earth skills and competencies will help the author more efficiently plan and implement activities using Google Earth throughout the semester and will also be useful for comparative purposes at the end of the course when students complete the post-course survey. As other geographers have noted, employing pretest and post-test instruments to measure competencies prior to and following the introduction of a novel curriculum innovation are common in geography education research (Lee and Bednarz Citation2012; Anthamatten et al. Citation2018; Oberle Citation2020).
Second, providing students with an even greater detailed overview of how to use Google Earth and how to create different components of a Google Earth Project is helpful. A “Google Earth 101” brief introduction, as well as a step-by-step written and visual guide to the different components of the Google Earth platform, at the beginning of the semester when students are just beginning to consider potential topics and think about their projects, would be a helpful tutorial for students to establish a baseline level of knowledge about using virtual globes. Although some students may have previously worked with Google Earth in a variety of ways, for many students this may be their first opportunity to go beyond simply viewing a location in Google Earth and actually use the tools available within the Google Earth platform to create their own project and virtual tour using the various features the platform provides.
Third, creating a detailed grading rubric for the Google Earth Project—or for other assignments incorporating use of virtual globes—is also important to show students specifically how their final Google Earth Project deliverable will be graded, what components are important to include throughout the project, the level of points assigned to each component that contribute to the overall project grade, and examples of different levels of work that lead to full or partial credit for each component. illustrates an example grading rubric by the author used in recent regional geography courses that have incorporated use of Google Earth projects. This rubric may be modified for use in other courses or for other types of assignments. As others have noted (Mossa Citation2014), providing grading rubrics for course activities, including a Google Earth Project grading rubric, at the beginning of the semester, in addition to other instructions and examples, is important for students to keep in mind as they plan out their projects throughout the semester. As Mossa (Citation2014) observed, grading rubrics convey standards through which course activities will be evaluated, leading to improved consistency and transparency for grading. Grading rubrics also add to efficiency and organization of the grading process for instructors, particularly in instances when class sizes may be relatively large (Patterson and Slinger-Friedman Citation2012).
Table 5. Example of Google Earth Project Grading Rubric.
Lastly, there are implications for future pedagogical research to consider. Such considerations include examining an expanded use of virtual globe and other geospatial technology in regional and systematic/thematic geography courses. For example, although classroom resources are often limited, the immersive environment within virtual reality (VR) has tremendous potential for education spanning many subjects in secondary and post-secondary settings (Madden et al. Citation2020). Immersive virtual reality environments “create a strong sense of perceived presence which leads to higher learner engagement and motivation” (Detyna and Kadiri Citation2020). One specific platform is again via Google Earth, which has recently released a Google Earth VR platform accessible via multiple popular virtual reality systems. The initial limitation for implementing virtual reality with virtual globes in the classroom is the cost of the equipment for all students in the class to be able to access the technology, as well as additional potential technological and time costs, and accessibility limitations (Hagge Citation2021). Indeed, geography educators are also beginning to implement the use of Google Earth VR into their classrooms. For instance, Hagge (Citation2021) describes the implementation of in-class virtual reality in four face-to-face geography courses, noting that student perceptions of classroom virtual reality were positive. As the use of this technology expands in different types of educational and classroom settings (face-to-face, hybrid, and online) in geography and in other disciplines at the secondary and post-secondary level, there is much room for a variety of future research to assess their implementation processes, enhancement of student success and engagement, impact on learning outcomes, and broader impact on spatial and geographic literacy.
Conclusion
This article focused on findings from a case study of implementing the use of virtual globe technology, via the Google Earth online platform, for virtual field trips and semester projects in a Geography of North America course to further promote active learning and increased student engagement. An IRB-approved online survey of participating students assessed the process and student engagement related to the use of Google Earth. Specifically, the results inform the following two categories of findings: (1) the process and outcomes of incorporating Google Earth into the course; and (2) student perspectives on the use of this technology as a mechanism for enhancing student success and engagement. The findings suggest increased student engagement and the appreciation for being introduced to and given the opportunity to work with a new type of technology and mapping platform without needing prior coding, software, or mapping experience. This case study also exemplifies how such technology may be incorporated not only in other geography courses but also courses in other disciplines at different levels of education, particularly in courses enrolling students with little to no prior mapping or geospatial technology experience.
By completing this project, students: explored the significance of place to a topic and applied spatial analysis, visualization, and digital geovisual narrative creation to better understand the complex issues at hand and to further enhance geographic literacy; learned how to transfer information into digital data and learned how to work through existing spatial data; created maps and paired them with their own written text to form a compelling digital spatial narrative about their selected topic; and communicated this information to a broader audience through a shareable digital virtual globe platform. The outcomes and examples derived from this case study are applicable in other geography courses and courses in other disciplines across diverse curriculums, further reinforcing the importance of incorporating geospatial technology into diverse teaching and learning experiences for greater student success and engagement.
Acknowledgments
Thank you to the anonymous reviewers and editors for their suggestions through the review process, which helped to greatly strengthen this paper. Thank you to my students and their enthusiastic engagement in my courses. Thank you also to the Kennesaw State University Library System, in conjunction with the Office of Research, and the Department of Geography and Anthropology in the Norman J. Radow College of Humanities and Social Sciences at Kennesaw State University, for providing open access funding for the publication of this article.
Additional information
Notes on contributors
Paul N. McDaniel
Paul N. McDaniel is an Associate Professor of Geography in the Department of Geography and Anthropology in the Norman J. Radow College of Humanities and Social Sciences at Kennesaw State University in metro Atlanta, Georgia. He conducts research on the geography of place-branding as it relates to the causes, processes, and implications of immigration and receptivity in metropolitan areas. He regularly teaches introduction to human geography, world regional geography, health geography, population geography, urban geography, geography of Europe, and geography of North America, in a variety of formats.
References
- Adams, M. J. D, and P. D. Umbach. 2012. Nonresponse and online student evaluations of teaching: Understanding the influence of salience, fatigue, and academic environments. Research in Higher Education 53 (5):576–91. doi: 10.1007/s11162-011-9240-5.
- Allen, T. R. 2008. Digital terrain visualization and virtual globes for teaching geomorphology. Journal of Geography 106 (6):253–66. doi: 10.1080/00221340701863766.
- Anthamatten, P., L. Bryant, B. Ferrucci, S. Jennings, and R. Theobald. 2018. Giant maps as pedagogical tools for teaching geography and mathematics. Journal of Geography 117 (5):183–92. doi: 10.1080/00221341.2017.1413413.
- Battersby, S., R. G. Golledge, and M. J. Marsh. 2006. Incidental learning of geospatial concepts across grade level: Map overlay. Journal of Geography 105 (4):139–46. doi: 10.1080/00221340608978679.
- Bednarz, S. W. 2004. Geographic information systems: A tool to support geography and environmental education? GeoJournal 60 (2):191–9.
- Bock, J. K. 2011. Does change in the Arctic sea ice indicate climate change? A lesson using geospatial technology. The Geography Teacher 8 (2):82–90. doi: 10.1080/19338341.2011.571150.
- Bodzin, A. M, and L. Cirucci. 2009. Integrating geospatial technologies to examine urban land use change: A design partnership. Journal of Geography 108 (4–5):186–97. doi: 10.1080/00221340903344920.
- Bodzin, A. M., D. Anastasio, and V. Kulo. 2014. Designing Google Earth activities for learning earth and environmental science. In Teaching Science and Investigating Environmental Issues with Geospatial Technology, eds. J. Makinster, N. Trautmann and M. Barnett, 213–32. New York: Springer.
- Buch, K, and S. Harden. 2011. The impact of a service-learning project on student awareness of homelessness, civic attitudes, and stereotypes toward the homeless. Journal of Higher Education Outreach and Engagement 15 (3):45–61.
- Caquard, S. 2013. Cartography I: Mapping narrative cartography. Progress in Human Geography 37 (1):1: 135–144. doi: 10.1177/0309132511423796.
- Collins, L. 2018. The impact of paper versus digital map technology on students’ spatial thinking skill acquisition. Journal of Geography 117 (4):137–52. doi: 10.1080/00221341.2017.1374990.
- Dawson, J, and J. T. Mitchell. 2017. Bitter sweets: Mapping pineapples, hospitality, and slavery. The Geography Teacher 14 (3):118–29. doi: 10.1080/19338341.2017.1294098.
- Day, T., C. K. L. Chung, W. Doolittle, J. Housel, and P. N. McDaniel. 2022. Beyond COVID Chaos: What postsecondary educators learned from the online pivot. The Professional Geographer 1–17. doi: 10.1080/00330124.2022.2081225.
- Day, T., I. C. Chang, C. K. L. Chung, W. Doolittle, J. Housel, and P. N. McDaniel. 2021. The immediate impact of COVID-19 on post-secondary teaching and learning. The Professional Geographer 73 (1):1–13. doi: 10.1080/00330124.2020.1823864.
- Detyna, M, and M. Kadiri. 2020. Virtual reality in the HE classroom: Feasibility, and the potential to embed in the curriculum. Journal of Geography in Higher Education 44 (3):474–85. doi: 10.1080/03098265.2019.1700486.
- Dittmer, J. 2010. Immersive virtual worlds in university-level human geography courses. International Research in Geographical and Environmental Education 19 (2):139–54. doi: 10.1080/10382046.2010.482222.
- Elwood, S. 2009. Geographic information science: New geovisualization technologies—Emerging questions and linkages with GIScience research. Progress in Human Geography 33 (2):256–63. doi: 10.1177/0309132508094076.
- Evaniuck, J. D. 2015. Using Google Earth to explore and evaluate the aral sea. The Geography Teacher 12 (2):69–76. doi: 10.1080/19338341.2015.1079227.
- Fink, L. D. 2003. Creating significant learning experiences: An integrated approach to designing college courses. San Francisco: Jossey-Bass.
- Fink, D, and M. Ganus. 2009. Designing significant learning experiences. In Aspiring Academics: A Resource Book for Graduate Students and Early Career Faculty, eds. M. Solem, K. Foote, and J. Monk, 86–99. Upper Saddle River, NJ: Pearson Education, Inc.
- Fischer, H., D. Block, A. Bosse, T. L. Hawthorne, J.-K. Jung, H. Pearsall, A. Rees, and J. Shannon. 2021. Doing community geography. GeoJournal. doi: 10.1007/s10708-021-10457-8.
- Fournier, E. J. 2009. Active learning. In Aspiring academics: A resource book for graduate students and early career faculty, eds. M. Solem, K. Foote, and J. Monk, 86–99. Upper Saddle River, NJ: Pearson Education, Inc.
- Gaillard, J. C, and A. McSherry. 2014. Revisiting geography field trips: A treasure hunt experience. Journal of Geography 113 (4):171–8. doi: 10.1080/00221341.2013.847114.
- Gibbes, C, and E. Skop. 2022. Disruption, discovery, and field courses: A case study of student engagement during a global pandemic. The Professional Geographer 74 (1):31–40. doi: 10.1080/00330124.2021.1970593.
- Golledge, R. G. 2002. The nature of geographic knowledge. Annals of the Association of American Geographers 92 (1):1–14. doi: 10.1111/1467-8306.00276.
- Hagge, P. 2021. Student perceptions of semester-long in-class virtual reality: Effectively using “Google Earth VR” in a higher education classroom. Journal of Geography in Higher Education 45 (3):342–60. doi: 10.1080/03098265.2020.1827376.
- Hardwick, S. W., F. M. Shelley, and D. G. Holtgrieve. 2013. The geography of North America: Environment, culture, economy, 2nd Ed. Boston: Pearson.
- Hawthorne, T. L. 2011. Communities, cartography and GIS: Enhancing undergraduate geographic education with service learning. International Journal of Applied Geospatial Research 2 (2):1–16. doi: 10.4018/ijagr.2011040101.
- Hawthorne, T. L., C. Atchison, and A. LangBruttig. 2014. Community geography as a model for international research experiences in study abroad programs. Journal of Geography in Higher Education 38 (2):219–37. doi: 10.1080/03098265.2014.908351.
- Hazen, H. D, and H. C. Alberts. 2021. Innovative approaches to teaching geography. The Geography Teacher 18 (1):1–2. doi: 10.1080/19338341.2020.1861549.
- Holloway, P., T. Kenna, D. Linehan, R. O’Connor, H. Bradley, B. O’Mahony, and R. Pinkham. 2021. Active learning using a smartphone app: Analysing land use patterns in Cork City, Ireland. Journal of Geography in Higher Education 45 (1):47–62. doi: 10.1080/03098265.2020.1802703.
- Hsu, H., B. Tsai, and C. Chen. 2018. Teaching topographic map skills and geomorphology concepts with Google Earth in a one-computer classroom. Journal of Geography 117 (1):29–39. doi: 10.1080/00221341.2017.1346138.
- Hudson, J. C. 2020. Across this land: A regional geography of the United States and Canada, 2nd Ed. Baltimore: Johns Hopkins University Press.
- Jain, C, and A. Getis. 2003. The effectiveness of Internet-based instruction: An experiment in physical geography. Journal of Geography in Higher Education 27 (2):153–67. doi: 10.1080/03098260305679.
- Keough, S. B, and D. H. Kaplan. 2021. Introduction to the special issue on COVID-19. Geographical Review 111 (4):493–5. doi: 10.1080/00167428.2021.1971476.
- Kerski, J. J. 2021. Innovative instruction using field surveys, interactive maps, dashboards, and infographics. The Geography Teacher 18 (1):45–54. doi: 10.1080/19338341.2020.1861051.
- Kerski, J. J. 2015. Geo-awareness, geo-enablement, geotechnologies, citizen science, and storytelling: Geography on the world stage. Geography Compass 9 (1):14–26. doi: 10.1111/gec3.12193.
- Krakowka, A. R. 2012. Field trips as valuable learning experiences in geography courses. Journal of Geography 111 (6):236–44. doi: 10.1080/00221341.2012.707674.
- Lamb, A, and L. Johnson. 2010. Virtual expeditions: Google Earth, GIS, and Geovisualization Technologies in teaching and learning. Teacher Librarian 37 (3):81–85.
- Lee, J, and R. Bednarz. 2012. Components of spatial thinking: Evidence from a spatial thinking ability test. Journal of Geography 111 (1):15–26. doi: 10.1080/00221341.2011.583262.
- Lynch, K., B. Bednarz, J. Boxall, L. Chalmers, D. France, and J. Kesby. 2008. E-learning for geography’s teaching and learning spaces. Journal of Geography in Higher Education 32 (1):135–49. doi: 10.1080/03098260701731694.
- Madden, J., S. Pandita, J. P. Schuldt, B. Kim, A. S. Won, and N. G. Holmes. 2020. Ready student one: Exploring the predictors of student learning in virtual reality. Plos One 15 (3):e0229788–26. doi: 10.1371/journal.pone.0229788.
- Marsh, M., R. Golledge, and S. E. Battersby. 2007. Geospatial concept understanding and recognition in G6–college students: A preliminary argument for minimal GIS. Annals of the Association of American Geographers 97 (4):696–712. doi: 10.1111/j.1467-8306.2007.00578.x.
- Martin, D. G. 2003. Observing metropolitan Atlanta, Georgia: Using an urban field study to enhance student experiences and instructor knowledge in urban geography. Journal of Geography 102 (1):35–41. doi: 10.1080/00221340308978518.
- Martis, K. C. 2005. Representation of Appalachia in North American Geography College textbooks. Journal of Geography 104 (2):85–92. doi: 10.1080/00221340508978620.
- McDaniel, P. N. 2020. Across this land: A regional geography of the United States and Canada, Second Edition, by John C. Hudson (review). Southeastern Geographer 60 (4):362–5. doi: 10.1353/sgo.2020.0031.
- Mercer, T. G., A. P. Kythreotis, J. Harwood, Z. P. Robinson, S. M. George, D. Sands, J. M. Brown, and T. Sims. 2022. The benefits of virtual fieldtrips for future-proofing geography teaching and learning. Journal of Geography in Higher Education 1–9. doi: 10.1080/03098265.2022.2041569.
- Mercier, O. R, and A. Rata. 2017. Drawing the line with Google Earth: The place of digital mapping outside of geography. Journal of Geography in Higher Education 41 (1):75–93. doi: 10.1080/03098265.2016.1260097.
- Mitchell, J. T, and D. Hance. 2014. Map skills, ocean currents, pollution, and … a rubber duck? The Geography Teacher 11 (3):108–15. doi: 10.1080/19338341.2014.945609.
- Molden, O. C. 2020. Short take: Story-mapping experiences. Field Methods 32 (2):131–9. doi: 10.1177/1525822X19877381.
- Mossa, J. 2014. Capstone portfolios and geography student learning outcomes. Journal of Geography in Higher Education 38 (4):571–81. doi: 10.1080/03098265.2014.958659.
- Nagel, C. 2018. Southern exceptionalism and the Perils of Region. The Professional Geographer 70 (4):678–86. doi: 10.1080/00330124.2018.1455521.
- Oberle, A. 2020. Advancing students’ abilities through the geo-inquiry process. Journal of Geography 119 (2):43–54. doi: 10.1080/00221341.2019.1698641.
- Patterson, L. M, and V. Slinger-Friedman. 2012. Writing in undergraduate geography classes: Faculty challenges and rewards. Journal of Geography 111 (5):184–93. doi: 10.1080/00221341.2011.617833.
- Patterson, T. 2020. Google Earth. In Geographies of the Internet, ed. B. Warf. London: Routledge.
- Patterson, T. C. 2007. Google Earth as a (not just) geography education tool. Journal of Geography 106 (4):4: 145–152. doi: 10.1080/00221340701678032.
- Porter, S, and P. Umbach. 2006. Student survey response rates across institutions: Why do they vary? Research in Higher Education 47 (2):229–47. doi: 10.1007/s11162-005-8887-1.
- Ratinen, I, and T. Keinonen. 2011. Student-teachers’ use of Google Earth in problem-based geology learning. International Research in Geographical and Environmental Education 20 (4):345–58. doi: 10.1080/10382046.2011.619811.
- Sauer, C. 1956. The education of a geographer. Annals of the Association of American Geographers 46 (3):287–99. doi: 10.1111/j.1467-8306.1956.tb01510.x.
- Schuch, J., S. B. Harden, K. Bostick, and H. Smith. 2018. Museums engaging diverse millennials in community dialogue. Museums & Social Issues 13 (2):58–77. doi: 10.1080/15596893.2018.1610648.
- Schultz, R. B. 2012. A critical examination of the teaching methodologies pertaining to distance learning in geographic education: Andragogy in an adult online certificate program. Review of International Geographical Education Online 2 (1):45–60.
- Schultz, R. B, and M. N. DeMers. 2020. Transitioning from emergency remote learning to deep online learning experiences in geography education. Journal of Geography 119 (5):142–6. doi: 10.1080/00221341.2020.1813791.
- Schultz, R. B., J. J. Kerski, and T. C. Patterson. 2008. The use of virtual globes as a spatial teaching tool with suggestions for metadata standards. Journal of Geography 107 (1):27–34. doi: 10.1080/00221340802049844.
- Schumann, R. L, and J. L. Tunks. 2020. Teaching social responsibility and geographic literacy through a course on social vulnerability in disasters. Journal of Geography in Higher Education 44 (1):142–59. doi: 10.1080/03098265.2019.1697654.
- Shannon, J., K. B. Hankins, T. Shelton, A. J. Bosse, D. Scott, D. Block, H. Fischer, L. E. Eaves, J.-K. Jung, J. Robinson, et al. 2021. Community geography: Toward a disciplinary framework. Progress in Human Geography 45 (5):1147–68. doi: 10.1177/0309132520961468.
- Siebeneck, L. K., R. L. Schumann, and B. Kuenanz. 2019. GIS applications in emergency management: infusing geographic literacy in the classroom. Journal of Emergency Management (Weston, Mass.) 17 (2):119–35.
- Slinger-Friedman, V. 2018. Using active and applied pedagogies to develop sustainably minded citizens in geography. In Environment and Pedagogy in Higher Education, Ed. L. Viakinnou-Brinson. Lanham, MD: Lexington Books.
- Slinger-Friedman, V, and L. M. Patterson. 2012. Writing in geography: Student attitudes and assessment. Journal of Geography in Higher Education 36 (2):179–95. doi: 10.1080/03098265.2011.599369.
- Stainfield, J., P. Fisher, B. Ford, and M. Solem. 2000. International virtual field trips: A new direction? Journal of Geography in Higher Education 24 (2):255–62. doi: 10.1080/713677387.
- Stephenson, J. J., M. T. Harper, and E. Klump. 2019. Google Maps as a transformational learning tool in the study abroad experience. Journal of Global Initiatives 14 (1):96–117.
- Tuan, Y.-F. 1975. Place: An experiential perspective. Geographical Review 65 (2):151–65. doi: 10.2307/213970.
- Wang, Y.-H, and C.-M. Chen. 2013. GIS education in Taiwanese senior high schools: A national survey among geography teachers. Journal of Geography 112 (2):75–84. doi: 10.1080/00221341.2011.637227.
- Xiang, X, and Y. Liu. 2017. Understanding ‘change’ through spatial thinking using Google Earth in secondary geography. Journal of Computer Assisted Learning 33 (1):65–78. doi: 10.1111/jcal.12166.
- Zhu, L., X. Pan, and G. Gao. 2016. Assessing place location knowledge using a virtual globe. Journal of Geography 115 (2):72–80. doi: 10.1080/00221341.2015.1043930.
Appendix A.
Online survey instrument
Semester and Year you completed this Geography of North America course (i.e., Spring 2021 or Summer 2021)?
Prior to this course on the Geography of North America, how would you describe the level of your personal knowledge about the geography of North America? -Response Options: Extremely familiar; Very familiar; Moderately familiar; Slightly familiar; Not familiar at all.
Prior to this course on the Geography of North America, how would you describe the level of your personal knowledge about using Google Earth? -Response Options: Extremely familiar; Very familiar; Moderately familiar; Slightly familiar; Not familiar at all.
Now, after completed this course, how would you describe the impact of using Google Earth on your understanding of the Geography of North America? -Response Options: Extremely impactful; Very impactful; Moderately impactful; Slightly impactful; Not impactful at all.
Considering your use of Google Earth in this course on the Geography of North America, rate how it increased your general understanding of the geography of North America? -Response Options: A great deal; A lot; A moderate amount; A little; None at all.
To what extent did your use of Google Earth change your understanding about the geography of North America? -Response Options: A great deal; A lot; A moderate amount; A little; None at all.
In previous sections of Geography of North America, a traditional research "term paper" was the major project for the semester. In this section of this course, the Google Earth Projects replaced a traditional "term paper" as the major semester project. Now having completed this semester, if you were to take this course again, what sort of major semester project would be your preference? -Response Options: Traditional research “term paper”; Google Earth Project; ArcGIS StoryMap; No Preference; Other (please specify).
Before this course on the Geography of North America, were you previously involved with geography or geospatial science courses? -Yes (briefly describe) _____; -No.
As a result of this course and using Google Earth, how likely are you to engage with or participate in additional geography and geospatial science related opportunities? -Response Options: Extremely likely; Somewhat likely; Neither likely nor unlikely; Somewhat unlikely; Extremely unlikely.
In previous sections of Geography of North America, a traditional research "term paper" was the major project for the semester. In this section of this course, the Google Earth Projects replaced a traditional "term paper" as the major semester project. How did the use of Google Earth Projects in this course advance your understanding of the geography of North America in ways that perhaps may be different from a traditional "term paper"?
Through using Google Earth in this course on the geography of North America, what is something you learned about that you were not previously aware of?
What did you like most about using Google Earth in this course on the geography of North America?
What could be improved upon for future use of Google Earth in a course on the geography of North America or in other geography courses?
What is the most important take-away from your use of Google Earth in this course?
Additional comments, suggestions, feedback on using Google Earth Projects in this or future geography courses?
What is your major/degree program? _____. In addition to your major, what is your minor or certificate program (if applicable)? _____.
Your Age: _____.
Your Gender: _____.
Describe your Race or Ethnicity: _____.