
Abstract
A better understanding of differences in the nature of human computer interaction (HCI) relating to GIS software can help with learning spatial concepts and spatial thinking skills. This motivates our study, which aims to create a standard measure of interaction with GIS software that can be used individually or along with existing measurement instruments for spatial thinking to generalize results across studies for evaluating GIS interaction and usability. The study developed a composite taxonomy identifying types of user interactions and strategies with GIS in relation to different spatial concepts and processes of reasoning. The taxonomy was used as a framework to create tasks which users can complete with GIS software as a measure interaction with GIS. Study data were collected from 35 students enrolled in an online undergraduate course covering fundamentals of geographic information science and technology. Following three course assignments using GIS software to demonstrate a range of spatial concepts for problem solving, students completed various tasks constituting the standard measure of GIS interaction. The results indicate that the standard measure succeeds in measuring how individuals interact with GIS and strategize to complete different spatial tasks. The standard measure of GIS interaction will be useful for the development of usability guidelines for GIS and further contributes to research in the acquisition and application of spatial concepts and reasoning in learning environments.
Introduction
Spatial abilities are important in everyday life activities such as tool use and navigation and are considered a cognitive predictor of interest and success in science, technology, engineering and math (STEM) disciplines (Uttal and Cohen Citation2012). Much progress has been made in identifying the link between STEM success and small scale spatial abilities such as mental rotation of objects, but spatial abilities relating to larger scales, such as our surrounding environment, are also important to consider when investigating the relation between STEM learning and spatial skills (Nazareth et al. Citation2019). Specific spatial abilities relating to cognitive processes of map reading have also been identified (Sun, Lu, and Wang Citation2020). Spatial scanning, which is the process of inspecting spatial representations of information for key features, has resulted in gains in spatial cognition as well as mediating improvement in non-spatial reasoning (Cortes et al. Citation2022). While less work has focused on studies of the large-scale spatial abilities of navigation in real world environments due to difficulties with designing and controlling experiments in the field, the use of virtual navigation tools has enabled more understanding in this area (Blacker et al. Citation2017).
Tools such as Geographic Information Systems (GIS) have been identified as useful in improving small-scale spatial abilities (Lee Citation2006) and large-scale spatial abilities such as navigational competence in the real world (Nazareth et al. Citation2019). GIS has often been identified as a tool that enables better understanding spatial concepts from the broader perspective of spatial thinking (National Research Council (NRC) Citation2006; Tsou and Yanow Citation2010; Goodchild Citation2011; Bearman et al. Citation2016). Jant et al. (Citation2020) define STEM-relevant spatial thinking as “a tendency to think about problems and data in spatial terms and to know how to apply spatial approaches to solve complex, everyday science and engineering problems.” Significant research has already accumulated indicating GIS and related geospatial tools like Google Earth can improve some aspects of spatial thinking from 5th grade through higher education (Vincent Citation2006; Madsen and Rump Citation2012; Kim and Bednarz Citation2013; Metoyer and Bednarz Citation2017; Jo, Hong, and Verma Citation2016; Britz and Webb Citation2016; Jadallah et al. Citation2017; Jant et al. Citation2020). However, Metoyer and Bednarz (Citation2017) note that it should not be assumed that geospatial technologies like Google Earth and GIS will improve spatial thinking or content knowledge without paying explicit attention to how spatial-thinking strategies are supported by these tools and also investigating how the tools enable geographic inquiry.
Baker et al. (Citation2015) identified the need to break down research questions pertaining to spatial thinking to address individual differences such as age, gender, prior experience, scale dependencies and many other factors. We hypothesize that one of the “many other factors” relating to spatial thinking may be individual differences in how people interact with GIS, since GIS software is unique in the way it uses data in relation to locations in space and time, which results in greater complexity during reasoning about and analyzing the data (Raubal Citation2018). The field of visual analytics, which also involves complex computational techniques to extract insights from voluminous datasets, recognizes not only the importance of the software interface (particularly the visual component for manipulating and interpreting charts and maps) but also the value of studying human interaction with that interface (Pike et al. Citation2009). Specific to GIS, Madsen and Rump (Citation2012) found that students approached learning to use GIS in a variety of ways, including individual differences in interacting with GIS software. These differences may have a significant effect on learning how to think spatially.
In order to perform empirical research on different ways users interact with GIS and their relationship to spatial thinking, there is a need for validated instruments for measuring differences (Baker et al. Citation2015). Measurement instruments are needed to compare results across a range of settings and populations. Such instruments are also needed to differentiate between students’ ability to use GIS software correctly and their ability to think geospatially, since there is a high probability that GIS software cannot be used successfully without critical understanding of appropriate methods of use (Baker et al. Citation2015). Several standardized measures of spatial thinking have been developed such as the Spatial Thinking Ability Test (STAT) (Lee and Bednarz Citation2012) and an inventory of “spatial habits of mind” (Kim and Bednarz Citation2013). A measure of critical spatial thinking (Kim and Bednarz Citation2013) and a measure specific to geospatial thinking (Huynh and Sharpe Citation2013) have also been developed. However, a measurement instrument does not yet exist for identifying individual differences in interaction with GIS with respect to spatial thinking.
Our study addresses this research question: how can individual differences in interaction with GIS software be measured in a manner that is generalizable across different studies and contexts? Addressing this question will help us study how individual differences in interaction with GIS are related to initial spatial abilities and spatial thinking and/or have an impact on spatial skill improvement. A standardized measure of GIS interaction can provide a better understanding of other individual factors relating to GIS interaction such as level of experience, learning style, and differences as a result of the look and feel of software interfaces and integrated functionality. This will provide useful insights for many stakeholders including students and professionals learning and using GIS; educators in how they teach GIS and incorporate it as course tool; designers in developing more usable GIS interfaces; and managers in how they integrate GIS and related geospatial technologies into work flows and decision making (Bone and Johnson Citation2007).
Methods
Standardized measurement instruments typically fall into two types: tests and self-assessment questionnaires. Tests often use multiple choice questions since free response questions are more difficult to standardize; self-assessment questionnaires often use scales to provide more standardized results. However, standardized measures rarely capture the processes through which the transformation of geospatial knowledge is applied in a GIS environment (Huynh Citation2009). Furthermore, many standardized tests are designed to isolate and assess specific skills or small sets of skills and as such are deliberately de-contextualized (Uttal and Cohen Citation2012). In contrast, GIS is used in specific application contexts such as natural resource management and disease mapping. In order to address these issues, development of the instrument for measuring GIS interaction was based on research from the field of human computer interaction (HCI), specifically studies of user strategy and usability with respect to GIS usage. The term usability is defined by the International Standardization Organization (ISO) as the extent to which a product can be used by users to achieve specified goals with effectiveness, efficiency and satisfaction in a specified context of use (Unrau and Kray Citation2019).
Usability studies are usually performed in specific application contexts (e.g., crime analysis) with study participants completing a specific subset of GIS tasks. This lack of consistency in tasks across application contexts makes it difficult to compare insights across studies or generalize usability or user experience (UX) guidelines (Roth and MacEachren Citation2016). The development of taxonomies or classifications of interactions improves generalizability by identifying and naming elements of interaction. For instance, Roth and MacEachren developed a taxonomy of interaction for geovisualization and used this taxonomy to assess interaction strategies. We followed a similar methodology in our study, broken down into the following steps: (1) development of a taxonomy of GIS interaction; (2) design of hands-on GIS tasks based on the taxonomy; (3) a pilot study to refine the tasks; and (4) evaluation of the tasks in a formal study with measures of usability and interaction. While not covered in this article, an additional planned step, following successful evaluation, is to measure GIS interactions of a larger set of participants along with measures of initial spatial abilities (both small-scale and large-scale) to determine what correlations may exist between initial spatial abilities and interactions with GIS.
Development of a taxonomy of GIS interaction
In developing a taxonomy for GIS interaction, we incorporated three different types of interaction primitives, which are descriptions of the smallest structural components of the interaction process (Roth and MacEachren Citation2016). The three types of interaction primitives are user objectives (e.g., identify, compare, rank), operators (generic kinds of functionality, such as zooming, panning, filtering, etc.) and operands (what part of the data within the interface were acted upon).
Spatial thinking is composed of three elements: concepts of space, tools of representation (e.g., maps, graphs), and processes of reasoning (National Research Council (NRC) Citation2006). Marsh, Golledge, and Battersby (Citation2007) recommend that spatial concepts should be ordered from basic spatial primitives, to more abstract and complex concepts. The most basic spatial primitives are those associated with occurrences: identity of the occurrence, location of the occurrence, magnitude of the occurrence, and time or time range of the occurrence. For two or more occurrences there are first order spatial concepts describing relationships between occurrences: distance, direction, boundary, sequence, connection, shape. More complex second and third order spatial concepts include enclosure, adjacency, angle, classification, buffer, connectivity and scale and the most complex fourth order concepts include interpolation, map projections, subjective space and virtual reality (Marsh, Golledge, and Battersby Citation2007; Jo, Bednarz, and Metoyer Citation2010). The objectives used as the basis for a measure of GIS interaction should cover all primitive and first order spatial concepts. The measure of GIS interaction should also use a selection of higher order concepts typically covered in introductory GIS courses, including analytical operations and methods and issues in cartography and visualization (AP® GIS&T Study Group Citation2018). For an example of higher order spatial concepts in cartography and visualization, classification is an important concept since choices in data classification can modify the social and political message of maps (Manson et al. Citation2014). shows the spatial concepts included in the composite interaction taxonomy, though it should be noted this is not an exhaustive list and additional concepts can be added.
Table 1. A composite taxonomy of interactions for GIS.
In addition to spatial concepts, the objectives defined in a taxonomy of GIS interaction integrate the two other components of spatial thinking: tools of representation and processes of reasoning. A taxonomy of spatial thinking has been developed to expand on Bloom’s taxonomy as a framework for developing questions and tasks which guide students to more sophisticated, higher-order cognitive processing (Jo, Bednarz, and Metoyer Citation2010). This taxonomy of spatial thinking is based on 31 spatial concepts, three levels of cognitive processing, and use or nonuse of tools of representation. shows how the objectives of the composite taxonomy of GIS interactions are based on spatial concepts, processes of reasoning and tools of representation (e.g., maps, tables, and graphs) from the spatial thinking taxonomy.
Roth and MacEachren (Citation2016) taxonomy of interaction for geovisualization included 12 operators, or generic kinds of functionality. All 12 operators identified for geovisualization also apply to GIS, with hundreds of other operators also available in professional GIS software packages. While research has been undertaken to define taxonomies of tasks and functions of GIS (Albrecht and Davies Citation2010), the large number of operators provided by most GIS software and the great breadth of tasks that can be performed with the software would be too comprehensive for a single measure. We provide a list categorized by the subsystems of a GIS as defined by Marble and Peuquet (Citation1983): input and preprocessing, analysis, and visualization and output. Instead of exhaustively listing all GIS operators, general functions of GIS are listed; for instance proximity functions include operators like buffer, near, and creating Thiessen areas.
Roth and MacEachren’s (Citation2016) taxonomy identified three operands, or parts of the data and interface that are acted upon as a user interacts with geovisualization software. These include when the user acts upon the geospatial component (locations and geometry on a map); when the user interacts with the attribute component of the data as it is linked to geographic component; and when the user interacts with the temporal component of the data to understand how the geographic and attribute components of the data change over time. In addition to these three, lists data types and components of data that GIS software is usually capable of processing.
Specific tasks for interaction studies can be developed by selecting element(s) from each of the three objectives columns in , any element(s) from the operator columns and any element(s) from the operand column. Objectives for tasks should reflect different combinations of complexity by selecting from lower and higher order elements.
Design of hands-on GIS tasks based on the taxonomy of GIS interaction
An interaction study is where participants complete a set of benchmark tasks with a specific software in a controlled setting (Roth and MacEachren Citation2016). Defining these tasks is thus a crucial step in measuring interaction based on user strategies (Ingensand and Golay Citation2010) and for evaluating usability (Tobon Citation2005). In professional and scientific settings where GIS software are used, defining the domain of GIS tasks for GIS is difficult because tasks are wide ranging and the level of technical expertise required by the user to complete the different tasks is varied (Haklay, Skarlatidou, and Tobon Citation2010). Research pertaining to learning GIS indicates that “students must have an in-depth understanding of the [spatial] concepts implicit within the analysis the tool performs in order to use GIS effectively” (Marsh, Golledge, and Battersby Citation2007, 697). Using the interaction taxonomy in , we designed six tasks using GIS to demonstrate spatial concepts that could be completed within the time frame of an hour. The six tasks focus on a specific subset of GIS operators that can be used to learn all lower order spatial concepts and a selection of higher order concepts. The tasks also include a representative selection of lower and higher order processes of reasoning, a selection of ten operators, and five of the eight operands ().
Table 2. Tasks developed for the measure of GIS interaction, selected from the composite taxonomy of interactions for GIS.
The level of difficulty of the six tasks ranged from simple to complex. For instance, the simplest task in , designated as “Sequence,” involves two low order spatial concepts (identity and magnitude), one low order process of reasoning (sequence), common preprocessing and visualization operators with no inputs (sort and view table and map), and no analysis operators. The next task, designated as “Identify” is slightly more complex, using three low order spatial concepts, one low order process of reasoning, common preprocessing and visualization operators with simple inputs, and no analysis operators. The “Select” task uses two low order spatial concepts, higher order reasoning, and a preprocessing operator with complex inputs requiring expression building, but no analysis operators. The “Summarize” task uses two higher order spatial concepts, two higher order processes of reasoning, and one analysis operator with complex inputs. The “Analyze” task uses two higher order spatial concepts, two higher order processes of reasoning, and two analysis operators with complex inputs that must be performed in the correct order. The sixth and final task, “Classify,” is similar to “Analyze” in terms of complexity but tests different higher order spatial concepts, including map projections and two visualization operators with complex inputs. Many other types of tasks can be developed from different combinations of objectives, operators and operands to measure interaction with different aspects GIS functionality.
The combination of objectives and operators from simple to complex allowed us to test the following hypothesis: as tasks increase in complexity, interactions and user strategies will involve more actions overall, as well as more incorrect or exploratory actions. Here, “actions” refer to any time the computer mouse or keyboard was used to interact with the interface with a specific intent. For instance, clicking on a feature on the map to identify data in a popup window is considered one action; clicking on a different feature using the same operator is considered a separate action. While clicking on many features to find the answer may not be the most efficient way to arrive at an answer, it is possible to complete a task correctly using this method. Correct actions were defined as any actions contributing to correct completion of the task. Incorrect actions were defined as executing incorrect operators that could not lead to the correct answer, or executing correct operators but using incorrect inputs to the operators. Exploratory actions are defined as anytime a user clicks on an operator but does not execute it, a common strategy used to find out more about the operator and its inputs to see if it might accomplish an objective. Quantifying these different types of actions is common procedure for evaluating user strategies (Davies and Medyckyj-Scott Citation1995; Ingensand and Golay Citation2010; Pohl, Wiltner, and Miksch Citation2010).
Different combinations of objectives and operators for these tasks also allowed us to test a second hypothesis: as GIS tasks increase in complexity in terms of spatial concepts and processes of reasoning, interactions and user strategies will involve a greater variation (diversity) of operators. Diversity of operators used is the proportion of actions using each operator to the total actions using all operators for each task. The absolute value of summed diversity is divided by the maximum possible diversity to create a diversity index, where the closer the index is to 1, the higher the diversity.
Usability studies have shown that actions of a GIS user and the operators they use in a given application context vary depending on the type of GIS software used: for instance professional, desktop-based GIS software has different interface designs than web-based GIS interfaces (Unrau and Kray Citation2019). Furthermore, dealing with large amounts of information through complex interaction steps contributes to cognitive load for GIS users (Bunch and Lloyd Citation2006), therefore usability in terms of effectiveness, efficiency and satisfaction are included as part of the measure of GIS interaction to evaluate the usability of the tasks with respect to the type of GIS software interface used. Usability measures were also included as part of the measure of GIS interaction in order to correlate these measures with measures of spatial abilities in future studies.
Pilot study
Participants in a pilot study to refine the preliminary measure of GIS interaction were 15 students taking an introductory course in geographic information science and technology (GIST) at the University of Wyoming in the fall 2019 semester. Several course assignments required the use of GIS software to demonstrate spatial concepts and to develop technical skills and spatial reasoning skills. Students were given the choice of using either ArcGIS Pro or ArcGIS Online at the beginning of the semester for assignments. The course also included a summative assignment using GIS to apply these concepts at the end of the semester. The six tasks defined in could be used for this assessment since earlier activities and assignments in the class involved using operators for addressing similar tasks, for instance building query statements, choosing appropriate symbols for the type of data, and using several analysis operators.
Students filled out four surveys (included in the supplemental material) at the beginning of the class to assess their prior experience with mapping and GIS software and to evaluate their spatial thinking prior to instruction on spatial thinking. Students willing to have the results of their surveys and assignments used for the study were asked to read and sign a consent form, understanding that their consent or lack of consent did not in any way affect their activities, performance or grades in the course. The entire methodology, including the surveys, assignments and the consent form were approved by the University of Wyoming’s Institutional Review Board.
Wording of the tasks was adjusted for clarification based on feedback from the participants and to make the tasks generic enough to be completed with any GIS software; all tasks were tested using ArcMap, QGIS, ArcGIS Pro and ArcGIS Online, though only the latter two were used by participants. Ordering of the tasks was also refined based on observation of students during the fall 2019 semester; order of tasks alternated between simple and complex tasks.
The tasks developed for the measure of GIS interaction use geospatial data and scenarios that reflect different contexts in terms of location, extent and scale and domain of application. Feedback from the 15 participants in the fall 2019 confirmed that the specific examples of geospatial data and scenarios were helpful in understanding the spatial concepts demonstrated in the GIS software assignments.
Evaluate the tasks in a formal study with measures of usability and interaction
After refinements to the six tasks comprising the measurement instrument for GIS interaction in the pilot study, 18 students in the spring 2020 semester volunteered to participate in the formal interaction study, signed a consent form, and completed all the surveys and assignments. Students completed three assignments using GIS to apply various spatial concepts, approximately 3 wk apart, during the semester. The GIS tasks used for the three formative assignments, along with the spatial concepts demonstrated and GIS functions used, are included in the supplemental material to this article. Students were allowed to choose to use either ArcGIS Online (classic version) and ArcGIS Pro (version 2.5) for these assignments. Though both ArcGIS Online and ArcGIS Pro are made by the same company, ESRI, they are well suited for comparing differences in user interaction because they have similar functionality but significant differences in interface design. ArcGIS Online was developed with a web-based interface and for a more general user group, and ArcGIS Pro was developed for a desktop environment and incorporates more advanced geospatial tools for a more specific user group of professionals.
At the end of the semester, students completed the six tasks used as a measure of GIS interaction within a one-hour time frame with their choice of ArcGIS Online or ArcGIS Pro software. Since the course was delivered online, the measure was administered via a one-on-one web conference using screen sharing technology. Interactions with GIS software were captured using screen recording technology available through Zoom web conferencing software. Before starting the tasks, a researcher explained the procedure from a script. In order to make sure students completed all six tasks, they were not provided with the next task until the current task was completed or a 10 minute limit per task was reached. For each task, after the first three minutes the students were allowed to ask for help since seeking help is acceptable and often necessary step in learning and using GIS software. Timing was paused if technical issues came up. A researcher was present in the web conference to provide instructions, timing, and help.
After participants completed the six tasks, they also filled out a self-assessment with Likert-type scales as a usability measure of satisfaction, along with several open ended questions about their experience with the assignment (included in the supplemental material). Screen recordings were reviewed to collect the following data: correct or incorrect completion of each tasks as a usability measure of effectiveness; time taken to complete each task as a usability measure of efficiency; and number and type of actions taken to complete each task as measures of interaction.
Results
Measures of usability
Results from usability measures indicated that the six GIS tasks are usable in terms of effectiveness, efficiency and satisfaction for both type of GIS software, ArcGIS Online (12 participants) and ArcGIS Pro (6 participants). Measures of effectiveness were determined by correct completion of each task. For the 12 participants using ArcGIS Online, 81% of the tasks were correctly completed and for the 6 participants using ArcGIS Pro, 86% of the tasks were correctly completed. The Sequence and Identify tasks, both of which use lower processes of reasoning and lower spatial concepts than the other four tasks, had 100% correct completions. Tasks with the next percentage correct (88%) were the middle task in terms of complexity, the Select and Summarize tasks. Of the two most complex tasks, the Analyze task was completed correctly by 78% of the participants but the Classify task was completed correctly by only 39% of the participants. However, 85% of the participants completed at least one part of this task correctly but still got an incorrect answer if one part was completed incorrectly. To avoid this issue in the future when administering this measure, we split this task into three tasks: evaluating the map projection as one task, calculating population density and choosing an appropriate map symbolization method as a separate task, and evaluating histograms and spatial patterns to select the optimal classification as a separate task.
The average time to complete each task was 4.8 min (well within the allocated time of 10 min), with a range from 1.7 min for the Identify task to 7.1 min for Analyze task. This indicates participants had sufficient time and inclination to explore and try different options for completing the tasks.
Likert type statements for all 18 participants had medians of 4 to 5 (where 1 corresponds to lowest agreement and 5 corresponds to highest agreement with statements like “I am satisfied with the process I used to answer the questions”). High levels of satisfaction in the self-assessments were also indicated from answers to open-ended questions about what students liked most and least about the six tasks using GIS, suggested changes to the assignment, and why they chose to use either ArcGIS Online or ArcGIS Pro. Details pertaining to the validity and internal consistency of the self-assessment and results for each of the measures of usability by task are provided in tables in the supplemental materials.
Suitable usability as determined with these results provides validity to the results of measures of interaction and user strategies detailed in the next section.
Measures of interaction: First hypothesis (increase in task complexity results in increased number of actions)
Twelve of the 18 students chose to complete the tasks using ArcGIS Online and six students chose to complete the tasks using ArcGIS Pro. shows a summary of different types of actions for the six tasks completed by 18 participants. The results confirm the first hypothesis. The simplest tasks, Sequence and Identify, had much lower average number of total actions, 2.1 and 2.6, than the more complex Select and Summarize tasks, with 6.9 and 7.1 average total actions. The most complex tasks, Analyze and Classify, at the highest averages of total actions, 7.5 and 8.
Table 3. A summary of actions by average action type (correct, incorrect, exploratory), average unique action and diversity of actions for the six tasks that participants completed for the measure of GIS interaction.
Also confirming the first hypothesis, the more complex tasks had higher numbers of incorrect actions. The most complex task, Classify, had the highest average number of incorrect actions for both types of GIS software. However, this pattern was not repeated with the exploratory actions. The Select task (in the middle in terms of complexity) had the highest number of exploratory actions, 6.5, compared to a range of 0 to 3.2 exploratory actions for the other five tasks, indicating that increasing complexity of tasks does not always correspond to an increase in exploratory actions. Since the average number of exploratory actions for the Select task was 6 for ArcGIS Online but 10 for ArcGIS Pro, the design of the user interface may be a contributing factor to these types of actions.
Measures of interaction: Second hypothesis (increase in task complexity results in increased diversity of operators)
The results in show that greater diversity in operators did not correspond to tasks with greater complexity in operators. The Select task had the highest diversity of operators (0.92), but the more complex Summarize, Analyze and Classify tasks had lower diversity (0.72, 0.85 and 0.85 respectively.) The simplest task, Sequence, had a higher diversity of operators (0.79) than the much more complex Summarize task (0.72). The diversity of operators used may be more specific to software design than to user strategy. For instance, both ArcGIS Online and ArcGIS Pro offer multiple ways to select data: users can use a filter operator, a select attribute operator, or a more time intensive but acceptable method of sorting the values and scrolling through the table to get the correct answer, all of which were strategies used by participants, resulting in the highest diversity for this task.
For all tasks except the simplest one (Identify), ArcGIS Pro users used a greater diversity of operators, corresponding to the greater number of operators available with professional software versus free online software. Both ArcGIS Online and ArcGIS Pro users had the same average number of correct actions for the simplest tasks, Sequence and Identify. However, ArcGIS Online users had higher average correct actions for Summarize and Classify and ArcGIS Pro users had higher average correct actions for Select and Analyze, indicating potentially different user strategies based on software for these more complex tasks. ArcGIS Online users had higher average exploratory actions for the Select and Classify tasks; ArcGIS Pro users had higher average exploratory actions for the Analyze task. Comparing different types of actions (correct, incorrect, exploratory) shows variability within tasks as well as between tasks, another potential indicator of different user strategies based on software. More results specific to user strategies are detailed in the next section.
Measures of interaction: User strategies
Detailed analysis of actions by type for each individual (included as tables in the supplemental materials) allowed the identification of five different user strategies employed by all participants. shows these five different strategy types for each participant and how often they were used while completing the six tasks. Confident strategy types are indicated by participants who completed a task with mostly correct actions and no more than one exploratory or incorrect action, or the occasional case where a participant decided on an incorrect method immediately with assumed confidence that it was the correct method. Corrector strategy types are those with a higher ratio of incorrect actions to exploratory actions. Explorers are those with a higher ratio of exploratory actions to incorrect actions. Uncertain strategy types are indicated by a mix of exploratory and incorrect actions and also asking for help. Unique strategy types are identified by correct completion of a task using a unique operator that was not used by anyone else.
Figure 1. Individual strategy types and how often they were used while completing the six tasks.
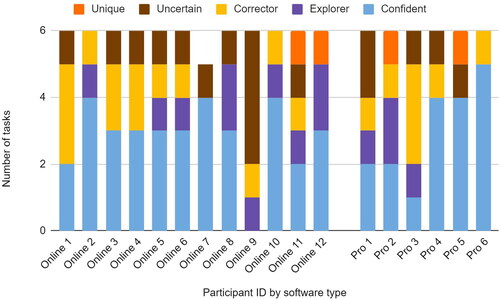
All participants employed at least three different strategies across the six tasks. Three participants employed four of the five strategies. The most common strategy type was Confident (17 out of 18 participants for at least one task). The Corrector and the Uncertain type were the next common type (13 out of 18). Eleven participants exhibited the Explorer strategy type at least once. Only four participants exhibited the Unique strategy type: two ArcGIS Online users and two ArcGIS Pro users. Participant 6 (ArcGIS Pro) in indicated having prior experience using ArcGIS software in the survey at the beginning of the semester. This participant also exhibited the highest number of Confidant user strategies for 5 of the 6 tasks, which reflects well-established conclusions from prior research that differences in problem-solving styles are distinctly different based on experience and command of geospatial knowledge (Huynh Citation2009).
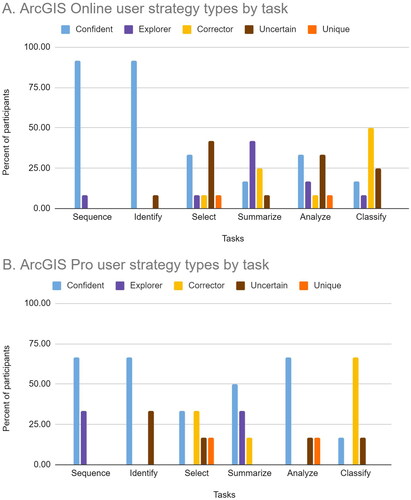
shows the same five user strategy types summarized by task for ArcGIS Online users (A) and ArcGIS Pro users (B). Results provide evidence in support of the first hypothesis, since only two of the five strategy types were used for the two simplest tasks, Sequence and Identify, with three or more user strategy types exhibited with the more complex tasks. All five strategies were adopted by ArcGIS Online users for the Select and Analyze tasks. Variation in strategy types for ArcGIS Online and ArcGIS Pro users indicates that the type of software interface affects user strategies. The Summarize task in particular is a good example of different strategy types. shows the most Explorer types for the Summarize task for ArcGIS Online users; but ArcGIS Pro users showed more Confident types for this task. These results may be due to the Summarize operator being immediately visible in the default ArcGIS Pro analysis pane, whereas locating the same operator in ArcGIS Online requires expanding several areas within the analysis pane.
Figure 2. Five user strategy types summarized by task for ArcGIS Online users (A) and ArcGIS Pro users (B).
Discussion
The effective use of GIS in promoting spatial thinking depends on many factors including our ability to understand the technology, not just its benefits and shortcomings but also its relation to specific spatial abilities. This requires breaking down aspects of using GIS into specific measureable interactions and as well as breaking down aspects of GIS tasks into spatial concepts, cognitive processes, and operators and their inputs involved in these tasks. The results of this study reflect a range of complexity and variety in individual differences in interaction with two different types of GIS software. Of six tasks participants completed using GIS software, the two most complex tasks (in terms of spatial concepts, cognitive reasoning and operator inputs) had the highest number of incorrect actions for both desktop GIS software and web-based GIS software, but not the highest number of exploratory actions. In fact, a medium-complexity task had the highest number of exploratory actions, indicating that increasing complexity of tasks does not always correspond to an increase in exploratory actions, with evidence that the design of the user interface may be a contributing factor these differences. Differences in design of user interface may also be a contributing factor to the results with tasks that involve less complex cognitive reasoning and spatial concepts, like the Sequence and Select tasks, where users tried a wider range of operators than they tried with the more complex Summarize, Analyze and Classify tasks. The diversity of operators available in the software results in different actions and total number of actions by users to complete tasks. Therefore, the measure of GIS interaction provides quantifiable information about how users interact with GIS and the different strategies they use, both within groups using the same GIS software and between groups using different GIS software.
The number of participants for this study was too small to make any specific conclusions about individual differences in GIS interaction, but descriptive statistics provide strong evidence that the measure developed for this study was successful in measuring individual differences in GIS interaction in relation to different spatial concepts. Therefore, the measure is now being used in a multiyear study with over 100 participants to determine if there are statistically significant individual differences in how users interact with GIS software and in relation to small-scale and large-scale spatial abilities. The development of this measure is published separately since it can be used for related studies with GIS software, in the same way that the development of the Spatial Thinking Ability Test (Lee and Bednarz Citation2012) has since been used as an instrument in multiple research projects to measure spatial thinking ability abilities (Jo and Hong Citation2018; Collins Citation2018; Bednarz and Lee Citation2019).
Educator and practitioner benefits
Because this measure was developed to provide results that are generalizable across studies, the measure of GIS interaction will benefit GIST educators and professionals in several ways. First, it is currently being used to better understand how using GIS in contributes to strengthening STEM-relevant spatial thinking. Individual differences in the strategy that students use in interacting with GIS software could be a significant predictor of improvement in spatial skills. Focused interactions with GIS functions like map overlay could potentially promote the use of strategies important for cognitive mapping and consequently spatial navigation and other large-scale spatial skills. For instance, results from a study of students at the secondary school level participating in two semesters of a geospatial curriculum showed improvement in small-scale spatial tasks like mental rotation, large-scale spatial tasks like spatial scanning, and evidence of a “spatial habits of mind” approach to problems (Cortes et al. Citation2022). At the undergraduate level, Nazareth et al. (Citation2019) found that over the course of an academic semester, novice GIS students improved at a faster rate than non-STEM undergraduates in both large-scale and small-scale spatial skills. Use of this measure of GIS interaction in subsequent studies can provide a means to break down which kinds of interaction with GIS software, in terms of specific actions and strategies, are related to spatial skill improvements.
GIS courses offered at the university level are far more diverse than at the secondary level. Madsen and Rump (Citation2012) found that 81% of questions in GIS assisted courses focused on technical questions pertaining to the use of the software rather than geographical or spatial concepts. Thus, an introductory GIS course may not assist in spatial skill development unless followed by more advanced GIS courses. The measure of GIS interaction can be used in studies comparing different teaching and learning methods, such as courses that focus more on technical GIS software skills (“learning about GIS” courses) versus courses that focus on the application of GIS in different disciplines for subject-specific inquiry and problem-based learning (“learning with GIS” courses) (Schulze Citation2021). The measure can also be used to evaluate different GIS software as pedagogical tools, such as for demonstrating spatial concepts and spatial reasoning.
Both professional GIS software and web-based GIS software offer multiple ways to answer questions but with differences in interface design. For instance, the analysis functions in the ArcGIS Online interface are organized in part by spatial concepts such as proximity or spatial pattern. Because the taxonomy for measuring GIS interaction incorporates spatial concepts in addition to GIS functions, future studies using this taxonomy can explore if software organized by spatial concepts helps GIS users translate their analysis goals into abstract workflow concepts. Possible correlations with other factors such as differences in learning styles and differences in age, gender or other demographics can also be explored with relation to individual differences in GIS interaction in order to maximize the effectiveness and usability of GIS software for different individuals both in educational and professional contexts.
Limitations and future research
Several limitations with this study are related to data collection methods. Due to constraints with how the university course was taught, data collection could not be developed to test for statistical significance in group differences between ArcGIS Pro and ArcGIS Online users. The course allowed users to choose which software they wanted to use, and twice as many students chose the web-based ArcGIS Online than the desktop version, ArcGIS Pro. Students were limited to only two choices, with both options being from the same software company without additional options such as open source software. The participants included some students in their first or second year in college and some students with three or more years in college, and one student had prior experience with GIS software. Future studies should involve data collection for both group and individual differences in some or all of these factors, including the use of additional GIS software.
The time-consuming nature of collecting data from screen recordings is a considerable issue in measuring interactions with GIS, especially when students were given up to an hour to complete the six tasks. Future studies could consider other methods of data collection such as automatic data capture. Unrau and Kray (Citation2020) found that data collected automatically via an instrumented web GIS software provides many advantages.
The six tasks comprising the measure of GIS interaction were evaluated with only one interaction study; because of the wide range of factors potentially contributing to how users interact with GIS software, additional interaction studies should be developed to further evaluate this methodology. For instance, another interaction study using different selections from the taxonomy of GIS interaction and different domains would lend additional insight, especially considering the great range of data management, analytical and visualization options afforded by GIS software. Future interaction studies can be expanded to explore more of the seven stages of interaction (Roth and MacEachren Citation2016) including goal-forming, intention, and perception; this study focused on the action stage and did not include a framework for understanding mental models based on a user’s prior experience, existing knowledge, and preconceptions about tasks (Albrecht and Davies Citation2010).
In addition to workflow strategies, a better understanding of problem solving while using GIS is also needed: how users formulate, visualize, and process spatial problems from beginning to end and at conceptual, semantic and syntactic cognitive levels (Vincent Citation2006). The biggest problem with investigating cognitive issues in a real context is the number of factors influencing performance which cannot be controlled (Davies and Medyckyj-Scott Citation1995), but we hope to demonstrate that using a standardized measure of GIS interaction, based on tasks developed from a taxonomy, can mitigate this problem.
Supplemental Material
Download MS Word (1.3 MB)Data availability statement
The data that support the findings of this study are available at the University of Wyoming digital repository for research and data, WyoScholar (https://wyoscholar.uwyo.edu/) under the collection titled “Exploring links between STEM success and spatial skills.”
Disclosure statement
No potential conflict of interest was reported by the authors.
Additional information
Funding
Notes on contributors
Margo E. Berendsen
Margo E. Berendsen is a Research Scientist and educator at the Wyoming Geographic Information Science Center at the University of Wyoming. Her research interests include active learning and spatial thinking using GIS, digital story mapping and place-based learning to increase student engagement.
Paddington Hodza
Paddington Hodza is a Senior Research Scientist at the Wyoming Geographic Information Science Center at the University of Wyoming. Much of his work and research interests include multimodal GIS education, spatial data science, drone technology, and participatory geographic information science and technology.
Jeffrey D. Hamerlinck
Jeffrey D. Hamerlinck is a Senior Research Scientist and Director of the Wyoming Geographic Information Science Center at the University of Wyoming. His research interests include all aspects of spatial data infrastructure design and implementation, including technology adoption and use and foundational information literacy and technology fluency user requirements.
References
- Albrecht, J., and C. Davies. 2010. Application planning. In Interacting with geospatial technologies, ed. M. M. Haklay, 127–43. London: John Wiley & Sons.
- AP® GIS&T Study Group. 2018. Bridging high school and introductory undergraduate courses in geographic information science and technology. Journal of Geography 117 (4):165–73. doi: 10.1080/00221341.2017.1407816.
- Baker, T. R., S. Battersby, S. W. Bednarz, A. M. Bodzin, B. Kolvoord, S. Moore, D. Sinton, and D. Uttal. 2015. A research agenda for geospatial technologies and learning. Journal of Geography 114 (3):118–30. doi: 10.1080/00221341.2014.950684.
- Bearman, N., N. Jones, I. André, H. A. Cachinho, and M. DeMers. 2016. The future role of GIS education in creating critical spatial thinkers. Journal of Geography in Higher Education 40 (3):394–408. doi: 10.1080/03098265.2016.1144729.
- Bednarz, R. S., and J. Lee. 2019. What improves spatial thinking? Evidence from the spatial thinking abilities test. International Research in Geographical and Environmental Education 28 (4):262–80. doi: 10.1080/10382046.2019.1626124.
- Blacker, K. J., S. M. Weisberg, N. S. Newcombe, and S. M. Courtney. 2017. Keeping track of where we are: Spatial working memory in navigation. Visual Cognition 25 (7–8):691–702. doi: 10.1080/13506285.2017.1322652.
- Bone, T., and D. Johnson. 2007. Human factors in GIS use: A review and suggestions for research. Paper presented at Proc ISECON v24, Pittsburgh, PA.
- Britz, H. W., and P. Webb. 2016. The effect of an intervention using GIS-generated geo-spatial data on the promotion of spatial cognition and spatial perspective taking in grade 11 learners. South African Geographical Journal 98 (1):182–93. doi: 10.1080/03736245.2014.977815.
- Bunch, R. L., and R. E. Lloyd. 2006. The cognitive load of geographic information. The Professional Geographer 58 (2):209–20. doi: 10.1111/j.1467-9272.2006.00527.x.
- Collins, L. 2018. The impact of paper versus digital map technology on students’ spatial thinking skill acquisition. Journal of Geography 117 (4):137–52. doi: 10.1080/00221341.2017.1374990.
- Cortes, R. A., E. G. Peterson, D. J. Kraemer, R. A. Kolvoord, D. H. Uttal, N. Dinh, A. B. Weinberger, R. J. Daker, I. M. Lyons, D. Goldman, et al. 2022. Transfer from spatial education to verbal reasoning and prediction of transfer from learning-related neural change. Science Advances 8 (32):eabo3555. doi: 10.1126/sciadv.abo3555.
- Davies, C., and D. Medyckyj-Scott. 1995. Feet on the ground: Studying user-GIS interaction in the workplace. In Cognitive aspects of human-computer interaction for Geographic Information Systems Vol. 83, ed. T.L. Nyerges, 123–41. Dordrecht: Springer Science & Business Media.
- Goodchild, M. F. 2011. Spatial thinking and the GIS user interface. Procedia – Social and Behavioral Sciences 21:3–9. doi: 10.1016/j.sbspro.2011.07.002.
- Haklay, M. M., A. Skarlatidou, and C. Tobon. 2010. Usability Engineering. In Interacting with geospatial technologies, ed. M. M. Haklay, 107–23. London: John Wiley & Sons.
- Huynh, N. T., and B. Sharpe. 2013. An assessment instrument to measure geospatial thinking expertise. Journal of Geography 112 (1):3–17. doi: 10.1080/00221341.2012.682227.
- Huynh, N. T. 2009. The role of geospatial thinking and geographic skills in effective problem solving with GIS: K-16 education. Dissertation, Wilfrid Laurier University.
- Ingensand, J., and F. Golay. 2010. Task-oriented usability evaluation of a WebGIS for a real-world community. URISA Journal 22 (1):41–53.
- Jadallah, M., A. M. Hund, J. Thayn, J. G. Studebaker, Z. J. Roman, and E. Kirby. 2017. Integrating geospatial technologies in fifth-grade curriculum: Impact on spatial ability and map-analysis skills. Journal of Geography 116 (4):139–51. doi: 10.1080/00221341.2017.1285339.
- Jant, E. A., D. H. Uttal, R. Kolvoord, K. James, and C. Msall. 2020. Defining and measuring the influences of GIS-Based instruction on students’ STEM-relevant reasoning. Journal of Geography 119 (1):22–31. doi: 10.1080/00221341.2019.1676819.
- Jo, I., S. Bednarz, and S. Metoyer. 2010. Selecting and designing questions to facilitate spatial thinking. The Geography Teacher 7 (2):49–55. doi: 10.1080/19338341.2010.510779.
- Jo, I., and J. E. Hong. 2018. Geography education, spatial thinking, and geospatial technologies: Introduction to the special issue. International Journal of Geospatial and Environmental Research 5 (3):1.
- Jo, I., J. E. Hong, and K. Verma. 2016. Facilitating spatial thinking in world geography using Web-based GIS. Journal of Geography in Higher Education 40 (3):442–59. doi: 10.1080/03098265.2016.1150439.
- Kim, M., and R. Bednarz. 2013. Development of critical spatial thinking through GIS learning. Journal of Geography in Higher Education 37 (3):350–66. doi: 10.1080/03098265.2013.769091.
- Kim, M., and R. Bednarz. 2013. Effects of a GIS course on self-assessment of spatial habits of mind (SHOM). Journal of Geography 112 (4):165–77. doi: 10.1080/00221341.2012.684356.
- Lee, J., and R. Bednarz. 2012. Components of spatial thinking: Evidence from a spatial thinking ability test. Journal of Geography 111 (1):15–26. doi: 10.1080/00221341.2011.583262.
- Lee, J. W. 2006. Effect of GIS learning on spatial ability. Dissertation, Texas A&M University.
- Madsen, L. M., and C. Rump. 2012. Considerations of how to study learning processes when students use GIS as an instrument for developing spatial thinking skills. Journal of Geography in Higher Education 36 (1):97–116. doi: 10.1080/03098265.2011.576336.
- Manson, S., J. Shannon, S. Eria, S. Kne, L. Dyke, K. S. Nelson, L. Batra, D. Bonsal, M. Kernik, J. Immich, et al. 2014. Resource needs and pedagogical value of web mapping for spatial thinking. Journal of Geography 113 (3):107–17. doi: 10.1080/00221341.2013.790915.
- Marble, D. F., and D. J. Peuquet. 1983. Geographic information systems and remote sensing. In Manual of remote sensing, ed. R.N. Colwell, vol. 1, 2nd ed., 923–58. Falls Church, VA: American Society of Photogrammetry.
- Marsh, M., R. Golledge, and S. E. Battersby. 2007. Geospatial concept understanding and recognition in G6–college students: A preliminary argument for minimal GIS. Annals of the Association of American Geographers 97 (4):696–712. doi: 10.1111/j.1467-8306.2007.00578.x.
- Metoyer, S., and R. Bednarz. 2017. Spatial thinking assists geographic thinking: Evidence from a study exploring the effects of geospatial technology. Journal of Geography 116 (1):20–33. doi: 10.1080/00221341.2016.1175495.
- Nazareth, A., N. S. Newcombe, T. F. Shipley, M. Velazquez, and S. M. Weisberg. 2019. Beyond small-scale spatial skills: Navigation skills and geoscience education. Cognitive Research: Principles and Implications 4 (1):17. doi: 10.1186/s41235-019-0167-2.
- National Research Council (NRC). 2006. Learning to think spatially. Washington, DC: The National Academies Press.
- Pike, W. A., J. Stasko, R. Chang, and T. A. O’Connell. 2009. The science of interaction. Information Visualization 8 (4):263–74. doi: 10.1057/ivs.2009.22.
- Pohl, M., S. Wiltner, and S. Miksch. 2010. Exploring information visualization: Describing different interaction patterns. In Proceedings of the 3rd BELIV'10 Workshop: Beyond time and errors: Novel evaluation methods for information visualization, 16–23. Atlanta, GA: ACM Press.
- Raubal, M. 2018. Cognition and geographic information technologies. In Handbook of behavioral and cognitive geography, ed. D.R. Montello, 197–210. Cheltenham, UK: Edward Elgar Publishing.
- Roth, R. E., and A. M. MacEachren. 2016. Geovisual analytics and the science of interaction: An empirical interaction study. Cartography and Geographic Information Science 43 (1):30–54. doi: 10.1080/15230406.2015.1021714.
- Schulze, U. 2021. “GIS works!”—But why, how, and for whom? Findings from a systematic review. Transactions in GIS 25 (2):768–804. doi: 10.1111/tgis.12704.
- Sun, Y., X. Lu, X, and Y. Wang. 2020. Using eye tracking to explore differences between high and low map-based spatial ability. Journal of Geography 119 (6):215–25. doi: 10.1080/00221341.2020.1810301.
- Tobon, C. 2005. Evaluating geographic visualization tools and methods: An approach and experiment based upon user tasks. In Exploring geovisualization, eds. J. Dykes, A. MacEachren and M.J. Kraak, 645–66. Oxford: Elsevier.
- Tsou, M. H., and K. Yanow. 2010. Enhancing general education with geographic information science and spatial literacy. Journal of the Urban and Regional Information Systems Association 22 (2):45–54.
- Unrau, R., and C. Kray. 2019. Usability evaluation for geographic information systems: A systematic literature review. International Journal of Geographical Information Science 33 (4):645–65. doi: 10.1080/13658816.2018.1554813.
- Unrau, R., and C. Kray. 2020. Enhancing usability evaluation of web-based geographic information systems (WebGIS) with visual analytics. In 11th International Conference on Geographic Information Science (GIScience 2021)-Part I, eds. Janowicz K. and J.A. Verstegen, 15:1–15. Germany: Leibniz International Proceedings in Informatics Schloss Dagstuhl. n.d. Leibniz-Zentrum für Informatik, Dagstuhl Publishing.
- Uttal, D. H., and C. A. Cohen. 2012. Spatial thinking and STEM education: When, why, and how? In The psychology of learning and motivation, ed. B.H. Ross, 57: 147–82. Waltham, MA: Academic Press.
- Vincent, P. C. 2006. Using cognitive measures to predict the achievement of students enrolled in an introductory course of geographic information system. Dissertation, Texas A&M University.